· web viewadvances in digital signal processing hardware and algorithms have led to the...
TRANSCRIPT
APT REPORT ON APPLICATION OF DIGITAL SIGNAL PROCESSING TECHNOLOGY IN SPECTRUM MONITORING
No. APT/AWG/REP-64Edition: February 2016
Adopted by
19th Meeting of APT Wireless Group2 – 5 February 2016
Chiang Mai, Thailand
(Source: AWG-19/OUT-24Rev.1)
APT/AWG/REP-64
APT REPORT ON APPLICATION OF DIGITAL SIGNAL PROCESSING TECHNOLOGY IN SPECTRUM MONITORING
Introduction
Advances in digital signal processing hardware and algorithms have led to the development of modern spectrum monitoring instruments and systems, such as weak signal detection system and modulation recognition systems which identify modulation types in real-time.
During AWG-14 meeting held in Bangkok, Thailand in March 2013, sub working group on spectrum monitoring agreed to develop a working document toward a preliminary draft new APT Report on application of digital signal processing technology in spectrum monitoring based on Annex 1 of AWG-13/TMP-19 and Annex 3 of AWG-13/TMP-20. It was updated in AWG-18 and AWG-19 meetings to amend the main body and add new annex 3 based on the contributions from the APT members.
This document collects information on these instruments or systems which utilize digital signal processing algorithms to increase system function or capacities. This Report could provide guidance to APT member states in establishing new monitoring facilities to fulfil the goal of national spectrum monitoring.
Page 2 of 22

APT/AWG/REP-64
PRELIMINARY DRAFT NEW APT REPORT ON APPLICATION OF DIGITAL SIGNAL PROCESSING TECHNOLOGY
1 Introduction and Scope
The emerging use of improved spectrum utilization techniques and new technologies, such as digitization of radiocommunications, mobile broadband applications and cognitive radio, are required to meet the increasing spectrum demand for the ever-expanding variety of ICT services and applications.
The spectrum efficiency are increased with the reduce of transmission power of radio station and equipment, spectrum re-use in a regular patterns of area and more and more complex modulation scheme, which have made spectrum monitoring one of the critical issues. Regulators need to modernization spectrum monitoring systems to have the flexibility to cope with the new environment.
Advancements in digital signal processing (DSP) hardware and algorithms have led to the development of modern spectrum monitoring instruments and systems, such as weak signal detection system and modulation recognition systems which identify modulation types in real-time.
This Report consolidates information on the case studies to integrate the DSP techniques into the radio monitoring equipment and system to expand its capabilities and functionalities to monitor the wireless environment for known and unknown RF signals. It could provide technical guidance to APT member states to research and development of spectrum monitoring and direction finding system in an efficient way.
Page 3 of 22

APT/AWG/REP-64
ANNEX 1THE APPLICATION OF THE INDEPENDENT COMPONENT ANALYSIS
METHOD TO INTERFERENCE SIGNAL SEPARATION IN RADIO MONITORING
1 Introduction
- Recently, due to the advances in the wireless communication technology, the society has become one in which wireless communication is closely integrated with the daily lives of people. Along with this, the importance is increasing of the radio monitoring of maintaining the electromagnetic environment in which it is possible to use electromagnetic waves effectively.
- The radio monitoring equipment will have to have their functions and technology of monitoring follow the advances in the wireless communication systems in order to monitor the electromagnetic environment.
- In recent years, digitalization of wireless communication systems has progressed, and in addition to the conventional direction finding, the importance has increased of the utilization of the measuring equipment for the identification and characteristic analysis of digital communication signals.
- Although it was possible to calculate the direction for each individual signal even in interference cases using the multiple source direction finding algorithms (e.g., MUSIC), it was not possible to analyze only the target signal using measuring equipment because the signals have not been separated.
- The Independent Component analysis (ICA) method makes it possible to separate the respective independent signals even when there is interference. Therefore, after the interference waves and the desired waves are separated, it is possible to input only the interference wave to the conventional measuring equipment and is effective for efficiently carrying out signal characterization and identification.
- Further, the ICA method can also be used as an application for automatically detecting interference. By incorporating this method into the automatic monitoring processing, it is effective for reducing the work load on the personnel, and speedy the progress of detection of interference.
- This annex introduces the results of evaluation of the ICA method using an experimental test bed.
2 Evaluation
2.1 Details of Tests
- A signal comprising an interference wave superimposed on a desired signal was transmitted as the test signal, which was then received by an array antenna. The received signal was first A/D converted and then the ICA processing was carried out. By obtaining the difference between the estimated power ratio (DURest) of the desired wave and the interference wave which were separated by ICA processing and the set electric power ratio (DUR) of the test signal, the DUR estimation accuracy was evaluated.
Power ratio of the test signal (DUR) = (Desired Signal Power) / (Undesired Signal power)
Page 4 of 22

APT/AWG/REP-64
Estimated power ratio after ICA processing (DURest)
= (Desired Signal Power) / (Undesired Signal power)
DUR estimation accuracy (A) = DURest DUR
- As viewed from the array antenna, the arrival direction of the desired wave is kept fixed, the arrival direction of the interference wave is changed from 5º to 180º, and the change in the DUR estimation accuracy due to changes in DUR for each arrival angle were evaluated.
- Fig. 1-1 shows a system diagram of the evaluation test.
Fig 1-1 System diagram of evaluation test
2.2 Test Results
- A constellation diagram of the received signal before ICA processing and the desired wave and interference wave separated by ICA processing is shown in Fig. 1-2.1. Further, the measured results of the DUR estimation accuracy in the case of the desired wave /4 QPSK and the interference wave FM are shown in Fig. 1-2.2.
- In the range of DUR = 15 to +10dB, it is possible to estimate DUR of the interference signal within an accuracy of less than 2 dB.
- With the same procedure as this test, we carried out a test in the case of the test signal comprising the desired wave AM and the interference wave FM. Although there was some slight difference in the results, results showed on the whole a similar trend and similar results.
- With the same procedure as this test, the results of carrying out tests for antenna aperture diameters showed the trend that the range of DUR, which can be measured, becomes wider towards larger aperture diameters.
Page 5 of 22
Receiver A/D ICAprocess
Desired Signal Power (D)
Undesired Signal Power (U)
:
Array antenna
Desired Signal (D)
Undesired Signal (U)
/4 QPSK CNR = 20 dB2450 MHzFixed (0°)
FM CNR = 40 to 0 dB (DUR = 20 to +20 dB)2450 MHz Transmit at 5, 10, 30, 60, 90, 120, 150, 180° point
CNR= Carrier to Noise Ratio = (Carrier power) / (Noise power)DUR= Desired signal to Undesired signal Ratio = (Desired signal power) / (Undesired signal power)

Received Signal
Desired Signal(/4 QPSK)
Undesired Signal(FM)
Signal Separationby ICA
-10-8-6
-4-2024
68
10
-25 -20 -15 -10 -5 0 5 10 15 20 25DUR [dB]設定
DUR
[dB]
推定誤差
DUR of test signal [dB]
Accuracy of D
UR
estimation [dB
]
APT/AWG/REP-64
Fig 1-2.1 Constellation diagram of signals separated by ICA
Fig 1-2.2 Accuracy of DUR estimation
2.3 Application for interference detection
- As shown in the results of evaluating the ICA method, this method can estimate DUR with a high accuracy from the signal power ratio after separation. Therefore, it is possible to monitor quantitatively and with appropriate timing in actual situations of weak levels of interference in which there is no significant degradation in the communication quality, and in rarely occurring actual cases of interference.
Page 6 of 22

APT/AWG/REP-64
- In more specific terms, in a general digital wireless system, even when there is an interference of about DUR = 10 dB, by the use of error correction codes, the user does not notice that interference has occurred. Because of quantitatively estimating the DUR using the ICA method, it is considered possible to take countermeasures before a significant degradation occurs in the communication quality.
- As shown in Fig 1-2.2, in this method, in the range of DUR = 15 to +10 dB, since it is possible to measure the signal level with an accuracy of ±2 dB, within this DUR range, it is expected to be possible to detect the presence of an interference with a good accuracy.
- By setting the threshold value for detecting the presence of an interference by referring to the C/N (= DUR) required by the communication system of the desired wave, it is possible to output an alarm or make a record automatically in synchronization with the interference detection timing.
3 Conclusion
- While the support of analysis using measuring equipment is effective for identifying digital communication waves, it is not possible to carry out sufficient analysis for the interference signal. The ICA method can separate the interference signal into a desired wave and an undesired wave, and it could be considered as one effective method for the analysis of digital radio waves from now on.
- The evaluation was done only for samples of interference signals between some modulation methods. In order to use this method for actual radio monitoring work, it is necessary to carry out evaluation using various types of interference signals, evaluation based on differences in the antenna shapes, and evaluation that includes the effect of propagation in actual environment.
Page 7 of 22
APT/AWG/REP-64
ANNEX 2TECHNIQUES ON DETECTION OF WEAK SIGNALS
1 Introduction
The detection of weak signals is, in many cases, a difficult problem for spectrum monitoring engineers. For example, the propagation of ground wave in the HF band is influenced by shelter effect of buildings in the urban area, thus making it difficult to be detected. To locate a ground interference earth station, we have no other option but to perform a ground search using portable or mobile monitoring equipment by measuring the side-lobes signals from the terrestrial direction. However, the monitoring range of interference earth station is limited, especially in the city, because the gain of the side-lobe of the earth station antenna is much lower than the gain of the main-lobe which pointed to the satellite on the GSO arc.
To address this difficulty, some DSP techniques were developed and integrated into radio monitoring equipment to detect weak-signals, measure their parameters or even to identify the user. In some cases, these mature and state-of-the-art techniques could improve the sensitivity of the monitoring system to detect the weak-signal even when the C/N is negative, which is significant to the monitoring staff to eliminate these illicit transmitters before they could cause harmful interference to the space stations.
2 Basic principles to detect weak-signals
It is difficult to detect the interference signals which is lower than the noise floor using traditional monitoring techniques and equipment. The main goal and key task for detection of weak-signal is to extract and capture the weak signal from another signal which is much stronger and to improve the value of C/N for receiver output.
Several possible methods for the detection of weak-signals are available, e.g. locked-in amplifier (LIA), sampled integration and adaptive noise cancelling (ANC). In this annex, the correlation-based technique was introduced followed by a case of its application.
2.1 Correlation-based measurement
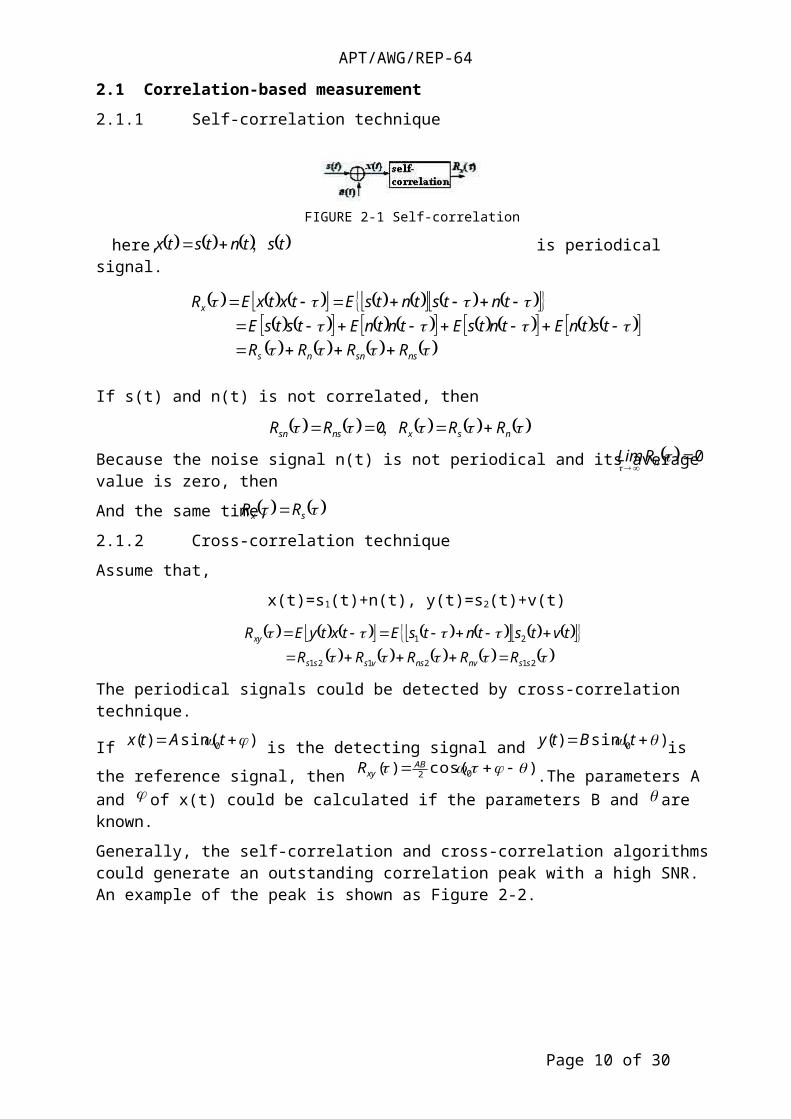
2.1.1 Self-correlation technique
FIGURE 2-1 Self-correlation
here, is periodical signal.
If s(t) and n(t) is not correlated, then
Because the noise signal n(t) is not periodical and its average value is zero, then
And the same time,
Page 8 of 22
tstntstx ,
nssnns
x
RRRRtstnEtntsEtntnEtstsE
tntstntsEtxtxER
nsxnssn RRRRR ,0 0
nRLim
sx RR

APT/AWG/REP-64
2.1.2 Cross-correlation technique
Assume that,
x(t)=s1(t)+n(t), y(t)=s2(t)+v(t)
The periodical signals could be detected by cross-correlation technique.
If )sin()( 0 tAtx is the detecting signal and )sin()( 0 tBty is the reference signal,
then )cos()( 02 ABxyR .The parameters A and of x(t) could be calculated if the
parameters B and are known.
Generally, the self-correlation and cross-correlation algorithms could generate an outstanding correlation peak with a high SNR. An example of the peak is shown as Figure 2-2.
FIGURE 2-2 An example of correlation peak
3 Case of application
3.1 Cross-correlation to detect the signal in the direction of side-lobes of earth station antenna
On many occasions, the earth station interfered GSO satellite could be located by the transmitter location system, in which signals received from the interfered satellite and adjacent satellite are calculated using the TDOA and FDOA algorithm, within an elliptical area which covers tens of square kilometers. To locate and identify these earth station on the ground is a problem to radio monitoring organizations in many countries or administrations.
The weak-signals transmitted by side-lobes of earth station antenna could be detected by monitoring equipment utilizing cross-correlation technique, which improve the sensitivity of the monitoring system, installed on the monitoring vehicles. A diagram showing the scenario is in Figure 2-3.
Page 9 of 22
212121
21
ssnvnsvsss
xy
RRRRR
tvtstntsEtxtyER
APT/AWG/REP-64
Transmitter
Satellite
LNA
SA
Paraboloid Antenna
Horn Antenna
LNA
DSP Module
FIGURE 2-3 the principle diagram of detecting weak-signal transmitted in the direction of side-lobes
In this system, correlation algorithms are utilized in a DSP module to process satellite downlink signal received by parabolic antenna, and signal in the direction of side-lobes of earth station antenna received by directional antennas (horn antenna or isotropic antenna) simultaneously.
The process diagram in the DSP module is described below in Figure 2-4:
Signal from satellite
Signal from transmitter
downlink
uplink
Lband DC
Lband DC
LbandBase band DC
LbandBase band DC
Base band A/D
Base band A/D
Correlation Algorithms
Display result
GPS
FIGURE 2-4 the process diagram in DSP module
In the correlation approach, the complex ambiguity function based on second-order statistics (CAF-SOS) algorithm is used to simultaneously estimate the time-delay of arrival and frequency-delay of arrival of signals from satellite and ground transmitter.
The correlation SNR can be described as below:
21
21
12
SNRSNRSNRSNRBTSNR
Here,
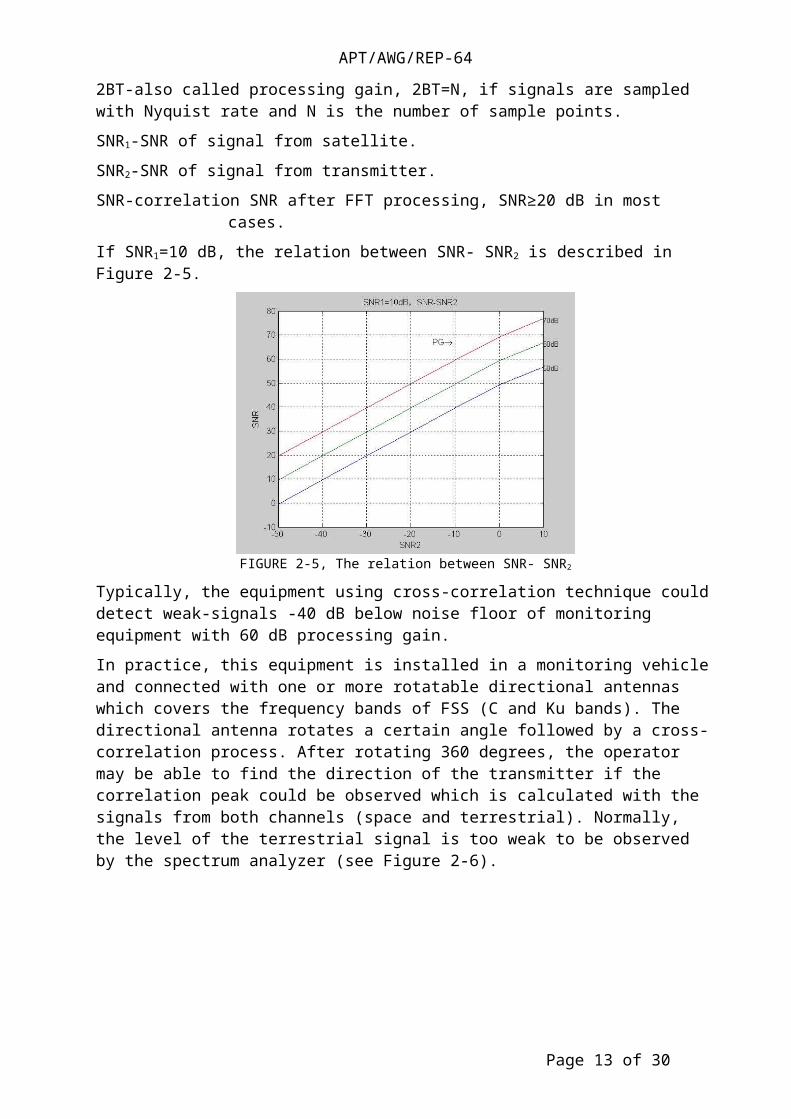
2BT-also called processing gain, 2BT=N, if signals are sampled with Nyquist rate and N is the number of sample points.
SNR1-SNR of signal from satellite.
SNR2-SNR of signal from transmitter.
SNR-correlation SNR after FFT processing, SNR≥20 dB in most cases.
If SNR1=10 dB, the relation between SNR- SNR2 is described in Figure 2-5.
Page 10 of 22

APT/AWG/REP-64
FIGURE 2-5, The relation between SNR- SNR2
Typically, the equipment using cross-correlation technique could detect weak-signals -40 dB below noise floor of monitoring equipment with 60 dB processing gain.
In practice, this equipment is installed in a monitoring vehicle and connected with one or more rotatable directional antennas which covers the frequency bands of FSS (C and Ku bands). The directional antenna rotates a certain angle followed by a cross-correlation process. After rotating 360 degrees, the operator may be able to find the direction of the transmitter if the correlation peak could be observed which is calculated with the signals from both channels (space and terrestrial). Normally, the level of the terrestrial signal is too weak to be observed by the spectrum analyzer (see Figure 2-6).
FIGURE 6 The peak-angle graph
4 Summary
Different techniques, such as the application of locked-in amplifier (LIA), sampled integration technique, self-correlation and cross-correlation techniques and adaptive noise cancelling (ANC) technique could be applied to improve the sensitivity of spectrum monitoring system to facilitate the detection of weak-signals. A case study utilized cross-correlation technique was shown in this document.
Page 11 of 22

APT/AWG/REP-64
Annex 3
APPLICATION OF AMPLITUDE PROBABILITY DISTRIBUTION SIGNAL PROCESSING TECHNIQUE TO RADIO MONITORING
1. Introduction
With the progress of digitalization of radio in recent years, users are becoming less aware of interference because they do not recognize minor interference thanks to error correction technologies. Often, users don’t notice any interference until it becomes so strong that communication is completely disrupted. With conventional analogue radio communication systems, users were able to detect the presence of interference at an early stage due to noise and other signs occurring in the demodulated sound, whereas early detection is difficult with digital radio.
If communication is completely blocked in important radio communications such as police or disaster prevention radio that are used to protect people’s lives and security, the resulting damage could be serious. Therefore it is very important to detect interference, identify the interference source, and stop the emission of interfering signals before communication is disrupted.
The Amplitude Probability Distribution (APD) technique introduced in this document was originally developed to quantify electromagnetic noise. By applying this technique to radio monitoring, interference of a minor level undetectable by human sense can be automatically and quantitatively detected. Thus, we can start monitoring to identify the location of the source and stop emission of the interfering signal before serious damage is caused by disruption of communication.
The following shows the results of effectiveness evaluation of applying this APD technique to radio monitoring.
2. Overview of APD signal processing technique
APD is an evaluation method based on statistics of signal amplitude. With the general shift in the communication environment moving from analogue to digital communication, APD is attracting increasing attention in recent years because it has a high correlation with bit error rate, an important indicator of communication quality in digital communication.
APD is defined as “the time rate the signal envelope exceeds a certain threshold.” Where the signal amplitude is a random variable, the time that the signal envelope exceeds threshold “xk”is “Wi”, and the total measurement time is “T”, the discrete amplitude probability distribution “APD (xk)” can be expressed by Equation 2-1 (refer to Figure 3-1).
T
xWxAPD
kxn
j kj
k
)(
1)(
)( (Equation 3-1)
Page 12 of 22
APT/AWG/REP-64
振幅
閾値レベル
振幅
閾値レベル
Figure 3-1 Definition of statistical parameters of the signal envelope
APD can be described as a graph with the noise envelope threshold level kx on the horizontal
axis (x-axis) and the amplitude probability distribution )( kxAPD on the vertical (y-axis). This graph is generally referred to as the APD curve. APD curves show different characteristics depending on the difference in the radio system of the interfering signal as well as the radio environment. The changes in amplitude is determined by the radio system, and the APD curve is described by the amplitude assigned to each symbol and the trajectory changing between the symbols. Therefore the shape of the APD curve is different depending on the modulation type. Figure 3-2 shows APD curves by different modulation types.
1e-005
0.0001
0.001
0.01
0.1
1
-25 -20 -15 -10 -5 0
Cum
ulat
ive
AP
D
Amplitude
APD
FM AM
GMSK QPSK
pi/4 shift QPSK
Figure 3-2 APD curve by different modulation types (Signal-noise ratio: 20dB)
Page 13 of 22
FMAM
GMSK
QPSK
pi/4 shift QPSK
[dB]
TimeTotal Measurement Time
Am
plitu
de
Thre
shol
d Le
vel

APT/AWG/REP-64
It is effective to use the amplitude histogram (the differential of the APD curve) as the characteristic quantity, as a technique to extract more detailed characteristics of the APD curve by radio system. The amplitude histogram shows the time probability density by different amplitudes, expressed by Equation 2-2. Since it is highly sensitive to property changes, detection sensitivity can be improved for minor changes in amplitude. Figure 3-3 shows histograms by different modulation types.
histogram( xk )=∑j=1
n( x k ) W j( xk+1 )−W j( xk )
T ( xk+1−xk ) (Equation 3-2)
1e-005
0.0001
0.001
0.01
0.1
1
-25 -20 -15 -10 -5 0
Am
plitu
de H
isto
gram
Amplitude
Amplitude Histogram
FM AM
GMSK QPSK
pi/4 shift QPSK
Figure 3-3 Amplitude histogram property by different modulation types (Signal-noise ratio: 20dB)
3. Application of APD signal processing technique to radio monitoring equipment
With the transition of various analogue radio applications to digital radio systems, radio monitoring equipment are also required to respond to the digitalization of radiocommunication systems. However, monitoring of complex digital radio systems is far more demanding than monitoring analogue radio, because it requires demodulation processing according to the modulation format of the unlicensed or interfering radio station, and it is also difficult to synchronize in a timely manner. Moreover, within digital radio systems, it is difficult to detect any interference because of error correction technologies incorporated in the system, making users unable to recognize the interference until communication is completely disrupted, and thereby aggravating the damage caused by the interference.
In view of this situation, amplitude histograms based on APD signal processing may be very useful in detecting weak interference signals. Because APD histograms are highly sensitive to changes in the signal, it shows significant changes in the presence of any signals interfering with the desired signal. The presence of interference can be easily detected by comparing the shape of the APD histogram with that of the normal state without any interference.
Interference can be detected by the following method using APD signal processing technique.
First, calculate the histogram from the waveform of the received signal. Then the histogram obtained is compared against the reference histogram. The reference histogram is generated
Page 14 of 22
FM
AM
GMSK
QPSK
pi/4 shift QPSK
[dB]

APT/AWG/REP-64
from signals according to the modulation type of the desired signal. A correlation coefficient is used for comparing histograms to quantify the distance between the histograms. Compare the obtained values with the criteria for judging the presence of interfering signals. If the difference against the reference histogram is large, then it means that electromagnetic interference is occurring or some kind of signal other than the desired signal is being received.
Figure 3-3 shows the system configuration.
Figure 3-3 System configuration for detecting interference based on APD
This approach has the following advantages.
- Digital demodulation processing is unnecessary. Therefore it is unnecessary to be able to handle various types of modulation.
- Easy to implement system because processing load is relatively low and no special signal processing devices are necessary.
- Allows for real-time processing.
4. Interference detection based on APD signal processing technique
4.1 Verification of changes in the amplitude histogram caused by interfering signals
The π/4-shift QPSK modulation type used for digital fire radio was selected as an example of a digital modulation format. The desired signal was assumed to be an M-sequence signal modulated in π/4-shift QPSK format. Electromagnetic interference was simulated by mixing the desired signal with other signals modulated in FM, AM, GMSK, QPSK and π/4-shift QPSK modulation formats, respectively. A voice sample was used as the original signal before analogue modulation, while the original signal used for digital modulation was an M-sequence signal formed from an initial seed different from the one used for the desired signal. Difference of the changes in the histogram property by different desired-undesired signal (DU) ratios is obtained by changing the gain of the desired signal. The respective histogram properties for DU ratios of -20 dB, -10 dB, 0 dB, 10 dB and 20 dB are shown in Figure 3-4.
Page 15 of 22
APD histogram
APD histogram
Desired Reference
Judgment on the presence of interference
Calculation of distance/correlation
Enter waveform

APT/AWG/REP-64
1e-005
0.0001
0.001
0.01
0.1
1
-40 -30 -20 -10 0 10
Am
plitu
de H
isto
gram
Amplitude
Amplitude Histogram for pi/4 shift QPSK vs FM
DU = -20 dB DU = -10 dB
DU = 0 dB DU = 10 dB DU = 20 dB
(a) Interfering signal: FM (b) Interfering signal: AM
1e-005
0.0001
0.001
0.01
0.1
1
-40 -30 -20 -10 0 10
Am
plitu
de H
isto
gram
Amplitude
Amplitude Histogram for pi/4 shift QPSK vs GMSK
DU = -20 dB DU = -10 dB
DU = 0 dB DU = 10 dB DU = 20 dB
(c) Interfering signal: GMSK (d) Interfering signal: QPSK
1e-005
0.0001
0.001
0.01
0.1
1
-40 -30 -20 -10 0 10
Am
plitu
de H
isto
gram
Amplitude
Amplitude Histogram for pi/4 shift QPSK vs pi/4 shift QPSK
DU = -20 dB DU = -10 dB
DU = 0 dB DU = 10 dB DU = 20 dB
(e) Interfering signal: π/4-shift QPSK
Figure 3-4 Changes in amplitude histogram by DU ratio (desired signal: π/4-shift QPSK)
4.2 Evaluation of interference detection performance
Simulations were conducted to evaluate the detection rate of the interference detection algorithm based on APD and the changes in amplitude histogram property caused by interference. In the simulation, the interference detection algorithm was executed multiple (675) times to statistically evaluate the detection rate and false detection rates.
This interference detection algorithm works by calculating the correlation value between the amplitude histograms of the input signal and the reference desired signal, then comparing that value against a threshold value to determine the presence of interference. The simulation was conducted by varying the type if interfering signal, SN ratio, DU ratio and other factors to
Page 16 of 22
1e-005
0.0001
0.001
0.01
0.1
1
-40 -30 -20 -10 0 10
Am
plit
ud
e H
isto
gra
m
Amplitude
Amplitude Histogram for pi/4 shift QPSK vs AM
DU = -20 dB DU = -10 dB
DU = 0 dB DU = 10 dB DU = 20 dB
-20dB10dB
-10dB0dB
20dB -20dB10dB
-10dB
0dB20dB
-20dB10dB
-10dB0dB 20dB
-20dB10dB
-10dB0dB 20dB
-20dB10dB
-10dB0dB
20dB
[dB] [dB]
[dB] [dB]
[dB]
1e-005
0.0001
0.001
0.01
0.1
1
-40 -30 -20 -10 0 10
Am
plitu
de H
isto
gram
Amplitude
Amplitude Histogram for pi/4 shift QPSK vs QPSK
DU = -20 dB DU = -10 dB
DU = 0 dB DU = 10 dB DU = 20 dB

APT/AWG/REP-64
examine the distance variation under different conditions and evaluate the detection performance under a given threshold. The conditions of the simulation are summarized in Table 3-1 below.
Table 3-1 Simulation conditions
Controlled parameters
Modulation format of the desired signal
π/4-shift QPSK
DU ratio 10-30 [dB] (11 standard)
Uncontrolled parameters (675 combinations)
SN ratio 20-24 dBModulation format of the interfering signal
BPSK, QPSK, offset QPSK, 8-PSKGMSK, 16-QAM, 64-QAM, AM, FM
Input signal Random signals (for digital modulation)Voice signals (for analogue modulation)
The following describes the interference simulation results for when the desired signal was modulated in the π/4-shift QPSK format. Figure 3-5 shows the frequency distribution of correlation values of various DU ratios calculated by the simulation. However, the average and dispersion were obtained from the calculation results and approximated by normal distribution. The correlation here examines the degree of similarity with the reference amplitude histogram (a case without any interference), so the correlation value increases as the DU ratio increases (i.e., the interfering signal becomes relatively small), which means that the distribution shifts to the right, getting closer to the reference amplitude histogram indicated with the light yellow line on the right end of the figure. The dotted line shows the threshold necessary for the interference detection algorithm.
Figure 3-5 Correlation histogram by different DU ratios
Figure 3-5 shows the dependency of detection and false detection rates on the DU ratio when the threshold is set at 0.905.
Page 17 of 22
26dB
14dB
18dB
22dB
DU 10dB 30dB
withoutinterference
w/o
ThresholdLevel
His
togr
am
CorrelationLevel

APT/AWG/REP-64
Figure 3-5 Dependency of detection and false detection rates on the DU ratio (Desired signal: π/4-shift QPSK modulation format)
The figure shows that the detection rate is maintained at above 80% in the DU ratio range of up to approximately 20dB. Data obtained in this range is of fairly good quality, achieving sufficient detection performance for the purpose of detecting interfering signals.
5. Issues and solutions of APD signal processing technique
5.1 Operational issues related to APD signal processing technique
APD signal processing technique has proved to be effective in detecting the presence of interference as described above, but the following issues have been pointed out in applying this technique to actual radio monitoring activities.
(1) Elimination of amplitude variation due to fading
Fading occurs when the transmission radio station is moving. If the signal amplitude fluctuates due to this fading, the histogram is affected, too. This may lead to errors in the detection of interference.
(2) Preparation of the histogram used as the reference
There is need to obtain a histogram of the desired signal to use as a reference. While it is possible to generate a reference histogram by simulation if the moderation format of the desired signal is known, it would take too much man-hour to create a reference histogram for all the frequencies. There is need to develop a system for automatic generation of reference patterns.
(3) Selection of the optimal threshold for determining the presence of interference
The threshold for determining the presence of interference needs to be selected based on histograms of cases with interference. It is difficult to determine beforehand the optimal threshold for all the frequencies. On the other hand, it would take too much time to determine the threshold based on actual measurements of interference. There is need to develop a system for automatic and real-time determination of the threshold.
5.2 Solutions and evaluation of those solutions
5.2.1 Removal of amplitude variation due to fading
Page 18 of 22
Detection RatioFalse Detection Ratio80% line
Detection Ratio
False Detection Ratio
80% line
DU ratio [dB]
Det
ectio
n R
atio
,Fa
lse
Rat
io

APT/AWG/REP-64
In order to eliminate amplitude variation due to fading, it is necessary to first separate the elements of amplitude variation caused by different factors such as modulation, interference and fading.
(1) Amplitude variation due to modulation can be determined by the modulation type. Although the amplitude intensity assigned to each symbol and the change in amplitude when moving between the symbols are different by the modulation type, the rate of change in amplitude is determined by the symbol rate because variation in amplitude occurs when the symbol changes.
(2) Amplitude variation due to interference occurs because of the phase difference between the desired and interfering signals. This variation is caused by the difference in frequency between the desired and interfering signals as well as the changes in the interfering signal and the affected signal. Therefore the rate of amplitude variation is determined by the frequency difference between the desired and interfering signals as well as the symbol rate of the interfering and affected signals.
(3) Amplitude variation due to fading occurs when the radio station emitting the signal is moving or when there is change in the surrounding environment. Changes in amplitude is caused by the changes in phase difference between signals transmitted through different paths.
As explained in (1) ~ (3) above, amplitude variations due to modulation and interference occur because of the differences in symbol rates and frequencies. This means that these variations have frequency components of several tens of kHz, whereas amplitude variation due to fading generally have much lower frequency components of several tens of Hz or less (refer to Figure 3-6). The properties of amplitude variation attributable to factors that should to be evaluated and those that should not be evaluated are different. Therefore, the different elements of amplitude variation can be separated by filtering based on the difference in these properties and thus amplitude variation due to fading can be eliminated or reduced by removing the corresponding amplitude variation element.
フェージングによる振幅変化 変調による振幅変化 干渉波による振幅変化
振幅
時間
振幅
時間移動速度により決定 シンボルレートにより決定
振幅
時間信号の周波数の差と信号の変化により決定
数十kHz~数十kHz~~数十Hz
必要な振幅変化不要な振幅変化
due to fading due to modulation
Amplitude variation
due to interference
ampl
itude
ampl
itude
ampl
itude
time time time
determined by mobile speed determined by symbol rate determined by the frequency difference and the changes in symbol
~ several tens of Hz ~ several tens of kHz ~ several tens of kHz
unnecessary for interference detection necessary for interference detection
Figure 3-6 Difference in properties of amplitude variation
Next, Figure 3-7 shows the changes in the histograms before and after amplitude variation due to fading was removed by filtering. These are examples of histograms under the conditions of QPSK modulation format and DU ratio of 0 dB.
Page 19 of 22

APT/AWG/REP-64
(a) Histogram without any fading (b) Histogram with fading
(c) Histogram after influence of fading was removed
Figure 3-7 Changes in histograms before and after fading was removed by filtering
Comparison between (a) and (b) of Figure 3-7 shows that the histogram without interference has a characteristic peak but the peak disappears when under the influence of fading. This means that, when fading occurs, it is difficult to distinguish whether an interference occurred or fading occurred, thereby reducing the accuracy of interference detection.
As shown in Figure 3-7 (c), however, if the influence of fading is removed by filtering, the histogram with fading and without interference shows a characteristic peak just like that seen in the histogram with neither fading nor interference. When interference occurs while the filtering is applied, the peak disappears from the histogram because the filtering does not remove the influence by interference.
Consequently, application of fading removal filtering enables interference detection without being influenced by fading.
5.2.2 Automatic generation of reference patterns for use in interference detection
This interference detection system requires APD patterns of the desired signals to use as reference for judging whether interference has occurred or not. Therefore it is necessary to generate APD patterns through simulations and measurements, which are operations heavily dependent on personal skills, leading to difference in interference detection performance depending on the operator.
To solve this problem, we separated measurement data using hierarchical cluster analysis to automatically generate APD patterns to use as reference.
Page 20 of 22

APT/AWG/REP-64
Here, we can assume 4 different categories of arriving signals by simplifying their reception conditions as follows:
(1) Desired signal alone; (2) Interfering signal alone; (3) Synthesized signal (desired + interfering signals combined); (4) No clear signal reception (just noise)
If we can separate the arriving signals into the above 4 groups through cluster analysis, we can use the measurement data for group (1) “Desired signal alone” and use it as the reference APD pattern.
We actually performed outdoor measurement and then conducted cluster analysis using the measured data. Measurement was conducted assuming that the desired signal was modulated in π/4-shift QPSK format and interfering signal was modulated in GMSK format. The signal-to-noise ratio was set at 19dB, while the DU ratio was changed. The fading removal filtering described above was applied to the measured data to obtain the waveform. Details of the measurement conditions are described below.
Measurement conditions for the above 3 reception conditions:
(1) Desired signal (π/4-shift QPSK) alone @SN=19dB × 7 samples
(2) Interfering signal (GMSK) alone @SN=21dB × 6 samples
(3) Synthesized signal (DU ratio = -30dB - +25dB) × 7 samples
1 sample: amplitude histogram obtained by measurement over 1 second
We did not conduct any measurement for “(4) No clear signal reception” because data for when there is no clear signal reception can be automatically removed by reception trigger setting.
Euclidean distance was used as distance function between measurement data to calculate the similarity between the samples described above. Ward’s method, known to have a high classification sensitivity, was applied for the cluster analysis. The results of the cluster analysis are shown in Figure 3-8.
所望波Shift-QPSK
02
46 Cluster Dendrogram
Height
合成波(DU=-25dB,-20dB,-15dB,-10dB-5dB,0dB,5dB,10dB,15dB,20dB,25dB,30dB)
干渉波GMSK
所望波Shift-QPSK
02
46 Cluster Dendrogram
Height
合成波(DU=-25dB,-20dB,-15dB,-10dB-5dB,0dB,5dB,10dB,15dB,20dB,25dB,30dB)
干渉波GMSK
Interfering signalGMSK
Desired signalShift-QPSK
Synthesized signal (DU=-25dB, -20dB, -15dB, -10dB,-5dB, 0dB, 5dB, 10dB, 15dB, 20dB, 25dB, 30dB)
Figure 3-8 Grouping by cluster analysis
Figure 3-8 shows how the tree diagram is largely separated into three clusters clearly representing (1) desired signal alone, (2) interfering signal alone and (3) synthesized signal (desired + interfering signals combined), respectively. This enables us to identify the desired
Page 21 of 22

APT/AWG/REP-64
signal and obtain a reference APD pattern necessary for interference detection. Use of an appropriate reference will lead to improved accuracy in interference detection.
This verification test measured more samples of synthesized signals than the other two (desired signal alone and interfering signal alone), but in actual radio monitoring operations, we receive only the desired signal for most of the time. In comparison, the frequency of receiving interfering signal or synthesized signal is expected to be very small. This implies that the signal clusters can be identified by referring to the number and receipt time of the samples comprising each cluster, even when there is no prior information on the signals. There is also possibility that the interference detection threshold can be automatically generated by evaluating classification performance for a greater number of samples.
5.2.3 Selection of the optimal threshold for determining whether there is any interference
As explained with Figure 3-5, the median value of the correlation histogram shifts according to the DU ratio. If the reference APD pattern was generated using data of conditions with the least possible interference and distortion, the change in the median value relative to DU ratio can be expected to be linear. Because the false detection rate is determined by the base area of the correlation histogram (without interference) exceeding a certain threshold, the grouping accuracy of the cluster analysis is very important in generating the reference APD pattern. Once the grouping is done, the correlation histogram can be automatically calculated. Therefore, the optimal threshold can be obtained by setting a target for false detection rate in advance. Thus selection of the optimal threshold can also be achieved by conducting cluster analysis as described in Section 5.2.2.
6. Summary
It has been demonstrated that it is possible to automatically detect the presence of interference by applying APD signal processing technique in radio monitoring equipment.
Moreover, the perceived issues related to the influence of fading on the histogram and automatic generation of references can be overcome by applying algorithms respectively. Thus it has been confirmed that this technique can be used for actual monitoring operations.
This technique does not require any special equipment or processing devices and is relatively easy to incorporate into existing systems. Therefore it can be characterized as a function that can be flexibly added on to existing systems according to changes in the radio environment.
It is also flexible in terms of adapting to various modulation formats, making it very suitable for today’s rapidly evolving radio environment.
____________
Page 22 of 22