vietnamese local chicken breeds: genetic diversity …
TRANSCRIPT
VIETNAMESE LOCAL CHICKEN BREEDS: GENETIC DIVERSITY AND
PRIORITISING BREEDS FOR CONSERVATION
Dissertation to obtain the PhD degree in the international PhD program for Agricultural Sciences in Göttingen (IPAG)
at the Faculty of Agricultural Sciences, Georg-August Universität, Göttingen, Germany
Presented by
Ngo Thi Kim Cuc (born in Hanam, Vietnam)
Göttingen, April 2010

D7
1. Referee: Prof. Dr. Henner Simianer Animal Breeding and Genetics Group Department of Animal Sciences Georg-August Universität, Göttingen
2. Co-referee: Prof. Dr. Eva Schlecht Animal Husbandry in the Tropics and Subtropics Group Universität Kassel and Georg-August Universität Göttingen In collaboration with Dr. Steffen Weigend Institute of Farm Animal Genetics Friedrich- Loeffler-Institut (FLI) Neustadt-Mariensee

ACKNOWLEDGEMENTS
I would like to greatly acknowledge:
Prof. Dr. Henner Simianer for offering me the opportunity to work on this interesting
topic and for accepting this thesis as well as for providing me fruitful ideas to develop the
whole study.
Prof Dr. Eva Schlecht for taking over co-referee and for accepting this thesis.
Dr. Steffen Weigend for welcoming me to his laboratory and for valuable discussion. He
always brought the best solutions for difficult situations in the laboratory works.
Prof. Dr. Clemens B.A. Wollny, Prof. Dr. Hoang Van Tieu and Dr. Vu Chi Cuong for
initiating this project.
Mrs. Annet Weigend and Ms. Anke Flörke for their technical assistance with the
laboratory works in Mariensee.
Dr. Linn Fenna Groeneveld and Dr. Herwin Eding for giving me useful suggestion and
discussion.
Prof. Dr. Eildert Groeneveld and his working group for offering me a warm reception.
Mrs. Ute Döring for giving me help any time I needed it.
Cong, Tamina and Farai for giving interesting talks and exchanging experiences.
Bohani Mtileni for offering me his kindness to correct English whenever I needed.
My colleagues in the Animal Breeding and Genetics Group for help, warm working environment.
Vietnamese farmers for providing chicken blood samples and useful information on their
chickens.
Vietnamese local conservationists for supporting during my field work.

German Academic Exchange Service (DAAD) and German Federal Ministry of
Education and Research (BMBF) for the financial supports.
Vietnamese student association in Göttingen for making my stay in Göttingen enjoyable.
My parents, my aunt, my parent in-law for taking care of my daughter and for their
encouragement, moral support, tolerance, inspiration during my study.
My husband Le Van Hai and my daughter Le Huong Ly for their great patience and
sympathy during the time I was away from home. Without their supports, I can not finish
this study. Thank you a lot for all.

TABLE OF CONTENTS
5
TABLE OF CONTENTS
Summary 6
1st Chapter General introduction 8
Background 9
Role of chickens in smallholder farming 10
Chicken genetic diversity and assessment of genetic diversity
11
Conservation of local chicken genetic resources 15
The agro-ecological zones and local chicken breeds in Vietnam
20
Scope of the thesis 22
References 23
2nd Chapter Assessing genetic diversity of Vietnamese local chicken breeds using microsatellites
32
3rd Chapter Multiple maternal lineages of Vietnamese local chickens inferred by mitochondrial DNA D-loop sequences
40
4th Chapter Characterisation of the Vietnamese chicken gene pool compared to Chinese Chicken Breeds
57
5th Chapter Conservation priorities and optimum allocation of conservation funds for Vietnamese local chicken breeds
76
6th Chapter General discussion 102
General discussion 103
Conclusions 111
Implications and recommendations 112
References 114

SUMMARY
6
SUMMARY
The overall goal of this study was to characterize the genetic diversity of the Vietnamese
local chicken breeds and to identify population priorities for conservation. The specific
aims were 1) to assess and explain the population genetic structure of the Vietnamese
breeds, 2) to characterize the Vietnamese breeds in relation to the Chinese breeds and
wild chickens, 3) to estimate conservation potentials for conservation priorities of the
Vietnamese breeds, and 4) to define an optimal allocation of limited conservation funds
to them.
First genetic diversity within and between the Vietnamese breeds was analysed at the
autosomal level using 29 microsatellites. A total of 353 individuals of nine Vietnamese
local breeds and two breeds of Chinese origin were studied. The Vietnamese breeds were
sampled from the northern and southern parts of Vietnam while the two Chinese breeds
(NIAS Chinese breeds) have been kept at the National Institute of Animal Sciences,
Hanoi. The results revealed a high level of diversity within Vietnamese breeds. Analysing
the genetic structure using the software package STRUCTURE suggested an optimal
clustering at K = 6. These groups encompassed four homogeneous clusters, one formed
by the two Chinese breeds and the other three representing a single breed each: the
Mekong Delta breed Ac, the South Central Coast breed Choi, and the Red River Delta
breed Dong Tao. The six remaining breeds formed two additional admixed clusters. This
finding indicates that sub-structuring of the Vietnamese chicken breeds is related to their
geographical distribution. The two NIAS Chinese breeds are genetically distinct from the
Vietnamese breeds.
Mitochondrial DNA D-loop sequences were used to determine the degree of shared
mtDNA haplotypes between the studied breeds. A 455-bp fragment of the mtDNA D-
loop region was sequenced in 222 chickens of nine Vietnamese breeds and two NIAS
Chinese breeds. As reference, a skeleton was created based on chicken mtDNA sequences
taken from the Genbank which assigned clades to suggested regions of domestication in
chickens. Haplotypes of the nine Vietnamese and two NIAS Chinese breeds were aligned
together with these sequences. The mtDNA haplotypes formed eight clades. The majority
of individuals of the two NIAS Chinese breeds grouped together in one clade. Although
the Vietnamese breeds were distributed across all eight clades, most of them clustered in
SUMMARY
7
three main clades originating from from Yunnan, South and Southwest China and/or
surrounding regions.
The differentiation of Vietnamese breeds from Chinese chickens was characterised. For
this, as reference, data of 14 indigenous breeds from China (Reference Chinese breeds)
and three Red Jungle Fowl populations (Gallus gallus gallus and Gallus gallus
spadiceus) genotyped at the same microsatellite loci in a previous study were included.
Analysing the genetic structure indicated that the Vietnamese breeds formed a
homogeneous group separated from the other breeds (except for the Chinese Chahua
breed). This finding provides additional evidence that the Vietnamese gene pool is
genetically different from the Chinese gene pool even when a wider range of breeds is
considered. Another analysis was also used to find the degree of uniqueness of the
Vietnamese breeds relative to a set of three Red Jungle fowl populations. Compared to
the reference Chinese breeds, the contribution of the Vietnamese breeds to the set of Red
Jungle Fowl populations is lower. This suggests that the Vietnamese breeds are more
closely related to the Red Jungle fowl populations than the reference Chinese breeds.
The second objective of this thesis was to estimate the conservation potential of the
Vietnamese breeds and to derive optimal allocation of conservation funds to maximize
genetic diversity conserved between these breeds. The Weitzman approach for assessing
alternative conservation strategies for genetic diversity between breeds was used. The
approach combines genetic diversity assessed at the molecular level and extinction
probabilities estimated by socio-economic factors to derive conservation priorities of
breeds based on their conservation potential. To investigate an optimal allocation of
conservation funds, three different models were applied. These models reflect the range
of possible functions between costs and effects in typical conservation situations. Under
the assumptions made it is expected that half of the genetic diversity of the Vietnamese
breeds will go lost within the next 30–50 years if no conservation efforts are taken.
Conservation potential of the Vietnamese chicken breeds varies considerably. The
optimum conservation strategy to maximise genetic diversity between the Vietnamese
breeds should prioritize the breeds with the highest conservation potential. Population
priorities for allocation of conservation funds to the Vietnamese breeds do not depend on
which cost model was used. The three local breeds Te, Dong Tao and Ac have the highest
conservation potential and should be the prime candidates for conservation programs.
1st CHAPTER General introduction
8
1st
CHAPTER
General introduction

1st CHAPTER General introduction
9
Background
Vietnam is an agricultural country with 70% population living in rural area. More than
80% of the total agricultural households keep chickens (Vang, 2003 and Burgos et al.,
2008). In 2006, the chicken population in Vietnam was estimated about 152.7 millions.
The distribution ranges from 2.9 million in the Northwest to 40.6 million birds in the Red
River Delta. Local chickens make up more than 70% of the country’s total chicken
population (Desvaux et al., 2008). They are mainly kept in the traditional extensive
backyard/household production, representing about 94% of all poultry producers (Hong
Hanh et al., 2007).
Chicken is the country’s second most important meat source after pork (Burgos et al.,
2008) and plays an integral role in the smallholder farming systems. They are used to
meet the multiple social, economic and cultural needs of households (Epprecht, 2005 and
Burgos et al., 2008). Vietnamese local chicken breeds are specific for particular regions
and they are assumed showing specific adaptation to climate, disease, local low input and
low output production system (Vang, 2003). Hence they may represent a large natural
gene pool as reservoir for future breeding to meet specific objectives.
Vietnamese local chickens consist of different phenotypes kept in distinct agro-ecological
zones of Vietnam, which stretches 1 600 km from North to South. Geographical isolation
of the populations could result in sub-structuring through drift, mutation and divergent
selective forces. However, it is not known to what degree Vietnamese local chicken
populations differ. An assessment of genetic diversity using molecular markers may serve
as a initial guide to identify unique and valuable genetic resources. Recently, several
studies to assess genetic structure of chicken populations using molecular tools such as
microsatellite markers (Hillel et al., 2007; Muchadeyi et al., 2007; Chen et al., 2008;
Berthouly et al., 2008; Granevitze et al., 2007; 2009 and Bodzsar et al., 2009) and
mitochondrial DNA (Liu et al., 2004; Liu et al., 2006; Oka et al., 2007; Muchadeyi et al.,
2008 and Silva et al., 2008) were published. An assessment of the genetic structure
employing these molecular tools provides different insights into diversity within and
between indigenous chicken populations. These two marker types have a different mode
of inheritance. Microsatellites are autosomal markers while mitochondrial DNA is
maternally inherited.

1st CHAPTER General introduction
10
The genetic potential of indigenous chickens as a reservoir of genomic variation and
major genes with relevance to improve adaptability has already been reported by several
reports (Horst and Mathur, 1992; Horst, 1989; Garces and Casey, 2003 and FAO, 2007a).
Understanding about the existing variation that already exists and how it can be
conserved and accessed effectively needs to be gained. Romanov et al. (1996) suggested
that local chickens might contain genes and alleles pertinent to their adaptation to
particular environmental conditions and local breeding goals. Therefore, maintaining
local breeds is needed to permit genetic adaptation of populations to unforeseen breeding
requirements in the future and as a source of research material (Horst, 1989; Besbes, 2009
and Tixier-Boichard et al., 2009). The erosion of local chicken populations may be linked
to the loss of valuable genetic variability and unique characteristics. The convention on
biological diversity (http://www.biodiv.org) has put the need to conserve farm animal
genetic diversity on the agenda. In farm animal diversity conservation, a unified approach
accounting for two main roads to conservation has been established. This includes
prevention of breed extinction and management of genetic diversity (Simianer, 2005).
There is a growing recognition that preservation of local chicken breeds is not only
important to ensure the livelihoods of poor farmers who depend on these breeds, but their
conservation is regarded as a national policy, as locally adapted chicken genetic resources
could become future assets in breeding programs. Decision making in conservation
requires specification of model parameters such as diversity, breed values, extinction
probabilities and conservation potentials (Simianer, 2005). Beside phenotypic
characterization, assessment of genetic characterization of local breeds is a prerequisite
for this purpose (Wollny, 2003). Efforts should be made to preserve the important and
unique characteristics that Vietnamese local chicken genetic resources possess. Genotypic
characterization and conservation priorities in Vietnamese local chicken populations
therefore need urgent attention.
Role of chickens in smallholder faming
In developing countries nearly all families at the village level, even the poor and landless,
own poultry (Mack et al., 2005). Major initiatives have been undertaken to develop

1st CHAPTER General introduction
11
poultry as a tool for rural development. Poultry constitutes an important contribution to
rural household’s food security and income generation (Kitalyi and Mayer, 1998; Coplan
and Alders, 2005; Alders and Pym, 2010). They are used to address gender inequalities.
Women have more control and decision making powers on chickens than men (Kitalyi
and Mayer, 1998; Guèye, 2000). In addition, village chickens are required for special
festivals and essential for many traditional ceremonies (Coplan and Alder, 2005; Alders
and Pym, 2010). Furthermore, chickens show the greatest variability of population types
and make an important contribution to biodiversity (Tixier-Boichard et al., 2009).
In Vietnam, chicken accounts for 70% of total poultry population. In 2006, the total
poultry meat production (slaughtered poultry) was estimated to be 344.4 thousand tons
and the number of eggs produced was 3.97 billions (GSO, 2007). Tung and Rasmussen
(2005) showed that 31.7% and 17.8% of the total output of poultry production was
consumed by semi-subsistence and semi-commercial poultry keepers, respectively.
Poultry used as a source of protein to improve the nutrition for Vietnamese was reported
by Epprecht (2005). The most important livestock-based source of income for the poorest
income quintile is derived from poultry. Epprecht (2005) and Epprecht et al. (2007)
reported that poultry accounts for about one quarter of the total household’s income from
livestock and further indicated that poultry serves as a ‘sell-for-cash’ tool for poor
households.
Cuc et al. (2006) suggested a shift in gender ratio in chicken production due to the
ownership of Vietnamese H’mong chickens by women. A similar observation was found
by Burgos et al. (2008) who recognized the importance of Vietnamese poultry for
children and women. The Vietnamese local chicken breeds also are an essential part of
cultural and social activities (Vang, 2003 and FAO, 2009), for example Ho chicken are
used for entertainment in religious celebrations and Ac and H’mong chicken are used for
traditional medical purposes.
Chicken genetic diversity and assessment of genetic diversity
In developing countries, it had been widely assumed that local chickens have adapted to
their local production systems which often are characterised by a limited supply of

1st CHAPTER General introduction
12
resources and a lack of proper management program. They may present a diverse gene
pool that could comprise unique genetic features. Some information on the genetic make-
up of local chickens was reported (Horst, 1989). Thereby, their major genes with
important effects on tropical oriented breeding already proved for their special utility in
the tropics, such as dwarf (Dw), naked neck (Na), frizzle (E), silky (H), non-inhibitor (Id),
fibro-melanosis (Fm), pea comb (P), blue shell (O) and slow feathering (K).
A wide diversity of indigenous chicken breeds in the tropics could form the basis for
genetic improvement and diversification to produce more productive breeds adapted to
specific environments and requirements (Horst, 1989). Therefore, the estimation of
genetic diversity of the local chickens should be carried out to support conservation
strategies and utilisations of their performance values.
Microsatellites and mitochondrial DNA (mtDNA) sequences have already proved to be
useful for assessing genetic variability, while single nucleotide polymorphisms (SNPs)
are becoming more and more popular due to their very high density and availability of
high throughput genotyping techniques. Microsatellites are tandem repeats in the genomic
DNA with very short (1-5bp) simple sequence motifs, and hence they are autosomally
inherited (Tautz, 1989). Major advantages of these highly polymorphic markers are their
locus specificity, abundance and random distribution over the genome, co-dominant
inheritance, ease and speed of their application and suitability for semi-automated
analysis (Weigend and Romanov, 2001). Unlike microsatellite markers, mtDNA is
maternally inherited. The mtDNA is a circular molecule of 16,785 bp in size (Desjardins
and Morais, 1990). The displacement loop (D-loop) region of the mtDNA contains
elements that control the replication of the molecule and is highly polymorphic. MtDNA
is used to infer regions of domestication and to identify the number of maternal lineages
and their geographic origins (FAO, 2007b).
A combination of these two markers is a complementary approach that combines the
highly polymorphic microsatellites whose high mutation rates allow for small-scale
resolution of more recent demographic events with mtDNA which shed light on
phylogeographic events dating further back in time (Feulner et al., 2004). An assessment
of genetic structure based on these two markers with different modes of inheritance
provides more insights into the evolutionary forces shaping genetic diversity.
1st CHAPTER General introduction
13
Total genetic diversity includes within and between breed diversity. Genetic diversity
within a breed can be estimated by the number of alleles, the expected heterozygosity
(Frankham et al., 2002) and marker estimated kinships within a breed (Eding and
Meuwissen, 2001). Genetic diversity between breeds can be assessed by various
measures. A parameter for assessing diversity between breeds is the genetic
differentiation or fixation indices which reveal the partitioning of genetic diversity
(Wright, 1969). A wide range of studies for the assessment of genetic diversity were
conducted using genetic distances (Nei, 1972 and Reynolds et al., 1983). A unified
approach to assess genetic diversity within and between populations is based on marker
estimated kinships (Eding and Meuwissen, 2001). Bayesian clustering approaches have
been suggested for admixture analysis of different populations (Pritchard et al., 2000).
This approach has already been proven to be useful to study the structure of populations
of various farm animals (Rosenberg et al., 2001; Fabuel et al., 2004; Granevitz et al.,
2009; Leroy et al., 2009; Li and Kantanen, 2009).
Recently, assessments of genetic diversity of chicken populations using the same set of
microsatellite markers suggested by FAO (2004) have been published in several studies
(Cuc et al., 2006; Hillel et al., 2007; Muchadeyi et al., 2007; Chen et al., 2008;
Granevitze et al., 2007; 2009 and Bodzsar et al., 2009). Using the same markers in these
studies allows unbiased comparisons. In a large scale study including 64 chicken
populations from various continents and management systems, Granevitze et al. (2007)
found considerable variation of within breed diversity (i.e., numbers of alleles/population
and heterozygosity values). This variation reflected differences in population history and
management. The average number of alleles and expected heterozygosity (3.6 ± 0.87
alleles and 0.51 ± 0.07, respectively) was rather lower than that observed in human (Ayub
et al., 2003), cattle (Sodhi et al., 2005) and pig (Behl et al., 2006). Highest levels of
within-population diversity were found in non-managed local populations, in some
standardised breeds kept with a large population size and in some commercial broiler
lines. A wide variation of within breed diversity was found for European fancy breeds.
White-egg layer lines revealed the lowest level of diversity of all commercial lines.
Therefore, white-egg layer lines might be considered to be in a more critical situation
than other commercial lines concerning their future development, while some local breeds
do represent an important reservoir of genetic diversity.

1st CHAPTER General introduction
14
In the analysis of the population structure of a wide range of chicken breeds and lines
from various continents and management systems, Granevitze et al. (2009) found six
main clusters which were related to their geographical origins and histories. These six
main clusters were formed by 1) brown egg layers, 2) predominantly broilers, 3) native
Chinese breeds or breeds with recent Asian origin, 4) predominantly breeds of European
derivation, 5) populations with no known history, and 6) the other populations shared
their genome with some clusters defined as “Multi-clusters”. Within a country, different
observations on population structure were revealed. Chen et al. (2008) and Bodzsar et al.
(2009) found sub-structuring in Chinese and Hungarian chicken breeds, respectively,
while Zimbabwean chicken populations do not exhibit a typical breed structure
(Muchadeyi et al., 2007). This implies a higher level of gene flow among agro-ecological
zones or populations in the African country (i.e., Zimbabwe) than Asian and European
countries (i.e., Vietnam and Hungary, respectively).
Some studies on Vietnamese chicken populations employing microsatellite data were
published (Cuc et al., 2006 and Berthouly et al., 2009). These studies were carried out in
a single province (i.e., Mai Son district, Son La province and Ha Giang province,
respectively). The populations in these studies showed high diversity and no substructure.
In addition, the highest genetic diversity was found in a H’mong population when
comparing it to a wide range of globally collected chicken breeds (Granevitze et al.,
2007).
In the analysis of mtDNA sequences, haplotype network analysis clusters individuals
based on haplotypes they possess and indicates how different these haplotypes are from
those in other individual. The median networks of haplotypes were generated by
partitioning the groups of haplotypes to portray mtDNA relationships and infer about
population expansion and domestication events (Bandelt et al., 1995). The ancient
haplotypes can be distinguished from young ones due to their higher frequencies and
central positions surrounded by derived haplotypes in a star like topology (MacHugh and
Bradley, 2001). Bandelt et al. (1995) showed that the median networks of haplotypes
provide a much more useful and informative mitochondrial portrait of the populations
concerned than can be obtained from other traditional tree building approaches such as
maximum parsimony, maximum likelihood and distance methods.

1st CHAPTER General introduction
15
Applying haplotype network analysis, Liu et al. (2006) and Oka et al. (2007) conclude
multiple and independent domestication events in South China, Southeast Asia and the
Indian subcontinent. Liu et al. (2006) revealed the nine divergent clades (named clade A–
I) related to geographical distribution in the wide range of domestic chickens in Eurasian
regions, whereas Oka et al. (2007) identified seven clades (named clade A-G) observed in
Japanese chickens. Recent studies on Zimbabwean (Muchadeyi et al., 2008) and Sri
Lankan (Silva et al., 2008) chickens using haplotype network analysis also support the
hypothesis of multiple origins of domesticated chicken. The populations in these studies
indicated a high level of genetic diversity. In the study of Liu et al. (2006), the
Vietnamese chicken samples were assigned into two different clades G and I. Clade G
have originated from Yunnan and/or surrounding areas of China while clade I have origin
in Vietnam. However, the study of Liu et al. (2006) was based on only a small number (n
= 3) of Vietnamese chicken samples.
Conservation of local chicken genetic resources
FAO (2007a) indicated that on a global level about 20 % of all recorded farm animal
breeds are classified as being “at risk”. Chicken genetic resources are considered to be the
most endangered with the highest proportion of breeds at risk (33% of all recorded
chicken breeds), four percent of the breeds were reported as extinct, the status of 40%
was unknown, and the remaining 23% of the breeds were not at risk. The main factors
that result in a loss of local animal genetic resources are low performance of local breeds,
farmers' preferences for exotic breeds, the lack of adequate conservation policies, socio-
economic changes, natural and human induced disasters, and the transformation of
traditional systems into external input-oriented systems (FAO, 2007a).
Conservation and development of local breeds is important because of their contribution
to the livelihoods of farmers and biodiversity as well as their social and cultural
importance (FAO, 2007b). The need to conserve farm animal biodiversity is accepted by
many countries through the ratification of the convention on biological diversity
(http://www.biodiv.org). Recently, the global plan of action for animal genetic resources
was adopted by 109 countries. These highly contributed to establish an effective
1st CHAPTER General introduction
16
international framework for the sustainable use, development and conservation of animal
genetic resources for food and agriculture, and world food security (FAO, 2007b). This is
a major global thrust on genetic preservation and biodiversity which is reflected in efforts
to further develop a global databank for animal genetic resources for food and agriculture
genome and data banks (http://dad.fao.org/).
In Vietnam, the convention on biological diversity was adopted in 1995 (Tieu et al.,
2008). A total of 96 Vietnamese local livestock breeds including 11 chicken breeds are
recorded in the FAO’s global databank (http://dad.fao.org/). Information of these 11
breeds is given in Table 1. Within the country, the Vietnamese Government has issued a
number of policies and decisions to support the management and to promote the
development of animal production (Vang, 2003). Furthermore, national programs on
conservation of the Vietnamese domestic animal genetic resources have been initiated
under the direction of the National Institute of Animal Sciences (NIAS) since 1990.
These policies and national programs have had positive impacts on the use and
conservation of farm animal genetic resources. For example, several breeds (i.e, H’mong
and Te chicken) were detected; two breeds (Ho and Te chicken) were rescued from risk
of extinction; utilisation of Ac and H’mong chickens as a traditional medicine has been
developed for human demand across the country (Tieu et al., 2008). Almost all of the
conservation programs implemented by NIAS have been conducted on farms with farmer
participation (Tieu et al., 2008). Farmers have been paid only 20% of total expenditure to
maintain the breeds. Such a low allocation might not ensure to prevent the loss of national
animal genetic resources in the long term (Tieu et al., 2008).

1st CHAPTER General introduction
17
Table 1. Information of 11 Vietnamese local chicken breeds.
Adult body weight (kg) Breed Origin Distribution
Male Female
Egg yield/ year
(eggs)
Special feature Status
H’mong Northwest and North Central Coast
North and Centre 2.2 - 2.5 1.6 - 2.0 60 - 75 Traditional medicine Decreased
Oke Northeast Northeast 2.5 1.2 24 - 30 Traditional medicine Decreased
Ho Red River Delta Red River Delta 4.5 - 5.5 3.5 - 4.0 45 - 60 Beautiful appearance Decreased
Dong Tao Red River Delta Red River Delta 4.5 3.5 70 Short and thick legs Increased
Ri Red River Delta North and Centre 2.7 1.2 60 - 75 Decreased
Mia Red River Delta Red River Delta 3.0 2.3 55 - 60 Increased
Te North and Centre North and Centre 1.6 1.3 54 - 72 Dwarfism Endangered
Tre South Central Coast Across the country 1.2 - 1.3 0.8 - 0.9 56 - 70 Game cock Decreased
Choi South Central Coast Across the country 4 - 5 3.5 - 4 32 - 40 Game cock Decreased
Tau Vang Mekong Delta South 2.0 1.4 90 - 120 Increased
Ac Mekong Delta North and South 0.70 - 0.75 0.55 - 0.60 90 - 100 Traditional medicine Increased
(http://dad.fao.org/; NIAS, 2000 and Su et al., 2004)

1st CHAPTER General introduction
18
Conservation strategy involves the identification and prioritization of targets for
conservation. One of the objectives of conservation programs is to maintain genetic
diversity for potential future use. Eding and Bennewitz (2007) indicated two different
methods using molecular genetic variation to derive conservation priorities which are the
core set (Eding et al., 2002) and the Weitzman (1992)’s methods.
The basis principle of the core set method is the elimination of genetic overlap in the total
set of populations. The genetic overlap or genetic similarity between individuals and
populations is described by the coefficient of kinship (Eding and Bennewitz, 2007). If the
average kinships between and within breeds are known, the average kinship in a core set
is calculated and the contribution of each breed to the core set is estimated. In the case of
the core set, these contributions are chosen such that the average kinship in the core set is
minimized. By estimating contributions to a core set, the populations under study are
ranked according to their genetic uniqueness. From this, the relative importance of
populations in conserving the genetic diversity is found (Eding et al., 2002).
A core set can be thought of as a live or cryo-conserved mixed population, which is
composed of various proportions of different breeds. The breed contributions to the core
set are derived in such a way, that the expected diversity of the total core set is
maximized. When the objective of the conservation measures is to maximize conserved
genetic variation, then the core set method should be used (Bennewitz et al., 2007). While
this approach combines both between and within-breed diversities, non-genetic criteria
like any sort of specific breed value or degree of endangerment are not taken into account.
Therefore, using this method could ignore risk of extinction of the breed which plays an
important role in conservation decision (Simianer, 2005 and FAO, 2007a). In addition,
the method likely increases the opportunity for genetic flow, and chances to lose unique
alleles from the population (Tapio et al., 2006).
A widely used formal approach for decision making in livestock conservation is based on
Weitzman’s (1992) diversity concept. The Weitzman diversity is a diversity of elements
which are homogeneous and pair-wise clearly distinct. The approach aims to maximize
expected diversity and uses the conservation potential, which combines the genetic
diversity between breeds and their extinction probabilities estimated by socio-economic

1st CHAPTER General introduction
19
factors to prioritize breeds for conservation (Simianer, 2005). Conservation potential is
considered as the single most useful breed alert indicator in conservation decision
(Weitzman, 1993). Conservation potentials were applied for prioritizing cattle (Simianer
et al., 2003 and Zerabruk et al., 2007) and chicken (Pinent et al., 2005) breeds. The
populations in these studies showed a considerable variability of their conservation
potentials.
Although migration between breeds or within breed diversity is neglected applying the
Weitzman approach as criticized by Caballero and Toro (2002) and Eding et al. (2002),
decisions on investments in conservation based on the Weitzman approach are driven not
only by the phylogenetic substructure, but also by economic and social factors, which
serve as an important consideration in the conservation decisions (Reist-Marti et al.,
2003; Simianer et al., 2003; Pinent et al., 2005 and FAO, 2007a). In addition, applying
the Weitzman diversity in conservation strategy can maintain allelic diversity within
species, ensuring access maximum adaptive potential of species (Simianer, 2005 and
Tapio et al., 2006) since conservation activities aim to reduce the extinction probability
and to increase expected diversity of populations as suggested by Simianer (2005) and
FAO (2007a).
Conservation strategies also require consideration on how the available resources should
be distributed among the breeds under consideration, and decisions as to which is the
most efficient conservation strategy among several options available (FAO, 2007a). As a
total budget for these activities is limited, the key questions are how many and which
breeds will receive financial support and how to allocate the funding in the most optimal
way. In Vietnam, national conservation programs financially support farmers to maintain
their breeds despite the economic inferiority of their breeds. Such a low allocation might
not ensure to prevent the loss of national animal genetic resources in the long term (Tieu
et al., 2008).
Simianer (2002) showed that an optimum allocation can substantially increase the
efficiency of the use of available conservation funds. Furthermore, Simianer et al. (2003)
proposed an algorithm to calculate optimum allocation of resources to a set of breeds
based on three models (named model A, B and C) with different assumptions. Model A
assumes that a fixed amount of money per year pays a premium to owner of chickens,
1st CHAPTER General introduction
20
balancing some of the economic inferiority of those chickens, which reflects the present
scene established in Vietnam. Model B presumes that a basic strategy for maintaining
diversity in small population is to keep family size constant. When chickens are raised for
replacement, this information is brought to the chicken owners by extension specialists.
With more animals more extension specialists are needed. In this case, the costs are
proportional to the population size. Model C is based on the assumption that the
information on within breed conservation measures can been brought to the chicken
owners through some established information channels without any expenditure.
Therefore, the costs are independent on the population size, but are a function of the
number of populations. These assumptions cover a wide range of possible conservation
policies, and so the application of all three models will identify the relevant range of
sensible allocation patterns. In an application to African cattle data, Simianer et al. (2003)
showed that using the optimum allocation approaches can double the cost efficiency of
conservation programs, but the choice of the different models did not strongly affect the
outcome.
The agro-ecological zones and local chicken breeds in Vietnam
Vietnam is a tropical country located in the centre of Southeast Asia. The country
stretches 1 600 km from North to South, between 8°33' and 23° 20' North and 102° and
109° 27' East. The total area is 329 566 km2. The climate varies greatly from North to
South. The country is divided into eight agro-ecological zones, based on topography, soil
pattern, and climate (Figure 1). The rainfall, temperature, major topographic features and
farming systems of each agro-ecological zone are given in Table 2 (Vang, 2003; FAO,
2005 and GSO, 2007). The diversity of natural environment and differences in production
systems in the country has contributed to the differentiation of local chicken breeds
(BMBF, 2006). FAO (http://dad.fao.org) reported 11 Vietnamese indigenous chicken
breeds besides one extinct (Van Phu breed). From these 11 breeds, one breed (Te
chickens) is critically endangered. Six breeds have been decreasing in numbers while the
other remaining breeds have been increasing in numbers (NIAS, 2000). These 11 breeds
have originated and are distributed in the different agro-ecological zones. Five breeds
have originated from Northern Vietnam, two breeds have origins in the centre of

1st CHAPTER General introduction
21
Vietnam, two breeds have their roots of both the north and centre of Vietnam and two
breeds have originated from the South (Table 1).
(Vang, 2003) Figure 1. Map of Vietnam and eight agro-ecological zones (free scale).
Table 2. The rainfall, temperature, major topographic features and farming systems of
each agro-ecological zone.
Zone Area
(km2)
Rainfall
(mm/year)
Temperature
(oC)
Physical
regions
Farming system
Northeast 6 402 1 721 23.2 Mountain and midland
Extensive
Northwest 3 754 2 355 21.8 Mountain and midland
Extensive
Red River Delta 1 486 2 013 23.3 Lowland Semi-extensive
North Central Coast 5 155 2 985 24.1 Mountain, lowland and sandland
Extensive
South Central Coast 3 316 2 389 26.3 Mountain, lowland and sandland
Extensive
Central highland 5 466 1 611 19.9 Highland Semi-extensive
South East 3 481 1 390 27.8 Lowland Intensive
Mekong delta 4 061 2 679 27.1 Lowland Semi-extensive
(Vang, 2003; FAO, 2005 and GSO, 2007)

1st CHAPTER General introduction
22
Although 11 Vietnamese local chicken breeds have been reported, the definition of these
breeds is not fully standardized. It appears rather unlikely that valid results based on
phenotypic characterization programs may be obtained for local chicken breeds
considering the various local production systems. Furthermore, these chickens are reared
in isolated villages. There is a need to investigate genetic diversity between and within
local breeds to develop effective conservation programs and to determine whether the
chicken populations in different areas represent unique populations. Conservation
potential for each breed needs to be calculated for the definition of conservation priorities.
This study is also necessary to maximize efficiency of funding allocation for
conservation.
Scope of the thesis
The major scope of this thesis is to characterize genetic diversity of Vietnamese local
chicken breeds and to identify population priorities for conservation. In particular, this
thesis aims at
i. Evaluating genetic diversity within and between Vietnamese local chicken
breeds of diverse geographical origins based on different molecular markers.
ii. Characterising the Vietnamese chicken gene pool relative to the Chinese
chicken breeds and estimating the degree of uniqueness of the Vietnamese
breeds to total diversity of a set of three Red Jungle fowl populations.
iii. Estimating the conservation potential of Vietnamese local chicken breeds.
iv. Investigating optimal allocation of conservation funds to minimize loss of
genetic diversity between these breeds.
The first issue is covered in chapters 2 and 3. The second issue is presented in chapter 4.
Chapter 5 contains the third and fourth issues, while the general discussion is presented in
the final chapter 6.

1st CHAPTER General introduction
23
References
Alders R.G and Pym R.A.E. 2010. Village poultry: still important to millions, eight
thousand year after domestication. World’s Poultry Science Journal 65: 181-190.
Ayub Q., Mansoor Q., Ismail M., Khaliq S., Mohyuddin A., Hameed A., Mazhar K.,
Rehman S., Siddiqi S., Papaioannou M., Piazza A., Cavalli-Sforza L.L. and Mehdi
S.Q. 2003. Reconstruction of human evolutionary tree using polymorphic autosomal
microsatellites. American Journal of Physical Anthropology 122: 259-268.
Bandelt H.J., Forster P., Sykes B.C. and Richards M.B. 1995. Mitochondrial portraits of
human populations using median networks. Genetics 141: 743-753.
Behl R., Sheoran N., Behl J. and Vijh R.K. 2006. Genetic analysis of Ankamali pigs of
India using microsatellite markers and their comparison with other domesticated
Indian pig types. Journal of Animal Breeding and Genetics 123: 131-135.
Bennewitz J., Eding H., Ruane J. and Simianer H. 2007. Selection of breeds for
conservation. In Oldenbroek, K. (Eds). Utilisation and conservation of farm animal
genetic resources. Wageningen Academic Publishers, the Netherlands: 131-145.
Berthouly C., Bed'Hom B., Tixier-Boichard M., Chen C.F., Lee Y.P., Laloë D., Legros
H., Verrier E. and Rognon X. 2008. Using molecular markers and multivariate
methods to study the genetic diversity on local European and Asian chicken breeds.
Animal Genetics 39:121-129.
Berthouly C., Leroy G., Van T.N., Thanh H.H., Bed'Hom B., Nguyen B.T., Vu C.C.,
Monicat F., Tixier-Boichard M., Verrier E., Maillard J. and Rognon X. 2009. Genetic
analysis of local Vietnamese chickens provides evidence of gene flow from wild to
domestic populations. BMC Genetics: 10:1.
Besbes B. 2009. Genotype evaluation and breeding of poultry for performance under
suboptimal village conditions. World's Poultry Science Journal 65: 260-271.
BMBF (Bundesministeriums für Bildung and Forschung, Germany). 2006. Genetic
characterization of Vietnamese local chicken. Ten year co-operation of science and

1st CHAPTER General introduction
24
technology between Germany and Vietnam (1996 – 2006). Thierbach Publisher,
Mülheim, Germany: 71-72.
Bodzsar N., Eding H., Revay T., Hidas A. and Weigend S. 2009. Genetic diversity of
Hungarian indigenous chicken breeds based on microsatellite markers. Animal
Genetics 40: 516-523.
Burgos S., Hinrichs J., Otte J., Pfeiffer D. and Roland-Holst D. 2008. Poultry, HPAI and
Livelihoods in Viet Nam - A Review. HPAI Research Brief. Mekong Team Working
Paper No. 2. http://www.hpai-research.net/docs/Working_papers/wp02_2008.pdf.
Accessed on 15/01/2010.
Caballero A. and Toro M.A. 2002. Analysis of genetic diversity for the management of
conserved subdivided populations. Conservation Genetics 3: 289-299.
Chen G., Bao W., Shu J., Ji C., Wang M., Eding H., Muchadeyi F. and Weigend S. 2008.
Assessment of population structure and genetic diversity of 15 Chinese indigenous
chicken breeds using microsatellite markers. Asian-Australasian Journal of Animal
Sciences 21: 331-339.
Coplan J.W.D. and Alders R.G. 2005. The Australian village poultry development
programme in Asia and Africa. World’s Poultry Science Journal 61: 32-37
Cuc N.T.K., Muchadeyi F.C., Baulain U., Eding H., Weigend S. and Wollny C.B.A.
2006. An assessment of genetic diversity of Vietnamese H’mong chickens.
International Journal of Poultry Sciences 5: 912-920.
Desjardins P. and Morais R. 1990. Sequence and gene organization of the chicken
mitochondrial genome. A novel gene order in higher vertebrates. Journal of
Molecular Biology 212: 599-634.
Desvaux S., Ton V.D., Thang P.D. and Hoa P.T.T. 2008. A general review and a
description of the poultry production in Vietnam. Agricultural Publisher, Hanoi,
Vietnam.

1st CHAPTER General introduction
25
Eding H. and Bennewitz J. 2007. Measuring genetic diversity in farm animals. In
Oldenbroek K. (Eds). Utilisation and conservation of farm animal genetic resources.
Wageningen Academic Publishers, the Netherlands: 103-130.
Eding H. and Meuwissen T.H.E. 2001. Marker based estimates of between and within
population kinships for the conservation of genetic diversity. Journal of Animal
Breeding and Genetics 118: 141-159.
Eding H., Crooijmans R.P.M.A., Groenen M.A.M. and Meuwissen T.H.E. 2002.
Assessing the contribution of breeds to genetic diversity in conservation schemes.
Genetics Selection Evolution 34: 613-634.
Epprecht M. 2005. Geographic dimensions of livestock holdings in Viet Nam: Spatial
relationships among poverty, infrastructure and environment. PPLPI Working Paper
24.
Epprecht M., Vinh L.V., Otte J. and Roland-Holst D. 2007. Poultry and Poverty in Viet
Nam. Controlling avian flu and protecting people’s livelihoods – HPAI Research
Brief.
Fabuel E., Barragán C., Silió L., Rodríguez M.C. and Toro M.A. 2004. Analysis of
genetic diversity and conservation priorities in Iberian pigs based on microsatellite
markers. Heridity 94: 104-113.
FAO 2004. Secondary guidelines for development of national farm animal genetic
resources management plans: measurement of domestic animal genetic diversity
(MoDAD): Recommended microsatellite markers, Rome, Italy.
FAO 2005. Country Pasture/Forage Resource Profiles.
http://www.fao.org/ag/AGP/AGPC/doc/counprof/vietnam/vietnam.htm. Accessed on
25/01/2010.
FAO 2007a. The State of the World’s Animal Genetic Resources for Food and
Agriculture, edited by B.Rischkowsky and D. Pilling. Rome. http:// www.fao.org/
docrep/ 010/ a1250e/ a1250e00.htm. Accessed on 25/08/2009.

1st CHAPTER General introduction
26
FAO 2007b. Global Plan of Action for Animal Genetic Resources and the Interlaken
Declaration. Rome. http://www.fao.org/ ag/againfo/ programmes/en/
genetics/documents/ Interlaken/GPA_en.pdf). Accessed on 22/08/2009.
FAO 2009. The Bangladesh Model and Other Experiences in Family Poultry
Development.
http://www.fao.org/Ag/againfo/themes/en/infpd/documents/econf_bang/dis_output.ht
ml. Accessed on 16/05/2009.
Feulner P.G.D., Bielfeldt W., Zachos F.E., Bradvarovic J., Eckert I. and Hartl G.B. 2004.
Mitochondrial DNA and microsatellite analyses of the genetic status of the presumed
subspecies Cervus elaphus montanus (Carpathian red deer). Heredity 93: 299-306.
Frankham R., Ballou J. and Briscoe D.A. 2002. Introduction to Conservation Genetics.
Cambridge University Press.
Garces A. and Casey N.H. 2003. Oviposition and egg quality traits of dwarf and neked
neck layers. South African Journal of Animal Science 33: 105-110.
Granevitze Z., Hillel J., Chen G.H., Cuc N.T.K., Feldman M., Eding H. and Weigend S.
2007. Genetic diversity within chicken populations from different continents and
management histories. Animal Genetics 38: 576-583.
Granevitze Z., Hillel J., Feldman M., Six A., Eding H. and Weigend S. 2009. Genetic
structure of a wide-spectrum chicken gene pool. Animal Genetics 40: 686-693.
GSO (General Statistics office of Vietnam). 2007. Statistical Yearbook of Vietnam.
Statistical publisher, Vietnam.
Gueye E.F. 2000. The role of family poultry in poverty alleviation, food security and the
promotion of gender equality in rural Africa. Outlook on Agriculture 29: 129-136.
Hillel J., Granevitze Z., Twito T., Ben-Avraham D., Blum S., Lavi U., David L., Feldman
M.W., Cheng H. and Weigend S. 2007. Microsatellites, SNPs and the draft sequence
of the sex chromosomes, as information sources for the assessment of chicken
biodiversity. World's Poultry Science Journal 63: 33-45.

1st CHAPTER General introduction
27
Hong Hanh P.T., Burgos S. and Roland-Holst D. 2007. The Poultry Sector in Vietnam:
Prospects for Smallholder Producers in the Aftermath of the HPAI Crisis. Food and
Agriculture Organization of the United Nations, Pro-Poor Livestock Policy Initiative
(PPLPI) Research Report, August 2007.
Horst P. 1989. Native fowl as a reservoir for genomes and major genes with direct and
indirect effect on the adaptability and their potential for tropically oriented breeding
plans. Arch. Gefügelk. 53: 93-101.
Horst P. and Mathur P. K. 1992. Trends in economic values of selection traits for local
egg production. Proceeding of the 19th World Poultry Congress, Amsterdam, the
Netherlands 2: 577-583.
http://www.hpai-research.net/docs/Research_briefs/FAO_2007_%20HPAI_rbr01.pdf.
Accessed on 20/01/2010.
Kitalyi A.J. and Mayer A. 1998. Village chicken production systems in rural Africa
household food security and gender issues. The Food and Agriculture Organization of
the United Nations, Rome, Italy.
Leroy G., Verrier E., Meriaux J.C. and Rognon X. 2009. Genetic diversity of dog breeds:
between-breed diversity, breed assignation and conservation approaches. Animal
Genetics 40: 333-343.
Li M.H. and Kantanen J. 2009. Genetic structure of Eurasian cattle (Bos taurus) based on
microsatellites: clarification for their breed classification. Animal Genetics 41: 150-
158.
Liu Y.P., Wu G.S., Yao Y.G., Miao Y.W., Luikart G., Baig M., Beja-Pereira A., Ding
Z.L., Palanichamy M.G. and Zhang Y.P. 2006. Multiple maternal origins of chickens:
out of the Asian jungles. Molecular Phylogenetics and Evolution 38: 112-119.
Liu Z.G., Lei C.Z., Luo J., Ding C., Chen G.H., Chang H., Wang K.H., Liu X.X.,
Zhang X.Y., Xiao X.J. and Wu S.L. 2004. Genetic variability of mtDNA sequences in
Chinese native chicken breeds. Asian-Australasian Journal of Animal Sciences 17:
903-907.

1st CHAPTER General introduction
28
MacHugh D.E. and Bradley D.G. 2001. Livestock genetic origins: Goats buck the trend.
PNAS 98: 5382-5384.
Mack S., Hoffmann D. and Otte J. 2005. The contribution of poultry to rural
development. World’s Poultry Science Journal 61: 7-14.
Muchadeyi F.C., Eding H., Simianer H., Wollny C.B.A., Groeneveld E. and Weigend S.
2008. Mitochondrial DNA D-loop sequences suggest a Southeast Asian and Indian
origin of Zimbabwean village chickens. Animal Genetics 39: 615-622.
Muchadeyi F.C., Eding H., Wollny C.B.A., Groeneveld E., Makusa S.M., Shamseldin R.,
Simianer H. and Weigend S. 2007. Absence of population structuring in Zimbabwe
chicken ecotypes inferred using microsatellite analysis. Animal Genetics 38: 332-339.
Nei M. 1972. Genetic distance between populations. American Naturalist 106: 283-292.
NIAS (National Institute of Animal Sciences). 2000. Project “Vietnam livestock genetic
resources conservation: Background - Methodology - Activity - Achievement -
Programs”. http://www.vcn.vnn.vn. Accessed on 12/01/2010.
Oka T., Ino Y., Nomura K., Kawashima S., Kuwayama T., Hanada H., Amano T., Takada
M., Takahata N., Hayashi Y. and Akishinonomiya F. 2007. Analysis of mtDNA
sequences shows Japanese native chickens have multiple origins. Animal Genetics 38:
287-293.
Pinent T., Simianer H. and Weigend S. 2005. Weitzman’s approach and conservation of
breed diversity: First application to German chicken breeds. Proceeding of the Role of
Biotechnology, Rome, Italy. http://www.fao.org/biotech/docs/pinent.pdf assessed on
05/01/2010.
Pritchard J.K., Stephens M. and Donnerly P. 2000. Inference of population structure
using multicocus genotype data. Genetics 155: 945-959.
Reist-Marti S.B., Simianer H., Gibson J., Hanotte O. and Rege J.E.O. 2003. Analysis of
the actual and expected future diversity of African cattle breeds using the Weitzman
approach. Conservation Biology 17: 1299-1311.
1st CHAPTER General introduction
29
Reynolds J., Weir B.S. and Cockerham C.C. 1983. Estimation of the coancestry
coefficient: Basis for a Short-Term Genetic Distance. Genetics 105: 767-779.
Romanov M.N., Wezyk S., Cywa-Benko K. and Sakhatsky N.I. 1996. Poultry genetic
resources in the countries of Eastern Europe - history and current state. Poultry Avian
Biology 7: 1-29.
Rosenberg N.A., Burke T., Elo K., Feldman M.W., Freidlin P.J., Groenen M.A., Hillel J.,
Mäki-Tanila A., Tixier-Boichard M., Vignal A., Wimmers K. and Weigend S. 2001.
Empirical evaluation of genetic clustering methods using multilocus genotypes from
20 chicken breeds. Genetics 159: 699-713.
Silva P., Guan X., Ho-Shing O., Jones J., Xu J., Hui D., Notter D. and Smith E. 2008.
Mitochondrial DNA-based analysis of genetic variation and relatedness among Sri
Lankan indigenous chickens and the Ceylon junglefowl (Gallus lafayetti). Animal
Genetics 40: 1-9.
Simianer H. 2002. Noah’s dilemma: which breeds to take aboard the ark? Proceeding of
the 7th World Congress on Genetics Applied to Livestock Production, CD-Rom
Communication No. 26-02.
Simianer H. 2005. Decision making in livestock conservation. Ecological Economics 53:
559-572.
Simianer H., Reist-Marti S.B., Gibson J., Hanotte O. and Rege J.E.O. 2003. An approach
to the optimal allocation of conservation funds to minimize loss of genetic diversity
between livestock breeds. Ecological Economics 45: 377-392.
Sodhi M., Mukesh M., Mishra B.P., Prakash B., Ahlawat S.P.S. and Mitkari K.R. 2005.
Evaluation of genetic differentiation in Bos indicus cattle breeds from Marathwada
region of India using microsatellite polymorphism. Animal Biotechnology 16: 127-
137.
Su V.V., Thien N.V., Nhiem D.T., Ly V.L., Hai N.V. and Tieu H.V. 2004. Atlas of farm
animal breeds in Vietnam. Agricultural Publisher, Hanoi, Vietnam.

1st CHAPTER General introduction
30
Tapio I., Varv S., Bennewitz J., Maleviciute J., Fimland E., Grislis Z., Meuwissen T.H.E.,
Miceikiene I., Olsaker I., Viinalass H., Vilkki J. and Kantanen J. 2006. Prioritization
for conservation of northern European cattle breeds based on analysis of
microsatellite data. Conservation Biology 20: 1768-1769.
Tautz D. 1989. Hypervariability of simple sequences as a general source for polymorphic
DNA markers. Nucleic Acids Research 17: 6463-6471.
Tieu H.V., Ly L.V., Sat L.V. and Su V.V. 2008. Vietnamese livestock genetic resources
conservation & exploitation from 1990 to 2007. Vietnamese Journal of Animal
Science and Technology special volume: 1-10.
Tixier-Boichard M., Bordas A. and Rognon X. 2009. Characterisation and monitoring of
poultry genetic resources. World's Poultry Science Journal 65: 272-285.
Tung D.X. and Rasmussen S. 2005. Production function analysis for smallholder semi-
subsistence and semi-commercial poultry production systems in three agro-ecological
regions in Northern provinces of Vietnam. Livestock Research for Rural Development
17. http://www.lrrd.org/lrrd17/6/tung17069.htm. Accessed on 12/01/2010.
Vang N.D. 2003. The Vietnam national country report on animal genetic resources.
hftp://ftp.fao.org/docrep/fao/011/a1250f/annexes/CountryReports/Vietnam.pdf.
Accessed on 15/01/2010.
Weigend S. and Romanov M.N. 2001. Current strategies for the assessment and
evaluation of genetic diversity in chicken resources. World’s Poultry Science Journal
57: 257-288.
Weitzman M.L. 1992. On diversity. Quarterly Journal of Economics CVII: 363-405.
Weitzman M.L. 1993. What to preserve? An application of diversity theory to crane
conservation. Quarterly Journal of Economics CVIII: 157-183.
Wollny C.B.A. 2003. The need to conserve farm animal genetic resources in Africa:
Should policy marker be concerned? Ecological Economics 45: 341-351.

1st CHAPTER General introduction
31
Wright S. 1969. Evolution and the genetics of population. The theory of gene frequency,
university of Chigago, Chigago, USA.
Zerabruk M., Benewitz J., Kantanen J., Olsaker I. and Vangen O. 2007. Analysis of
genetic diversity and conservation priorities for six north Ethiopian cattle breeds.
Journal of Animal Breeding and Genetics 124: 236-241.

2nd CHAPTER Microsatellite genetic diversity
32
2nd
CHAPTER
Assessing genetic diversity of Vietnamese local chicken breeds using
microsatellites
N. T. K. Cuc1,2,3, H. Simianer1, H. Eding2, H. V. Tieu3, V. C. Cuong3, C. B. A. Wollny4,
L. F. Groeneveld2 and S. Weigend2
1Department of Animal Sciences, Animal Breeding and Genetics Group, Georg-August-
Universität Göttingen, Göttingen, Germany, 2Institute of Farm Animal Genetics,
Friedrich- Loeffler-Institut, Neustadt-Mariensee, Germany, 3National Institute of Animal
Sciences , Hanoi, Vietnam. 4Faculty of Life Sciences, University of Applied Sciences
Bingen, Bingen, Germany
Animal Genetics (in press)

2nd CHAPTER Microsatellite genetic diversity
33
Summary
This study aims to assess genetic diversity within and between nine Vietnamese local
chicken breeds and two Chinese breeds included for comparison. Genotyping 29
microsatellites revealed high diversity of both Vietnamese and Chinese breeds. Cluster
analysis using the STRUCTURE software suggested six clusters as most likely grouping
of the 11 breeds studied. These groups encompassed four homogeneous clusters, one
formed by the two Chinese breeds and the other three representing a single breed each:
the Mekong Delta breed Ac, the South Central Coast breed Choi, and the Red River Delta
breed Dong Tao. The six remaining breeds formed two additional admixed clusters.
Keywords: genetic diversity, phylogenetic structure, Vietnamese local chickens,
microsatellites.
Introduction
In Vietnam chicken population was estimated 152.7 millions in 2006. The distribution
varies considerably. In the northern part, it ranges from 2.9 million in the Northwest to
40.6 million birds in the Red River Delta while in the southern part, a total of 9.6 million
and 19.8 million chickens was found in the South Central Coast and the Mekong Delta,
respectively (Desvaux et al., 2008). According to Hong Hanh et al. (2007), more than
70% of the country’s total chicken population are local chickens. Vietnamese local
chicken breeds are defined mainly based on phenotypic characteristics. Little is known
about the genetic relationships between them. The quantification of genetic diversity is a
prerequisite to develop effective conservation programs, and molecular markers have
been shown to provide useful information (Soller et al., 2006). Recent studies of
Vietnamese chicken populations employing microsatellite data showed high diversity and
no population substructure (Cuc et al., 2006 and Berthouly et al., 2009). However, these
studies were limited to a single district (Mai Son of the Son La Province, Cuc et al.,
2006) or region (Ha Giang province, Berthouly et al., 2009).
To achieve a more comprehensive picture of the genetic diversity of Vietnamese
chickens, the current study was carried out on a wider range of local Vietnamese breeds

2nd CHAPTER Microsatellite genetic diversity
34
kept across the country. This study assesses the degree of diversity within and
relationships between nine of 11 Vietnamese local chicken breeds recorded by FAO
(DAD-IS, http://dad.fao.org). The H’mong breed was included in the study of Cuc et al.
(2006) while eight additional Vietnamese local chicken breeds were added. These nine
breeds are located in eight different districts in four agro-ecological zones from both the
southern and northern parts of Vietnam (Table 1) which were reported as areas of origin
or current distribution of the populations under study (Su et al., 2004). On average, blood
from 32 randomly selected individuals per breed was collected by sampling one male and
one female per household. Except for Te breed which only eight samples collected from
four households due to their rareness and the other 24 samples were sampled from
conservation flock at the National Institute of Animal Sciences (NIAS). Two Chinese
breeds (16 males and 16 females per breed), the Tam Hoang and Luong Phuong, were
included for comparison. These breeds were imported into Vietnam in 1995 and 2003,
respectively, and have been kept as conservation flocks at the NIAS. They are most
common exotic breeds kept as scavenging chickens in Vietnam and it is assumed that
Chinese chickens from NIAS have been introgressed to Vietnamese local chicken gene
pool (Tieu et al., 2008). DNA polymorphism was assessed by genotyping a total of 353
individuals at 29 microsatellite loci as described by Granevitze et al. (2007).
Genetic diversity was assessed by calculating the number of alleles per breed, and
expected and observed heterozygosities with the FSTAT software (Goudet, 2001).
Population structure was determined using the Bayesian model-based clustering as
implemented in the STRUCTURE software (Pritchard et al., 2000). Individuals were
grouped into a predefined number of K clusters (2 ≤ K ≤ 8) with 100 independent runs for
each K value. The SIMCOEFF software (Rosenberg et al., 2002) was used to compare
repeated runs. Solutions with a similarity coefficient higher than 95% were considered as
identical. The most frequent solution was visualised using DISTRUCT software
(Rosenberg, 2004). In addition, the approach developed by Evanno et al. (2005) was
applied from K = 2 to K = 9 to determine the optimal number of clusters.
The average number of 6.09 ± 0.67 alleles per breed and the average expected
heterozygosity of 0.634 ± 0.034 in the current study are in agreement with previous
findings which indicated high diversity of Vietnamese chickens (Table 1). Analysing a
wide range of chicken populations originating from various continents and management

2nd CHAPTER Microsatellite genetic diversity
35
systems, Granevitze et al. (2007) found mean allele numbers and expected heterozygosity
estimates per population varying from 2.30 to 6.72 and 0.28 to 0.67, respectively, with
the Vietnamese H’mong breed being the most variable one. Berthouly et al. (2009)
reported that the mean expected heterozygosity of Vietnamese chickens in the Ha Giang
province was 0.62, while the corresponding values for Red Jungle Fowl, Chinese and
commercial breeds were 0.60, 0.47 and 0.40, respectively.
The results of the STRUCTURE analysis from K = 2 to K = 6 are shown in Figure 1.
Except for K = 2, the highest repeatability of identical runs, as identified by SIMCOEFF,
was at K = 6, and declined strongly at higher K values (data not shown). Using the
method developed by Evanno et al. (2005) also identified six clusters as most probable
solution. These clusters encompassed four homogenous; one formed by the two Chinese
breeds and another three representing a single breed each: the Mekong Delta breed Ac,
the South Central Coast breed Choi and the Red River Delta breed Dong Tao. The other
two admixed clusters included the six remaining breeds, in which the Mekong Delta
breed Tau Vang showed an admixture between two Chinese and Vietnamese local breeds.
This finding is consistent with the Chinese origin of Tau Vang chickens (Linh, 2005).
For all K values, the two Chinese breeds clustered separately from the Vietnamese local
chicken breeds indicating that the Vietnamese local chicken breeds make up a gene pool
which is different from the two Chinese ones. Within Vietnam, the chicken breeds from
the northern part make up one unstructured gene pool. This is in agreement with previous
studies (Cuc et al., 2006 and Berthouly et al., 2009). In contrast, differentiation of the
Vietnamese chicken breeds are observed between the northern part and South Central
Coast as well as Mekong Delta, indicating sub-structuring of the Vietnamese chicken
breeds related to their distant geographical distribution.

2nd CHAPTER Microsatellite genetic diversity
36
Table 1. The average number of alleles/locus, expected (HE) and observed (HO) heterozygosity of nine Vietnamese and two Chinese breeds.
Breed Agro-ecological zone Study area No. of blood
samples
Alleles/locus HE ± SD Ho ± SD
Vietnamese H’mong Northwest Mai Son, Son La 31 6.48 ± 3.07 0.657 ± 0.028 0.633 ± 0.016
Mia Duong Lam, Ha Tay 32 6.69 ± 3.43 0.646 ± 0.033 0.610 ± 0.016
Ri Hoai Duc, Ha Tay 32 7.14 ± 3.81 0.648 ± 0.031 0.606 ± 0.016
Ho Thuan Thanh, Bac Ninh 32 5.76 ± 2.64 0.618 ± 0.034 0.564 ± 0.016
Dong Tao Khoai Chau, Hung Yen 32 5.31 ± 0.36 0.573 ± 0.035 0.548 ± 0.016
Ba Vi, Ha Tay 32 5.55 ± 2.32 0.635 ± 0.029 0.595 ± 0.016
Te
Red River Delta
NIAS
Choi South Central Coast Ninh Hoa, Khanh Hoa 33 5.66 ± 2.98 0.623 ± 0.035 0.645 ± 0.016
Ac 32 5.48 ± 2.50 0.610 ± 0.033 0.608 ± 0.016
Tau Vang
Mekong Delta Tan an, Long An
33 6.72 ± 3.27 0.696 ± 0.021 0.563 ± 0.016
Mean
32 6.09 ± 0.67 0.634 ± 0.034 0.600 ± 0.033
Chinese Luong Phuong 32 5.21 ± 2.23 0.680 ± 0.023 0.657 ± 0.017
Tam Hoang
(imported from
China)
NIAS
32 4.48 ± 1.77 0.627 ± 0.023 0.606 ± 0.016
Mean 32 4.85 ± 0.52 0.654 ± 0.037 0.632 ± 0.036
Key: NIAS = National Institute of Animal Sciences

2nd CHAPTER Microsatellite genetic diversity
37
Figure 1. Substructure of nine Vietnamese local and two Chinese chicken populations.
Number in parenthesis is the number of identical solutions of 100 repeats within each
number of K clusters at 95% threshold.
Key: TE_VN = Te; HM_VN = H’mong; MIA_VN = Mia; RI_VN = Ri; HO_VN = Ho;
DT_VN = Dong Tao; CHOI_VN = Choi; AC_VN = Ac; TV_VN = Tau Vang; LP_Ex =
Luong Phuong; TH_Ex = Tam Hoang.
Acknowledgements
The authors express sincere thanks to the Vietnamese farmers for providing samples and
to A. Weigend and A. Flörke, Institute of Farm Animal Genetics at Mariensee, for
technical assistance. N.T.K. Cuc had a stipend from German Academic Exchange
Service, and the project was funded by the German Federal Ministry of Education and
Research.

2nd CHAPTER Microsatellite genetic diversity
38
References
Berthouly C., Leroy G., Van T.N., Thanh H.H., Bed'Hom B., Nguyen B.T., Vu C.C.,
Monicat F., Tixier-Boichard M., Verrier E., Maillard J. and Rognon X. 2009. Genetic
analysis of local Vietnamese chickens provides evidence of gene flow from wild to
domestic populations. BMC Genetics 10:1.
Cuc N.T.K., Muchadeyi F.C., Baulain U., Eding H., Weigend S. and Wollny C.B.A.
2006. An assessment of genetic diversity of Vietnamese H’mong chickens.
International Journal of Poultry Sciences 5: 912-920.
Desvaux S., Ton V.D., Thang P.D. and Hoa P.T.T. 2008. A general review and a
description of the poultry production in Vietnam. Agricultural Publisher, Hanoi,
Vietnam.
Evanno G., Regnaut S. and Goudet J. 2005. Detecting the number of clusters of
individuals using the software STRUCTURE: a simulation study. Molecular Ecology
14: 2611-2620.
Goudet J. 2001. FSTAT, a program to estimate and test gene diversities and fixation
indices (version 2.9.3.2). http://www2.unil.ch/popgen/softwares/fstat.htm.
Granevitze Z., Hillel J., Chen G.H., Cuc N.T.K., Feldman M., Eding H. and Weigend S.
2007. Genetic diversity within chicken populations from different continents and
management histories. Animal Genetics 38: 576-583.
Hong Hanh P.T., Burgos S. and Roland-Holst D. 2007. The Poultry Sector in Vietnam:
Prospects for Smallholder Producers in the Aftermath of the HPAI Crisis. Food and
Agriculture Organization of the United Nations, Pro-Poor Livestock Policy Initiative
(PPLPI) Research Report, August 2007.
Linh V.T. 2005. The world of rare chickens in Vietnam. Vietbao Newspaper (issued on
February 11st ), Vietnam.
Pritchard J.K., Stephens M. and Donnerly P. 2000. Inference of population structure
using multicocus genotype data. Genetics 155: 945-959.
2nd CHAPTER Microsatellite genetic diversity
39
Rosenberg N.A. 2004. Distruct: a program for the graphical display of population
structure. Molecular Ecology Notes 4: 137-138.
Rosenberg N.A., Pritchard J.K., Weber J.L., Cann H.M., Kidd K.K., Zhivotovsky L.A.
and Feldman M.W. 2002. Genetic structure of human populations. Science 298: 2381-
2385.
Soller M., Weigend S., Romanov M.N., Dekkers J.C.M. and Lamont S.J. 2006. Strategies
to assess structural variation in the chicken genome and its associations with
biodiversity and biological performance. Poultry Science 85: 2061-2078.
Su V.V., Thien N.V., Nhiem D.T., Ly V.L., Hai N.V. and Tieu H.V. 2004. Atlas of farm
animal breeds in Vietnam. Agricultural Publisher, Hanoi, Vietnam.
Tieu H.V., Ly L.V., Sat L.V. and Su V.V. 2008. Vietnamese livestock genetic resources
conservation & exploitation from 1990 to 2007. Vietnamese Journal of Animal
Science and Technology special volume: 1-10.
3rd CHAPTER Mitochondrial DNA genetic diversity
40
3rd
CHAPTER
Multiple maternal lineages of Vietnamese local chickens inferred by
mitochondrial DNA D-loop sequences
N. T. K. Cuc1,2, H. Simianer1, L. F. Groeneveld2 and S. Weigend2
1Department of Animal Sciences, Animal Breeding and Genetics Group, Georg-August-
Universität Göttingen, Göttingen, Germany, 2Institute of Farm Animal Genetics,
Friedrich-Loeffler-Institut, Neustadt-Mariensee, Germany.
Submitted for publication
3rd CHAPTER Mitochondrial DNA genetic diversity
41
Summary
In this study, mitochondrial DNA (mtDNA) sequence polymorphism was used to assess
genetic diversity of nine Vietnamese local chicken breeds. In addition, two Chinese
breeds kept in Vietnam were included in the analysis for comparison. A 455-bp fragment
of the mtDNA D-loop region was sequenced in 222 chickens of these 11 breeds. As
reference, a skeleton was constructed based on chicken mtDNA sequences taken from the
Genbank. Haplotypes of the nine Vietnamese local and two Chinese breeds were aligned
together with these sequences. The Vietnamese and Chinese breeds showed a high degree
of variability. In total, 37 haplotypes were identified in the chicken breeds studied
forming eight clades. Thereby, the majority of individuals of the two Chinese breeds
grouped together in one clade which is assumed to have its roots in the Indian
subcontinent. Although the Vietnamese chicken breeds were distributed across all eight
clades, most of them clustered in three main clades. These results suggest that the
Vietnamese domestic chickens have originated from multiple maternal lineages,
presumably originating from Yunnan and adjacent areas in China, South and Southwest
China and/or surrounding regions (i.e., Vietnam, Burma, Thailand, and India).
Keywords: mitochondrial DNA, Vietnamese local chickens, maternal lineages.
Introduction
Mitochondrial DNA is considered as a powerful source of molecular information to track
the ancestry of breeds back hundreds of generations (Harpending et al., 1998). Different
hypotheses about chicken domestication based on mtDNA analyses are found in the
literature. Fumihito et al. (1996) suggested a monophyletic origin of domestic chickens
from Gallus gallus gallus and a single domestication event occurred in Thailand and
adjacent regions while Kanginakudru et al. (2008) found evidence for domestication of
Indian chickens from Gallus gallus spadiceus and Gallus gallus gallus as well as from
Gallus gallus murghi. A study that analyzed BCDO2, a gene encoding an enzyme which
converts carotene into its colourless variant, suggested the introgression of the yellow
skin gene from Gallus sonneratii into modern chicken breeds (Eriksson et al., 2008).
Other reports assumed multiple and independent domestication events in South China,

3rd CHAPTER Mitochondrial DNA genetic diversity
42
Southeast Asia and the Indian subcontinent (Liu et al., 2006 and Oka et al., 2007). Liu et
al. (2006) revealed nine divergent clades (named clades A–I) related to geographical
distribution in a wide range of domestic chickens in Eurasian regions. Oka et al. (2007)
identified seven clades (named clades A-G) observed in the Japanese chickens. Of the
seven clades of Oka et al. (2007), the four clades A, B, C and E are identical to clades E,
A, D and B described by Liu et al. (2006) , respectively.
Vietnam is located in Southeast Asia having a common border of 1 350 km with Southern
China (GSO, 2008). Human migration from Southern China to Vietnam enabled
introduction of Chinese chickens to Vietnam (Taylor, 1983; Nyiri and Saveliev, 2002). In
addition, during the recent years, some exotic breeds were imported. Farmers' preferences
for exotic breeds with high performance may have led to introgression of exotic breeds
into the Vietnamese gene pool (Tieu et al., 2008). Little is known, however, about the
origin and the history of Vietnamese domestic chickens. Some recent studies based on
microsatellite markers showed sub-structuring of Vietnamese chickens (Cuc et al., 2010)
and a close relationship between the Vietnamese chickens of the Ha Giang province with
Red Jungle fowl populations (Berthouly et al., 2009). Based on mtDNA analysis, Liu et
al. (2006) found the distribution of the Vietnamese chicken samples in two different
clades. The latter study, however, was based only on a small number (n = 3) of
Vietnamese chicken samples. The current study aims to determine the degree of shared
maternal mtDNA haplotypes between Vietnamese local chicken breeds, and hence to
reveal maternal lineages of origin.
Materials and methods
Populations and blood sampling
The study was carried out in nine Vietnamese local chicken breeds. These breeds are
located in eight different districts in four agro-ecological zones from both the southern
and northern parts of Vietnam. The Ho breed was kept in only one village (Ho Village) in
the Red River Delta in the North whereas the Ri and Tau Vang breeds are raised in almost
every household in the North and in the South, respectively. Two breeds, Dong Tao and
Mia, are kept in the Red River Delta. The Te chickens are assumed to carry a dwarf gene.

3rd CHAPTER Mitochondrial DNA genetic diversity
43
However, information on the distribution of these chickens in Vietnam is not available.
The Choi chickens are game birds reared at many places across the country. The Ac and
H’mong chickens, mainly kept in the South and North, respectively, are used for making
traditional tonics to treat old or sick people. The Tam Hoang and Luong Phuong Chinese
breeds, which were included for comparison were imported into Vietnam in 1995 and
2003, respectively, and have been kept as conservation flocks at the National Institute of
Animal Sciences (NIAS) since that time. On average, blood samples were taken from 20
randomly selected individuals per Vietnamese breed. Thereby, one male and one female
were sampled per household. In addition, blood samples from 21 birds of each of the
Chinese breeds were collected.
MtDNA amplification and sequencing
A fragment of 455 bp from the mtDNA D-loop region was amplified using primers
mtGlu-F (5'-GGCTTGAAAAGCCATTGTTG-3') and mtGlu-R (5'-CCCAAAAAGAGA
AGGAACC-3'). Due to their circular nature, these primers are positioned at bases 16739
– 16775 (forward primer) and 649 – 668 (reverse primer) of the complete mtDNA
sequence of domestic chickens (X52392, Desjardins and Morais, 1990). PCR
amplifications and sequencing were done as described by Muchadeyi et al. (2008). To
align DNA sequences, AlignIR software was used (LICOR Inc. Nebraska, USA). The list
of sequences used in this study and the corresponding GenBank accession numbers are
provided in Table S1.
Statistical analysis
The position and number of polymorphic sites as well as corresponding haplotypes were
calculated using MEGA v. 3.1 (Kumar et al., 2004). The distribution of haplotypes in the
samples was computed using TCS v. 1.2.1 (Clement et al., 2000). Median joining
networks of haplotypes were constructed following the algorithm of Bandelt et al. (1995)
and using NETWORK v. 4.5.1.0 (http://www.fluxus-engineering.com/sharenet.htm). As
reference, network analysis was used first to create a skeleton which was based on the
most frequent haplotypes of the nine clades of Liu's network (Liu et al., 2006) and the
three additional clades (D, G and F) of Oka et al. (2007). This skeleton assigns clades to
suggested regions of domestication in chickens, which were Yunnan and/or surrounding

3rd CHAPTER Mitochondrial DNA genetic diversity
44
areas (Liu’s clades A, B, F and G), South and Southwest China and/or surrounding areas
and Southeast Asia (Liu’s clade C, D, H, I and Oka’s clade D, F, G), and the Indian
subcontinent (Liu’s clade E). Nomenclatures of the nine clades reported by Liu et al.
(2006) were used as reference for the clade notation in this study. The sequences used for
alignment consisted of 455 bp. Various networks were constructed by using different
epsilon (ε) values ranging from zero to 20. There were no considerable differences among
the different networks except a slight increase in the network connections where clades
joined. The median network presented used an epsilon value of 5. The haplotype and
nucleotide diversities of breeds were computed using ARLEQUIN v. 3.1 (Excoffier et al.,
2006).
To analyse if mtDNA clades also differed at the autosomal level, the data obtained from
genotyping 29 microsatellite markers of these 222 individuals (Cuc at al., 2010) was
used. These individuals were labelled according to their clade affiliation based on
mtDNA sequences. The microsatellite genotyping data were used in the Bayesian model-
based clustering as implemented in STRUCTURE v. 2.3.1 to cluster individuals to a
varying number of K clusters (2 ≤ K ≤ 8) (Pritchard et al., 2000). Runs within each K-
value showing a similarity coefficient of 0.95 and higher were considered as identical.
Results
Network profiles of the clades
The distribution of clades is shown in Figure 1. Eight clades A to G, and I were found in
the chicken breeds studied. Clades A, B and E were the most frequent whereas clades F,
G and I consisted of a small number of individuals only. Within each of three clades A, B
and E, the major haplotypes were A1, B1 and E1 encompassing 70%, 77% and 57% of
each clade, respectively. The major haplotype of clade D was D1, of which 50% was
observed in the Choi breed (Table S2).
Breed distribution within clades
The Vietnamese local chickens were found in all eight clades (Figure 1). The distribution
of the Vietnamese breeds into clades was not related to their geographical distribution.

3rd CHAPTER Mitochondrial DNA genetic diversity
45
The most frequent clades A and B included all nine Vietnamese breeds. A considerable
proportion of Vietnamese local chickens belonged to clade D while only a small number
of Vietnamese chicken was assigned to the five remaining clades (C, E, F, G and I). In
contrast, the majority (76%) of Chinese chickens were found in clade E whereas no
Chinese chickens were observed in clades D, G, F and I.
Figure 1. Median network profile of the mtDNA D-loop haplotypes observed in the
current study. Data merged with sequences of major haplotypes reported by Liu et al.
(2006) and Oka et al. (2007). The circle size corresponds to haplotype frequency, and the
numbers on the line correspond to mutational positions connecting haplotypes. Empty
circles are median vectors used in connecting indirectly related haplotypes.
Within-population diversity
Eight clades (A-G and I) were formed by 37 haplotypes, of which 25 were only found in
the Vietnamese local breeds, six haplotypes were observed exclusively in the Chinese
breeds, and the remaining six haplotypes were common (Table S3). The lowest haplotype
diversity (0.615 ± 0.105) was estimated in the Ho breed, while the highest corresponding
value (0.942 ± 0.034) was observed in the Tau Vang breed (Table 1).
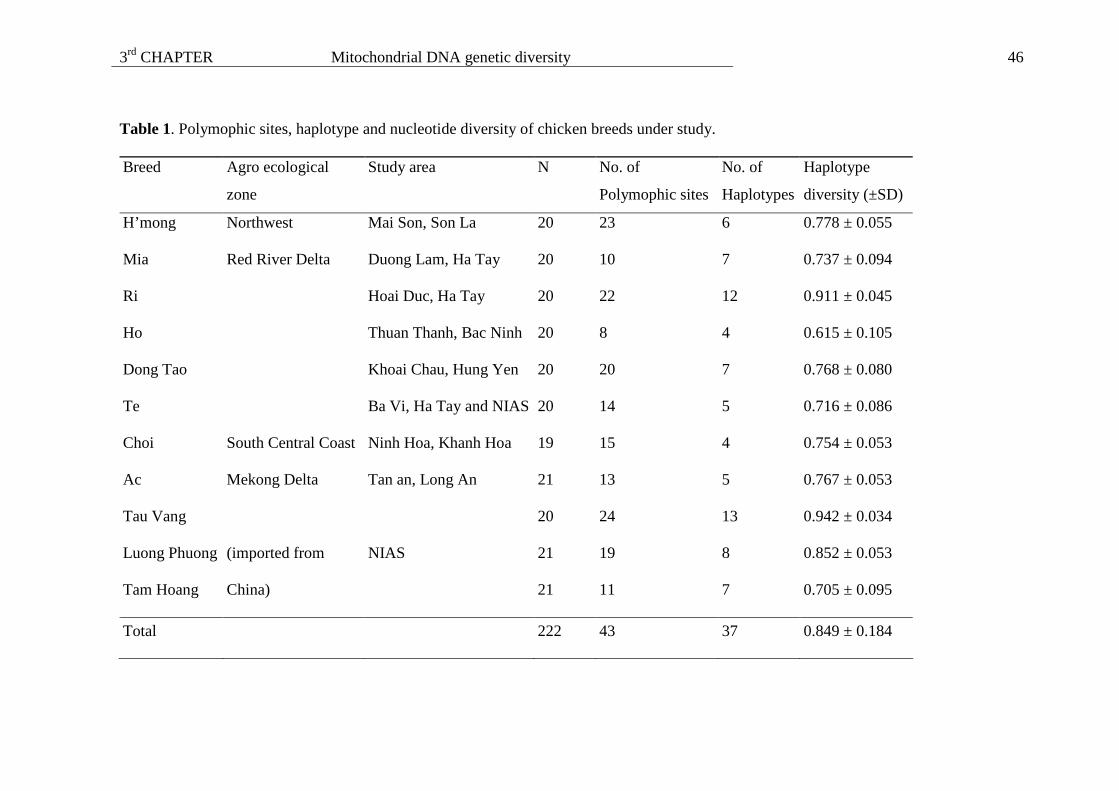
3rd CHAPTER Mitochondrial DNA genetic diversity
46
Table 1. Polymophic sites, haplotype and nucleotide diversity of chicken breeds under study.
Breed Agro ecological
zone
Study area N No. of
Polymophic sites
No. of
Haplotypes
Haplotype
diversity (±SD)
H’mong Northwest Mai Son, Son La 20 23 6 0.778 ± 0.055
Mia Duong Lam, Ha Tay 20 10 7 0.737 ± 0.094
Ri Hoai Duc, Ha Tay 20 22 12 0.911 ± 0.045
Ho Thuan Thanh, Bac Ninh 20 8 4 0.615 ± 0.105
Dong Tao
Red River Delta
Khoai Chau, Hung Yen 20 20 7 0.768 ± 0.080
Te Ba Vi, Ha Tay and NIAS 20 14 5 0.716 ± 0.086
Choi South Central Coast Ninh Hoa, Khanh Hoa 19 15 4 0.754 ± 0.053
Ac 21 13 5 0.767 ± 0.053
Tau Vang
Mekong Delta Tan an, Long An
20 24 13 0.942 ± 0.034
Luong Phuong 21 19 8 0.852 ± 0.053
Tam Hoang
(imported from
China)
NIAS
21 11 7 0.705 ± 0.095
Total 222 43 37 0.849 ± 0.184

3rd CHAPTER Mitochondrial DNA genetic diversity
47
Relationship between mtDNA and autosomal genetic structure
The results of the STRUCTURE analysis from K = 2 to K = 6 are shown in Figure 2. The
repeatability, i.e., the number of runs giving result with similarity coefficient ≥ 0.95,
varied from 34 to 100 from K = 2 to K = 6, while no identical runs were found at K = 7
and 8 (data not shown). For all K values, the mtDNA defined clade E was found as a pure
cluster at the autosomal level while the other seven mtDNA defined clades were mixed to
different degrees (Figure 2).
Figure 2. STRUCTURE based clustering using microsatellite genotypes of chicken
groups assigned to eight mtDNA clades. Individuals are labelled according to their clade
affiliation based on mtDNA sequences. Number in parenthesis is the number of runs
giving an identical result (similarity coefficient ≥ 0.95).
Discussion
The majority of the Vietnamese local chickens carried mtDNA haplotypes that clustered
in clades A and B. Based on the skeleton of supposed regions of domestication, this
finding suggests the existence of two maternal lineages dominating in the Vietnamese
local chickens which presumably originate from Yunnan and surrounding regions in
China (Liu et al., 2006). Fourteen percent of Vietnamese chickens were found in clade D
indicating that this clade also contributed considerably to the Vietnamese local chickens.
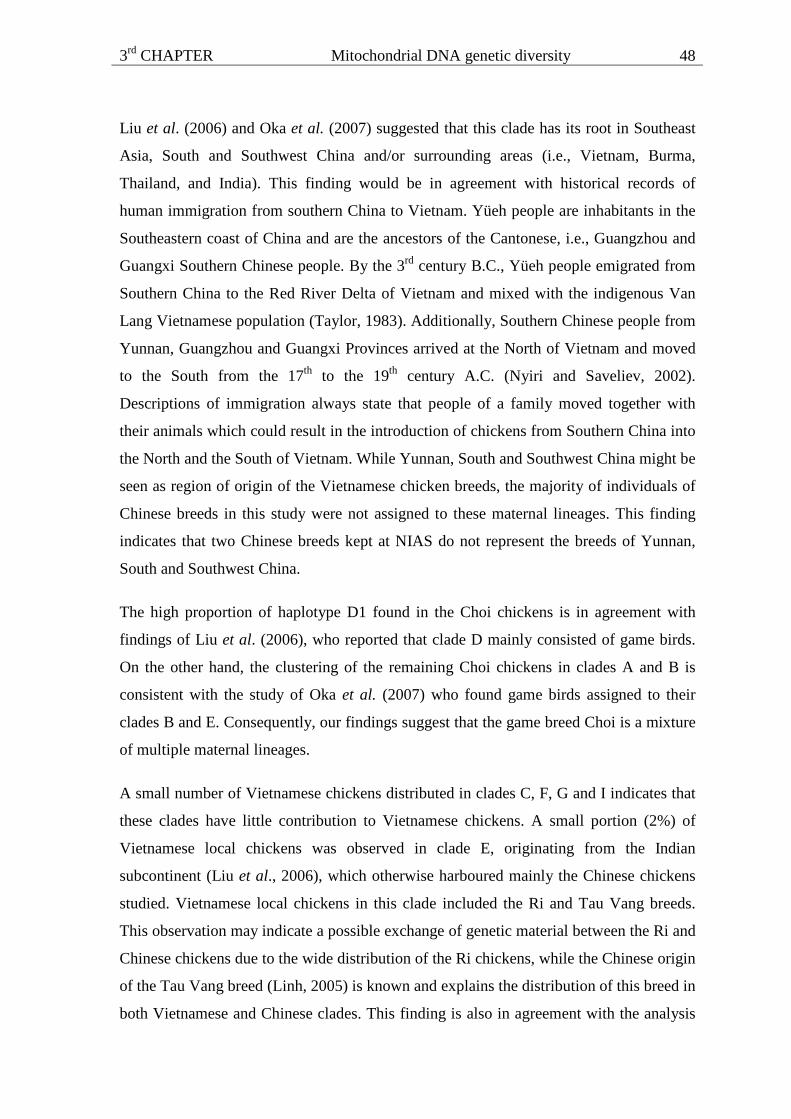
3rd CHAPTER Mitochondrial DNA genetic diversity
48
Liu et al. (2006) and Oka et al. (2007) suggested that this clade has its root in Southeast
Asia, South and Southwest China and/or surrounding areas (i.e., Vietnam, Burma,
Thailand, and India). This finding would be in agreement with historical records of
human immigration from southern China to Vietnam. Yüeh people are inhabitants in the
Southeastern coast of China and are the ancestors of the Cantonese, i.e., Guangzhou and
Guangxi Southern Chinese people. By the 3rd century B.C., Yüeh people emigrated from
Southern China to the Red River Delta of Vietnam and mixed with the indigenous Van
Lang Vietnamese population (Taylor, 1983). Additionally, Southern Chinese people from
Yunnan, Guangzhou and Guangxi Provinces arrived at the North of Vietnam and moved
to the South from the 17th to the 19th century A.C. (Nyiri and Saveliev, 2002).
Descriptions of immigration always state that people of a family moved together with
their animals which could result in the introduction of chickens from Southern China into
the North and the South of Vietnam. While Yunnan, South and Southwest China might be
seen as region of origin of the Vietnamese chicken breeds, the majority of individuals of
Chinese breeds in this study were not assigned to these maternal lineages. This finding
indicates that two Chinese breeds kept at NIAS do not represent the breeds of Yunnan,
South and Southwest China.
The high proportion of haplotype D1 found in the Choi chickens is in agreement with
findings of Liu et al. (2006), who reported that clade D mainly consisted of game birds.
On the other hand, the clustering of the remaining Choi chickens in clades A and B is
consistent with the study of Oka et al. (2007) who found game birds assigned to their
clades B and E. Consequently, our findings suggest that the game breed Choi is a mixture
of multiple maternal lineages.
A small number of Vietnamese chickens distributed in clades C, F, G and I indicates that
these clades have little contribution to Vietnamese chickens. A small portion (2%) of
Vietnamese local chickens was observed in clade E, originating from the Indian
subcontinent (Liu et al., 2006), which otherwise harboured mainly the Chinese chickens
studied. Vietnamese local chickens in this clade included the Ri and Tau Vang breeds.
This observation may indicate a possible exchange of genetic material between the Ri and
Chinese chickens due to the wide distribution of the Ri chickens, while the Chinese origin
of the Tau Vang breed (Linh, 2005) is known and explains the distribution of this breed in
both Vietnamese and Chinese clades. This finding is also in agreement with the analysis
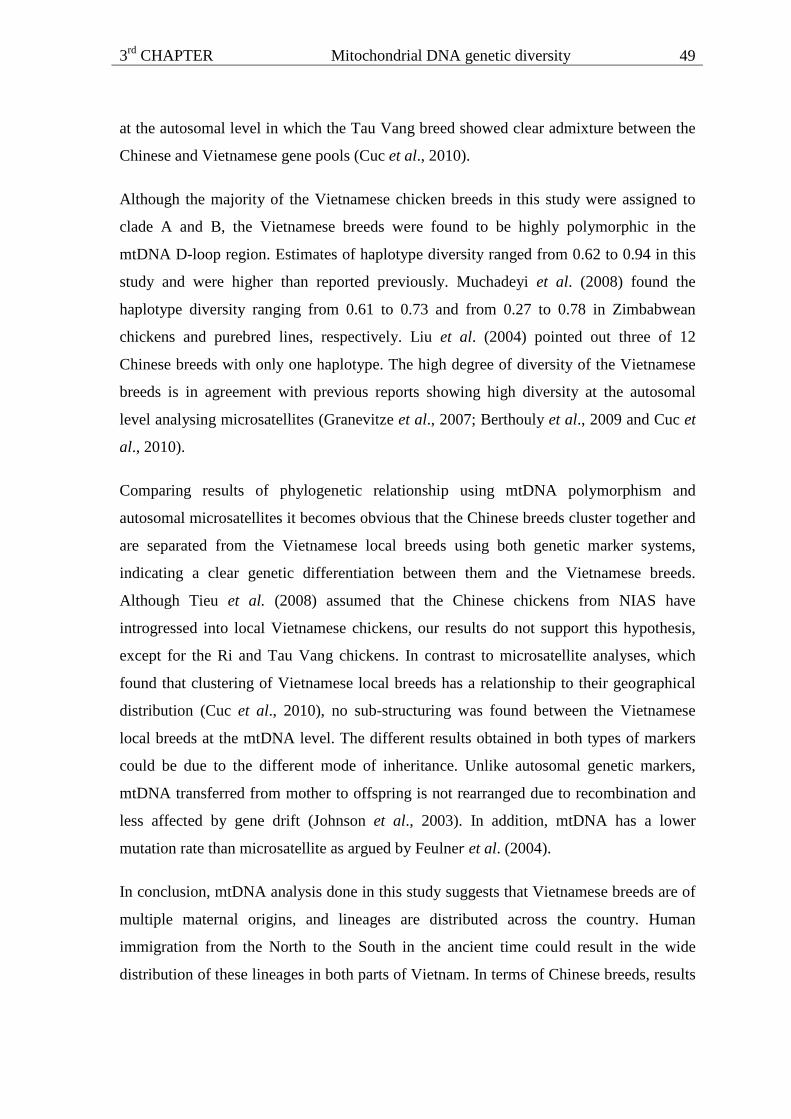
3rd CHAPTER Mitochondrial DNA genetic diversity
49
at the autosomal level in which the Tau Vang breed showed clear admixture between the
Chinese and Vietnamese gene pools (Cuc et al., 2010).
Although the majority of the Vietnamese chicken breeds in this study were assigned to
clade A and B, the Vietnamese breeds were found to be highly polymorphic in the
mtDNA D-loop region. Estimates of haplotype diversity ranged from 0.62 to 0.94 in this
study and were higher than reported previously. Muchadeyi et al. (2008) found the
haplotype diversity ranging from 0.61 to 0.73 and from 0.27 to 0.78 in Zimbabwean
chickens and purebred lines, respectively. Liu et al. (2004) pointed out three of 12
Chinese breeds with only one haplotype. The high degree of diversity of the Vietnamese
breeds is in agreement with previous reports showing high diversity at the autosomal
level analysing microsatellites (Granevitze et al., 2007; Berthouly et al., 2009 and Cuc et
al., 2010).
Comparing results of phylogenetic relationship using mtDNA polymorphism and
autosomal microsatellites it becomes obvious that the Chinese breeds cluster together and
are separated from the Vietnamese local breeds using both genetic marker systems,
indicating a clear genetic differentiation between them and the Vietnamese breeds.
Although Tieu et al. (2008) assumed that the Chinese chickens from NIAS have
introgressed into local Vietnamese chickens, our results do not support this hypothesis,
except for the Ri and Tau Vang chickens. In contrast to microsatellite analyses, which
found that clustering of Vietnamese local breeds has a relationship to their geographical
distribution (Cuc et al., 2010), no sub-structuring was found between the Vietnamese
local breeds at the mtDNA level. The different results obtained in both types of markers
could be due to the different mode of inheritance. Unlike autosomal genetic markers,
mtDNA transferred from mother to offspring is not rearranged due to recombination and
less affected by gene drift (Johnson et al., 2003). In addition, mtDNA has a lower
mutation rate than microsatellite as argued by Feulner et al. (2004).
In conclusion, mtDNA analysis done in this study suggests that Vietnamese breeds are of
multiple maternal origins, and lineages are distributed across the country. Human
immigration from the North to the South in the ancient time could result in the wide
distribution of these lineages in both parts of Vietnam. In terms of Chinese breeds, results

3rd CHAPTER Mitochondrial DNA genetic diversity
50
showed that the studied breeds are not related to Vietnamese breeds at both genetic levels
expect for Ri and Tau Vang.
Acknowledgements
The authors express sincere thanks to the Vietnamese farmers for providing chicken
samples, to A. Weigend and A. Flörke, Institute of Farm Animal Genetics at Mariensee,
for technical assistance, as well as to Prof. Dr. Clemens B.A. Wollny, Faculty of Life
Sciences, University of Applied Sciences Bingen, Germany and Prof. Dr. Hoang Van
Tieu, National Institute of Animal Sciences, Hanoi, Vietnam, for project initiative. N.T.K.
Cuc had a stipend from German Academic Exchange Service (DAAD), and the project
was funded by the German Federal Ministry of Education and Research (BMBF).
References
Bandelt H.J., Forster P., Sykes B.C. and Richards M.B. 1995. Mitochondrial portraits of
human populations using median networks. Genetics 141: 743-753.
Berthouly C., Leroy G., Van T.N., Thanh H.H., Bed'Hom B., Nguyen B.T., Vu C.C.,
Monicat F., Tixier-Boichard M., Verrier E., Maillard J. and Rognon X. 2009. Genetic
analysis of local Vietnamese chickens provides evidence of gene flow from wild to
domestic populations. BMC Genetics: 10:1.
Clement M., Posada D. and Crandall K.A. 2000. TCS: a computer program to estimate
gene genealogies. Molecular Ecology 9: 1657-1659.
Cuc N.T.K., Simianer H., Eding H., Tieu H.V., Cuong V.C., Wollny C.B.A., Groeneveld
L.F. and Weigend S. 2010. Assessing genetic diversity of Vietnamese local chicken
breeds using microsatellites. Animal Genetics (in press).
Desjardins P. and Morais R. 1990. Sequence and gene organisation of the chicken
mitochondrial genome: a novel gene order in higher vertebrates. Journal of Molecular
Biology 212: 599-634.

3rd CHAPTER Mitochondrial DNA genetic diversity
51
Eriksson J., Larson G., Gunnarsson U., Bed'hom B., Tixier-Boichard M., Strömstedt L.,
Wright D., Jungerius A., Vereijken A., Randi E., Jensen P. and Andersson L. 2008.
Identification of the Yellow Skin Gene Reveals a Hybrid Origin of the Domestic
Chicken. PLoS Genet. 4: e1000010.
Excoffier L., Laval G. and Schneider S. 2006. ARLEQUIN Version 3.01: An Integrated
Software Package for Population Genetics Data Analysis.
Feulner P.G.D., Bielfeldt W., Zachos F.E., Bradvarovic J., Eckert I. and Hartl G.B. 2004.
Mitochondrial DNA and microsatellite analyses of the genetic status of the presumed
subspecies Cervus elaphus montanus (Carpathian red deer). Heredity 93: 299-306.
Fumihito A., Miyake T., Takada M., Shingu R., Endo T., Gojobori T., Kondo N. and
Ohno S. 1996. Monophyletic origin and unique dispersalpatterns of domestic fowls.
Proc. Natl. Acad. Sci. USA 93: 6792-6795.
Granevitze Z., Hillel J., Chen G.H., Cuc N.T.K., Feldman M., Eding H. and Weigend S.
2007. Genetic diversity within chicken populations from different continents and
management histories. Animal Genetics 38: 576-583.
GSO (General Statistics Office of Vietnam) 2008. Statistical yearbook of Vietnam,
Statistic Publisher, Hanoi, Vietnam.
Harpending H.C., Batzer M.A., Gurven M., Jorde L.B., Rogers A.R. and Sherry S.T.
1998. Genetic traces of ancient demography. Proc. Natl. Acad. Sci. USA 95: 1961-
1967.
Johnson J.A., Toepfer J.F. and Dunn P.O. 2003. Contrasting patterns of mitochondrial
and microsatellite population structure fragmented populations of greater prairie-
chickens. Molecular Ecology 12: 3335-3347.
Kanginakudru S., Metta M., Jakati R.D. and Nagaraju J. 2008. Genetic evidence from
Indian red jungle fowl corroborates multiple domestication of modern day chicken.
BMC Evolutionary Biology 8: 174.

3rd CHAPTER Mitochondrial DNA genetic diversity
52
Kumar S., Tamura K. and Nei M. 2004. mega3: integrated software for molecular
evolutionary genetics analysis and sequence alignment. Briefings in Bioinformatics 5:
150-163.
Linh V.T. 2005. The world of rare chickens in Vietnam. Vietbao Newspaper (issued on
February 11st), Vietnam.
Liu Y.P., Wu G.S., Yao Y.G., Miao Y.W., Luikart G., Baig M., Beja-Pereira A., Ding
Z.L., Palanichamy M.G. and Zhang Y.P. 2006. Multiple maternal origins of chickens:
out of the Asian jungles. Molecular Phylogenetics and Evolution 38: 112-119.
Liu Z.G., Lei C.Z., Luo J., Ding C., Chen G.H., Chang H., Wang K.H., Liu X.X.,
Zhang X.Y., Xiao X.J. and Wu S.L. 2004. Genetic variability of mtDNA sequences in
Chinese native chicken breeds. Asian-Australasian Journal of Animal Sciences 17:
903-907.
Muchadeyi F.C., Eding H., Simianer H., Wollny C.B.A., Groeneveld E. and Weigend S.
2008. Mitochondrial DNA D-loop sequences suggest a Southeast Asian and Indian
origin of Zimbabwean village chickens. Animal Genetics 39: 615-622.
Nyiri P. and Saveliev I. 2002. Globalizing Chinese Migration: Trends in Europe and Asia
Research in Migration and Ethnic Relations Series. Ashgate Publisher, Aldershot,
United Kingdom.
Oka T., Ino Y., Nomura K., Kawashima S., Kuwayama T., Hanada H., Amano T., Takada
M., Takahata N., Hayashi Y. and Akishinonomiya F. 2007. Analysis of mtDNA
sequences shows Japanese native chickens have multiple origins. Animal Genetics 38:
287-293.
Pritchard J.K., Stephens M. and Donnerly P. 2000. Inference of population structure
using multicocus genotype data. Genetics 155: 945-959.
Taylor K.W. 1983. The birth of Vietnam. Unverstity of California press, London, United
Kingdom.

3rd CHAPTER Mitochondrial DNA genetic diversity
53
Tieu H.V., Ly L.V., Sat L.V. and Su V.V. 2008. Vietnamese livestock genetic resources
conservation & exploitation from 1990 to 2007. Vietnamese Journal of Animal
Science and Technology special volume: 1-10.

3rd CHAPTER Mitochondrial DNA genetic diversity
54
Supplement Table S1. Haplotype names and accession numbers of chicken mtDNA
sequences used in this study.
Haplotype name Accession number Reference
A1 – A9 GU564361 - GU564369 This study
B1 – B8 GU564370 - GU564377 This study
C GU564378 This study
D1 – D5 GU564379- GU564383 This study
E1 – E9 GU564384- GU564392 This study
F GU564393 This study
G1 – G2 GU564394- GU564395 This study
I1 – I2 GU564396- GU564397 This study
Liu_A1 AB114069 Liu et al. (2006) haplotype A1
Liu_B1 AB007744 Liu et al. (2006) haplotype B1
Liu_C1 AB114070 Liu et al. (2006) haplotype C1
Liu_D1 AY588636 Liu et al. (2006) haplotype D1
Liu_E1 AB114076 Liu et al. (2006) haplotype E1
Liu_F1 AF512285 Liu et al. (2006) haplotype F1
Liu_G1 AF512288 Liu et al. (2006) haplotype G1
Liu_H1 D82904 Liu et al. (2006) haplotype H1
Liu_I1 AB009434 Liu et al. (2006) haplotype I1
Oka_D6 AB268535 Oka et al. (2007) haplotype D6
Oka_G1 AB268545 Oka et al. (2007) haplotype G1
Oka_F1 AB268543 Oka et al. (2007) haplotype F1

3rd CHAPTER Mitochondrial DNA genetic diversity
55
Supplement Table S2. Distribution of mtDNA D-loop haplotypes in nine Vietnamese
local chicken breeds and two Chinese breeds.
Hap. H’mong Mia Ri Ho Dong Tao
Te Choi Ac Tau Vang
Luong Phuong
Tam Hoang
Total
A1 6 3 4 3 1 3 3 1 3 2 29 A2 1 2 3 A3 2 2 A4 2 2 A5 1 1 A6 1 1 A7 1 1 A8 1 1 A9 1 1 B1 7 10 5 12 9 10 6 5 4 3 4 75 B2 4 2 1 3 2 3 1 16 B3 1 1 B4 1 1 B5 1 1 B6 1 1 B7 1 1 B8 1 1 C 1 1 1 3 2 1 9 D1 1 7 5 1 14 D2 8 8 D3 2 2 D4 1 1 D5 1 1 E1 2 1 7 11 21 E2 1 3 1 5 E3 3 3 E4 2 2 E5 1 1 2 E6 1 1 E7 1 1 E8 1 1 E9 1 1 F 1 4 5 G1 3 3 G2 1 1 I1 2 1 I2 1 1 Total 20 20 20 20 20 20 19 21 20 21 21 222

3rd CHAPTER Mitochondrial DNA genetic diversity
56
Supplement Table S3. Variable sites for 37 mtDNA haplotypes observed in 11 chicken
populations.
111111111 1111111222 2222222222 2222333333 333 8155667788 8899999001 1223445566 6789001112 469 5919492706 8914589683 7263684827 9424673594 398 A1 TCTAGTTTCC TAAGTCATTC CTAACCCTCC ATCATTACTA CCC A2 .......... .........T .......... .......... ... A3 .......... .......... .......... ......T..G ... A4 ...G..C... .......... .......... .......... ... A5 .......... ..G....... .......... .......... ... A6 C......... .......... .......... .......... ... A7 .......... .......... .......... ......T... ... A8 .......... ......T... .......... .......... ... A9 .T........ .......... .......... .......... ... B1 .T..A..C.. .....T.... .........T .......... ... B2 .T..A..C.. .....T.... .....T...T .......... ... B3 .T..A..C.. .....T...T .....T...T .......... ... B4 .T..A..C.. .....T.... .....T.... .......... ... B5 .T..A..C.. .....T.... .........T .....C.... ... B6 .T..A..C.. .....T.... .........T ....C..... ... B7 .T..A..C.. .....T.... ..T......T .......... ... B8 .T.....C.. .....T... .........T .......... ... C .T.....C.. ...AC...C. ...G....T. ...G...TC. ... D1 .T.....C.. ....C...CT ...G...CT. .......... ... D2 .T.....C.. ....C...C. ...G...CT. .......... T.. D3 .T.....C.. ....C...CT ...G...CT. ...G...... ... D4 .T.....C.. ....C...CT ...G...CT. .......... G.. D5 .T.....C.. ....CT..CT .C.G....T. .......... ... E1 .T...C.C.. ....C...CT ........T. .......... ..T E2 .TC..C.C.. ....C...CT ........T. .......... ..T E3 .T...C.C.. ....C...C. ........T. ..T....... ..T E4 .T...C.C.. ....C...CT ........T. ...G...... ..T E5 .T.....C.. ....C...CT ........T. .......... ..T E6 .TC....C.. ....C...CT ........T. .......... ..T E7 .TC..C.C.. ....C...CT ........T. .......... .TT E8 .T...C.C.. ....C....T ........T. .......... ... E9 .T...C.C.. ....C...CT ........T. .......... ... F .T.....C.T C...CT.CCT ........TT C......... ..T G1 .T..A..C.. ....C...CT .....AT.TT .C........ ..T G2 .T..A..C.. ....C...CT T....AT.TT .C........ ..T I1 .T..A..CT. .G..CT.... ...G....T. .....C.T.. T.. I2 .T..A..CT. .G..CT..C. ...GT...T. .....C.T.. T..
Dots indicate nucleotide positions identical to those of Haplotype A1 Numbers at the top refer to variable sites and correspond to the nucleotide positions of Haplotype A1.
4th CHAPTER Genetic diversity compared to Chinese breeds
57
4th
CHAPTER
Characterisation of the Vietnamese Chicken Gene Pool compared to
Chinese Chicken Breeds
N.T.K. Cuc1,2, H. Simianer1, H. Eding2 and S. Weigend2
1Department of Animal Sciences, Animal Breeding and Genetics Group, Georg-August-
Universität Göttingen, Göttingen, Germany, 2 Institute of Farm Animal Genetics,
Friedrich-Loeffler-Institut, Neustadt-Mariensee, Germany
Submitted for publication

4th CHAPTER Genetic diversity compared to Chinese breeds
58
Summary
The objective of this study was to characterise Vietnamese local chickens in relation to
other Asian breeds from China and wild chickens using molecular markers. The
populations collected in Vietnam encompassed nine Vietnamese local breeds and two
breeds originating from China but kept in Vietnam. As a reference, data of 14 indigenous
breeds from China and three Red Jungle Fowl populations (Gallus gallus gallus and
Gallus gallus spadiceus) were included. All individuals were genotyped at 29
microsatellite loci.
Using the software package STRUCTURE we found a stable clustering of this diverse
gene pool at K = 5, in which the Vietnamese breeds formed a homogeneous group
separated from the other breeds (except for the Chinese Chahua breed) while the
Vietnamese breed Tau Vang and the Chinese breed Tibetan seem to share part of their
genome with both local Vietnamese and Chinese breeds. This finding demonstrates that
the Vietnamese chicken breeds are genetically different from the Chinese breeds. To
estimate the degree of uniqueness of the Vietnamese breeds we analysed the contribution
of a single breed to the total diversity of all other breeds and to the diversity of the three
Red Jungle fowl populations, respectively. Results revealed that the average contribution
of the Vietnamese breeds is higher than that of the reference Chinese breeds to the core
set. However, contributions to the set encompassing the Red Jungle fowl populations
were lower for Vietnamese populations than for Chinese breeds. This finding suggests
that the Vietnamese breeds are closer to Red Jungle Fowl populations than the Chinese
breeds.
Keywords: Asian chicken, genetic diversity, phylogenetic structure, microsatellites.
Introduction
Microsatellites are considered as powerful tool for measuring genetic differentiation
between closely related livestock breeds (FAO, 1998). Recently, different studies have
been published to assess genetic relationships between chicken breeds kept in the
different countries using this type of marker. Mwacharo et al. (2007) found genetic

4th CHAPTER Genetic diversity compared to Chinese breeds
59
subdivision between Kenyan/Uganda and Sudanese/Ehiopian chickens. Studies
characterizing European and Asian chicken breeds (Berthouly et al., 2008) or a wide
range of chicken breeds and lines from various continents and management systems
(Granevitze et al., 2009) showed that relationships between populations were related to
their geographical origin and breeding histories.
Vietnam and China are located in Southeast Asia with a common borderline of 1 350 km
(GSO, 2008). Human migration from Southern China to Vietnam in the 3rd century B.C.
and from the 17th to the 19th century A.C. (Taylor, 1983; Nyiri and Saveliev, 2002)
suggests introduction of Chinese chickens to Vietnam. Based on mitochondrial DNA
(mtDNA) sequence analysis, Liu et al. (2006) showed that one Vietnamese chicken
sample clustered in a clade originating from South and Southwest China and/or
surrounding areas. Recently, Cuc et al. (2010b) found that Vietnamese local chicken
breeds presumably originated from Yunnan and adjacent areas in China, South and
Southwest China and/or surrounding regions studying mtDNA polymorphism. In
contrast, a clear differentiation between the breeds of Vietnamese gene pool and two
breeds of Chinese origin kept at National Institute of Animal Sciences (NIAS) was found
at both mtDNA and autosomal levels (Cuc et al., 2010a and b). However, this study was
based on only two Chinese chicken breeds kept outside of China and may not
comprehensively represent the Chinese chicken gene pool. Therefore, it remains still open
to what degree chicken breeds of the Vietnamese gene pool separate from Chinese. The
aim of the current study was to characterise the differentiation of Vietnamese local breeds
from Chinese local chickens including a wider range of indigenous Chinese breeds taken
from a previous study. Furthermore, we estimated the contribution of a single Vietnamese
breed to the total diversity of all other breeds studied as well as to the diversity of a set of
three Red Jungle fowl populations.
Materials and methods
Chicken breeds
The current study used microsatellite genotypes taken from previous studies (Chen et al.,
2008 and Cuc et al., 2010a). In both studies, genotyping was done in the same laboratory,

4th CHAPTER Genetic diversity compared to Chinese breeds
60
and standard samples were used to adjust for allele scoring. Nine Vietnamese local
chicken breeds and two Chinese breeds kept in NIAS as well as 14 Chinese indigenous
chicken breeds and three Red Jungle Fowl populations (one Gallus gallus gallus and two
Gallus gallus spadiceus populations) were included. The list of the 28 chicken breeds is
shown in Table 1. Detailed description of these populations and sampling is given in the
previous reports (Hillel et al., 2003; Chen et al., 2008 and Cuc et al., 2010a). In brief,
samples of the Vietnamese breeds were randomly taken from households in eight
different districts of four agro-ecological zones from both the southern and northern parts
of Vietnam (Cuc et al., 2010a). The two breeds, Tam Hoang and Luong Phuong, from
now on named NIAS Chinese breeds in this study, were randomly selected from
conservation flocks at the National Institute of Animal Sciences. They were imported
from China to Vietnam in 1995 and 2003, respectively. The other 14 Chinese breeds
(from now on named reference Chinese breeds) were sampled from conservation flocks
kept at the Poultry Institute, Academy of Chinese Agriculture Sciences, Yangzhou and
the Centre of Poultry Resources, Anhuni, China (Chen et al., 2008). The three Red Jungle
Fowl populations included one population (Gallus gallus spadiceus) from China (Chen et
al., 2008) and two populations (Gallus gallus gallus and Gallus gallus spadiceus) from
Thailand collected during the EU project AVIANDIV (Hillel et al., 2003).

4th CHAPTER Genetic diversity compared to Chinese breeds
61
Table 1. List of 28 chicken breeds of which data taken from previous studies.
Country Breed No. of individuals Reference
H’mong 31
Dong Tao 32
Ho 32
Mia 32
Ri 32
Te 32
Choi 33
Tau Vang 33
Vietnam
Ac 32
Tam Hoang 32 NIAS breeds of Chinese
origin Luong Phuong 32
Cuc et al.
(2010)
Xianju 38
Chahua 38
Luyuan 34
Gushi 40
Tibetan 38
Baier 34
Dagu 35
Henan game 33
Langshan 40
Taihe silkies 40
Xiaoshan 40
Beijing Fatty 38
Huainan partridge 32
Wannan three yellow 32
China
Gallus gallus spadiceus 30
Chen et al. (2008)
Gallus gallus spadiceus 26 Thailand
Gallus gallus gallus 30 Hillel et al.
(2003)

4th CHAPTER Genetic diversity compared to Chinese breeds
62
Genotyping
Genotyping of 29 microsatellites used in this study was done by PCR as described by
Granevitze et al. (2007). The RFLPscan software (Scanalytics Division of SSP, Billerica,
USA) was applied for electropherogram processing and allele scoring.
Cluster analysis
Population structure was determined using a model-based clustering as implemented in
the STRUCTURE software to cluster individuals to a varying number of K clusters
(Pritchard et al., 2000). Since we were interested in assessing the separation of the gene
pool of Vietnamese local breeds from the Chinese, we ran the analysis only from K = 2 to
K = 6. The analysis of STRUCTURE was done as described by Granevitze et al. (2009)
with 100 independent runs for each K value. The SIMCOEFF software (Rosenberg et al.,
2002) was used to compare repeated runs, and solutions with over 95% similarity were
considered identical. In addition, a method proposed by Evanno et al. (2005) to detect the
optimal number of clusters was applied.
Phylogenetic network
Marker estimated kinships (MEK) between and within populations were calculated
according to Eding and Meuwissen (2001). Calculation of MEK based on similarity
indices used the Weighted Drift Similarity model (Oliehoek et al., 2006). The kinship
matrix was transformed into a distance matrix and used as an input file for the
SPLITSTREE v. 4.6 (Hudson and Bryant, 2006) to construct a phylogenetic network.
Genetic differentiation between breeds and private alleles
The average FST estimates (Weir and Cockerham, 1984) between breeds within groups of
the Vietnamese, NIAS and reference Chinese and Red Jungle Fowl populations,
respectively, were computed using FSTAT v. 2.9.3.2 (Goudet, 2001). The numbers of
private alleles of these groups were calculated using the Microsatellite Toolkit v. 3.1.1
(Park, 2001).

4th CHAPTER Genetic diversity compared to Chinese breeds
63
Optimal core set contribution and ‘safe set’ analysis
The relative importance of each Vietnamese and NIAS Chinese breed was assessed by
calculating the optimal contributions to a core set. A core set is a mixture of populations
composed such that the genetic overlap within the core set is minimized. Kinship is
defined as the probability that two alleles randomly sampled from a population are
identical by descent. Therefore, if the average kinship in a set of breeds is minimized, the
fraction of alleles descending from the same ancestor will be minimized as well,
eliminating much of the genetic overlap between populations. Hence, the contribution of
each breed to the core set is adjusted such that the mean kinship is minimized. Moreover,
since the fraction of founder additive genetic variance is proportional to (1 – f ), where f
is the mean kinship, it follows that minimizing the mean kinship within the core set
maximizes the additive genetic variance present in the core set.
Optimal contributions were derived according to Eding at al. (2002) from a matrix
containing the mean kinship within (diagonal) and between (off-diagonal) populations.
These ‘optimal contributions’ provide a ranking of breeds according to the amount of
genetic diversity they contribute to the total diversity present in a set of populations. This
enables the evaluation of the relative importance of each breed to the conservation of
genetic diversity. For more details, see Eding et al. (2002).
To assess the degree of uniqueness of the Vietnamese breeds relative to Red Jungle fowl
populations, a ‘safe set’ analysis was performed (Eding et al., 2002). In this type of
analysis a baseline set (the ‘safe set’) is defined. This ‘safe set’ contains populations that
are either considered safe from extinction or have a priori been chosen for conservation.
Populations not in the safe set are included in this set each in turn. For these alternative
(safe + i) sets the contributions are optimized and the conserved genetic diversity is
calculated. The difference in conserved genetic diversity (defined as 1 – f ) between the
safe set and the (safe + i) set is taken as the genetic diversity the one non-safe population
adds to the safe set. This added diversity is used as an indicator of the relative importance
of a population in relation to the safe set. For the sake of the analysis we assumed three
Red Jungle fowl populations are safe. A set of these three populations was defined as the
‘safe set’. We compared the diversity lost by only retaining this existing ‘safe set’ to the
‘safe set plus one’ of the other breed. Both the total genetic diversity of the existing set

4th CHAPTER Genetic diversity compared to Chinese breeds
64
plus one Vietnamese breed - Div(S + i) - and the diversity added by a single Vietnamese
breed to the ‘safe set’ - d(i) - were calculated.
Results
Cluster analysis
Results of STRUCTURE analysis for a clustering the set of 28 breeds into two (K = 2)
and five (K = 5) clusters, respectively, are given in Figure 1. At K=2, we found highly
repeatable clustering with 100% identical solutions at threshold of 0.95 of similarity
coefficients between runs. At this level of clustering the Vietnamese breeds grouped
together with the Red Jungle Fowl and were separated from the NIAS and reference
Chinese breeds (except for the Chinese Chahua). Applying the method of Evanno
(Evanno et al., 2005) suggested an optimal clustering at K = 5. At K = 5, Vietnamese
breeds clustered together with the Chinese Chahua breed forming one cluster, and the
Red Jungle Fowl populations made up their own cluster while the NIAS and the other
reference Chinese breeds formed the other remaining three clusters. The two NIAS
Chinese breeds clustered together with the heavy body weight type of breeds of the
reference Chinese breeds whilst the Vietnamese Tau Vang and Chinese Tibetan breeds
appeared as admixture populations between Vietnamese and Chinese gene pools.

4th CHAPTER Genetic diversity compared to Chinese breeds
65
Figure 1. Clustering of 28 populations under study. Number in parenthesis is the number
of identical solutions of 100 repeats at 95% threshold.
Key: HM = H’mong; DTAO = Dong Tao; TVANG = Tau Vang; RJFSG_T = Thailand
Gallus gallus gallus; RJFS_T = Thailand Gallus gallus spadiceus; RJFS_C = Chinese
Gallus gallus spadiceus; CHA = Chahua; TIB = Tibetan; XIA = Xianju; GUS = Gushi;
BAI = Baier; WUG = Taihe Silkies; HP Huainan Partrigde; LAN = Langshan; DOU =
Henan game; WTY = Wannan Three-yellow; DAG = Dagu; YOU = Beijing Fatty; LUY
= Luyuan; XIS = Xiaoshan; LP = Luong Phuong; TH = Tam Hoang.
Phylogenetic network
The phylogenetic network constructed from the kinship distances of 28 breeds is shown
in Figure 2. The Vietnamese breeds clustered closely with the Red Jungle fowl
populations and the Chinese Chahua breed, but were separated from clusters of the other
reference and NIAS Chinese breeds, with the Vietnamese Tau Vang and Chinese Tibetan
breeds in the middle. The Red Jungle fowl populations showed longer branches than the
Vietnamese breeds.
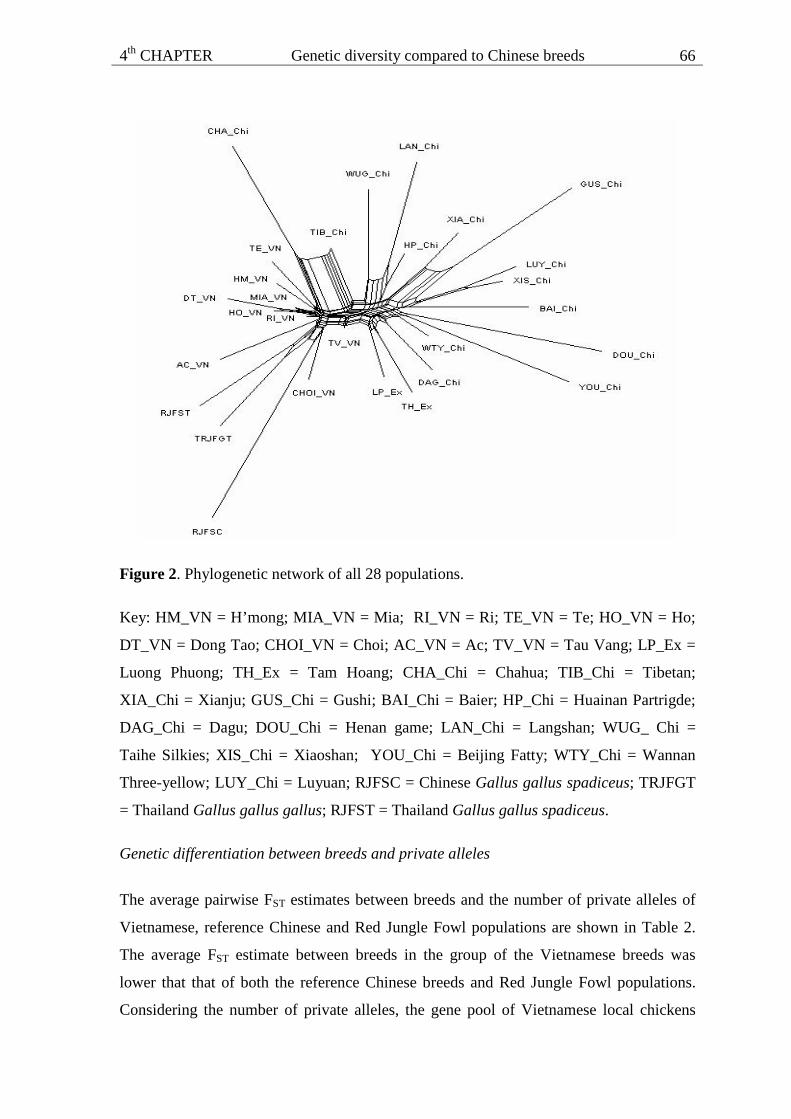
4th CHAPTER Genetic diversity compared to Chinese breeds
66
Figure 2. Phylogenetic network of all 28 populations.
Key: HM_VN = H’mong; MIA_VN = Mia; RI_VN = Ri; TE_VN = Te; HO_VN = Ho;
DT_VN = Dong Tao; CHOI_VN = Choi; AC_VN = Ac; TV_VN = Tau Vang; LP_Ex =
Luong Phuong; TH_Ex = Tam Hoang; CHA_Chi = Chahua; TIB_Chi = Tibetan;
XIA_Chi = Xianju; GUS_Chi = Gushi; BAI_Chi = Baier; HP_Chi = Huainan Partrigde;
DAG_Chi = Dagu; DOU_Chi = Henan game; LAN_Chi = Langshan; WUG_ Chi =
Taihe Silkies; XIS_Chi = Xiaoshan; YOU_Chi = Beijing Fatty; WTY_Chi = Wannan
Three-yellow; LUY_Chi = Luyuan; RJFSC = Chinese Gallus gallus spadiceus; TRJFGT
= Thailand Gallus gallus gallus; RJFST = Thailand Gallus gallus spadiceus.
Genetic differentiation between breeds and private alleles
The average pairwise FST estimates between breeds and the number of private alleles of
Vietnamese, reference Chinese and Red Jungle Fowl populations are shown in Table 2.
The average FST estimate between breeds in the group of the Vietnamese breeds was
lower that that of both the reference Chinese breeds and Red Jungle Fowl populations.
Considering the number of private alleles, the gene pool of Vietnamese local chickens
4th CHAPTER Genetic diversity compared to Chinese breeds
67
had 34 private alleles. From these 34 private alleles, 25 alleles occurred at a frequency of
less than one percent, while the remaining varied from 1.21 to 4.51%. In comparison,
almost all (15/16) private alleles found in the reference Chinese breeds had a frequency of
less than one percent and only one allele occurred at a frequency of 2.94%.
Table 2. The average FST estimate between breeds and unique alleles in the groups of the
Vietnamese, reference Chinese, Red Jungle Fowl and NIAS Chinese breeds.
Population group Number of breeds FST ± SD Number of Unique alleles
Vietnamese 9 0.0511 ± 0.0298 34
NIAS Chinese 2 0.062 1
Reference Chinese 14 0.1506 ± 0.0501 16
Red Jungle Fowl 3 0.1718 ± 0.0514 8
Optimal core set contribution and ‘safe set’ analysis
Contributions of the Vietnamese breeds to the core set and to the ‘safe set’ (consisting of
a set of Red Jungle fowl populations) are shown in Table 3. The total conserved genetic
diversity in the core set was 0.970, while total diversity of the Red Jungle Fowl existing
set was 0.920. This result suggests that 97% and 92%, respectively, of the genetic
variance in the founder population is conserved in the complete set of breeds and the set
of Red Jungle Fowl populations, respectively. The average contribution of the
Vietnamese breeds is higher than that of the reference Chinese breeds to the core set.
However, contributions to the ‘safe set’ were lower for Vietnamese populations than for
Chinese breeds.
Within the group of Vietnamese breeds, the highest contribution to the core set was
observed in the Ac breed while the lowest was found in the Ho breed. The diversity added
to the ‘safe set’ by individual Vietnamese populations was highest for the Tau Vang and
lowest for the Ho breed.

4th CHAPTER Genetic diversity compared to Chinese breeds
68
Table 3. Genetic contribution and added genetic diversity of 11 populations under study
to total diversity of all other breeds and to a safe set consisting of three Red Jungle Fowl
populations.
Red Jungle fowl Contribution Div (S+i) d(i)*1000
Breed
Safe set 0.920
Ac 0.0555 0.936 16.296
Choi 0.0433 0.935 14.951
H’Mong 0.0424 0.937 17.076
Tau Vang 0.0416 0.936 17.721
Mia 0.0362 0.936 16.426
Te 0.0268 0.935 14.834
Ri 0.0198 0.935 15.342
Dong Tao 0.0171 0.934 14.751
Ho 0.0156 0.935 14.374
Mean 0.0331 0.935 15.752
Vietnamese
SD 0.0140 0.001 1.169
Luong Phuong 0.0602 0.939 18.574
Tam Hoang 0.212 0.936 15.790
Mean 0.1361 0.936 17.182
NIAS Chinese
SD 0.1073 0.002 1.967
Mean 0.0285 0.937 10.645 Reference Chinese
0.0162 0.002 1.532
Key: NIAS = National Institute of Animal Science.
Div (S+i) = total diversity of the safe set plus one population, d(i) = diversity added by
breed i to safe set S.

4th CHAPTER Genetic diversity compared to Chinese breeds
69
Discussion
A separation of the Vietnamese breeds from the two NIAS Chinese breeds found in this
study indicated that the two NIAS Chinese breeds do not share their genome with the
Vietnamese breeds. This finding strengthens an argument from a previous study at the
mtDNA level (Cuc et al., 2010b) that there is no gene introgression of these two NIAS
Chinese breeds into local Vietnamese chickens. Furthermore, clustering the two NIAS
Chinese breeds together with the reference Chinese breeds indicates that these two breeds
are part of the Chinese gene pool.
The results of STRUCTURE and phylogenetic relationship analyses indicated a clear
genetic difference between the Vietnamese and reference Chinese breeds (except for the
Chahua breed kept in Yunnan). The genetic distinction of these populations suggests
genetic isolation for a long time and limitation of gene flow between breeds with an
exception of the Chahua breed. Gene flow might be hindered as populations of both gene
pools are kept in two different countries (i.e., Vietnam and China). Clustering of the
Chahua breed with the Vietnamese breeds might be due to the close neighborhood of the
Yunnan province. Human migration from Southern Chinese people (i.e., Yunnan) to
Vietnam (Taylor, 1983; Nyiri and Saveliev, 2002) may have led to interbreeding between
breeds of the Yunnan region and the Vietnamese chicken breeds. Based on mtDNA
analysis, Cuc et al. (2010b) found that Vietnamese domestic chickens may have
originated from Yunnan, South and Southwest China and/or surrounding areas.
The Vietnamese breeds clustered into one homogeneous group while the Chinese breeds
grouped into three clusters. In addition, average FST between Vietnamese breeds was
lower than between Chinese breeds (Table 2). This shows that differences between
Chinese breeds are more pronounced than between Vietnamese breeds which might be
attributed to lower geographic distance and higher gene flow within the group of
Vietnamese breeds.
Although the number of Vietnamese breeds studied was lower than the number of
reference Chinese breeds (9 breeds vs. 14 breeds, respectively), the number of private
alleles observed in the Vietnamese group was about twice as high as in the reference
Chinese breeds. The large number of private alleles observed in this study supports the

4th CHAPTER Genetic diversity compared to Chinese breeds
70
finding of Granevitze et al. (2007) who found that the Vietnamese H’mong breed carried
the highest number of private alleles compared to a wide range of chicken populations
originating from various continents and management systems.
Optimised contributions of a single breed show that Vietnamese breeds contributed more
to total genetic diversity than reference Chinese breeds. The correlation between expected
heterozygosity and core set contribution was significantly positive (P<0.05, Figure S1)
Hence high core set contributions might be attributed to the high genetic diversity within
Vietnamese breeds compared to reference Chinese breeds (the heterozygosity values of
64% vs. 57%, respectively).
Detailed analyses of genetic contribution of each Vietnamese chicken breed to the total
core set and the set of Red Jungle Fowl populations show that the Ho and Dong Tao
breeds scored consistently low. In contrast, the ranking of other breeds differed between
the core set and the ‘safe set’ analyses. Especially, the difference in ranking of the Ac
breed in the core set and ‘safe set’ analyses indicated that this breed adds considerable
genetic diversity to the total set while it shared much diversity with Red Jungle Fowl
populations. This suggests that the Ac breed could comprise unique genetic features
compared to three groups of the Vietnamese, NIAS breeds, and Chinese breeds and could
be an important source of variation which contributes substantially to future breeding
programs.
Clustering of Vietnamese breeds together with the Red Jungle fowl populations at low K
values in the STRUCTURE analysis indicates that the Vietnamese breeds are more
similar to the Red Jungle fowl populations than the NIAS and reference Chinese breeds.
However, at higher K values (K = 5) the Red Jungle fowl populations split from the
Vietnamese breeds and formed their own cluster. Similar phylogenetic relationships were
displayed in the network analysis, in which the Red Jungle fowl grouped together with
Vietnamese breeds but showed longer branches than the Vietnamese breeds. This
indicated that the Red Jungle fowl populations are different from Vietnamese breeds
which is inconsistent with previous reports of Berthouly et al. (2009) who showed an
admixture between Vietnamese scavenging domestic chickens in the Ha Giang province
of Vietnam and wild chickens sampled from different geographic origins (i.e., Thailand
and Vietnam, but latter was maintained in a French zoological park). This difference

4th CHAPTER Genetic diversity compared to Chinese breeds
71
could be due to the different areas and populations studied. Our study included neither
chickens from the Ha Giang province nor Vietnamese Red Jungle Fowl populations. On
the other hand, the Vietnamese chicken gene pool shared more genetic diversity with the
Red Jungle Fowl populations than Chinese breeds suggesting a rather close relationship
between the Vietnamese chickens and Red Jungle Fowl populations. This has also been
shown in the phylogenetic network and STRUCTURE analyses, respectively, in which
the Vietnamese breeds clustered together with Red Jungle Fowl populations while
reference Chinese breeds (except for the Chahua breed) were separated. Del Hoyo et al.
(2001) found that Southwest Yunnan, China and Vietnam are part of the distribution of
Gallus gallus spadiceus and Gallus gallus jabouillei. This can be used to explain why the
Vietnamese breeds are closer to the Red Jungle Fowl populations than the Chinese
breeds, since almost all of them (13/14) are not kept in Southwest Yunnan, China. Further
studies involving these populations should be taken into consideration.
In summary, results from this study indicate that Vietnamese local chicken breeds are
genetically isolated from Chinese indigenous chicken breeds. The results reveal that the
Vietnamese breeds are more similar to Red Jungle Fowl populations than the reference
Chinese breeds.
Acknowledgements
The authors express sincere thanks to A. Weigend and A. Flörke, Institute of Farm
Animal Genetics at Mariensee for technical assistance. We thank the Vietnamese farmers
for providing chicken blood samples. N.T.K. Cuc had a stipend from German Academic
Exchange Service (DAAD).The project was funded by the German Federal Ministry of
Education and Research (BMBF).

4th CHAPTER Genetic diversity compared to Chinese breeds
72
References
Berthouly C., Bed'Hom B., Tixier-Boichard M., Chen C.F., Lee Y.P., Laloë D., Legros
H., Verrier E. and X. Rognon. 2008. Using molecular markers and multivariate
methods to study the genetic diversity on local European and Asian chicken breeds.
Animal Genetics 39: 121-129.
Berthouly C., Leroy G., Van T.N., Thanh H.H., Bed'Hom B., Nguyen B.T., Vu C.C.,
Monicat F., Tixier-Boichard M., Verrier E., Maillard J. and Rognon X. 2009. Genetic
analysis of local Vietnamese chickens provides evidence of gene flow from wild to
domestic populations. BMC Genetics: 10:1.
Chen G., Bao W., Shu J., Ji C., Wang M., Eding H., Muchadeyi F. and Weigend S. 2008.
Assessment of population structure and genetic diversity of 15 Chinese indigenous
chicken breeds using microsatellite markers. Asian-Australasian Journal of Animal
Sciences 21: 331-339.
Cuc N.T.K., Simianer H., Eding H., Tieu H.V., Cuong V.C., Wollny C.B.A., Groeneveld
L.F. and Weigend S. 2010a. An assessment of genetic diversity of Vietnamese local
chicken breeds. Animal Genetics (in press).
Cuc N.T.K., Simianer H., Groeneveld L.F. and Weigend S. 2010b. Multiple maternal
lineages of Vietnamese local chickens inferred by mitochondrial DNA D-loop
sequences. Submitted for publication.
Del Hoyo J., Elliott A. and Sargatal J. 2001. Handbook of the Birds of the World 2: New
World Vultures to Guineafowl, Lynx Edicions, Barcelona.
Eding H. and Meuwissen T.H.E. 2001. Marker based estimates of between and within
population kinships for the conservation of genetic diversity. Journal of Animal
Breeding and Genetics 118: 141-159.
Eding H., Crooijmans R.P.M.A., Groenen M.A.M. and Meuwissen T.H.E. 2002.
Assessing the contribution of breeds to genetic diversity in conservation schemes.
Genetics Selection Evolution 34: 613-634.

4th CHAPTER Genetic diversity compared to Chinese breeds
73
Evanno G., Regnaut S. and Goudet J. 2005. Detecting the number of clusters of
individuals using the software STRUCTURE: a simulation study. Molecular Ecology
14: 2611-2620.
FAO 1998. Secondary guidelines for development of national farm animal genetic
resources management plans. Measurement of Domestic Animal Diversity (MoDAD):
Original Working Group Report. FAO, Roma, Italy.
Goudet J. 2001. FSTAT, a program to estimate and test gene diversities and fixation
indices (version 2.9.3.2). http://www2.unil.ch/popgen/softwares/fstat.htm. Accessed
on 06/02/2009.
Granevitze Z., Hillel J., Chen G.H., Cuc N.T.K., Feldman M., Eding H. and Weigend S.
2007. Genetic diversity within chicken populations from different continents and
management histories. Animal Genetics 38: 576-583.
Granevitze Z., Hillel J., Feldman M., Six A., Eding H. and Weigend S. 2009. Genetic
structure of a wide-spectrum chicken gene pool. Animal Genetics 40: 686-693.
GSO (General Statistic Office of Vietnam) 2008. Statistical Handbook of Vietnam,
Statistic Publisher, Hanoi, Vietnam.
Hillel J., Groenen M.A.M., Tixier-Boichard M., Korol A.B., David L., Kirzhner V.M.,
Burke T., Barre-Dirie A., Crooijmans R.P., Elo K., Feldman M.W., Freidlin P.J.,
Maki-Tanila A., Oortwijn M., Thomson P., Vignal A., Wimmers K. and Weigend S.
2003. Biodiversity of 52 chicken populations assessed by microsatellitetyping of
DNA pools. Genetics Selection Evolution 35: 533-557.
Hudson D.H. and Bryant D. 2006. Application of Phylogenetic Networks in Evolutionary
Studies. Molecular Biology and Evolution 23: 254-267.
Liu Y.P., Wu G S., Yao Y.G., Miao Y.W., Luikart G., Baig M., Beja-Pereira A., Ding
Z.L., Palanichamy M.G. and Zhang Y.P. 2006. Multiple maternal origins of chickens:
out of the Asian jungles. Molecular Phylogenetics and Evolution 38: 112-119.
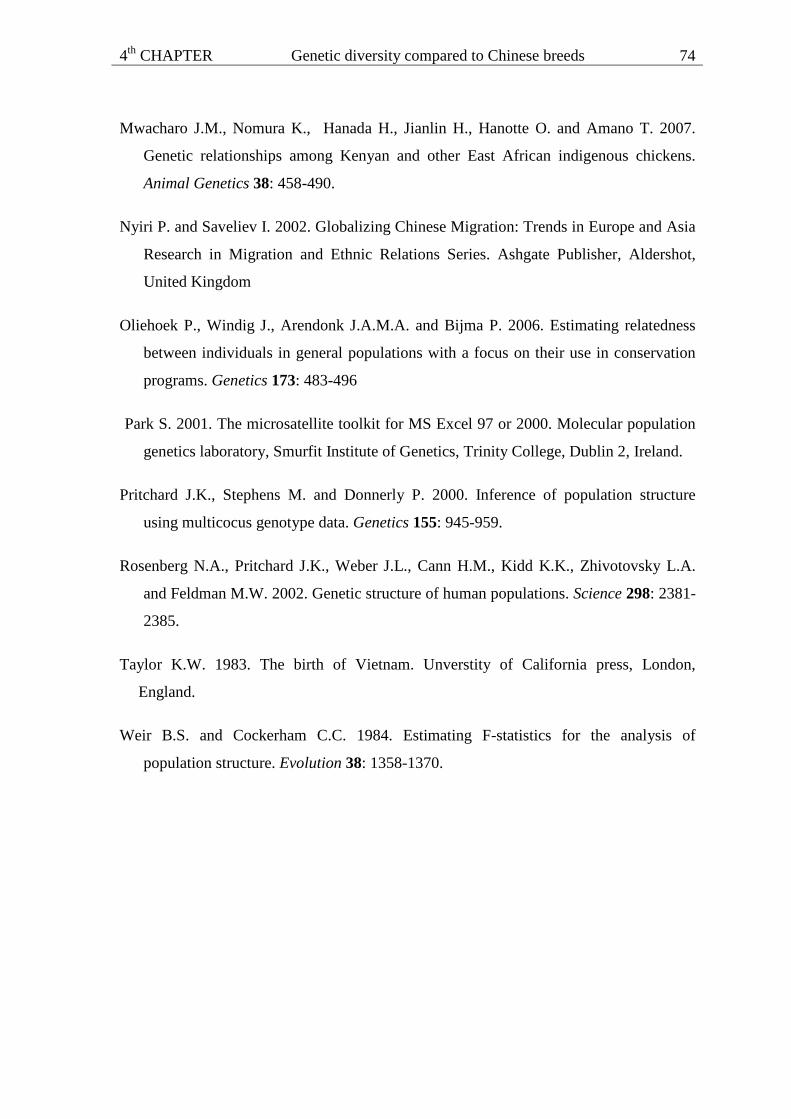
4th CHAPTER Genetic diversity compared to Chinese breeds
74
Mwacharo J.M., Nomura K., Hanada H., Jianlin H., Hanotte O. and Amano T. 2007.
Genetic relationships among Kenyan and other East African indigenous chickens.
Animal Genetics 38: 458-490.
Nyiri P. and Saveliev I. 2002. Globalizing Chinese Migration: Trends in Europe and Asia
Research in Migration and Ethnic Relations Series. Ashgate Publisher, Aldershot,
United Kingdom
Oliehoek P., Windig J., Arendonk J.A.M.A. and Bijma P. 2006. Estimating relatedness
between individuals in general populations with a focus on their use in conservation
programs. Genetics 173: 483-496
Park S. 2001. The microsatellite toolkit for MS Excel 97 or 2000. Molecular population
genetics laboratory, Smurfit Institute of Genetics, Trinity College, Dublin 2, Ireland.
Pritchard J.K., Stephens M. and Donnerly P. 2000. Inference of population structure
using multicocus genotype data. Genetics 155: 945-959.
Rosenberg N.A., Pritchard J.K., Weber J.L., Cann H.M., Kidd K.K., Zhivotovsky L.A.
and Feldman M.W. 2002. Genetic structure of human populations. Science 298: 2381-
2385.
Taylor K.W. 1983. The birth of Vietnam. Unverstity of California press, London,
England.
Weir B.S. and Cockerham C.C. 1984. Estimating F-statistics for the analysis of
population structure. Evolution 38: 1358-1370.
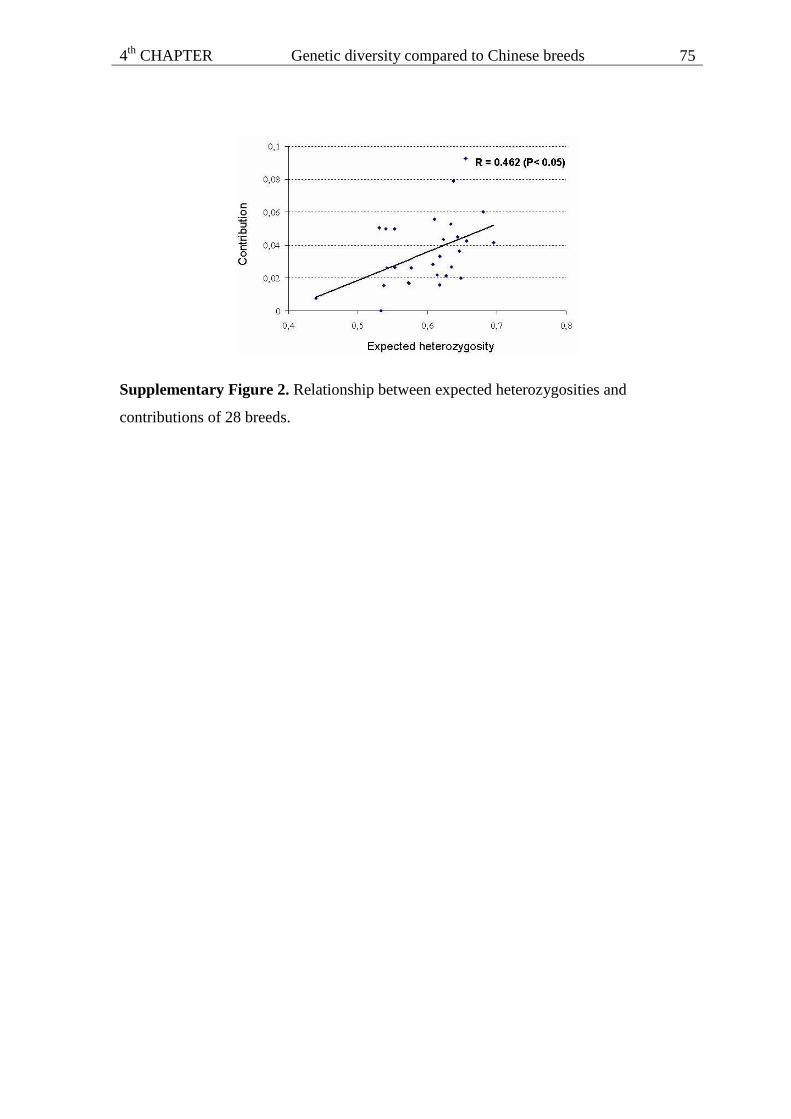
4th CHAPTER Genetic diversity compared to Chinese breeds
75
Supplementary Figure 2. Relationship between expected heterozygosities and
contributions of 28 breeds.

5th CHAPTER Conservation priority
76
5th
CHAPTER
Conservation priorities and optimum allocation of conservation funds
for Vietnamese local chicken breeds
N. T. K. Cuc1,2,3, S. Weigend2, H. V. Tieu3 and H. Simianer1
1Department of Animal Sciences, Animal Breeding and Genetics Group, Georg-August-
Universität Göttingen, Göttingen, Germany, 2Institute of Farm Animal Genetics,
Friedrich-Loeffler-Institut, Neustadt-Mariensee, Germany, 3National Institute of Animal
Sciences, Hanoi, Vietnam.
Submitted for publication

5th CHAPTER Conservation priority
77
Summary
The objectives of this study were to estimate conservation potential of Vietnamese local
breeds and to investigate optimal allocation of conservation funds to maximize genetic
diversity conserved between these breeds. Twenty-nine microsatellites were genotyped in
353 individuals from nine Vietnamese local chicken breeds and two chicken breeds of
Chinese origin. The Vietnamese chicken breeds were sampled from the northern and
southern parts of Vietnam while the two Chinese breeds have been kept as conservation
flocks at the National Institute of Animal Sciences, Hanoi. The Weitzman approach was
used to assess alternative strategies for conserving genetic diversity between breeds.
Three different models, which reflect the range of possible functions in typical
conservation situations, were applied. An average extinction probability of 48.5% was
estimated for all Vietnamese chicken breeds. The highest conservation potential was
found in the Te, Dong Tao and Ac chicken breeds, whereas the lowest corresponding
values were observed in the Ri and Mia chicken breeds. The conservation funds were
mainly allocated to the same three breeds (Te, Dong Tao and Ac) under all three models.
This study suggests that conservation potential of the Vietnamese chicken breeds varies
considerably. The three breeds Te, Dong Tao and Ac with the highest conservation
potential should be the prime candidates to be allocated conservation funds if the
conservation budgets are limited. Population priorities for allocation of conservation
funds in this case do not depend on the cost model used, so that a similar share of
allocation under all three models is given to the Te and Dong Tao chicken breeds each.
Keyword: Weitzman approach, conservation priority, Vietnamese local chickens,
allocation of resources
Introduction
The erosion and loss of animal genetic resources would compromise the flexibility of
future breeding measures and enhance rural development (FAO, 2007a). Poultry genetic
resources are considered to be the most endangered and under-conserved, and strategic
approaches to conservation at the national level need to be developed and implemented
(Hoffmann, 2009).

5th CHAPTER Conservation priority
78
Weitzman’s (1992) diversity concept is widely used as a formal approach to rational
decision making in livestock conservation. Weitzman’s theory was applied in studies on
various farm animal species, such as chicken (Pinent et al., 2005), pig (Laval et al., 2000
and Fabuel et al., 2004), cattle (Thaon d’Arnoldi et al., 1998; Canon et al., 2001;
Simianer, 2002; Reist-Marti et al., 2003, Simianer et al., 2003; Tapio et al., 2006;
Zerabruk et al., 2007 and Zander et al., 2009), horse (Thirstrup et al., 2008) and dog
(Leroy et al., 2009). The approach combines genetic diversity assessed at the molecular
level and extinction probabilities estimated by socio-economic factors to derive
conservation priorities of breeds based on their conservation potential. Using
conservation potentials for prioritizing breeds is very efficient in selection of breeds for
conservation, when the objective of the conservation plan is to maximize the genetic
diversity conserved (Reist-Marti et al., 2003; Simianer et al., 2003 and Zerabruk et al.,
2007).
Although the conservation potential is considered as a good indicator for conservation
decision, it does not give information on how to allocate the conservation budget to
maximize the conserved diversity. Simianer et al. (2003) proposed an algorithm to find
the optimum allocation of a given quantity of conservation resources to maximize the
expected diversity. This algorithm links conservation expenditures to reduction in
extinction probability and a range of possible functions in the typical conservation
situation are suggested.
In Vietnam, besides one local chicken breed (Van Phu breed) reported to be extinct, 11
breeds have been recorded in the World Watch list (http://dad.fao.org), of which six
breeds have been decreasing in numbers and one breed is critically endangered (National
Institute of Animal Sciences, 2000). During recent years, some exotic chicken breeds
were imported to Vietnam due to their high performance. This could result in the
disappearance of Vietnamese local chicken breeds (Tieu et al., 2008). National programs
on conservation of the Vietnamese farm animal genetic resources have been initiated
since 1990 in order to prevent the extinction of local animal breeds. However,
conservation decisions were made mainly based on population size information and
population trend of the breeds. Other indicators affecting extinction probability of the
breeds and the contribution of the breeds to total genetic diversity have not been taken
into account, and allocation of conservation funds might not ensure to prevent the loss of

5th CHAPTER Conservation priority
79
national animal genetic resources in the long-term (Tieu et al., 2008). The objectives of
this study were to estimate the conservation potential of Vietnamese local chicken breeds
and to investigate optimal allocation of conservation funds to minimize loss of genetic
diversity between these breeds.
Materials and Methods
Breeds
Nine Vietnamese chicken breeds and two breeds of Chinese origin were studied (Table
1). The Vietnamese Ri and Tau Vang breeds are the most popular dual-purpose, while the
other Vietnamese chicken breeds were kept for different purposes (Su et al., 2004), such
as cultural reasons (Ho, Choi and Mia breeds), the unique feature of short and thick legs
(Dong Tao breed), dwarfism (Te breed) and traditional tonics (Ac and H’mong breeds).
Samples of the nine Vietnamese breeds were collected in eight districts of four agro
ecological zones located in both the northern and southern parts of Vietnam. On average,
32 individuals were randomly taken for each breed by sampling one male and one female
per household. Two breeds of Chinese origin, Tam Hoang and Luong Phuong, were used
as reference populations. They were imported to Vietnam in 1995 and 2003, respectively,
and kept as conservation flocks at the National Institute of Animal Sciences (NIAS).
Blood samples from 32 Chinese individuals (16 males and 16 females per breed) were
collected and genotyped at 29 microsatellite loci, as described by Granevitze et al.
(2007).
Questionnaire administration
Data on general socio-economic factors were collected from households who provided
chicken blood samples. A structured questionnaire was administered to 15 households per
breed, except for the Te chicken breed for which only 4 households could be surveyed
due to their rareness. Information on change of the total population size over the last five
years, the risk of indiscriminate crossing, disease control and production system of the
breed were captured during the interviews. Furthermore, information on the farmer’s
sources of income, their participation in the farmers union, the perception of the farmers
regarding the value of the breed such as special traits and socio-cultural importance were
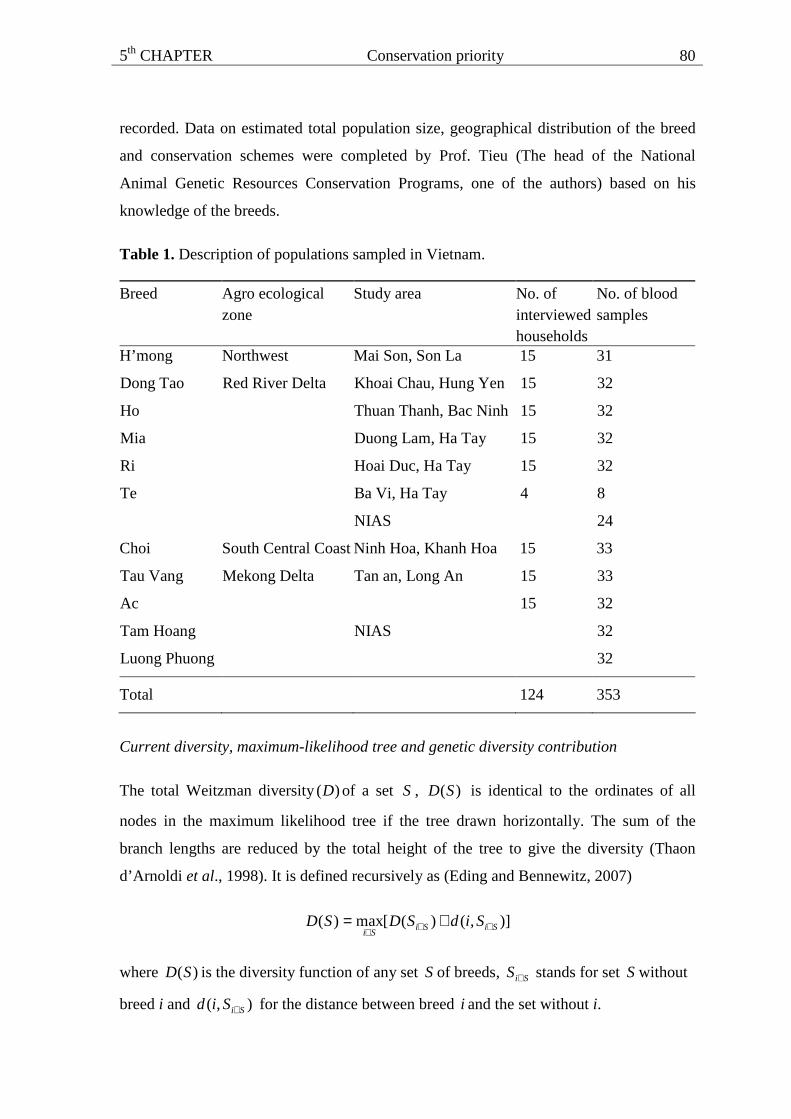
5th CHAPTER Conservation priority
80
recorded. Data on estimated total population size, geographical distribution of the breed
and conservation schemes were completed by Prof. Tieu (The head of the National
Animal Genetic Resources Conservation Programs, one of the authors) based on his
knowledge of the breeds.
Table 1. Description of populations sampled in Vietnam.
Breed Agro ecological zone
Study area No. of interviewed households
No. of blood samples
H’mong Northwest Mai Son, Son La 15 31
Dong Tao Khoai Chau, Hung Yen 15 32
Ho Thuan Thanh, Bac Ninh 15 32
Mia Duong Lam, Ha Tay 15 32
Ri Hoai Duc, Ha Tay 15 32
Ba Vi, Ha Tay 4 8 Te
Red River Delta
NIAS 24
Choi South Central Coast Ninh Hoa, Khanh Hoa 15 33
Tau Vang 15 33
Ac
Mekong Delta Tan an, Long An
15 32
Tam Hoang 32
Luong Phuong
NIAS
32
Total 124 353
Current diversity, maximum-likelihood tree and genetic diversity contribution
The total Weitzman diversity )(D of a set S , )(SD is identical to the ordinates of all
nodes in the maximum likelihood tree if the tree drawn horizontally. The sum of the
branch lengths are reduced by the total height of the tree to give the diversity (Thaon
d’Arnoldi et al., 1998). It is defined recursively as (Eding and Bennewitz, 2007)
)],()([max)( SiSiSi
SidSDSD ∉∉∉+=
where )(SD is the diversity function of any set Sof breeds, SiS∉ stands for set Swithout
breed i and ),( SiSid ∉ for the distance between breed i and the set without i.

5th CHAPTER Conservation priority
81
Reynolds genetic distance (Reynolds et al., 1983) was estimated by PHYLIP 3.57c
software (Felsenstein, 1993). Weitzman’s (1992) recursive algorithm was used to
construct maximum-likelihood tree. The maximum-likelihood tree is the evolution
scheme which maximizes the probability that every element of the set Sexists at the
current time (Thaon d’Arnoldi et al., 1998). Maximum-likelihood trees were illustrated
using TreeView 32 software (Page, 1996).
The contribution of an element is proportional to the reduction in tree length caused by its
removal from the group. The contribution ic of breed i to the diversity of the set S was
calculated as (Reist-Marti et al., 2003)
)\()( iSDSDci −=
where )(SD is represented as the sum of the ordinates of all nodes of the tree if the tree is
drawn horizontally; )\( iSD is the diversity of the set without breed i.
Extinction probability
In this study, we mainly used the scoring method suggested by Reist-Marti et al. (2003).
Our scheme encompasses 11 variables which we believe to be the most relevant factors
affecting the survival and extinction probability of Vietnamese chicken breeds. The
scheme is representative of different aspects, such as population description,
environmental impact and present value of the breed. The population description was
determined by two variables: total population size (POS) and the change of total
population size over the last five years (CHA). The environmental impacts were reflected
by seven variables: distribution of the breed (DIS), risk of indiscriminate crossing
(CRO), disease control (DIS), production system (PRO), organization of farmers (ORG),
establishment of a conservation scheme (CON) and economic development (ECO). The
present "value" of a breed was displayed by the variables of special traits (SPE) and
socio-cultural importance (CUL). The range of values was assigned based on the
estimated magnitude of the variable. The weight of variables is shown in Table 2.
Extinction probability of the two Chinese breeds was set to zero because it is assumed
that these breeds are safe in China.

5th CHAPTER Conservation priority
82
The three variables, population size, established conservation scheme and changing of
population size over time were scored by the highest values. The variables of population
size and established conservation scheme were weighted between 0 for no impact on risk,
and 0.3 for high impact on risk. The variable of changing of population size over time
was scaled from -0.1 to 0.2. These variables were weighed highest because current
population size and population growth trends are the most important factors determining
the risk status. Where populations are small, there is a greater likelihood for a rapid
extinction. When population is above a certain population size, the risk can be regarded
as small. The more rapidly a population builds up to reach the critical size, the less it is
exposed to the risk of extinction. Besides these two variables, further consideration is
given to active conservation program (Scherf, 2000).
The effect of geographic distribution of the breed was indicated by scoring between 0 for
no impact on risk and 0.2 for high impact on risk. The latter pertained to the situation that
a limited geographical distribution of the population is linked to a high risk of complete
extinction when the population is exposed to threats such as disease epidemics, natural
disasters, or inappropriate management (FAO, 2007b and Woolliams, 2004). The Te
chicken breed with unidentified distribution was considered as spreading within region.
The three variables, economic development, production system and disease control were
considered in this study because the number of chickens kept in the Vietnamese
households has a relationship to the level of their income based on chickens (Epprecht,
2005), and high chick mortality often is due to mishandling, outbreaks and predation
(Burgos et al., 2008). In addition, poultry diseases are considered as a large threat to
traditional poultry production in Vietnam (FAO, 2009). Therefore, these variables are
included and assigned values between 0 for no impact on risk and 0.1 for high impact on
risk. A similar scoring is also made for the four remaining variables based on Reist-Marti
et al. (2003).

5th CHAPTER Conservation priority
83
Table 2. Variables and criteria for the estimation of extinction probability of Vietnamese
chicken breeds.
Variable (abbreviation) Criterion and value
0.3 < 1 000
0.2 = 1 001 to 10 000
0.1 = 10 001 to 100 000
Total population size (POS)
0.0 > 100 000
Changing of total population over the last 5 years (CHA)
0.2 = decreasing
0.0 = stable
-0.1 = increasing
missing value = 0.2
0.2 = localized (in one province)
0.1 = spread within region
Distribution of the breed (DIS)
0.0 = widespread within country
Degree or risk of indiscriminate crossing (CRO)
0.1 = high
0.00 = marginal
0.1 = no Disease control (DC)
0.0 = yes
0.1 = scavenging without fence Production system (PS)
0.0 = scavenging with fence or semi-intensive
0.1 = no Organization of farmer (ORG)
0.0 = yes
0.3 = none
0.1 = in-stitu
Established conservation scheme (CON)
0.0 = ex-situ
0.1 = income from others
0.05 = income from chicken and others
Economic development (ECO)
0.0 = income from chicken only
0.1 = none Special use (SPE)
0.0 = yes
0.1 = none
0.05 = some socio-cultural
Socio-cultural importance (CUL)
0.0 = yes

5th CHAPTER Conservation priority
84
The estimates of total population size and information on distribution as well as
conservation schemes of the breed were retrieved from Prof. Hoang Van Tieu. Values of
the other variables were calculated from the household surveyed. Value of the variable of
changing of total population size was calculated as follows:
( )
+
+
−= 2.0*0.0*1.0* 321
i
ia
i
ia
i
iaia T
N
T
N
T
Nz
where iaz is the value of the variable of changing of total population size of breed i. iT is a
total number of the households surveyed per breed i. iaN1 , iaN2 and iaN3 are the numbers
of the households of breed i responsible for increasing, stable and decreasing population,
respectively.
Values of the two variables, economic development and socio-cultural importance, were
estimated by the following formula:
+
+
= 1.0*05.0*0* 321
i
ia
i
ia
i
iaia T
N
T
N
T
Nz
where iaz is the value of variable a of breed i. iT is a total number of the households
surveyed per breed i. iaN1 , iaN2 and iaN3 are the number of the households of breed i
responsible for no impact, medium impact and high impact of variable, respectively.
Values of the five variables, degree of indiscriminate crossing, disease control,
production system, organization of the farmer and special use, were was calculated as
follows:
+
= 1.0*0* 21
i
ia
i
iaia T
H
T
Hz
where iaz is the value of variable a of breed i. iT is a total number of the households
surveyed per breed i. iaN1 and iaN2 are the number of the households of breed i
responsible for no impact and impact, respectively.

5th CHAPTER Conservation priority
85
The extinction probability of breed i, iz , was computed as the sum of the values of the 11
variables. If a breed was considered to be completely safe, the value of the extinction
probability is equal to zero and this value will be 1 if a breed is certain to go extinct. The
sum of eleven variables was rescaled to a value from 0.1 to 0.9 as follows.
147.0*7.18.0 11
1
+= ∑=a
iai zz
Expected future diversity, marginal diversity and conservation potential
The expected diversity of the set after a given time t accounts for the extinction
probability iz for every breed i of the set. The probability that at the end of the given
time, situation K will arise, where a particular subset of breeds exists and the
complementary subset is extinct, is (Simianer et al., 2003)
))1(()( ik
i i zkKP i−+= ∏
where: i = 1,... N; ik = 1 if breed i is still existing and ik = 0 if i is extinct in the set K.
From the above, 2N different combinations of present and extinct breeds are possible, for
which the respective probabilities can be calculated as described. When KD is diversity
of the set of breeds not extinct, i.e., with ik =1, the expected diversity at the end of the
time t is estimated as
( )[ ] ( ) KKDKPSDE ∑=
The variance of expected diversity can be computed as
22 )]([()[()]([ SDEDKPSDVarK
K −=∑
The marginal diversity 'iD of a breed indicates the change of the expected diversity in the
whole population when the extinction probability of breed i is increased by one unit.
While the position of the breeds in the tree and the extinction probability of the
neighbouring breeds in the tree play important roles for the value of the marginal

5th CHAPTER Conservation priority
86
diversity of a breed, the extinction probability of breed i itself is not taken into account.
The marginal diversity of the breed i (Simianer et al., 2003) is
ii z
SDED
∂∂= )](['
Conservation potential describes the possible increase in expected diversity if an
endangered breed is made completely safe. Conservation potential iCP of breed i will be
calculated as follows (Simianer et al., 2003):
iii zDCP ×−= '
Optimum allocation of conservation funds
To maximize the expected amount of between breed diversity conserved, a hypothetical
conservation fund was allocated among nine Vietnamese breeds under the assumptions of
three different models as suggested by Simianer et al. (2003). These models reflect
different approaches to breed conservation.
Model A assumes that the effect of a conservation program is to increase the effective
population size by an additive increment which is proportional to the amount of money
spent per animal in this population. In this scenario, the height of the premium per animal
plays an important role in the farmer decision to keep animals.
Model B assumes a multiplicative effect of a conservation program on the effective
population size which is proportional to the amount of money spent per individual in the
population. The objective of this model is to increase or to keep flock sizes constant. A
practical approach is to raise one male offspring of each sire and one female offspring of
each dam for replacement. Thus, expenditures are obviously relative to the population
size and, with more animals, more extension specialists are required.
Model C assumes a multiplicative effect on the effective population size proportional to
the funds spent per population. Under this model, the effect of a conservation scheme on
effective population size is assumed to be multiplicative with a factor that is only
depending on the amount of money spent in any population, irrespective of its effective
size. In this model, costs of information channels are independent on the population size

5th CHAPTER Conservation priority
87
and number of farmers due to an assumption of breeding organization established.
Therefore, the cost for extension specialists is neglected.
These three models span a wide range of possible conservation policies, and so the
application of all three models will identify the relevant range of sensible allocation
patterns. For more details of the models, see Simianer et al. (2003).
Results
Current diversity, maximum-likelihood tree and genetic diversity contribution
The actual diversity for the whole group was 0.531. The maximum-likelihood tree
showed that the Northwest chicken breed H’mong and the mixed chicken breed Te
grouped together into one cluster. Four Red River Delta chicken breeds (Mia, Ri, Ho and
Dong Tao) formed a close cluster with an outlier of the South Central Coast chicken
breed Choi while the Mekong Delta chicken breed Ac had its own branch. The Mekong
Delta chicken breed Tau Vang clustered together with the two Chinese chicken breeds
into a separate branch. The three chicken breeds, Ac, Choi and Dong Tao showed the
highest genetic contributions (Figure 1).

5th CHAPTER Conservation priority
88
Figure 1. Marginal genetic diversity and genetic diversity contribution of breeds for nine
Vietnamese local breeds only and considering two Chinese breeds.
Extinction Probabilities
All calculated extinction probabilities are shown in Table 3. Over all breeds, the average
estimated extinction probability is 0.485 ± 0.121. The highest estimated extinction
probability of 0.735 was observed in the Te chicken breed, followed by the Ho (0.593)
and Dong Tao chicken breeds (0.545), while the lowest corresponding values were found
in the Choi, Ri, Ac, Mia and H’mong chicken breeds, ranging from 0.373 to 0.409.
Statistically significant positive correlations existed between the five pairs of variables:
CHA and POS, PRO and DIC, CUL and CRO, CUL and ORG. The variable POS and
CHA were significantly and positively correlated with the extinction probability (Table
4).

5th CHAPTER Conservation priority
89
Table 3. Estimated extinction probabilities (z) of Vietnamese local chicken breeds.
Variable* Breed
POS CHA DIS CRO DIC PRO ORG CON ECO SPE CUL z
Ac 0.100 -0.093 0.000 0.000 0.000 0.000 0.100 0.300 0.043 0.000 0.100 0.406
Choi 0.200 -0.020 0.000 0.000 0.000 0.000 0.000 0.100 0.070 0.100 0.030 0.373
Dong Tao 0.300 -0.007 0.100 0.000 0.013 0.000 0.100 0.100 0.067 0.100 0.073 0.545
Ho 0.300 0.167 0.200 0.000 0.000 0.000 0.000 0.100 0.080 0.100 0.000 0.593
Ri 0.000 -0.033 0.100 0.100 0.000 0.000 0.100 0.000 0.063 0.100 0.100 0.396
Mia 0.200 -0.007 0.100 0.000 0.000 0.000 0.000 0.100 0.050 0.100 0.053 0.409
Te 0.300 0.20 0.100 0.100 0.100 0.100 0.100 0.000 0.050 0.100 0.100 0.735
H’mong 0.000 0.000 0.100 0.000 0.100 0.100 0.100 0.000 0.100 0.000 0.050 0.406
Tau Vang 0.000 -0.093 0.100 0.100 0.000 0.000 0.100 0.300 0.047 0.100 0.100 0.502
Mean 0.156 0.013 0.089 0.033 0.024 0.022 0.067 0.111 0.063 0.078 0.067 0.485
SD 0.133 0.103 0.060 0.050 0.043 0.044 0.050 0.116 0.018 0.044 0.037 0.121
* See Table 2 for definitions of variable abbreviation

5th CHAPTER Conservation priority
90
Table 4. Correlation and significance among the extinction probability (z) of Vietnamese
local breeds and variable* used for its estimation.
POS CHA DIS CRO DIC PRO ORG CON ECO SPE CUL
CHA 0.66b
DIS 0.24 0.57
CRO -0.31 0.12 0.14
DIC 0.02 0.50 0.11 0.17
PRO -0.02 0.50 0.10 0.19 0.99c
ORG -0.44 -0.18 -0.14 0.50 0.41 0.38
CON -0.21 -0.56 -0.34 -0.07 -0.55 -0.54 0.07
ECO -0.06 0.26 0.34 -0.41 0.37 0.36 -0.14 -0.56
SPE 0.45 0.30 0.37 0.38 -0.34 -0.36 -0.38 -0.19 -0.25
CUL -0.39 -0.28 -0.20 0.65b 0.16 0.15 0.84a 0.22 -0.60 -0.15
z 0.61b 0.80a 0.527 0.37 0.43 0.41 0.18 -0.18 -0.14 0.36 0.17
* See Table 2 for definitions of variable abbreviation
a,b,c: P<0.05; 0.01; 0.001

5th CHAPTER Conservation priority
91
Expected future diversity, marginal diversity and conservation potential
The expected diversity after 50 years would be 0.241 ± 0.107. The marginal diversities of
the breeds are shown in Figure 1. In both cases the highest conservation potentials were
observed in the Te, Dong Tao and Ac chicken breeds while the lowest corresponding
estimates were found for the Ri and Mia chicken breeds (Figure 2).
Figure 2. Maximum-likelihood tree of Vietnamese and Chinese breeds, extinction
probabilities of nine Vietnamese breeds and conservation potential for each breed for nine
Vietnamese breeds.
Optimum allocation of conservation funds
Optimal allocation of resources under the three assumed models is given in Figure 3.
Under all three models, the largest share of the available funds is allocated to conserve
the Te chicken breed, followed by Dong Tao and Ac. Model B and C allocate funds only
to three breed (Te, Dong Tao and Ac). Although model A shared funds to five chicken
breeds, the majority (90%) of funds was also distributed to these three breeds. A similar
share of allocation under all three models was given to the Te and Dong Tao chicken
breeds each while the Ho and Tau Vang chicken breed received a relatively minor share
under the model A and no share under model B and C.

5th CHAPTER Conservation priority
92
Figure 3. Maximum-likelihood tree and optimum allocation of resources for nine
Vietnamese breeds under the three models considered.
Discussion
Maximum-likelihood tree and genetic diversity contribution
Given genetic diversity between breeds, the maximum–likelihood tree supports previous
findings based on STRUCTURE analysis (Cuc et al., 2010) who reported that genetic
relationships of the Vietnamese local chickens are related to their geographical
distribution. Small geographical distances between the Red River Delta areas, where the
chicken breeds under study are kept, could enable gene flow between them, resulting in
the Red River Delta chicken breeds grouped together. In contrast, gene flow is hampered
due to a strong geographical isolation between the Mekong Delta breed Ac and the
Northern and the South Central Coast breeds. This might have led to the separate branch
of the Ac breed. In addition, distinct characteristics (i.e., small body size, white feather
and black skin and bone) of the Ac breed could inhibit its gene introgression into other
breeds, causing reproductive isolation. This finding shows a high contribution of the Ac
breed to total diversity. Therefore, it could be an important source of variation which
contributes substantially to a long term conservation plan of national chicken genetic

5th CHAPTER Conservation priority
93
resources and future breeding strategies. Clustering of Tau Vang breed from the Mekong
Delta together with the Chinese chicken breeds is in agreement with the Chinese origin of
the Tau Vang chickens (Linh, 2005). The two Chinese chicken breeds being grouped
separately from the Vietnamese chicken breeds supports the argument that the Chinese
chicken breeds kept in NIAS harbour a separate gene pool different from the Vietnamese
chicken breeds (Cuc et al., 2010). Therefore, the two Chinese chicken breeds should not
be considered as part of the Vietnamese chicken gene pool to be conserved.
A ranking of genetic contribution of the Vietnamese chicken breeds also confirms the
results displayed in the maximum–likelihood tree, in which breeds clustering closely
together in the maximum–likelihood tree were found to have the lowest contribution
while breeds grouped separately showed highest contribution. However, Reist-Marti et al.
(2003) argued that genetic contribution is not the only basis for decisions about
conservation.
Extinction Probabilities
The majority of variables in this study were calculated according to the survey data from
households in the field. Therefore, our scheme estimates the threat of extinction of a
breed in its environmental context, takes the most important factors into account
separately and thus shows the specific impact of different conservation efforts on
particular risk factors. Extinction probability of the breeds estimated in this study is in
reasonable agreement with their known survival states. The average extinction probability
of 48.5% estimated in the Vietnamese local chicken breeds, with four of nine breeds
having values higher than 50%, is corresponding with the FAO’s estimation for the risk
status of the world’s chicken breeds with about 33% considered endangered to critical
breeds and another 40% with unknown risk status (FAO, 2007b). The high extinction
probabilities of three chicken breeds (Te, Dong Tao and Ho) are mainly attributed to their
small population sizes, the unfavourable estimates of population trend (Te and Ho breeds)
and the localized distribution (Ho breed). This finding indicated that these three breeds
are at great risk of being wiped out by natural disasters, disease, or inappropriate
management.
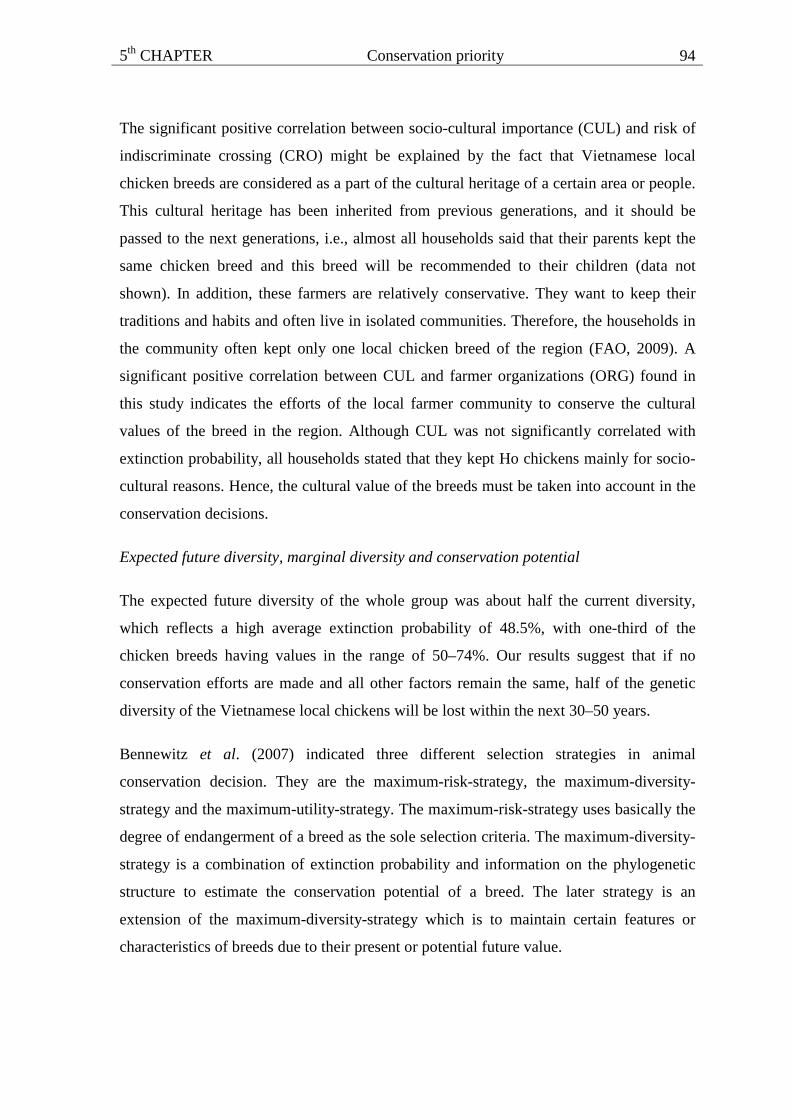
5th CHAPTER Conservation priority
94
The significant positive correlation between socio-cultural importance (CUL) and risk of
indiscriminate crossing (CRO) might be explained by the fact that Vietnamese local
chicken breeds are considered as a part of the cultural heritage of a certain area or people.
This cultural heritage has been inherited from previous generations, and it should be
passed to the next generations, i.e., almost all households said that their parents kept the
same chicken breed and this breed will be recommended to their children (data not
shown). In addition, these farmers are relatively conservative. They want to keep their
traditions and habits and often live in isolated communities. Therefore, the households in
the community often kept only one local chicken breed of the region (FAO, 2009). A
significant positive correlation between CUL and farmer organizations (ORG) found in
this study indicates the efforts of the local farmer community to conserve the cultural
values of the breed in the region. Although CUL was not significantly correlated with
extinction probability, all households stated that they kept Ho chickens mainly for socio-
cultural reasons. Hence, the cultural value of the breeds must be taken into account in the
conservation decisions.
Expected future diversity, marginal diversity and conservation potential
The expected future diversity of the whole group was about half the current diversity,
which reflects a high average extinction probability of 48.5%, with one-third of the
chicken breeds having values in the range of 50–74%. Our results suggest that if no
conservation efforts are made and all other factors remain the same, half of the genetic
diversity of the Vietnamese local chickens will be lost within the next 30–50 years.
Bennewitz et al. (2007) indicated three different selection strategies in animal
conservation decision. They are the maximum-risk-strategy, the maximum-diversity-
strategy and the maximum-utility-strategy. The maximum-risk-strategy uses basically the
degree of endangerment of a breed as the sole selection criteria. The maximum-diversity-
strategy is a combination of extinction probability and information on the phylogenetic
structure to estimate the conservation potential of a breed. The later strategy is an
extension of the maximum-diversity-strategy which is to maintain certain features or
characteristics of breeds due to their present or potential future value.

5th CHAPTER Conservation priority
95
The application of maximum-risk-strategy in this study resulted in the highest
conservation priority for three chicken breeds: Te, Dong Tao and Ho breeds. With this
strategy, maximum genetic diversity could not be maintained due to the Ho breed having
minor genetic contribution and low marginal diversity. In contract, when the selection of
a breed for conservation considers information on phylogenetic structure only, three
chicken breeds (Ac, Choi and Dong Tao) contributed most (Figure 1) although the Ac and
Choi have a low degree of endangerment. Therefore, using either the maximum-risk-
strategy or information on phylogenetic structure only are both sub-optimal. When the
maximum-diversity-strategy was applied, three chicken breeds (Te, Dong Tao and Ac)
represented the highest estimated conservation potential. The high conservation potentials
of these three breeds are mainly attributed to high extinction probability estimated in the
Te and Dong Tao breeds and the elevated value of the marginal genetic diversity
observed in the Ac breed.
Considering the maximum-utility-strategy, when the objective of a conservation plan is to
maintain certain features or characteristics of the Vietnamese breeds (i.e., unique features
of short and thick legs, dwarfism as well as beautiful appearance), conservation of such
features is simply achieved by putting effort into conservation of the single breed (i.e.,
Dong Tao, Te and Ho breeds, respectively) which carry those defined features. If these
breeds are maintained with the defined feature, its marginal utility will be very high. The
gene pool will completely lose the feature if these breeds carrying the feature go extinct.
Optimum allocation of conservation funds
The importance of an optimal allocation of budget was indicated by Simianer (2002) who
found that with optimum allocation only about 50% of the resources are required for the
same conservation effect that can be achieved when conservation funds either are shared
equally over all breeds or are focused on the most endangered breeds only. In this study,
model A assumes that a fix amount of money per year pays a premium to the owner of
chickens, balancing some of the economic inferiority of those chickens. Model B
presumes that a basic strategy for maintaining diversity in small population is to keep
family size constant. In this case, the costs are proportional to the population size. Model
C reflects the same strategy as Model B but the costs are independent of the population
size. The results of this study shows that population priority for optimum allocation of
5th CHAPTER Conservation priority
96
conservation funds for Vietnamese breeds is almost independent of the assumed
allocation patterns. Under all three models, three breeds (Te, Dong Tao and Ac) are prime
candidates for conservation expenditure which might be attributed to their highest
conservation potential. This also shows that the priorisation approach is robust with
respect to the assumed model of allocation. Since the definition of a detailed cost model
for conservation measures is highly complex (Reist-Marti et al., 2006), the demonstrated
robustness of decision making towards a misspecification of the cost model appears
reassuring. This finding is in agreement with the study of Simianer et al. (2003) who
found that in general the highest amount of funds should be allocated to the breeds that
show a large conservation potential.
The importance of a particular breed for the conservation of genetic diversity and
allocation of conservation funding depends on the strategy chosen. The Weitzman
approach applied in this study did not take into account migration between breeds or
within breed diversity (Eding and Meuwissen, 2001; Caballero and Toro, 2002 and Tapio
et al., 2006). Although reducing extinction probability in the Weitzman approach by
increasing the effective population size is also a measure to prevent a loss of the within
breed genetic diversity (Simaner et al., 2003), and a study of Pinent et al. (2005) in
European chicken breeds showed that breeds with very small population size were not
favoured by the Weitzman’s approach, the shortcoming of this approach should be borne
in mind. The contribution to the Weitzman diversity suggests keeping separate breeds to
maintain allelic diversity within species, ensuring access to maximum adaptive potential
of species (Simianer, 2005 and Tapio et al., 2006). The Vietnamese local breeds were
kept in different agro-ecological zones across the country with various local production
systems. The Vietnamese farmers keep their local breed only in the region (FAO, 2009).
In addition, the analysis of the genetic structure of these breeds indicated an absence of
gene flow between breeds kept in the different agro-ecological zones (Cuc et al., 2010).
Therefore, the Weitzman approach with the assumption of no crossbreeding is considered
to be a reasonable fundament for decision-making on conservation strategy for the
Vietnamese local chicken breeds.
The results of this study indicate that the conservation potential of the Vietnamese local
breeds varies considerably. The between genetic diversity of Vietnamese local chicken
breeds can be maintained by conserving and prioritizing the breeds with highest
5th CHAPTER Conservation priority
97
conservation potential. Population priorities for conservation allocation of the Vietnamese
breeds do not depend on which cost model was used. Conservation funds should be
primarily spent on three breeds (Te, Dong Tao and Ac) with the highest conservation
potential if the conservation budgets are limited. The breed Te and Dong Tao each
receive a similar share under all three models. However, conservation decisions also have
to take into account other factors, such as genetic diversity within breed, socio-cultural
role, special features, current or future economic and scientific values of the breed. The
choice of breeds and the amount of money allocated to each breed should also consider
the cost effectiveness of conservation activities in different breeds, the effects of the
optimal conservation programs and the cost of conservation program as indicated by
Reist-Marti et al. (2006).
Acknowledgements
The authors express sincere thanks to the Vietnamese farmers for providing information
and chicken samples, to A. Weigend and A. Flörke, Institute of Farm Animal Genetics at
Mariensee for technical assistance, and to Prof. Dr. Clemens B.A. Wollny, Faculty of Life
Sciences, University of Applied Sciences Bingen, Germany for the project initiative.
N.T.K. Cuc had a stipend from German Academic Exchange Service (DAAD), and the
project was funded by the German Federal Ministry of Education and Research (BMBF).
References
Bennewitz J., Eding H., Ruane J. and Simianer H. 2007. Selection of breeds for
conservation. In Oldenbroek K. (Eds). Utilisation and conservation of farm animal
genetic resources. Wageningen Academic Publishers, the Netherlands: 131-145.
Burgos S., Hinrichs J., Otte J., Pfeiffer D. and Roland-Holst D. 2008. Poultry, HPAI and
livelihoods in Viet Nam – A Review. Mekong Team Working Paper No. 2, FAO,
Rome.

5th CHAPTER Conservation priority
98
Caballero A. and Toro M.A. 2002. Analysis of genetic diversity for the management of
conserved subdivided populations. Conservation Genetics 3: 289-299.
Canon J., Alexandrino P., Bessa I., Carleos C., Carretero Y., Dunner S., Ferran N., Garcia
D., Jordana J., Laloe D., Pereira A., Sanchez A. and Moazami-Goudarzi K. 2001.
Genetic diversity measures of local European beef cattle breeds for conservation
purposes. Genetics Selection Evolution 33: 311-332.
Cuc N.T.K., Simianer H., Eding H., Tieu H.V., Cuong V.C., Wollny C.B.A., Groeneveld
L.F. and Weigend S. 2010. An assessment of genetic diversity of Vietnamese local
chicken breeds using microsattellites. Animal Genetics (in press).
Eding H. and Bennewitz J. 2007. Measuring genetic diversity in farm animals. In
Oldenbroek K. (Eds). Utilisation and conservation of farm animal genetic resources.
Wageningen Academic Publishers, the Netherlands: 103-130.
Eding H. and Meuwissen T.H.E. 2001. Marker based estimates of between and within
population kinships for the conservation of genetic diversity. Journal of Animal
Breeding and Genetics 118: 141-159.
Epprecht M. 2005. Geographic dimensions of livestock holdings in Viet Nam: Spatial
relationships among poverty, infrastructure and environment. PPLPI Working Paper
24.
Fabuel E., Barragán C., Silió L., Rodríguez M.C. and Toro M.A. 2004. Analysis of
genetic diversity and conservation priorities in Iberian pigs based on microsatellite
markers. Heridity 94: 104-113.
FAO 2007a. Global Plan of Action for Animal Genetic Resources and the Interlaken
Declaration. Rome. http://www.fao.org/ ag/againfo/ programmes/en/
genetics/documents/ Interlaken/GPA_en.pdf). Accessed on 22/08/2009.
FAO 2007b. The State of the World’s Animal Genetic Resources for Food and
Agriculture, edited by B.Rischkowsky and D. Pilling. Rome. http:// www.fao.org/
docrep/ 010/ a1250e/ a1250e00.htm. Accessed on 25/08/2009.

5th CHAPTER Conservation priority
99
FAO 2009. The Bangladesh Model and Other Experiences in Family Poultry
Development.
http://www.fao.org/Ag/againfo/themes/en/infpd/documents/econf_bang/dis_output.ht
ml. Accessed on 16/05/2009.
Felsenstein J. 1993. PHYLIP (phylogeny inference package). Version 3.57c. Department
of Genetics, University of Washington, Seattle.
http://evolution.genetics.washington.edu/phylip.html. Accessed on 20/05/2008.
Granevitze Z., Hillel J., Chen G.H., Cuc N.T.K., Feldman M., Eding H. and Weigend S.
2007. Genetic diversity within chicken populations from different continents and
management histories. Animal Genetics 38: 576-583.
Hoffman I. 2009. The global plan of action for animal genetic resources and the
conservation of poultry genetic resources. World’s Poultry Science Journal 65: 286-
297.
Laval G., Iannuccelli N., Legault C., Milan D., Groenen M.A.M., Giuffra E., Andersson
L., Nissen P.H., Jargensen C.B., Beeckmann P., Geldermann H., Foulley J.L.,
Chevalet C. and Ollivier L. 2000. Genetic diversity of eleven European pig breeds.
Genetics Selection Evolution 32: 187-203.
Leroy G., Verrier E., Meriaux J. C. and Rognon X. 2009. Genetic diversity of dog breeds:
between-breed diversity, breed assignation and conservation approaches. Animal
Genetics 40: 333-343.
Linh V.T. 2005. The world of rare chickens in Vietnam. Vietbao Newspaper (issued on
February 11st ), Vietnam.
National Institute of Animal Sciences (NIAS) 2000. Project “Vietnam livestock genetic
resources conservation: Background – Methodology – Activity – Achievement –
Programs”. http://www.vcn.vnn.vn/. Accessed on 10/05/2009.
Page R.D. 1996. TreeView: an application to display phylogenetic trees on personal
computers. Comput. Appl. Biosci. 12: 357-358.

5th CHAPTER Conservation priority
100
Pinent T., Simianer H. and Weigend S. 2005. Weitzman’s approach and conservation of
breed diversity: First application to German chicken breeds. Proceeding of the Role of
Biotechnology, Rome, Italy. http://www.fao.org/biotech/docs/pinent.pdf assessed on
05/01/2010.
Reist-Marti S.B., Abdulai A. and Simianer H. 2006. Optimum allocation of conservation
funds and choice of conservation programs for a set of African cattle breeds. Genetics
Selection Evolution 38: 99-126.
Reist-Marti S.B., Simianer H., Gibson J., Hanotte O. and Rege J.E.O. 2003. Analysis of
the actual and expected future diversity of African cattle breeds using the Weitzman
approach. Conservation Biology 17: 1299-1311.
Reynolds J., Weir B.S. and Cockerham C.C. 1983. Estimation of the coancestry
coefficient: Basis for a Short-Term Genetic Distance. Genetics 105: 767-779.
Scherf B.D. (Ed.) 2000. World watch list for domestic animal diversity, 3rd edition. FAO,
Rome.
Simianer H. 2002. Noah’s dilemma: which breeds to take aboard the ark? Proc. 7th World
Congress on Genetics Applied to Livestock Production, CD-Rom Communication
No. 26-02.
Simianer H. 2005. Decision making in livestock conservation. Ecological Economics 53:
559-572.
Simianer H., Reist-Marti S.B., Gibson J., Hanotte O. and Rege J.E.O. 2003. An approach
to the optimal allocation of conservation funds to minimize loss of genetic diversity
between livestock breeds. Ecological Econonics 45: 377-392.
Su V.V., Thien N.V., Nhiem D.T., Ly V.L., Hai N.V. and Tieu H.V. 2004. Atlas of farm
animal breeds in Vietnam. Agricultural Publishers, Hanoi, Vietnam.
Tapio I., Varv S., Bennewitz J., Maleviciute J., Fimland E., Grislis Z., Meuwissen T.H.E.,
Miceikiene I., Olsaker I., Viinalass H., Vilkki J. and Kantanen J. 2006. Prioritization

5th CHAPTER Conservation priority
101
for conservation of northern European cattle breeds based on analysis of
microsatellite data. Conservation Biology 20: 1768-1769.
Thaon d’Arnoldi C., Foulley J.L. and Ollivier L. 1998. An overview of the Weitzman
approach to diversity. Genetics Selection Evolution 30: 149-161.
Thirstrup J.P., Pertoldi C. and Loeschcke V. 2008. Genetic analysis, breed assignment
and conservation priorities of three native Danish horse breeds. Animal Genetics 39:
495-505.
Tieu H.V., Ly L.V., Sat L.V. and Su V.V. 2008. Vietnamese livestock genetic resources
conservation & exploitation from 1990 to 2007. Vietnamese Journal of Animal
Science and Technology special volume: 1-10.
Weitzman M.L. 1992. On diversity. Quarterly Journal of Economics CVII: 363-405.
Woolliams J.A. 2004. Managing populations at risk. In Simm G., Villanueva B., Sinclair
K.D. and Townsend S. (Eds). Farm animal genetic resources. Nottingham University
Publisher, Nottingham, United Kingdom: 85-106.
Zander K.K., Drucker A.G., Holm-Müller K. and Simianer H. 2009. Choosing the
“cargo” for Noah’s Ark – ApplyingWeitzman’s approach to Borana cattle in East
Africa. Ecological Economics 68: 2051-2057.
Zerabruk M., Benewitz J., Kantanen J., Olsaker I. and Vangen O. 2007. Analysis of
genetic diversity and conservation priorities for six north Ethiopian cattle breeds.
Journal of Animal Breeding and Genetics 124: 236-241.

6th CHAPTER General discussion
102
6th
CHAPTER
General discussion

6th CHAPTER General discussion
103
General discussion
The overall goal of this study was to characterize the diversity of the Vietnamese local
chicken breeds and to identify population priorities for conservation. The specific aims
were 1) to assess and explain the population genetic structure of the Vietnamese local
chicken breeds, 2) to characterise Vietnamese local chickens in relation to other Asian
breeds from China and wild chickens, 3) to estimate conservation potentials for
conservation priorities, and 4) to define an optimal allocation of limited conservation
funds to Vietnamese chicken breeds. Vietnamese local chickens play an important role in
small householder farms but their existence is under threat due to low performance of
local breeds, farmers' preferences for exotic breeds and the lack of adequate conservation
strategies (Tieu et al., 2008). The current national conservation programs rely on
definition of breeds based on phenotypic characteristics only. In addition, conservation
decisions neglect genetic contribution of the breeds to total genetic diversity and
allocations of conservation funds might not guarantee the avoidance of loss of genetic
variability in the most efficient way (Tieu et al., 2008).
As described in Chapter 1, in Vietnam, as in other developing countries (Kitalyi and
Mayer, 1998; Coplan and Alders, 2005; Alders and Pym, 2010), local chickens are owned
by families at the village level. Production of local chickens is feasible at village level, in
which low investments are required. Although chickens require low inputs, chicken
production makes an important contribution to livability of local populations through
being an important protein source and contributing to poverty alleviation, reduction of
gender inequalities and maintenance of cultural traditions (Epprecht, 2005; Cuc et al.,
2006 and Burgos et al., 2007). In addition, the genetic potential of indigenous chicken
could be a reservoir of genetic variation. Local chickens might contain genes and alleles
pertinent to their adaptation to particular environmental conditions and local breeding
goals (Horst, 1989) which are not present in the highly selected commercial lines.
Genetic diversity within and between the Vietnamese local chicken breeds at the
autosomal level was assessed in Chapter 2. Microsatellites are highly polymorphic, co-
dominant DNA markers which have been widely used in population genetics since they
give much information for a limited number of loci (Tixier-Boichard et al., 2009) while
single nucleotide polymorphism (SNPs) are a more recent development (Twito et al.,
6th CHAPTER General discussion
104
2007 and Muir et al., 2008). Genetic diversity estimations using microsatellite markers
have been shown to provide a reliable assessment of genetic diversity (Hillel et al., 2007;
Berthouly et al., 2008; Granevitze et al., 2007 and 2009). A set of 29 microsatellite
markers used in this study is based on a recommendation of FAO (2004). These markers
were also used to assess genetic diversity of chicken populations in previous studies (Cuc
et al., 2006; Hillel et al., 2007; Muchadeyi et al., 2007; Chen et al., 2008; Granevitze et
al., 2007; 2009 and Bodzsar et al., 2009). Using the same markers provides an insight
into genetic variability of the Vietnamese chicken breeds in comparison to those of the
other chicken breeds found at the global level.
The mean allele number (6.09 ± 0.67) and expected heterozygosity estimate (0.634 ±
0.034) per population in this study is lower that estimated in Zimbabwean chickens (6.32
± 0.24 and 0.651 ± 0.007, respectively, Muchadeyi et al., 2007) but higher than reports
on Chinese (4.61 ± 0.77 and 0.568 ± 0.054, respectively, Chen et al., 2008) and
Hungarian chickens (3.42 ± 0.48 and 0.518 ± 0.039, respectively, Bodzsar et al., 2009) as
well as commercial lines (3.58 ± 0.60 and 0.52 ± 0.077, respectively, Granevitze et al.,
2007). The high numbers of alleles and expected heterozygosity of the Vietnamese breeds
compared to Chinese, Hungarian and purebred populations were expected, because
Vietnamese breeds were field populations without any management, while Chinese
breeds were collected from conservation flocks (Chen et al., 2008), and Hungarian as
well as purebred populations were selected for special traits and/or were of small
population size (Bodzsar et al., 2009 and Granevitze et al. 2007, respectively). High level
of genetic diversity was observed in Vietnamese chickens because these field flocks are
freely roaming during scavenging. This fact might result in the migration of chickens
from one flock to the neighbor’s one. The migration results in a continuous gene flow
between these flocks, conserving a high number of alleles and the heterozygosity within a
breed. This applies only at village level. The low numbers of alleles and expected
heterozygosity of the Vietnamese village chickens compared to Zimbabwean village
chickens might be due to differences in population structures observed in these two
countries. No population sub-structuring was found between Zimbabwean populations
(Muchadeyi et al., 2007) whereas the Vietnamese breeds showed a clear sub-structuring
in this study. As a consequence, the level of gene flow between the Zimbabwean
populations is higher than between the Vietnamese breeds.
6th CHAPTER General discussion
105
The separation between the Vietnamese breeds in three geographically defined clusters,
namely the northern part, the South Central Coast as well as the Mekong Delta in the
STRUCTURE analysis may reflect gene pools with different genetic features due to
adaptation to the specific environments and limited gene flow as a result of geographical
isolation between them. Taking into account that geographical isolation of breeds
contributes to genetic differentiation (Tixier-Boichard et al. 2009), the genetic sub-
structure may indicate that the Vietnamese chickens in different regions may comprise
specialized populations. The large geographic distances and the difference in topography,
soil pattern, climate, farming systems, social and economic factors between these regions
have played an important role in the structuring of the breeds. A high level of genetic
differentiation between breeds of different areas found in this study suggests that the
Vietnamese local breeds might have evolved a unique adaptation to their agricultural
production system and agro-ecological environment. They may present a diverse gene
pool that could comprise unique genetic features. However, microsatellites used in this
study do not infer about adaptative genetic diversity of the Vietnamese local chickens.
Further studies on assessing genetic polymorphism in candidate genes and large scale
sequence studies should be, therefore, taken into consideration.
The results of this study showed that the two Chinese chicken breeds kept in the National
Institute of Animal Sciences (NIAS Chinese breeds) were genetically distinct from the
Vietnamese chicken gene pool. Although they were imported to Vietnam in 1995 (Tam
Hoang) and 2003 (Luong Phuong), these two breeds have not been introgressed into the
Vietnamese local chicken gene pool with an exception of the Tau Vang breed which
showed an admixture between Vietnamese and NIAS Chinese gene pools in the
STRUCTURE analysis. Genetic distinctiveness of the two NIAS Chinese breeds from the
Vietnamese local breeds found in this study suggests that the two NIAS Chinese breeds
are not Vietnamese genetic resources and are, therefore, not of high priority for
conservation in Vietnam.
Microsatellites are autosomal markers. Loci are either unlinked and alleles of different
loci are inherited independently from each other or, if loci are linked, they might be
rearranged in the process of the recombination, If loci are not linked to genes under
selection their changes in allele frequencies are mainly affected by genetic drift (Randi et
al., 2004). Mitochrondrial DNA (mtDNA) sequences are maternally inherited and tend to

6th CHAPTER General discussion
106
be maintained amid populations interbreeding. They are less affected by genetic drift
(Feulner et al., 2004). A share of maternal lineages between recent populations and
populations dating further back in time can be analysed due to the absence of
recombination in mtDNA. The mtDNA sequences are capable of providing information
on genetic structure which is inherited on the maternal path and can be used to explain the
observed genetic structures in particular when combined with other nuclear markers such
as microsatellites.
The analysis of the mtDNA sequences in Chapter 3 showed that the Vietnamese breeds
can be assigned to eight distinct maternal lineages based on a skeleton reflected suggested
regions of domestication in chickens. This skeleton plays an important role because it is
constructed from clades which indicate apparent geographic affiliation for domestication
events. The skeleton was based on the most frequent haplotypes of the nine clades of
Liu's network (Liu et al., 2006) and three additional clades (D, G and F) of Oka et al.
(2007). In eight distinct maternal lineages contributed to Vietnamese breeds found, three
maternal lineages which presumably originated from Yunnan, South and Southwest
China and/or surrounding areas (i.e., Vietnam, Burma, Thailand and India) have the most
common contribution to the Vietnamese local chickens. This finding supports the report
of (Taylor, 1983) who argued that Vietnamese people have originated from China due to
human immigration from southern China into Vietnam in the 3rd century B.C. The result
of this study is in agreement with the earlier reports (Liu et al., 2006; FAO, 2007; Oka et
al., 2007 and Kanginakudru et al., 2008) which indicated that domestication in chicken
occurred in China, Southeast Asia and Indian subcontinent.
The nine Vietnamese breeds studied shared the two major haplotypes, resulting in no
population sub-structuring. The hypothesis can be built that the Vietnamese breeds, which
were distributed across the country, share two common maternal lineages leading to lack
of divergence between them. This is supported by a report on human migration from the
North to the South of Vietnam (Nyiri and Saveliev, 2002). Although no population sub-
structuring between the nine Vietnamese breeds was found at the mtDNA level, they are
diverse in haplotypes. This haplotype diversity corresponded well to the high degree of
variability found at the microsatellite level (Chapter 2). High haplotype diversity within
Vietnamese breeds might be attributed to a high number (n = 8) of distinct maternal
lineages contributing to Vietnamese breeds. Haplotype diversity of the Vietnamese breeds
6th CHAPTER General discussion
107
(0.78 ± 0.10) is higher than that of other chickens in the studies of Muchadeyi et al.
(2008) and Liu et al. (2004). Haplotype diversities of Zimbabwean chickens and purebred
lines are 0.67 ± 0.05 and 0.60 ± 0.20, respectively (Muchadeyi et al., 2008), and three of
12 Chinese breeds show only one haplotype in the study of Liu et al. (2004).
The lack of a detectable population sub-structuring between Vietnamese local breeds at
the mtDNA level is contrary to the findings at the microsatellite level where clustering of
Vietnamese local breeds was correlated with geographical distance. This differenc may be
due to the different nature of the two marker systems reflecting different evolutionary
forces and time scales. Microsatellite markers describe the consequences of recent genetic
isolation between populations (Randi et al., 2004) while mtDNA is informative for
assessing long-term maternal lineages (Feulner et al., 2004). Therefore, this finding
suggests that the Vietnamese breeds which are recently genetically isolated share various
maternal lineages. In addition, a lower mutation rate in mtDNA sequences than in
microsatellites, as argued by Feulner et al. (2004), could be used to explain the different
findings found in this study. The observation in this study is in agreement with the study
of Johnson et al. (2003) who indicated that recent fragmentation and isolation of greater
prairie-chicken populations in Midwestern North America has had a stronger effect on
microsatellite than on mtDNA population structure.
The results of mtDNA analysis also showed that the two NIAS Chinese breeds clustered
into a distinct clade separate from the Vietnamese breeds. This suggests that the NIAS
Chinese chickens originated from a different maternal gene pool than the Vietnamese
chickens. Both mtDNA and microsatellite findings strengthen the argument that the two
gene pools most likely have been isolated from each other for a long time. A clear
differentiation between the Vietnamese gene pool and the two NIAS Chinese breed found
at both genetic levels (Chapter 2 and 3) raises questions about divergence between the
Vietnamese and the Chinese chicken gene pool and the level of representativeness of the
two NIAS Chinese for the Chinese chicken gene pool. Therefore, a wider range of
indigenous Chinese breeds taken from a previous study of Chen et al. (2008) was
included to answer these questions as indicated in Chapter 4.
The result of Chapter 4 indicates that the two NIAS Chinese breeds are part of the
Chinese gene pool. The findings in this chapter provide additional evidence that the
6th CHAPTER General discussion
108
Vietnamese gene pool is genetically different from the Chinese gene pool even when a
wider range of breed is considered. This indicates that the Vietnamese and Chinese
chickens are isolated from each other and a restricted gene flow occurred between them.
The only exception is the breed Chahua which has originated from the Yunnan region.
The clustering of this breed together with Vietnamese breeds strengthens the argument
(Chapter 3) that suggested Yunnan, South and Southwest China and/or surrounding areas
(i.e., Vietnam, Burma, Thailand and India) as origins of the Vietnamese breeds.
Compared to the reference Chinese breeds, the Vietnamese breeds showed a low estimate
of genetic diversity between breeds (FST = 0.051 ± 0.030 vs. 0.151 ± 0.050, respectively)
but a high average value of expected heterozygosity (0.634 ± 0.034 vs. 0. 568 ± 0.054,
respectively). The core set contribution significantly correlated with the expected
heterozygosity found in this study. This explains why the Vietnamese breeds contributed
more genetic diversity to the total diversity of a core set than the reference Chinese
breeds, even if genetic diversity between Vietnamese breeds is lower than the reference
Chinese breeds. The high contribution of the Vietnamese breeds to the total set agrees
well with the number of private alleles observed in the Vietnamese group. This number
was about twice as much as that observed in the reference Chinese breeds although the
sample size of Vietnamese breeds is lower than the Chinese breeds (nine breeds vs. 14
breeds, respectively).
Furthermore, the Vietnamese breeds clustered together with the Red Jungle fowl
populations. This finding indicates that, compared to Chinese gene pool, genetic diversity
of the Vietnamese chicken gene pool is more overlapping with that of the Red Jungle
Fowl populations. Several previous studies (Darwin, 1868; Fumihito et al., 1996 and
Hillel et al., 2003) stated the hypothesis that the Red Jungle fowl was the main ancestor
of the domesticated chicken. Based on the assumption that the more distant populations
are the more different they will be in terms of their genetic features, the results of this
study suggest that the Vietnamese gene pool might carry more genetic features of the
ancestor of domesticated chicken than the NIAS and reference Chinese. Therefore the
Vietnamese chicken breeds could be considered as an important source of chicken genetic
diversity which needs to be conserved to prevent the loss of valuable genetic variability
and unique characteristics.

6th CHAPTER General discussion
109
The expected diversity of all Vietnamese breeds and the conservation potential of each
breed were estimated in Chapter 5. The expected diversity reflects the amount of diversity
to be expected after 30 to 50 years if no conservation efforts are made. Conservation
potential of a breed reflects how much the expected diversity can be increased if this
breed is made completely safe. These estimations were based on the approach suggested
by Weitzman (1992 and 1993) and illustrated by Thaon d’Arnoldi et al. (1998). In
addition, optimal allocation of conservation funds to minimize loss of genetic diversity
between these breeds was investigated. Three cost models reflect the conservation effect
per unit conservation fund spent in terms of reduced extinction probability. They span a
wide range of possible conservation policies as indicated by Simianer et al. (2003). Given
the information on the budget spent for conservation in all breeds is available, one can
derive the optimum allocation of the same amount of resources, in the sense of optimising
the objective function.
A difference of Weitzman’s approach compared to the core set method is that the
Weitzman approach uses only genetic distances, so it does not take into account within
breed diversity. The other difference is its iterative character. The approach designates the
contribution to total diversity for each breed in dependence of all other breeds and
calculates its conservation potential not only based on the gain of saved diversity per
amount spent on a specific breed but also on extinction probability affected by socio-
economic factors.
The 11 parameters to determine extinction probabilities in this study relied on the report
of Reist-Marti et al. (2003). They are mainly based on the effective population size, the
population trend and conservation schemes. This method was also used to estimate the
extinction probability of North Ethiopian cattle breeds (Zerabruk et al., 2007) and was
adapted for evaluating the degree of endangerment of German chicken breeds (Pinent et
al., 2005) and Borana cattle breeds in East African (Zander at al., 2009). The scheme
used in this study yields reasonable estimates of extinction probabilities for the
Vietnamese breeds, which were significantly influenced by the population size and its
recent change. The extinction probability over all Vietnamese breeds was lower than
German breeds (49% vs. 59%, respectively) but in the same range with the FAO’s
estimation for the world’s chicken breeds which indicated that about 33% of the breeds
are considered endangered to critical and another 40% of the breeds with unknown risk

6th CHAPTER General discussion
110
status (FAO, 2007). The high extinction probability of Vietnamese breeds compared to
German breeds can be explained by the fact that chicken production in Vietnam is mainly
based on local breeds (Desvaux et al., 2008) while Germany is one of the European
countries that have the most highly specialized livestock industries, in which production
is dominated by a small number of commercial breeds (FAO, 2007), and local breeds are
mainly maintained by hobby keepers and fancy breedes, resulting in their high risk status.
The maximum–likelihood tree supports the results of Chapter 2, that genetic relationships
of Vietnamese local chickens are related to their geographical distribution. A separate
clustering of the two NIAS Chinese chicken breeds from Vietnamese gene pool is in
agreement with the results in Chapter 2 and Chapter 3. Therefore, it is clear that these two
breeds should not be considered as part of Vietnamese chicken gene pool to be conserved.
The expected genetic diversity of Vietnamese breeds after 30 – 50 years was about a half
of the current diversity, and the coefficient of variation was about 10%. This finding
implies that conservation efforts are needed to avoid the erosion of genetic diversity
between Vietnamese breeds. A clear definition of objectives is crucial for all conservation
activities (Simianer, 2005 and FAO, 2007). The first question which has to be answered
in all conservation programs is: which breeds should be prioritised conservation. An
identification of priority breeds for conservation depends on the objectives (i.e.,
maximization of conserved genetic variation or conservation of genetic diversity between
breeds) of conservation programs. When the objective of the conservation measures is to
conserve as much genetic diversity between breeds as possible, then the Weitzman
method with the assumption of no crossbreeding should be used (Simianer, 2005). The
Vietnamese local breeds showed an absence of gene flow between breeds kept in
different agro-ecological zones in the STRUCTURE analysis (Chapter 2). Therefore, the
Weitzman approach used in this study is considered to be a reasonable fundament for
decision-making on conservation strategy for the Vietnamese local chicken breeds.
A high conservation potential can either result from a high degree of endangerment, or
from a high marginal diversity. The marginal diversity reflects the breed’s phylogenetic
position. It also indicates whether closely related breeds are safe from extinction, but is
independent of the breed’s own extinction probability (Simianer et al., 2003). In this
study, The Ri and Mia breeds have the lowest conservation potential due to low estimates

6th CHAPTER General discussion
111
(0.397 and 0.409, respectively) of their extinction probabilities and their closest
relationship displayed in the maximum–likelihood tree. The latter can be explained by the
fact that these two breeds are collected from two districts of the same provinces (Hoai
Duc and Duong Lam district, Ha Tay province, respectively). A small geographical
distance (26.2 km) between these two districts might enable a high level of gene flow
between the Ri and Mia breeds, resulting in a high genetic similarity. In contrast, the
highest conservation potentials observed in the Te, Dong Tao and Ac chicken breeds are
attributed by high extinction probabilities estimated in the Te and Dong Tao breeds and
the distinction of Ac breed from the other Vietnamese breeds represented in the
maximum–likelihood tree. The results suggest that the optimum conservation strategies to
maximise genetic diversity between Vietnamese breeds should prioritize the breeds with
the highest conservation potential, rather than the most endangered breeds. Therefore,
three breeds (Te, Dong Tao and Ac) should be given priorities to be conserved.
FAO (2007) declared that efficient conservation programmes should use available funds
in an optimal way. The following question in all conservation programs is: what share of
the total conservation budget should be allocated to each of the chosen breeds when the
budgets are limited. To conserve as much genetic diversity between Vietnamese chicken
breeds as possible, population priorities for conservation allocation of the Vietnamese
breeds do not depend on which cost model is used. Conservation funds should be
allocated to three breeds (Te, Dong Tao and Ac) under all three models. A similar share
of allocation under all three models is given to the Te and Dong Tao chicken breeds each.
These findings confirm that the allocation priority should be given to those breeds with
the highest conservation potential and not to the most endangered breeds.
Conclusions
From this study several conclusions can be drawn:
i. At the autosomal level, the Vietnamese local chicken breeds from different
agro-ecological zones represent genetically distinct populations. The northern
breeds are clearly separated from the South Central Coast breed and from the
Mekong Delta breed.

6th CHAPTER General discussion
112
ii. The Vietnamese local chicken breeds are highly polymorphic and originated
from eight maternal lineages. These lineages are present across the country.
iii. Two chicken breeds of Chinese origin, Tam Hoang and Luong Phuong, kept in
the National Institute of Animal Sciences are genetically distinct from the
Vietnamese local breeds.
iv. The Vietnamese chicken breeds are genetically separated from the Chinese
chicken gene pool.
v. The Vietnamese chicken breeds are more closely related to wild Red Jungle
fowl populations than the Chinese breeds.
vi. The expected future diversity of the Vietnamese chicken breeds after 30 to 50
years is only a half of the current diversity and average extinction probability of
the breeds was about 49%.
vii. Conservation potential of the Vietnamese chicken breeds varies considerably.
viii. The three breeds Te, Dong Tao and Ac with the highest conservation potential
should be the prime candidates to which conservation funds should be allocated
if budgets are limited.
Implications and recommendations
The high genetic diversity between the Vietnamese chicken breeds and their high
contribution to the total diversity of a given set of populations implies their importance as
a genetic resource for future use. For breeding purposes, the immigration of genes
represented in the different Vietnamese breeds in the various agro-ecological zones is
very effective in re-establishing diversity to catch accumulated inbreeding. However,
further research is needed whether Vietnamese breeds have experienced different
selection pressures because microsatellite markers do not give information on population
differences in relevant production traits. An analysis of polymorphisms at candidate
genes and large scale hight throughput genotyping or sequencing studies would add more
6th CHAPTER General discussion
113
information on the population structures and breed histories of Vietnamese chicken
breeds.
The Vietnamese breeds shared more genetic diversity of the Red Jungle Fowl populations
than the reference Chinese breeds as discussed in Chapter 4. The Vietnamese breeds
clustered together with the Chahua breed which has exchanged gene with Red Jungle
Fowls (Liu et al., 1996). In addition, Berthouly et al. (2009) showed that there is gene
flow between the Vietnamese chickens of the Ha Giang province with Red Jungle fowl
populations. Therefore, Vietnamese Red Jungle fowl populations should be analysed
using the same markers to assess whether gene flow between Red Jungle fowl
populations and Vietnamese breeds used in this study occurred. This further study would
add further information on genetic relationship between the Vietnamese breeds and Red
Jungle fowl populations.
The two NIAS Chinese breeds have been kept as conservation flocks in Vietnam. It is
clear from this study that conservation effort should not pay attention to conserve the two
breeds as a part of Vietnamese chicken gene pool as discussed in Chapter 5 but these two
NIAS Chinese breeds could be kept as a reservoir for breeding purposes to improve
performance of local breeds.
In a formal decision making process, it is necessary to define what are the goals of
conservation. This thesis defines conservation priorities to identify which Vietnamese
chicken breeds should be conserved and how to spend given limited funds to maximize
genetic diversity maintained between breeds and to reduce their extinction probabilities.
The current national conservation programs is based on pre-define breeds and this is a
limitation especially for the Northern Vietnamese chicken breeds which make up one
unstructured gene pool as indicated in Chapter 2. This study should help decision-makers
with a better understanding of the consequences of alternative investment strategies for
conservation. These strategies could be directly applied in the national conservation
programs for other Vietnamese indigenous animal species, such as pig, cattle, etc. if the
objective to conserve these species is the same as in this study.

6th CHAPTER General discussion
114
References
Alders R.G. and Pym R.A.E. 2010. Village poultry: still important to millions, eight
thousand year after domestication. World’s Poultry Science Journal 65: 181-190.
Berthouly C., Bed’Hom B., Tixier-Boichard M., Chen C.F., Lee Y.P., Laloë D., Legros
H., Verrier E. and Rognon X. 2008. Using molecular and multivariate methods to
study the genetic diversity on local European and Asian chicken breeds. Animal
Genetics 39: 121-129.
Berthouly C., Leroy G., Van T.N., Thanh H.H., Bed'Hom B., Nguyen B.T., Vu C.C.,
Monicat F., Tixier-Boichard M., Verrier E., Maillard J. and Rognon X. 2009. Genetic
analysis of local Vietnamese chickens provides evidence of gene flow from wild to
domestic populations. BMC Genetics: 10:1.
Bodzsar N., Eding H., Revay T., Hidas A. and Weigend S. 2009. Genetic diversity of
Hungarian indigenous chicken breeds based on microsatellite markers. Animal
Genetics 40: 516-523.
Burgos S., Hanh P.T.H., Roland-Holst D. and Burgos S.A. 2007. Characterization of
poultry production systems in Vietnam. International Journal of Poultry Sciences 6:
709-712.
Chen G., Bao W., Shu J., Ji C., Wang M., Eding H., Muchadeyi F. and Weigend S. 2008.
Assessment of population structure and genetic diversity of 15 Chinese indigenous
chicken breeds using microsatellite markers. Asian-Australasian Journal of Animal
Sciences 21: 331-339.
Coplan J.W.D. and Alders R.G. 2005. The Australian village poultry development
programme in Asia and Africa. World’s Poultry Science Journal 61: 32-37.
Cuc N.T.K., Muchadeyi F.C., Baulain U., Eding H., Weigend S. and Wollny C.B.A.
2006. An assessment of genetic diversity of Vietnamese H’mong chickens.
International Journal of Poultry Sciences 5: 912-920.
6th CHAPTER General discussion
115
Darwin C. 1868. The variation of animals and plants under domestication. London,
United Kingdom.
Desvaux S., Ton V.D., Thang P.D. and Hoa P.T.T. 2008. A general review and a
description of the poultry production in Vietnam. Agricultural Publisher, Hanoi,
Vietnam.
Epprecht M. 2005. Geographic dimensions of livestock holdings in Viet Nam: Spatial
relationships among poverty, infrastructure and environment. PPLPI Working Paper
24.
FAO 2004. Secondary guidelines for development of national farm animal genetic
resources management plans: measurement of domestic animal genetic diversity
(MoDAD): Recommended microsatellite markers, Rome, Italy.
FAO 2007. The State of the World’s Animal Genetic Resources for Food and
Agriculture, edited by B.Rischkowsky and D. Pilling. Rome. http:// www.fao.org/
docrep/ 010/ a1250e/ a1250e00.htm. Accessed on 25/08/2009.
Feulner P.G.D., Bielfeldt W., Zachos F.E., Bradvarovic J., Eckert I. and Hartl G.B. 2004.
Mitochondrial DNA and microsatellite analyses of the genetic status of the presumed
subspecies Cervus elaphus montanus (Carpathian red deer). Heredity 93: 299-306.
Fumihito A., Miyake T., Takada M., Shingu R., Endo T., Gojobori T., Kondo N. and
Ohno S. 1996. Monophyletic origin and unique dispersalpatterns of domestic fowls.
Proc. Natl. Acad. Sci. USA 93: 6792-6795
Granevitze Z., Hillel J., Chen G.H., Cuc N.T.K., Feldman M., Eding H. and Weigend S.
2007. Genetic diversity within chicken populations from different continents and
management histories. Animal Genetics 38: 576-83.
Granevitze Z., Hillel J., Feldman M., Six A., Eding H. and Weigend S. 2009. Genetic
structure of a wide-spectrum chicken gene pool. Animal Genetics 40: 686-693.
Hillel J., Granevitze Z., Twito T., Ben-Avraham D., Blum S., Lavi U., David L., Feldman
M.W., Cheng H. and Weigend S. 2007. Microsatellites, SNPs and the draft sequence

6th CHAPTER General discussion
116
of the sex chromosomes, as information sources for the assessment of chicken
biodiversity. World's Poultry Science Journal 63: 33-45.
Hillel J., Groenen M.A.M., Tixier-Boichard M., Korol A.B., David L., Kirzhner V.M.,
Burke T., Barre-Dirie A., Crooijmans R.P., Elo K., Feldman M.W., Freidlin P.J.,
Maki-Tanila A., Oortwijn M., Thomson P., Vignal A., Wimmers K. and Weigend S.
2003. Biodiversity of 52 chicken populations assessed by microsatellitetyping of
DNA pools. Genetics Selection Evolution 35: 533-557.
Horst P. 1989. Native fowl as a reservoir for genomes and major genes with direct and
indirect effect on the adaptability and their potential for tropically oriented breeding
plans. Arch. Gefügelk. 53: 93-101.
Johnson J.A., Toepfer J.F. and Dunn P.O. 2003. Contrasting patterns of mitochondrial
and microsatellite population structure fragmented populations of greater prairie-
chickens. Molecular Ecology 12: 3335-3347.
Kanginakudru S., Metta M., Jakati R.D. and Nagaraju J. 2008. Genetic evidence from
Indian red jungle fowl corroborates multiple domestication of modern day chicken.
BMC Evolutionary Biology 8: 174.
Kitalyi A.J. and Mayer A. 1998. Village chicken production systems in rural Africa
household food security and gender issues. The Food and Agriculture Organization of
the United Nations (FAO), Rome, Italy.
Liu R.S., Yu Q., Cheng G.C. and Liu K.F. 1996. Studies on the origin of fowl breeds.
Acta Zoologica Sinica 42: 165-167.
Liu Y.P., Wu G.S., Yao Y.G., Miao Y.W., Luikart G., Baig M., Beja-Pereira A., Ding
Z.L., Palanichamy M.G. and Zhang Y.P. 2006. Multiple maternal origins of chickens:
out of the Asian jungles. Molecular Phylogenetics and Evolution 38: 112-119.
Liu Z.G., Lei C.Z., Luo J., Ding C., Chen G.H., Chang H., Wang K.H., Liu X.X.,
Zhang X.Y., Xiao X.J. and Wu S.L. 2004. Genetic variability of mtDNA sequences in
Chinese native chicken breeds. Asian-Australasian Journal of Animal Sciences 17:
903-907.

6th CHAPTER General discussion
117
Muchadeyi F.C., Eding H., Simianer H., Wollny C.B.A., Groeneveld E. and Weigend S.
2008. Mitochondrial DNA D-loop sequences suggest a Southeast Asian and Indian
origin of Zimbabwean village chickens. Animal Genetics 39: 615-622.
Muchadeyi F.C., Eding H., Wollny C.B.A., Groeneveld E., Makusa S.M., Shamseldin R.,
Simianer H. and Weigend S. 2007. Absence of population structuring in Zimbabwe
chicken ecotypes inferred using microsatellite analysis. Animal Genetics 38: 332-339.
Muir W.M., Wong G.K.S., Zhang Y., Wang J., Groenen M.A.M., Crooijman R.P.M.A.,
Megens H.J., Zhange H., Okimoto R., Vereijkeng A., Jungerius A., Albersg G.A.A.,
Lawley C.T., Delany M.E., MacEachern S. and Cheng H.H. 2008. Genome-wide
assessment of worldwide chicken SNP genetic diversity indicates significant absence
of rare alleles in commercial breeds. PNAS. 105: 17312-17317.
Nyiri P. and Saveliev I. 2002. Globalizing Chinese Migration: Trends in Europe and Asia
Research in Migration and Ethnic Relations Series. Ashgate Publisher, Aldershot,
United Kingdom.
Oka T., Ino Y., Nomura K., Kawashima S., Kuwayama T., Hanada H., Amano T., Takada
M., Takahata N., Hayashi Y. and Akishinonomiya F. 2007. Analysis of mtDNA
sequences shows Japanese native chickens have multiple origins. Animal Genetics 38:
287-293.
Pinent T., Simianer H. and Weigend S. 2005. Weitzman’s approach and conservation of
breed diversity: First application to German chicken breeds. Proceeding of the Role of
Biotechnology, Rome, Italy. http://www.fao.org/biotech/docs/pinent.pdf assessed on
05/01/2010.
Randi E., Alves P.C., Carranza J., Milosevic Z.S., Sfougaris A. and Mucci N. 2004.
Phylogeography of roe deer (Capreolus capreolus) populations: The effects of
historical genetic subdivisions and recent nonequilibrium dynamics. Molecular
Ecology 13: 3071.
Reist-Marti S.B., Simianer H., Gibson J., Hanotte O. and Rege J.E.O. 2003. Analysis of
the actual and expected future diversity of African cattle breeds using the Weitzman
approach. Conservation Biology 17: 1299-1311.
6th CHAPTER General discussion
118
Simianer H. 2005. Decision making in livestock conservation. Ecological Economics 53:
559-572.
Simianer H., Reist-Marti S.B., Gibson J., Hanotte O. and Rege J.E.O. 2003. An approach
to the optimal allocation of conservation funds to minimize loss of genetic diversity
between livestock breeds. Ecological Economics 45: 377-392.
Taylor K.W. 1983. The birth of Vietnam. Unverstity of California press, London, United
Kingdom.
Thaon d’Arnoldi C., Foulley J.L. and Ollivier L. 1998. An overview of the Weitzman
approach to diversity. Genetics Selection Evolution 30: 149-161.
Tieu H.V., Ly L.V., Sat L.V. and Su V.V. 2008. Vietnamese livestock genetic resources
conservation & exploitation from 1990 to 2007. Vietnamese Journal of Animal
Science and Technology special volume: 1-10.
Tixier-Boichard M., Bordas A. and Rognon X. 2009. Characterisation and monitoring of
poultry genetic resources. World's Poultry Science Journal 65: 272-285.
Twito T., Weigend S., Blum S., Granevitze Z., Feldman M.W., Perl-Treves R., Lavi U.
and Hillel J. 2007. Biodiversity of 20 chicken breeds assessed by SNPs located in
gene regions. Cytogenetic and Genome Research 117: 319-326.
Weitzman M.L. 1993. What to preserve? An application of diversity theory to crane
conservation. Quarterly Journal of Economics CVIII: 157-183.
Weitzman M.L. 1992. On diversity. Quarterly Journal of Economics CVII: 363-405.
Zander K.K., Drucker A.G., Holm-Müller K. and Simianer H. 2009. Choosing the
“cargo” for Noah’s Ark – ApplyingWeitzman’s approach to Borana cattle in East
Africa. Ecological Economics 68: 2051-2057.
Zerabruk M., Benewitz J., Kantanen J., Olsaker I. and Vangen O. 2007. Analysis of
genetic diversity and conservation priorities for six north Ethiopian cattle breeds.
Journal of Animal Breeding and Genetics 124: 236-241.