video tracking in the extreme: a new possibility for
TRANSCRIPT

Video tracking in the extreme: A new possibility for trackingnocturnal underwater transparent animals with fluorescentelastomer tags
Johann Delcourt & Marc Ylieff & Valérie Bolliet &Pascal Poncin & Agnès Bardonnet
Published online: 17 March 2011# Psychonomic Society, Inc. 2011
Abstract Initially developed so that an individual could berecognized in mark–recapture studies of aquatic animals,fluorescent visible implant elastomer (VIE) tags are usedhere for a new application in ethometry: the study of thebehavior of transparent animals in dim light or in darknessusing automatic tracking technology. The application andvalidation of this multitracking method is tested in thecontext of research on the estuarine migratory behavior ofthe glass eel (Anguilla anguilla), a crucial point to betterunderstand the dynamics of this endangered species. Themethod makes it possible to measure the activity (notablythe distance and speed) of four individuals as a function oftidal and nycthemeral rhythms in the same flume (a circularaquarium simulating river or estuarine conditions) across awide time scale (from seconds to weeks).
Keywords Multitracking . VIE tags . Fish .Anguillaanguilla glass eels .Migration . Swimming behavior .
Motion analysis
Interest in eels has been stimulated in recent decades bydeclines in recruitment in temperate species: the EuropeanAnguilla anguilla L., American A. rostrata Lesueur, andJapanese A. japonica Temminck & Schlegel (Aida,Tsukamoto, & Yamauchi, 2003; Aoyama, 2009; Tesch,2003). The European eel reproduces in the Sargasso Sea(Ginneken & Maes, 2005; McCleave et al., 1998; Schmidt,1922), and after hatching, leptocephalus larvae use oceancurrents (mainly the Gulf Stream) to migrate to the eastAtlantic coasts of the northern hemisphere. They metamor-phose into glass eels, probably as they reach the continentalshelf. Then glass eels enter estuaries to grow and eventuallycolonize the freshwater network. The activity during theestuarine migration depends mainly on the tidal cycle, evenif lunar and circadian rhythms and/or direct influence of lightand tidal coefficient may also interact (Bolliet & Labonne,2008; Bureau du Colombier, Bolliet, & Bardonnet, 2009).Different migratory tactics are suspected on the basis oflaboratory experiments: Some individuals subjected to waterreversal every 6.2 h swim only with the current, others onlyagainst the current, and some alternate swimming with andagainst the current at each water current reversal (Bolliet &Labonne, 2008; Bolliet, Lambert, Rives, & Bardonnet,2007). Other glass eels can also remain under shelters andpresent a low degree of activity. Their propensity to migrateand glass eels’ energy content appear to be related and mayresult in different migratory patterns, possibly leading toestuarine settlement (Bureau du Colombier et al., 2009;Bureau du Colombier, Bolliet, Lambert, & Bardonnet, 2007).
Unfortunately, little is known about glass eel swimmingbehavior. Recently, Wuenschel and Able (2008) obtainedinteresting results in Anguilla rostrata glass eels, based onthe critical swimming speed measurement (Ucrit).
1 Their
1 The critical swimming speed measurement (Ucrit) is the maximumwater current velocity at which a fish can maintain position.
J. Delcourt (*) :M. Ylieff : P. PoncinLaboratory of Fish and Amphibian Ethology, BehaviouralBiology Unit, Department of Environmental Sciences andManagement, University of Liège,22 Quai van Beneden,4020 Liège, Belgiume-mail: [email protected]
V. Bolliet :A. BardonnetINRA, UMR Ecobiop, INRA/UPPA,Pôle d’hydrobiologie de l’INRA,64310 St pée sur Nivelle, France
V. Bolliet :A. BardonnetUPPA, UMR Ecobiop, INRA/UPPA,UFR Sciences & Techniques Côte Basque,Allée du parc Montaury,64600 Anglet, France
Behav Res (2011) 43:590–600DOI 10.3758/s13428-011-0060-5

proposed Ucrit value (10–13 cm s−1) was much lower thanthe value proposed by McCleave (1980) for Anguillaanguilla (30 cm s−1). Nonetheless, for Ucrit estimation, thespeeds were not the spontaneous speeds naturally adopted byglass eel. Data based on captures from the wild (Beaulaton &Castelnaud, 2005) gave an estimated speed of 3–4 km day−1,which relates to the progression in the estuary according tocircatidal rhythmic activity, but not to swimming speed.Characterizing the migratory swimming behavior of glasseels would provide a better understanding of migration andof its relation to energy status.
Although video tracking to measure aquatic vertebrates’behaviors is frequently used in pharmacology, in toxicology,and in behavioral ontogeny, it remains quite rare in ecologicalstudies (i.e., Denoel et al., 2010; Peake, Matos, & McGregor,2006). Moreover, tracking a transparent animal with a watercurrent in the dark is a challenge. Patullo, Jolley-Rogers, andMacmillan (2007), who described how to track crayfish inthe night using infrared (IR) light, underlined the extremedifficulty of measuring the movement of an underwateranimal, notably the problem of reflection on the watersurface. Another limitation of available automatic video-tracking systems that work in the dark is that they are notadapted to follow several animals in the same arena.
Visible implant elastomer (VIE) tags (Northwest MarineTechnology Inc., Shaw Island, WA, USA) were developed totag aquatic animals, in the context of mark–recaptureprotocols in the laboratory and in the field (e.g., Astorgaet al., 2005; Brennan, Leber, & Blackburn, 2007; Jerry,Stewart, Purvis, & Piper, 2001; Linnane & Mercer, 1998;Purcell, Blockmans, & Nash, 2006). AVIE tag consists of anelastomer material with a large panel of color possibilities inthe visible spectrum; it is stable in time and is injected in atransparent body area to allow for external individualidentification. Tag visibility depends on pigments of the skinand the depth of the injection (personal observation; Imbert,Beaulaton, Rigaud, & Elie, 2007). Some VIE colors arefluorescent to ultraviolet (UV) light (Bonneau, Thurow, &Scarnecchia, 1995; Buckley, West, & Doty, 1994; Frederic,1997; Uglem, Noess, Farestveit, & Jorstad, 1996; Wood, &Martin-Smith, 2004), and such colors were used here.
According to several studies on a large spectrum offish, crustacean, reptilian, and amphibian species, VIEtags have no effect on mortality and growth (e.g.,Buchan, Sun, & Wagner, 2005; Catalano, Chipps,Bouchard, & Wahl, 2001; Claverie & Smith, 2007; Davis,Young-Williams, Hines, & Zmora, 2004; Imbert et al.,2007; Malone, Forrester, & Steele, 1999; Regester &Woosley, 2005). According to Imbert et al., VIE tags donot affect the displacement behavior of tagged glass eels.In addition, their patterns of swimming activity underwater current reversal were not affected by VIE tagging(Bolliet & Labonne, 2008).
Here we used fluorescent VIE tags to automatically detectanimals with a video-tracking system used in ethometry:EthoVision Color-Pro (Version 3.1; Noldus, Spink, &Tegelenbosch, 2001). Numerous commercial video-trackingsoftware systems (i.e., Noldus EthoVision; ANY-maze, MedAssociates Inc., St. Albans, VT; Viewpoint; Swistrack)are able to study animal behaviors in a reliable andconsistent way over time periods longer than are possiblewith manual recording methods. These systems can beused to obtain spatiotemporal data such as automaticrecording of animal activity, movement, and interaction.It is possible to study the spatial occupation in differentzones of the arenas and to obtain spatial measurementssuch as distance, speed, turning, and so forth. Withcolor-based video tracking, it is possible to simulta-neously track several individuals in the same arena.
Theoretically, this system can track 16 moving targetssimultaneously in the same arena, on the basis of colordetection (Noldus et al., 2001). Each tracked target isdetected among a range of the visible spectrum and on thebasis of color saturation (explained in detail in Noldus etal., 2001). However, tracking such a large number of colorsis impossible in a running water environment, mainlybecause brightness conditions have to be strictly homoge-neous throughout the arena. In still water, Ylieff andcolleagues succeeded in tracking only two damselfishes(Chromis chromis) or three sparid fishes Sarpa salpa(Jadot, Donnay, Ylieff, & Poncin, 2005; Ylieff & Poncin,2003; Ylieff, Sanchez-Colero, Poncin, Voss, & Ruwet,2000) with color tags, and three goldfishes (Carassiusauratus) by their natural skin colors (yellow, red, and white;Ylieff & Poncin, 2003). In comparison with these studies,we faced two additional difficulties: running instead of stillwater, and night sampling. Fluorescent VIE tagging wasused to meet this challenge.
Materials and methods
Glass eels and VIE tags
VIE is available in six fluorescent colors, labeled as red,orange, green, yellow, pink, and blue, that emit light underfluorescence that appears to the human observer as red,yellow, green, green, red, or blue, respectively. The red andpink colors are difficult to discriminate when fluoresced, asare green and yellow. Consequently, only four modalities offluorescent VIE tags were tested here. To be efficient, tagsshould be readable and should be retained for the durationof the study. When correctly applied, no tag loss wasobserved over a period of several months in laboratoryexperiments in glass eels (Bolliet & Labonne, 2008; Imbertet al., 2007).
Behav Res (2011) 43:590–600 591
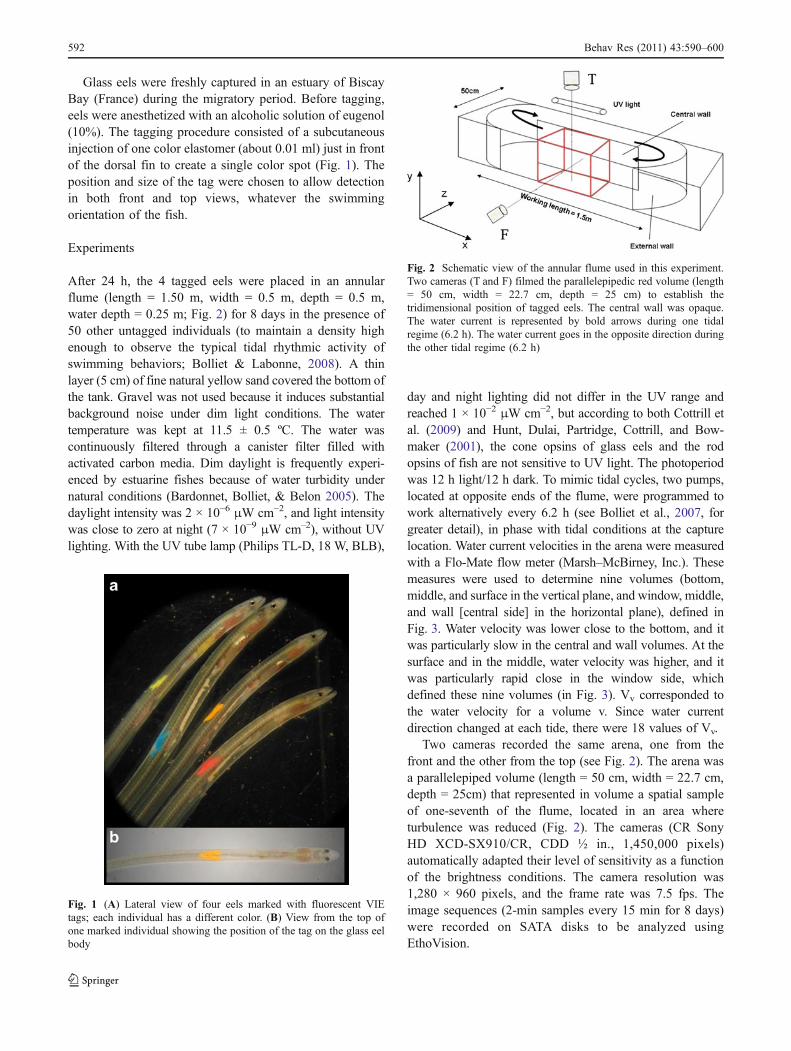
Glass eels were freshly captured in an estuary of BiscayBay (France) during the migratory period. Before tagging,eels were anesthetized with an alcoholic solution of eugenol(10%). The tagging procedure consisted of a subcutaneousinjection of one color elastomer (about 0.01 ml) just in frontof the dorsal fin to create a single color spot (Fig. 1). Theposition and size of the tag were chosen to allow detectionin both front and top views, whatever the swimmingorientation of the fish.
Experiments
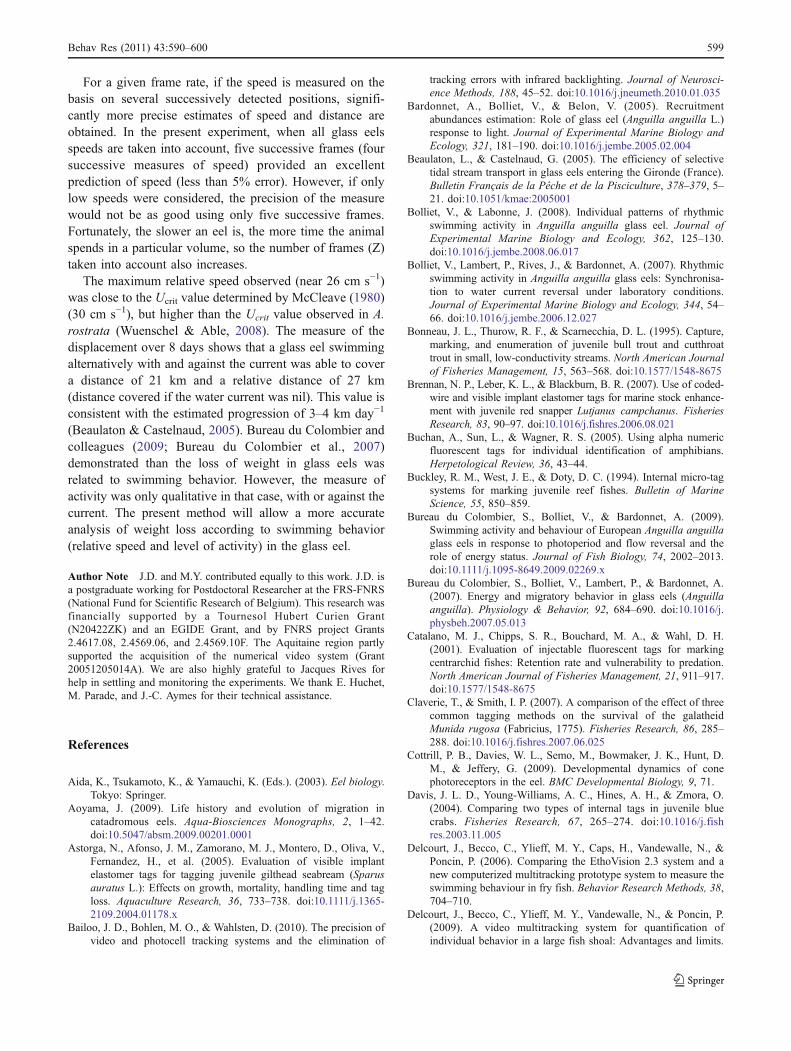
After 24 h, the 4 tagged eels were placed in an annularflume (length = 1.50 m, width = 0.5 m, depth = 0.5 m,water depth = 0.25 m; Fig. 2) for 8 days in the presence of50 other untagged individuals (to maintain a density highenough to observe the typical tidal rhythmic activity ofswimming behaviors; Bolliet & Labonne, 2008). A thinlayer (5 cm) of fine natural yellow sand covered the bottom ofthe tank. Gravel was not used because it induces substantialbackground noise under dim light conditions. The watertemperature was kept at 11.5 ± 0.5 ºC. The water wascontinuously filtered through a canister filter filled withactivated carbon media. Dim daylight is frequently experi-enced by estuarine fishes because of water turbidity undernatural conditions (Bardonnet, Bolliet, & Belon 2005). Thedaylight intensity was 2 × 10⁻⁶ μW cm−2, and light intensitywas close to zero at night (7 × 10⁻⁹ μW cm–2), without UVlighting. With the UV tube lamp (Philips TL-D, 18 W, BLB),
day and night lighting did not differ in the UV range andreached 1 × 10⁻² μW cm−2, but according to both Cottrill etal. (2009) and Hunt, Dulai, Partridge, Cottrill, and Bow-maker (2001), the cone opsins of glass eels and the rodopsins of fish are not sensitive to UV light. The photoperiodwas 12 h light/12 h dark. To mimic tidal cycles, two pumps,located at opposite ends of the flume, were programmed towork alternatively every 6.2 h (see Bolliet et al., 2007, forgreater detail), in phase with tidal conditions at the capturelocation. Water current velocities in the arena were measuredwith a Flo-Mate flow meter (Marsh–McBirney, Inc.). Thesemeasures were used to determine nine volumes (bottom,middle, and surface in the vertical plane, and window, middle,and wall [central side] in the horizontal plane), defined inFig. 3. Water velocity was lower close to the bottom, and itwas particularly slow in the central and wall volumes. At thesurface and in the middle, water velocity was higher, and itwas particularly rapid close in the window side, whichdefined these nine volumes (in Fig. 3). Vv corresponded tothe water velocity for a volume v. Since water currentdirection changed at each tide, there were 18 values of Vv.
Two cameras recorded the same arena, one from thefront and the other from the top (see Fig. 2). The arena wasa parallelepiped volume (length = 50 cm, width = 22.7 cm,depth = 25cm) that represented in volume a spatial sampleof one-seventh of the flume, located in an area whereturbulence was reduced (Fig. 2). The cameras (CR SonyHD XCD-SX910/CR, CDD ½ in., 1,450,000 pixels)automatically adapted their level of sensitivity as a functionof the brightness conditions. The camera resolution was1,280 × 960 pixels, and the frame rate was 7.5 fps. Theimage sequences (2-min samples every 15 min for 8 days)were recorded on SATA disks to be analyzed usingEthoVision.
Fig. 1 (A) Lateral view of four eels marked with fluorescent VIEtags; each individual has a different color. (B) View from the top ofone marked individual showing the position of the tag on the glass eelbody
Fig. 2 Schematic view of the annular flume used in this experiment.Two cameras (T and F) filmed the parallelepipedic red volume (length= 50 cm, width = 22.7 cm, depth = 25 cm) to establish thetridimensional position of tagged eels. The central wall was opaque.The water current is represented by bold arrows during one tidalregime (6.2 h). The water current goes in the opposite direction duringthe other tidal regime (6.2 h)
592 Behav Res (2011) 43:590–600

The EthoVision measurement of displacement was basedon the signal from the front camera, so the movementanalysis is in 2-D. The second camera was used to locatefish in a given volume of water current velocity, which wasnecessary to calculate the relative speed Sr, a parameterreflecting the eels’ energy expenditure. The x, y positioncorresponded to the gravity center (or mass center) wasdefined as in Noldus et al. (2001):
x ¼ 1A
PA
i¼ 1xi y ¼ 1
A
PA
i¼ 1yi
x and y = coordinates of the center of gravity; xi, yi =coordinates of pixels i of the tracked object; A = surfacearea of the tracked object (in pixels).
When the detected spot was partially outside thecamera’s visual field, the measured position was notcorrect, which induced an underestimation of an eel’sdisplacement (Fig. 4). Data on this area (external lateralzone width = 1 cm) were excluded from the analysis.
Swimming speed measurement accuracy
To evaluate the efficiency of the EthoVision estimation offish swimming speed, the movement of tagged eels wasdirectly measured on the computer screen with a ruler. Theposition of the eels was measured as the anterior point ofthe colored spot. Let S(Z=z) be the speed measured betweenz + 1 consecutive frames (see Fig. 5). Then z is the numberof elementary speeds (measured between two consecutiveframes, so during a period of 1/7.5 s) used to measure a
mean speed S(Z=z). For example, the speed S(Z–5) on fiveconsecutive frames is the mean of the five speeds calculatedbetween each six positions. Eight short sequences (two foreach color) were analyzed in order to obtain a samplesufficiently large to characterize the degree of comparativeprecision of the two methods.
Let Sm(Z=z) be the speed measured by the manualmethod, and let Scg(Z=z) be the speed measured byEthoVision. The estimated percentage of error was
% of error ¼ Scg Z¼zð Þ=Sm Z¼zð Þ� �
»100h i
� 100
Estimation of fish relative speed
In the present study, the S calculated by EthoVision wasconsidered to be the statistical unit, corresponding to the meanspeed of an individual during a passage in a given volume; Srcorresponded to the S value corrected by the water velocity inthis volume (Sr = S −Vv). Thus, for a given observed speed Sin a given volume of water, a fish swimming with the currentwould have a relative speed Sr < S, while a fish swimmingagainst the current would have an Sr > S.
The speed measurement did not take into account the thirddimension, but errors due to movements in the thirddimension were likely limited. Indeed, fish, and especially
arena External lateral zone
Out of visual field
False CG
real CG
Fig. 4 Representation of the external lateral zone (width = 1 cm) ofthe arena, where the colored spot can be partially out of the visualfield. The colored ellipses represent the apparent spot of the tag on thescreen. In this area, the positions calculated by the video-trackingsoftware are biased and the covered distance and speed under-estimated. For this reason, data from this area were excluded fromour analysis (CG = center of gravity)
t0
t1t4
t2
t5
D( Z = 5)
D( Z = 2)
D(Z =1)
S( Z =1) = D( Z = 1)/(t1- t0) S( Z = 2) = D( Z = 2)/(t2- t0) S( Z = 5) = D( Z = 5)/(t5-t0)
t3
Fig. 5 Measure of speed for different values of Z (Z = 1, 2, or 5). Thedashed line is the pathway of the tracked animal. The successivemeasured positions of the animal as a function of time (every 1/7.5 s) arerepresented by the black points. Z is the number of successive elementaryspeeds used to measure an average speed (Sm or Scg)
SmSw Sc
Bw
Mw Mm Mc
Bm Bc
Middle-water
Surface
Bottom
window side middle central side
5cm
5cm
13.6cm4.5cm 4.5cm
20cm
x z
y
Fig. 3 Definition of the nine volumes characterized by a specificwater current velocity for each tide. The tridimensional location of thefish head in a given volume allows for calculating its relative speed,Sr, based on its swimming speed and on the water velocity of theassociated volume
Behav Res (2011) 43:590–600 593

fish in migration, head for a water current with their motion(negative rheotaxis) or against their motion (positive rheo-taxis), which in the present experiment was in the X–Yplane.
Results
Detection of VIE tags
The four defined areas of detected colors (hue andsaturation parameters are given in Fig. 6), correspondingto the four fluorescent colors, were accurately discriminatedby the system. These areas presented no overlap, ensuringthat the targets would not be confused. The range ofsaturation of the detected tags was wide because the UVlighting was not homogeneous in the water environment.
The minimal size of detection was fixed at 15 pixels. Thesize of a detected spot varied between 20 and 300 pixels,depending on the distance and orientation of the live targets
from the camera and the UV. The size of a detected spot alsodepended on the glass eel speed. At high speed, the spot waslarger in the direction of movement (see the blue individual inFig. 7A), a consequence of the time needed for the camera tocapture one image. In this case, color intensity could slightlydecrease, but detection was not affected.
Some detection errors were found for the red individualat some locations of the arena, where several external pixelsof the red spot were detected as the orange target. However,the editing function in EthoVision (manual deleting ofinvalid data) allows for the correction of these few errors. Incontrast, when the orange individual was present at thesame time, the external pixels of the red spot were neverdetected as an orange target, because the tracking systemdetects only the larger detected spot (for a range of onegiven color).
Fig. 6 EthoVision window for object identification. Each shape onthe disk represents a volume in hue–saturation–intensity (HSI) colorspace. The horizontal distance from the center represents colorsaturation, the angle on the disk represents its hue (color), and thevertical distance on the left scale represents its intensity (for moreexplanation, see Noldus et al., 2001). The four shapes correspond tothe fluorescent color of the four tags in our experiment
Fig. 7 (A) Image from the front camera illustrating four glass eelsmarked with fluorescent VIE tags, each VIE tag fluoresced in a specificcolor. (B) The video-tracking system is able to detect and measuresimultaneously the position of each tagged individuals. The large photoshows a part of the arena. The colored spots represented the detectedpixels, and the line the previous trajectory during a period of severalseconds before. This image illustrates also that identification is nothampered by occlusion (after the trajectories of fish have crossed). Thedetail photo illustrates the case of the “blue individual”; the white crossrepresents the center of gravity of the detected spot (blue pixels) and theposition of the blue-tagged individual at this instant
594 Behav Res (2011) 43:590–600

Swimming speed measurement accuracy
The speed value could be different between the manualmeasurement (Sm), in which the positions are based onthe anterior point of the colored spot, and the automaticmethod (Scg), in which the positions are based onmeasurement of the center of gravity of the colored spotdetected. With the automatic method, the distancecovered was underestimated during acceleration andoverestimated during deceleration (Fig. 8). However, theunderestimating and overestimating were expected tocancel each other out when several successive measure-ments were made (i.e., when Z increased), as shown inFigs. 9 and 10. EthoVision also made random errors onshorter paths and/or at lower speed.
For each Z value, the linear relation between Sm and Scgwas highly significant (p < .0001). The degree of predictionof Sm by Scg is better when z increases. Figure 9 showsthat when Z ≥ 4, Scg provides a good prediction of Sm andthat prediction accuracy reaches a plateau. Since Z = 4represents a duration of 0.52 s (4 × 1/7.5), a mean speedautomatically measured over more than 0.5 s can beconsidered a very good estimation.
When Z = 1, the error between Sm and Scg is high,and the method is not relevant for this time duration (1/7.5 s), especially at a low speed (see Fig. 10). When
Z = 5, most error percentages are within 5% except at alow speed, likely because of the lower accuracy of themeasurement at lower speeds (a consequence of theshorter distances in pixels). If we consider data valuessmaller than 8 cm s−1, where the prediction accuracy isworse than in the higher-speed data, the prediction is stillgreater than 95% accurate when Z ≥ 10.
Application to our data
The time spent by fish in a given volume v largelyexceeded 0.5 s. In fact, in each volume, Z = 27.44 ±18.48 frames on average, so fish stayed 3.65 ± 2.64 s, onaverage, within a given volume (N = 339). Consequently,the automatic measurement of S can be considered highlyrelevant to estimated glass eel speed, even for the lowerspeed. Figure 11 shows an example of the results at a shorttime scale, where the distribution of frequency of speedwas measured for one individual. Figure 11A shows thatthe swimming speed S was positive when the glass eelswam with the current (WC) and was negative when itswam against the current (AC). In this case, the distribu-tion of occurrence was bimodal, due to the swimmingmode (AC vs. WC), but the eel swam faster in WC mode(13.0 ± 3.1 cm s−1) than in AC mode (6.4 ± 2.7 cm s−1).There was no clear preference for swimming AC or WC.There were fewer observations of S close to 0, in whichcase the eel would be maintaining a constant positionduring a short time. Figure 11B shows that the distribu-tion of occurrences of the relative speed Sr was alsobimodal. The values Sr > 0 indicate that the fish swam inWC mode and faster than the current (active swimming).When Sr = 0, the eel swam in WC mode at the same speedas the water velocity (passive swimming). This behavior
y= -1 * ((1/exp((.796183) * x + (.834216)))) + (.97696)r² = 0.9989
0 1 2 3 4 5 6 7 8
z
0.5
0.6
0.7
0.8
0.9
1.0
r²
Fig. 9 Values of r² based on the linear regression between Sm and Scgfor different values of Z. The vertical line represents 0.5 s on the x-axis
B
A
B
A
acceleration
deceleration
A > B
A < B
B
A
Constant speed
A = B
Fig. 8 Diagram illustrating the expected difference in a speedmeasurement between the manual and automatic methods. In themanual method, the position of the animal is the anterior point of thecolored spot. In the automatic method, the position of the animal is thecenter of gravity of the detected spot. A and B are the distancescovered by the eel during a short given time (1/7.5 s, for example),measured manually and automatically, respectively. When the speed isconstant, no difference between A and B is expected. Duringacceleration, the automatic method underestimates the distancecovered, and so speed. When this animal decelerates, the automaticmeasures overestimate the speed
Behav Res (2011) 43:590–600 595

probably saves energy, but glass eels rarely adopt arelative speed close to 0. In AC swimming, the relativespeed values were higher than in WC (mean Sr = 14.1 ±2.8 cm s−1; 4.8 ± 3.8 cm s−1 in WC), which indicates ahigher energy expenditure in AC. At the extreme, some Srvalues reached 26 cm s−1. The results can also be analyzedat a large time scale for calculation of the distance coveredby the same individual over 1 week (Fig. 12). In thisexample, the distance covered was close to 22 km for aperiod of 8 days, with a maximum of 5 km during onenight. The relative distance covered was close to 28.4 km,with a maximum of 7.3 km in one night.
Discussion
UV versus IR
Nocturnal observations of animal behavior have used IRlight extensively. For example, Zurn, Jang, and Motal(2005) tracked rats in darkness using near-IR light-emittingdiodes arranged in strips above the test arena. Dielenberg,Halasz, and Day (2006) tracked rats in a completely darkenvironment with IR cameras. Patullo et al. (2007) used IRlight to observe and detect a crayfish in the dark. However,IR light has a high degree of absorption in water, and
[0;4[ [4;6[ [6;8[ [8;10[ [10;12[ [12;14[ [14;]
Speed Sm (cm.s -1 )
-40
-30
-20
-10
0
10
20
30
40
% o
f err
or
Mean Mean+ 0.95 conf.interval Min-Max
Mean Mean+ 0.95 conf.interval Min-Max
[0;2[ [2;4[ [4;6[ [6;8[ [8;10[ [10;12[ [12;14[ [14;16[ [16;]
Speed Sm (cm. s-1)
-150
-100
-50
0
50
100
150
200
250
300
% o
f err
or
n = 3
n = 16
n = 77
n = 34
n = 7 n = 15 n = 3
n = 52
n = 92
n = 11
n = 32
n = 118
n = 61 n = 30 n = 13
n = 3
Z = 1
Z = 5
Fig. 10 Percentage of errorsmade on Sm, with Scg as afunction of Sm and z = 1 and 5.n is the number of observationsfor each speed class. For z = 5,no observation is made underSm = 2 cm s–1
596 Behav Res (2011) 43:590–600

working with deep water requires powerful IR lamps,which may induce water warming. Contrary to IR light, UVlight does not induce a significant change in temperatureand can penetrate several meters deep. Although IR lightproduces good contrast between the tracked object and thebackground (Bailoo, Bohlen, & Wahlsten, 2010), it givesonly black and white frames, which prevents individualidentification by color.
Multitracking
The detection of fluorescent VIE tags makes it possible totrack several individuals. Using VIE tags and EthoVision,
four individuals were tracked simultaneously, but thisnumber could probably be increased. On the hue–satura-tion–intensity (HSI) disk diagram (Fig. 6), the two freeareas allow for defining two other HSI volumes to tracktwo other living targets, in the cyan and pink regions.Under our experimental conditions, the pink VIE tags werered under fluorescence and not used. Therefore, if VIE tagswere able to fluoresce in cyan or in pink (different wavelengths), it would be possible to track two additionalindividuals. For a cyan fluorescent mark, no constraint isexpected. In contrast, for a pink fluorescent mark, trackingmay be compromised, because the pink nuances were largelypresent in the background of the image due to the UV lighting.
S (AC)S (WC)
-167
.32
-148
.00
-128
.67
-109
.34
-90.
02
-70.
69
-51.
36
-32.
04
-12.
71
6.62
25.9
4
45.2
7
64.6
0
83.9
2
103.
25
122.
57
141.
90
161.
23
180.
55
199.
88
219.
21
Swimming speed S (cm.s-1)
0
2
4
6
8
10
12
14
16
18
20
22
24
26
28
Fre
quen
cy o
f occ
uren
ce
S = 0
Sr (AC)Sr (WC)
-261
.21
-238
.69
-216
.17
-193
.65
-171
.13
-148
.61
-126
.09
-103
.56
-81.
04
-58.
52
-36.
00
-13.
48
9.04
31.5
6
54.0
8
76.6
0
99.1
2
121.
64
144.
16
166.
69
189.
21
Relative swimming speed Sr (cm.s-1)
0
5
10
15
20
25
30
35
Fre
quen
cy o
f occ
uren
ce
Sr = 0S = V
A
B
Fig. 11 Example of results forthe short-period analysis:Distribution of frequencies ofoccurrence for swimming speedS (panel A) and for relativeswimming speed Sr (panel B),corrected for water currentvelocity V, Sr = S – V, forone individual eel during anight. For S, negative valuescorrespond to swimming againstthe current (AC), and positivevalues to the swimming withthe current (WC). For S and Sr,N = 276 (n = 5,742), where N isthe number of S data points (ourstatistical unit) and n is the totalnumber of elementary speedsto measure the S values. Thestatistical unit corresponds tothe mean speed calculatedduring one passage in agiven analyzed volume
Behav Res (2011) 43:590–600 597

Experiments would be necessary to test whether pinkish noiserestricts proper detection of a pink target.
The application of other multitracking systems able totrack some individuals with the same color marks (e.g.,Feldman & Balch, 2003) or to distinguish individuallyanimals that are not tagged (e.g., Delcourt, Becco, Ylieff,Vandewalle, & Poncin, 2009; Egerstedt, Balch, Dellaert,Delmotte, & Khan, 2005; Kato et al., 2004) could allow fortracking a large number of individuals. However, thesesystems require continuous tracking of the animal, whichmust not be lost during the experiment. In this context, theocclusions (contact or superposition of the image of twoindividuals or more) can generate errors of identification bythe loss, inversion, or accumulation of identity (Delcourt etal., 2009). With color tracking, this does not happen. If anindividual is lost during a given time, it is identified when itappears again.
Targeted improvements of the color module ofEthoVision 3.1 would also be useful for increasing thepossible number of tracked fish. Indeed, if EthoVisionwere able to identify and track an individual on thebasis of the combination of several spots with differentcolors (spaced by a minimum length that would have tobe defined according to animal speed and video-recording conditions), this would increase the numberof possible targets. The commercial version of EthoVi-sion is not currently able to track a combination ofspots. However, Sustr, Spinka, Cloutier, and Newberry(2001), writing complementary algorithms, tracked twopigs, each individual of which was marked by twodifferent-colored marks. In this case, the two marks wereused to determine the body axis and to measure themutual angle of the bodies.
Another way to increase the number of targets wouldbe to take into account color intensity. The range of thisthird parameter is currently the same for any trackedspot, making it impossible to use this parameter
independently for each tracked object. Working with agiven intensity scale for a given hue would allow thesystem to track several objects with pseudocolors,notably during daylight, by taking advantage of whitenuances (e.g., white, bluish white, or pinkish white) orblack nuances (e.g., anthracite or dark blue), which is notpossible in the present HSI system.
For one color, the EthoVision Color-Pro systemconsiders only the largest spot detected (EthoVisionmanual; Noldus et al., 2001). Tracking several individualson the basis of spot size is only possible using grayscalingand subtraction detections2 (two other detection methodsused by the EthoVision system for noncolored movies;Delcourt et al., 2006; Noldus et al., 2001). However, anydetection that combines color and size characteristics isdifficult if the animal can move in three spatial dimen-sions, because the size of the spot in the image can varygreatly. In addition, movement speed modifies the size ofthe imaged spot.
Accuracy of speed measurement and biological results
By applying fluorescent VIE tags in an aquatic environmentand dim light, we have demonstrated that it is possible totrack four animals. However, the elongation and contractionof the apparent image of the color spot (the tracked target)when fish accelerate and decelerate may reduce theaccuracy of the measurement. Using a higher frame ratewould decrease this phenomenon. However, short exposuretime would also decrease the quantity of light (emitted bythe VIE) that is perceived by the camera.
2 In grayscaling detection, all pixels which have gray values betweentwo threshold values (a dark and a light threshold value) are identifiedas objects. In subtraction detection, a reference image that contains noobjects is compared with the live image containing the trackedanimals. All pixels that differ between the two images are identified asobjects.
0
1
2
3
4
5
6
7
8
N1 D1 N2 D2 N3 D3 N4 D4 N5 D5 N6 D6 N7 D7 N8 D8
timed
ista
nce
(km
)
covered distance
relative covered distance
Total covered distance = 21.652km Total relative covered distance = 28.372km
Fig. 12 Example results forlong-period analysis: Distancecovered by one individualduring a week (by daylight, D,and at night, N). The relativedistance corresponds to thedistance corrected for thevelocity of the water current.Estimations are based onn = 35,819 measures of speed
598 Behav Res (2011) 43:590–600
For a given frame rate, if the speed is measured on thebasis on several successively detected positions, signifi-cantly more precise estimates of speed and distance areobtained. In the present experiment, when all glass eelsspeeds are taken into account, five successive frames (foursuccessive measures of speed) provided an excellentprediction of speed (less than 5% error). However, if onlylow speeds were considered, the precision of the measurewould not be as good using only five successive frames.Fortunately, the slower an eel is, the more time the animalspends in a particular volume, so the number of frames (Z)taken into account also increases.
The maximum relative speed observed (near 26 cm s−1)was close to the Ucrit value determined by McCleave (1980)(30 cm s−1), but higher than the Ucrit value observed in A.rostrata (Wuenschel & Able, 2008). The measure of thedisplacement over 8 days shows that a glass eel swimmingalternatively with and against the current was able to covera distance of 21 km and a relative distance of 27 km(distance covered if the water current was nil). This value isconsistent with the estimated progression of 3–4 km day−1
(Beaulaton & Castelnaud, 2005). Bureau du Colombier andcolleagues (2009; Bureau du Colombier et al., 2007)demonstrated than the loss of weight in glass eels wasrelated to swimming behavior. However, the measure ofactivity was only qualitative in that case, with or against thecurrent. The present method will allow a more accurateanalysis of weight loss according to swimming behavior(relative speed and level of activity) in the glass eel.
Author Note J.D. and M.Y. contributed equally to this work. J.D. isa postgraduate working for Postdoctoral Researcher at the FRS-FNRS(National Fund for Scientific Research of Belgium). This research wasfinancially supported by a Tournesol Hubert Curien Grant(N20422ZK) and an EGIDE Grant, and by FNRS project Grants2.4617.08, 2.4569.06, and 2.4569.10F. The Aquitaine region partlysupported the acquisition of the numerical video system (Grant20051205014A). We are also highly grateful to Jacques Rives forhelp in settling and monitoring the experiments. We thank E. Huchet,M. Parade, and J.-C. Aymes for their technical assistance.
References
Aida, K., Tsukamoto, K., & Yamauchi, K. (Eds.). (2003). Eel biology.Tokyo: Springer.
Aoyama, J. (2009). Life history and evolution of migration incatadromous eels. Aqua-Biosciences Monographs, 2, 1–42.doi:10.5047/absm.2009.00201.0001
Astorga, N., Afonso, J. M., Zamorano, M. J., Montero, D., Oliva, V.,Fernandez, H., et al. (2005). Evaluation of visible implantelastomer tags for tagging juvenile gilthead seabream (Sparusauratus L.): Effects on growth, mortality, handling time and tagloss. Aquaculture Research, 36, 733–738. doi:10.1111/j.1365-2109.2004.01178.x
Bailoo, J. D., Bohlen, M. O., & Wahlsten, D. (2010). The precision ofvideo and photocell tracking systems and the elimination of
tracking errors with infrared backlighting. Journal of Neurosci-ence Methods, 188, 45–52. doi:10.1016/j.jneumeth.2010.01.035
Bardonnet, A., Bolliet, V., & Belon, V. (2005). Recruitmentabundances estimation: Role of glass eel (Anguilla anguilla L.)response to light. Journal of Experimental Marine Biology andEcology, 321, 181–190. doi:10.1016/j.jembe.2005.02.004
Beaulaton, L., & Castelnaud, G. (2005). The efficiency of selectivetidal stream transport in glass eels entering the Gironde (France).Bulletin Français de la Pêche et de la Pisciculture, 378–379, 5–21. doi:10.1051/kmae:2005001
Bolliet, V., & Labonne, J. (2008). Individual patterns of rhythmicswimming activity in Anguilla anguilla glass eel. Journal ofExperimental Marine Biology and Ecology, 362, 125–130.doi:10.1016/j.jembe.2008.06.017
Bolliet, V., Lambert, P., Rives, J., & Bardonnet, A. (2007). Rhythmicswimming activity in Anguilla anguilla glass eels: Synchronisa-tion to water current reversal under laboratory conditions.Journal of Experimental Marine Biology and Ecology, 344, 54–66. doi:10.1016/j.jembe.2006.12.027
Bonneau, J. L., Thurow, R. F., & Scarnecchia, D. L. (1995). Capture,marking, and enumeration of juvenile bull trout and cutthroattrout in small, low-conductivity streams. North American Journalof Fisheries Management, 15, 563–568. doi:10.1577/1548-8675
Brennan, N. P., Leber, K. L., & Blackburn, B. R. (2007). Use of coded-wire and visible implant elastomer tags for marine stock enhance-ment with juvenile red snapper Lutjanus campchanus. FisheriesResearch, 83, 90–97. doi:10.1016/j.fishres.2006.08.021
Buchan, A., Sun, L., & Wagner, R. S. (2005). Using alpha numericfluorescent tags for individual identification of amphibians.Herpetological Review, 36, 43–44.
Buckley, R. M., West, J. E., & Doty, D. C. (1994). Internal micro-tagsystems for marking juvenile reef fishes. Bulletin of MarineScience, 55, 850–859.
Bureau du Colombier, S., Bolliet, V., & Bardonnet, A. (2009).Swimming activity and behaviour of European Anguilla anguillaglass eels in response to photoperiod and flow reversal and therole of energy status. Journal of Fish Biology, 74, 2002–2013.doi:10.1111/j.1095-8649.2009.02269.x
Bureau du Colombier, S., Bolliet, V., Lambert, P., & Bardonnet, A.(2007). Energy and migratory behavior in glass eels (Anguillaanguilla). Physiology & Behavior, 92, 684–690. doi:10.1016/j.physbeh.2007.05.013
Catalano, M. J., Chipps, S. R., Bouchard, M. A., & Wahl, D. H.(2001). Evaluation of injectable fluorescent tags for markingcentrarchid fishes: Retention rate and vulnerability to predation.North American Journal of Fisheries Management, 21, 911–917.doi:10.1577/1548-8675
Claverie, T., & Smith, I. P. (2007). A comparison of the effect of threecommon tagging methods on the survival of the galatheidMunida rugosa (Fabricius, 1775). Fisheries Research, 86, 285–288. doi:10.1016/j.fishres.2007.06.025
Cottrill, P. B., Davies, W. L., Semo, M., Bowmaker, J. K., Hunt, D.M., & Jeffery, G. (2009). Developmental dynamics of conephotoreceptors in the eel. BMC Developmental Biology, 9, 71.
Davis, J. L. D., Young-Williams, A. C., Hines, A. H., & Zmora, O.(2004). Comparing two types of internal tags in juvenile bluecrabs. Fisheries Research, 67, 265–274. doi:10.1016/j.fishres.2003.11.005
Delcourt, J., Becco, C., Ylieff, M. Y., Caps, H., Vandewalle, N., &Poncin, P. (2006). Comparing the EthoVision 2.3 system and anew computerized multitracking prototype system to measure theswimming behaviour in fry fish. Behavior Research Methods, 38,704–710.
Delcourt, J., Becco, C., Ylieff, M. Y., Vandewalle, N., & Poncin, P.(2009). A video multitracking system for quantification ofindividual behavior in a large fish shoal: Advantages and limits.
Behav Res (2011) 43:590–600 599

Behavior Research Methods, 41, 228–235. doi:10.3758/BRM.41.1.228
Denoel, M., Bichot, M., Ficetola, G. C., Delcourt, J., Ylieff, M.,Kestemont, P., et al. (2010). Cumulative effects of road de-icingsalt on amphibian behaviour. Aquatic Toxicology, 99, 275–280.doi:10.1016/j.aquatox.2010.05.007
Dielenberg, R. A., Halasz, P., & Day, T. A. (2006). A method fortracking rats in a complex and completely dark environmentusing computerized video analysis. Journal of NeuroscienceMethods, 158, 279–286. doi:10.1016/j.jneumeth.2006.05.024
Egerstedt, M., Balch, T., Dellaert, F., Delmotte, F., & Khan, Z. (2005).What are the ants doing? Vision-based tracking and reconstructionof control programs. Paper presented at the in proceedings of the2005 IEEE Conference on Robotics and Automation, Barcelona,Spain.
Feldman, A., & Balch, T. (2003). Automatic identification of beemovement using human trainable models of behaviour. Mathematicsand Algorithms of Social Insects, December 2003, 14 p.
Frederic, J. L. (1997). Evaluation of fluorescent elastomer injection asa method for marking small fish. Bulletin of Marine Science, 61,399–408.
Ginneken, V. J. T., & Maes, G. E. (2005). The European eel (Anguillaanguilla, Linnaeus), its lifecycle, evolution and reproduction: Aliterature review. Reviews in Fish Biology and Fisheries, 15,367–398. doi:10.1007/s11160-006-0005-8
Hunt, D. M., Dulai, K. S., Partridge, J. C., Cottrill, P., & Bowmaker, J.K. (2001). The molecular basis for spectral tuning of rod visualpigments in deep-sea fish. Journal of Experimental Biology 204,3333–3344.
Imbert, H., Beaulaton, L., Rigaud, C., & Elie, P. (2007). Evaluation ofvisible implant elastomer as a method for tagging small Europeaneels. Journal of Fish Biology, 71, 1546–1554. doi:10.1111/j.1095-8649.2007.01617.x
Jadot, C., Donnay, A., Ylieff, M. Y., & Poncin, P. (2005). Impactimplantation of a transmitter on Sarpa salpa behaviour: Studywith a computerized video tracking system. Journal of FishBiology, 67, 589–595. doi:10.1111/j.0022-1112.2005.00761.x
Jerry, D. R., Stewart, T., Purvis, I. W., & Piper, L. R. (2001).Evaluation of visual implant elastomer and alphanumeric internaltags as method to identify juveniles of the freshwater crayfish,Cherax destructor. Aquaculture, 193, 149–154. doi:10.1016/S0044-8486(00)00477-4
Kato, S., Nakagawa, T., Ohkama, M., Muramoto, K., Oyama, O.,Watanabe, A., et al. (2004). A computer image processing systemfor quantification of zebrafish behaviour. Journal of Neurosci-ence Methods, 134, 1–7. doi:10.1016/j.jneumeth.2003.09.028
Linnane, A., & Mercer, J. P. (1998). A comparison of methods fortagging juvenile lobsters (Homarus gammarus L.) reared forstock enhancement. Aquaculture, 193, 149–154. doi:10.1016/S0044-8486(98)00247-6
Malone, J. C., Forrester, G. E., & Steele, M. A. (1999). Effects ofsubcutaneous microtags on the growth, survival, and vulnerabil-ity to predation of small reef fishes. Journal of ExperimentalMarine Biology and Ecology, 237, 243–253. doi:10.1016/S0022-0981(99)00003-9
McCleave, J. D. (1980). Swimming performance of European eel(Anguilla anguilla (L.)) elvers. Journal of Fish Biology, 16, 445–452. doi:10.1111/j.1095-8649.1980.tb03723.x
McCleave, J. D., Brickley, P. J., O’Brien, K. M., Kistner, D. A.,Wong, M. W., Gallagher, M., et al. (1998). Do leptocephali of theEuropean eel swim to reach continental waters? Status of thequestion. Journal of the Marine Biological Association (UnitedKingdom), 78, 285–306.
Noldus, L. P. J. J., Spink, A. J., & Tegelenbosch, R. A. J. (2001). Aversatile video tracking system for automation of behavioral experi-ments. Behavior Research Methods, Instruments, & Computers, 33,398–414.
Patullo, B. W., Jolley-Rogers, G., & Macmillan, D. L. (2007). Videotracking in the extreme: Video analysis for nocturnal underwateranimal movement. Behavior Research Methods, 39, 783–788.
Peake, T., Matos, R., & McGregor, P. (2006). Effects of manipulatedaggressive “interactions” on bystanding male fighting fish, Bettaspendens. Animal Behaviour, 72, 1013–1020. doi:10.1016/j.anbehav.2006.01.029
Purcell, S. W., Blockmans, B. F., & Nash, W. J. (2006). Efficacy ofchemical markers and physical tags for large-scale release of anexploitated holothurian. Journal of Experimental Marine Biologyand Ecology, 334, 283–293. doi:10.1016/j.jembe.2006.02.007
Regester, K. J., & Woosley, L. B. (2005). Marking salamander eggmasses with visible fluorescent elastomer: Retention time andeffect on embryonic development. American Midland Naturalist,153, 52–60. doi:10.1674/0003-0031
Schmidt, J. (1922). The breeding places and migration of the eel.Philosophical Transactions of the Royal Society B, 211, 179–211.
Sustr, P., Spinka, M., Cloutier, S., & Newberry, R. C. (2001).Computer-aided method for calculating animal configurationsduring social interactions from two-dimensional coordinates ofcolor-marked body parts. Behavior Research Methods, Instruments,& Computers, 33, 364–370.
Tesch, F.-W. (2003). The eel (3rd ed.). Oxford: Blackwell Science Ltd.Uglem, I., Noess, H., Farestveit, E., & Jorstad, K. E. (1996). Tagging
of juvenile lobsters (Homarus gammarus (L.)) with visible implantfluorescent elastomer (VIE) tags. Aquaculture Engineering, 15,499–501. doi:10.1016/S0144-8609(96)01005-9
Woods, C. M. C. & Martin-Smith, K. M. (2004). Visible implantfluorescent elastomer tagging of the big-bellied seahorse,Hippocampus abdominalis. Fisheries research 66, 363–371
Wuenschel, M. J., & Able, K. E. (2008). Swimming ability of eels(Anguilla rostrata, Conger oceanicus) at estuarine ingress:Contrasting patterns of cross-shelf transport? Marine Biology,154, 775–786. doi:10.1007/s00227-008-0970-7
Ylieff, M. Y., & Poncin, P. (2003). Quantifying spontaneousswimming activity in fish with a computerized color videotracking system, a laboratory device using last imaging techni-ques. Fish Physiology and Biochemistry, 28, 281–282.
Ylieff, M. Y., Sanchez-Colero, C., Poncin, P., Voss, J., & Ruwet, J.-C.(2000). Measuring effects of different temperatures on swimmingactivity and social behavior in groups of Mediterranean marine fishwith the EthoVision Color-Pro video tracking system. In proceed-ings of measuring behavior 2000, 3rd international conference onthe methods and techniques in behavioral research (pp. 350–351).Wageningen, The Netherlands: Noldus Information Technology.
Zurn, J. B., Jang, X., & Motal, Y. (2005). Video-based rodent activitymeasurement using near-infrared illumination. In Proceedings of theIEEE Instrumentation and Measurement Technology Conference(Vol. 3, pp. 1928–1931). Los Alamitos: IEEE.
600 Behav Res (2011) 43:590–600