video and television piracy: ecosystem and impact … and television piracy: ecosystem and ... video...
TRANSCRIPT
WHITEPAPER
Video and Television Piracy: Ecosystem and ImpactAn Industry Whitepaper
Executive SummaryDue to the rise in popularity and prevalence of video and television piracy, a significant percentage of Internet users are accessing content in a manner that violates content licensing agreements.
The risk to communications service providers (CSPs) is enormous: continued adoption of unlicensed video and TV streaming services could lead to increased cord-cutting and create ‘cord-nevers’, significantly impacting top-line revenue and overall profitability and—by extension—undermining the very business models that keep CSPs operating.
The modern reality is that CSPs are spending large sums to license, produce, and/or distribute exclusive content, but it’s easier than ever before for subscribers to get this content at lower cost than licensed alternatives.
A rich piracy ecosystem containing several different participants and revenue streams has emerged to deliver video on demand, catch-up, and live video use cases. In North America alone, we estimate that this ecosystem generates revenues of almost one billion dollars ($1 billion USD).
For CSPs to make informed decisions about business strategy, it’s important to investigate and to quantify video and television piracy.
Aided by an accurate understanding, CSPs can monitor the threat, support law enforcement and regulatory efforts aimed at preventing the proliferation of these services, incorporate insight into churn prediction models, and help to educate other stakeholders.
This whitepaper shines a light on the shadow market of the video and television piracy ecosystem and explains how CSPs can begin to quantify the impact on their own networks and, ultimately, to their business.
ContentsExecutive Summary .............................................................. 1
Introduction to Video and Television Piracy ................ 2
Evolution of Video and Television Piracy .................... 2
Today’s Piracy Economy .................................................... 3
Measuring Video and Television Piracy ......................... 7
Users ........................................................................................ 7
Usage ....................................................................................... 8
Devices and Software ........................................................ 9
Services and Hosts .............................................................. 9
Channels ...............................................................................10
Conclusions ...........................................................................12
Additional Resources .......................................................12
2
Video and Television Piracy: Ecosystem and Impact An Industry Whitepaper
Introduction to Video and Television PiracyBy producing or licensing TV, film, sports, and other premium content, communications service providers (CSPs) aim to create exclusive libraries that increase the appeal of bundled offers (e.g., triple and quad play services), stand out from the competition, and provide exclusive value to their subscribers, all of which contribute to top-line revenue. For some CSPs, the video strategy is to deliver TV and video-on-demand (VOD) services exclusively via an app.
However, due to the rise in popularity and prevalence of video and TV piracy, a significant percentage—up to 8% in some North American markets we examined—of Internet users are accessing content in a manner that violates content licensing agreements. Left unchecked, we expect this trend to grow due to the ease and relative low cost of accessing unlicensed content and due to the facilities available on the Internet for pirates to leverage.
The risk to CSPs is enormous: continued adoption of unlicensed video and TV streaming services could lead to increased cord-cutting and create ‘cord-nevers’, significantly impacting top-line revenue and overall profitability and—by extension—undermining the very business models that keep CSPs operating.
Evolution of Video and Television PiracyToday’s pirate streaming services are only the latest in a long line of television- and video-related fraud, as there have always been people who want to acquire content for less than the market price.
Decades ago, Cable piracy was a major threat: either a consumer would buy a basic package and slip the technician some cash for full access, or a consumer would splice from another cable connection.1 The adoption of digital cable, which includes authentication, has made this type of piracy/fraud more difficult.
As satellite television became more popular, card programmers made it possible to decode signals that hadn’t been paid for; in response, satellite providers would frequently ‘flash’ the cards to disable them. During major events, like a FIFA World Cup, it wasn’t uncommon to see line-ups out the door of the local ‘satellite card guy’.
For a number of years, roughly between 2006 and 2010, peer-to-peer (P2P) filesharing applications took up the cause of content piracy, first with music, but then with television programs and movies. Applications like Napster, Kazaa, BitTorrent (and its clients), Gnutella, and eDonkey took advantage of the increase in broadband speeds and explosion in broadband availability to make it relatively straightforward to exchange very large files over the Internet.
In this environment, live television was considered an important differentiator of licensed television plans: for viewers who absolutely had to see something live (e.g., a major news event, professional sports, etc.), P2P filesharing wasn’t a substitute. However, around the same time, the prevalence of live television fraud increased as new, user-friendly (i.e., non-technical) applications emerged.
To acquire live television streams, Internet users started using a set of applications that leveraged the efficiencies of the P2P distribution model, but specialized in streaming. These ‘peercasting’ applications, including PPStream and PPLive, gained widespread adoption and came to account for a significant amount of global Internet traffic2.
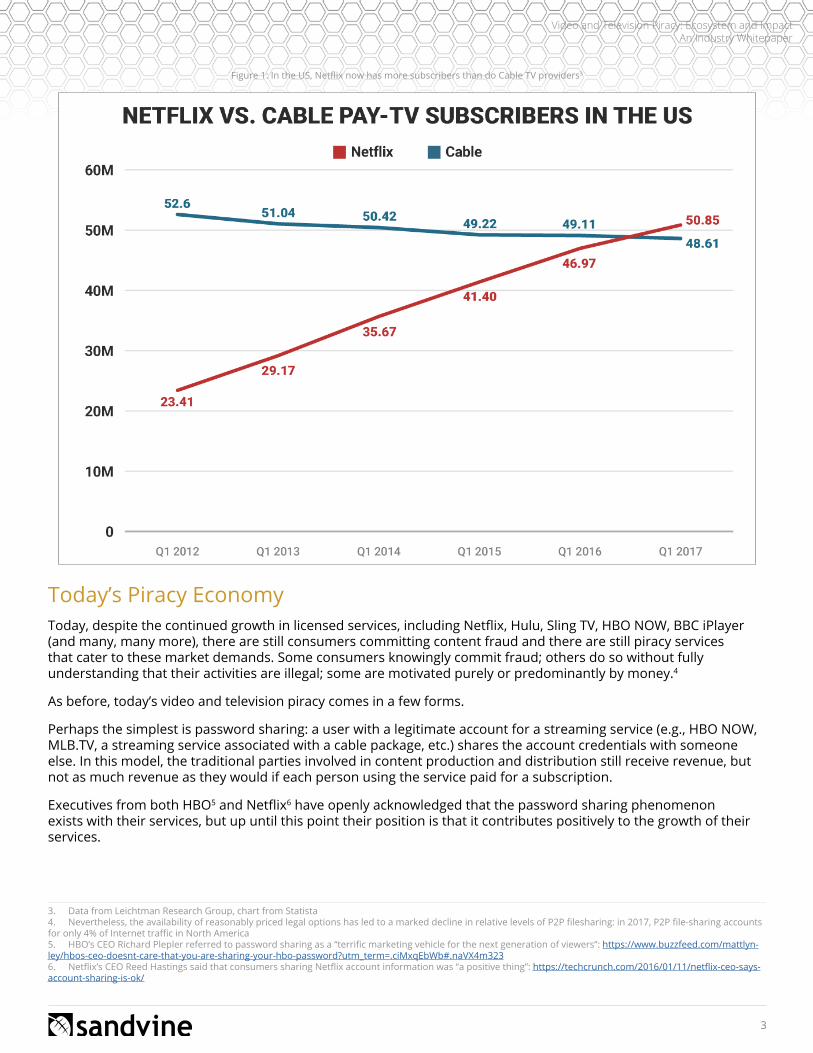
Around 2010, the ability of broadband Internet to deliver high-quality video streams was established; just a short time later, Netflix dominated North America’s broadband networks, and started to compete with traditional television services for consumer eyeballs (Figure 1).
1. Here’s a wonderful example of a counter-piracy effort from 1993: http://articles.courant.com/1993-02-02/news/0000105766_1_decoder-boxes-illegal-decod-er-t-shirt2. In Sandvine’s 1H 2013 Global Internet Phenomena Report, peercasting accounted for over 10% of fixed network traffic in the Asia-Pacific region
3
Video and Television Piracy: Ecosystem and Impact An Industry Whitepaper
Figure 1: In the US, Netflix now has more subscribers than do Cable TV providers3
Today’s Piracy EconomyToday, despite the continued growth in licensed services, including Netflix, Hulu, Sling TV, HBO NOW, BBC iPlayer (and many, many more), there are still consumers committing content fraud and there are still piracy services that cater to these market demands. Some consumers knowingly commit fraud; others do so without fully understanding that their activities are illegal; some are motivated purely or predominantly by money.4
As before, today’s video and television piracy comes in a few forms.
Perhaps the simplest is password sharing: a user with a legitimate account for a streaming service (e.g., HBO NOW, MLB.TV, a streaming service associated with a cable package, etc.) shares the account credentials with someone else. In this model, the traditional parties involved in content production and distribution still receive revenue, but not as much revenue as they would if each person using the service paid for a subscription.
Executives from both HBO5 and Netflix6 have openly acknowledged that the password sharing phenomenon exists with their services, but up until this point their position is that it contributes positively to the growth of their services.
3. Data from Leichtman Research Group, chart from Statista4. Nevertheless, the availability of reasonably priced legal options has led to a marked decline in relative levels of P2P filesharing: in 2017, P2P file-sharing accounts for only 4% of Internet traffic in North America5. HBO’s CEO Richard Plepler referred to password sharing as a “terrific marketing vehicle for the next generation of viewers”: https://www.buzzfeed.com/mattlyn-ley/hbos-ceo-doesnt-care-that-you-are-sharing-your-hbo-password?utm_term=.ciMxqEbWb#.naVX4m3236. Netflix’s CEO Reed Hastings said that consumers sharing Netflix account information was “a positive thing”: https://techcrunch.com/2016/01/11/netflix-ceo-says-account-sharing-is-ok/
4
Video and Television Piracy: Ecosystem and Impact An Industry Whitepaper
Video and Television Piracy Use CasesThe larger threat to legitimate (i.e., not fraudulent) business models comes from a comprehensive piracy economy that addresses/enables three consumer ‘use cases’:
Video on Demand Catch-Up Live VideoAn extensive content library of select television shows and movies available for playback at any time.
Example: all past episodes of Game of Thrones
A sliding window of on-demand content, acting like a DVR in the cloud.
Example: all programs that aired on a channel in the last seven days are available on-demand
Video streams that are available as something is aired/broadcast/transmitted.
Example: Sunday night’s new episode of Game of Thrones; professional sports
The modern reality is that CSPs are spending large sums to license, produce, and/or distribute exclusive content, but it’s easier than ever before for subscribers to get this content at lower cost than licensed alternatives.
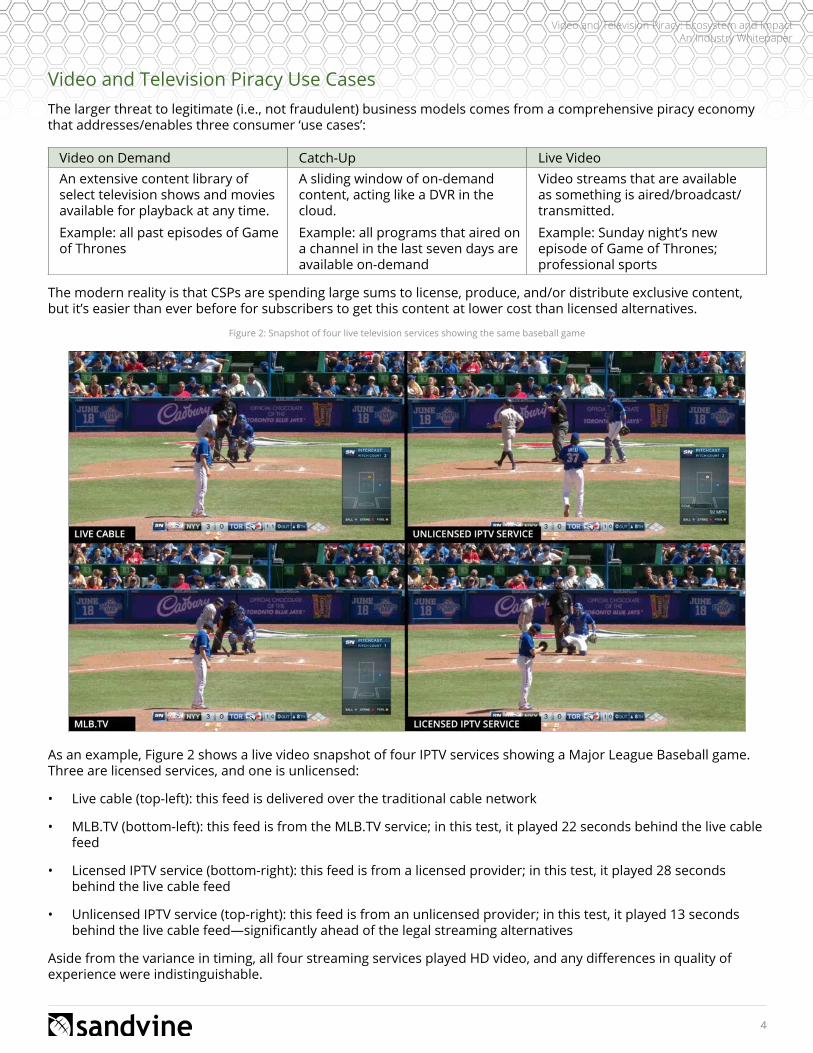
Figure 2: Snapshot of four live television services showing the same baseball game
As an example, Figure 2 shows a live video snapshot of four IPTV services showing a Major League Baseball game. Three are licensed services, and one is unlicensed:
• Live cable (top-left): this feed is delivered over the traditional cable network
• MLB.TV (bottom-left): this feed is from the MLB.TV service; in this test, it played 22 seconds behind the live cable feed
• Licensed IPTV service (bottom-right): this feed is from a licensed provider; in this test, it played 28 seconds behind the live cable feed
• Unlicensed IPTV service (top-right): this feed is from an unlicensed provider; in this test, it played 13 seconds behind the live cable feed—significantly ahead of the legal streaming alternatives
Aside from the variance in timing, all four streaming services played HD video, and any differences in quality of experience were indistinguishable.
5
Video and Television Piracy: Ecosystem and Impact An Industry Whitepaper
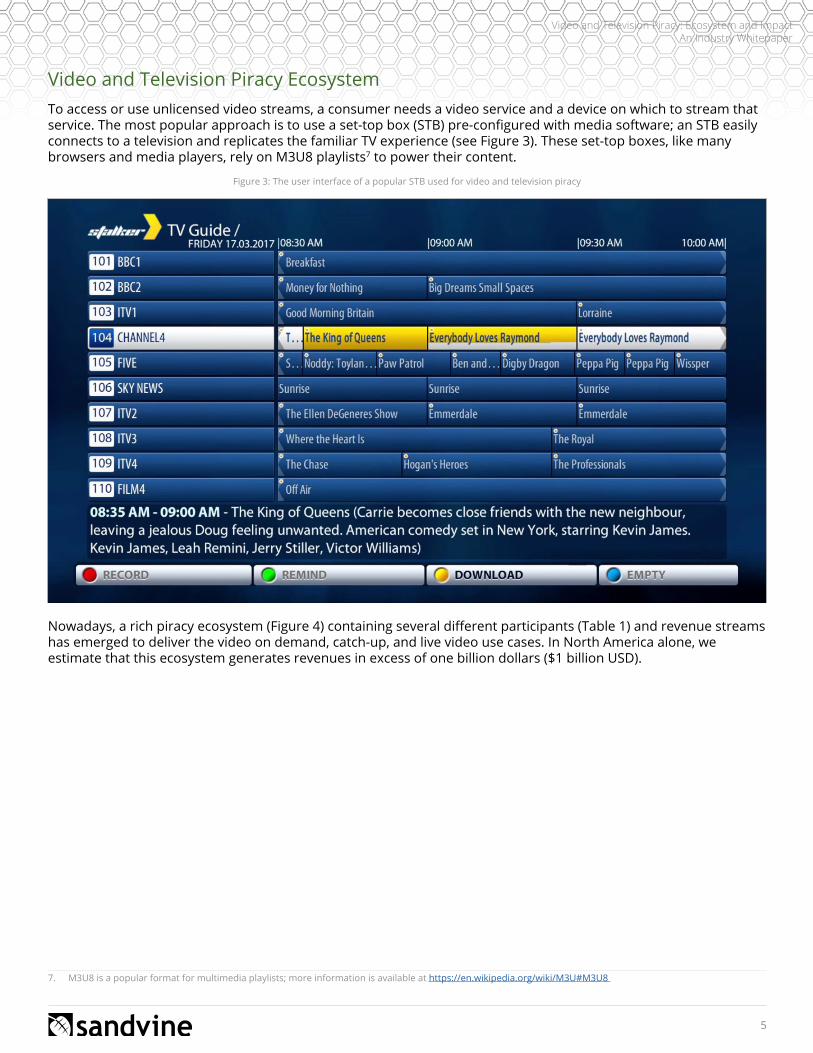
Video and Television Piracy EcosystemTo access or use unlicensed video streams, a consumer needs a video service and a device on which to stream that service. The most popular approach is to use a set-top box (STB) pre-configured with media software; an STB easily connects to a television and replicates the familiar TV experience (see Figure 3). These set-top boxes, like many browsers and media players, rely on M3U8 playlists7 to power their content.
Figure 3: The user interface of a popular STB used for video and television piracy
Nowadays, a rich piracy ecosystem (Figure 4) containing several different participants (Table 1) and revenue streams has emerged to deliver the video on demand, catch-up, and live video use cases. In North America alone, we estimate that this ecosystem generates revenues in excess of one billion dollars ($1 billion USD).
7. M3U8 is a popular format for multimedia playlists; more information is available at https://en.wikipedia.org/wiki/M3U#M3U8
6
Video and Television Piracy: Ecosystem and Impact An Industry Whitepaper
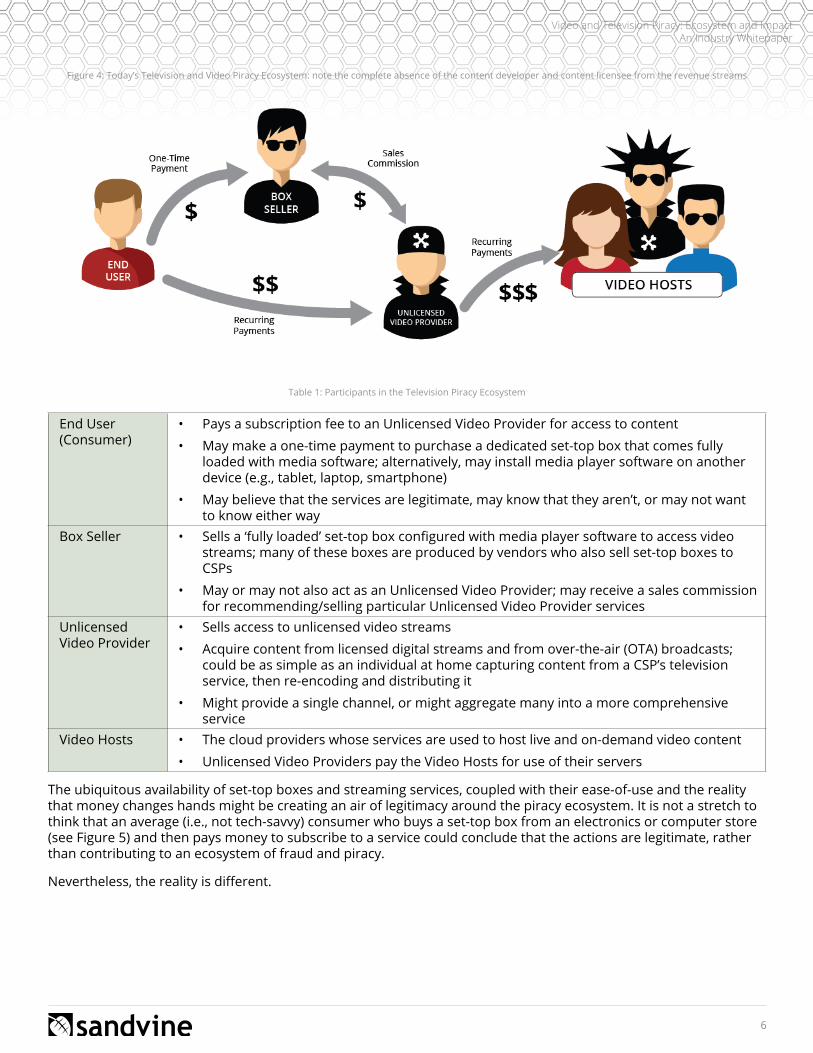
Figure 4: Today’s Television and Video Piracy Ecosystem: note the complete absence of the content developer and content licensee from the revenue streams
Table 1: Participants in the Television Piracy Ecosystem
End User (Consumer)
• Pays a subscription fee to an Unlicensed Video Provider for access to content
• May make a one-time payment to purchase a dedicated set-top box that comes fully loaded with media software; alternatively, may install media player software on another device (e.g., tablet, laptop, smartphone)
• May believe that the services are legitimate, may know that they aren’t, or may not want to know either way
Box Seller • Sells a ‘fully loaded’ set-top box configured with media player software to access video streams; many of these boxes are produced by vendors who also sell set-top boxes to CSPs
• May or may not also act as an Unlicensed Video Provider; may receive a sales commission for recommending/selling particular Unlicensed Video Provider services
Unlicensed Video Provider
• Sells access to unlicensed video streams
• Acquire content from licensed digital streams and from over-the-air (OTA) broadcasts; could be as simple as an individual at home capturing content from a CSP’s television service, then re-encoding and distributing it
• Might provide a single channel, or might aggregate many into a more comprehensive service
Video Hosts • The cloud providers whose services are used to host live and on-demand video content
• Unlicensed Video Providers pay the Video Hosts for use of their servers
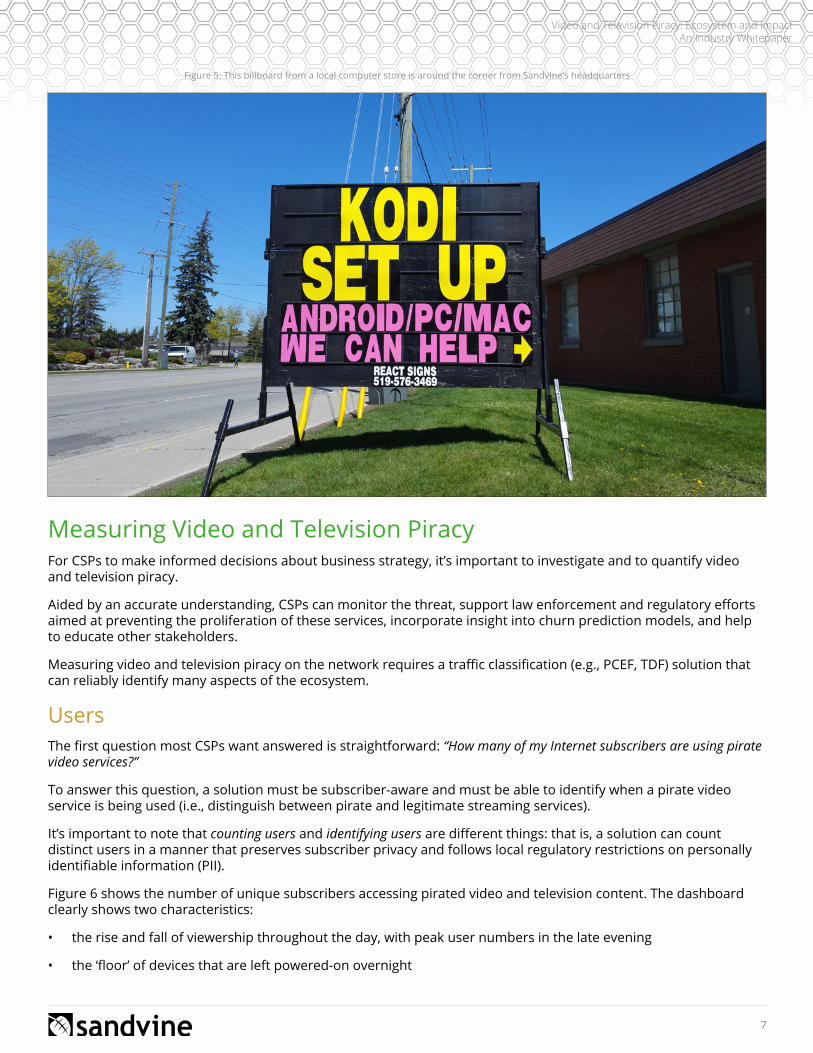
The ubiquitous availability of set-top boxes and streaming services, coupled with their ease-of-use and the reality that money changes hands might be creating an air of legitimacy around the piracy ecosystem. It is not a stretch to think that an average (i.e., not tech-savvy) consumer who buys a set-top box from an electronics or computer store (see Figure 5) and then pays money to subscribe to a service could conclude that the actions are legitimate, rather than contributing to an ecosystem of fraud and piracy.
Nevertheless, the reality is different.
7
Video and Television Piracy: Ecosystem and Impact An Industry Whitepaper
Figure 5: This billboard from a local computer store is around the corner from Sandvine’s headquarters
Measuring Video and Television PiracyFor CSPs to make informed decisions about business strategy, it’s important to investigate and to quantify video and television piracy.
Aided by an accurate understanding, CSPs can monitor the threat, support law enforcement and regulatory efforts aimed at preventing the proliferation of these services, incorporate insight into churn prediction models, and help to educate other stakeholders.
Measuring video and television piracy on the network requires a traffic classification (e.g., PCEF, TDF) solution that can reliably identify many aspects of the ecosystem.
UsersThe first question most CSPs want answered is straightforward: “How many of my Internet subscribers are using pirate video services?”
To answer this question, a solution must be subscriber-aware and must be able to identify when a pirate video service is being used (i.e., distinguish between pirate and legitimate streaming services).
It’s important to note that counting users and identifying users are different things: that is, a solution can count distinct users in a manner that preserves subscriber privacy and follows local regulatory restrictions on personally identifiable information (PII).
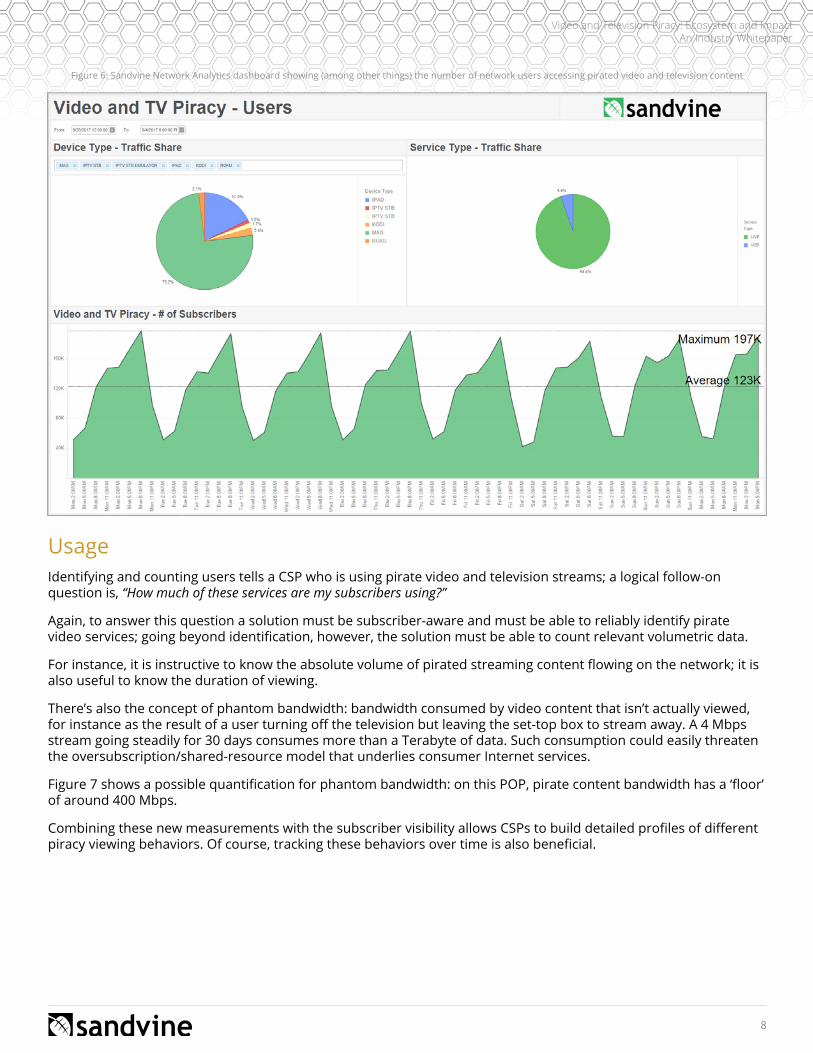
Figure 6 shows the number of unique subscribers accessing pirated video and television content. The dashboard clearly shows two characteristics:
• the rise and fall of viewership throughout the day, with peak user numbers in the late evening
• the ‘floor’ of devices that are left powered-on overnight
8
Video and Television Piracy: Ecosystem and Impact An Industry Whitepaper
Figure 6: Sandvine Network Analytics dashboard showing (among other things) the number of network users accessing pirated video and television content
UsageIdentifying and counting users tells a CSP who is using pirate video and television streams; a logical follow-on question is, “How much of these services are my subscribers using?”
Again, to answer this question a solution must be subscriber-aware and must be able to reliably identify pirate video services; going beyond identification, however, the solution must be able to count relevant volumetric data.
For instance, it is instructive to know the absolute volume of pirated streaming content flowing on the network; it is also useful to know the duration of viewing.
There’s also the concept of phantom bandwidth: bandwidth consumed by video content that isn’t actually viewed, for instance as the result of a user turning off the television but leaving the set-top box to stream away. A 4 Mbps stream going steadily for 30 days consumes more than a Terabyte of data. Such consumption could easily threaten the oversubscription/shared-resource model that underlies consumer Internet services.
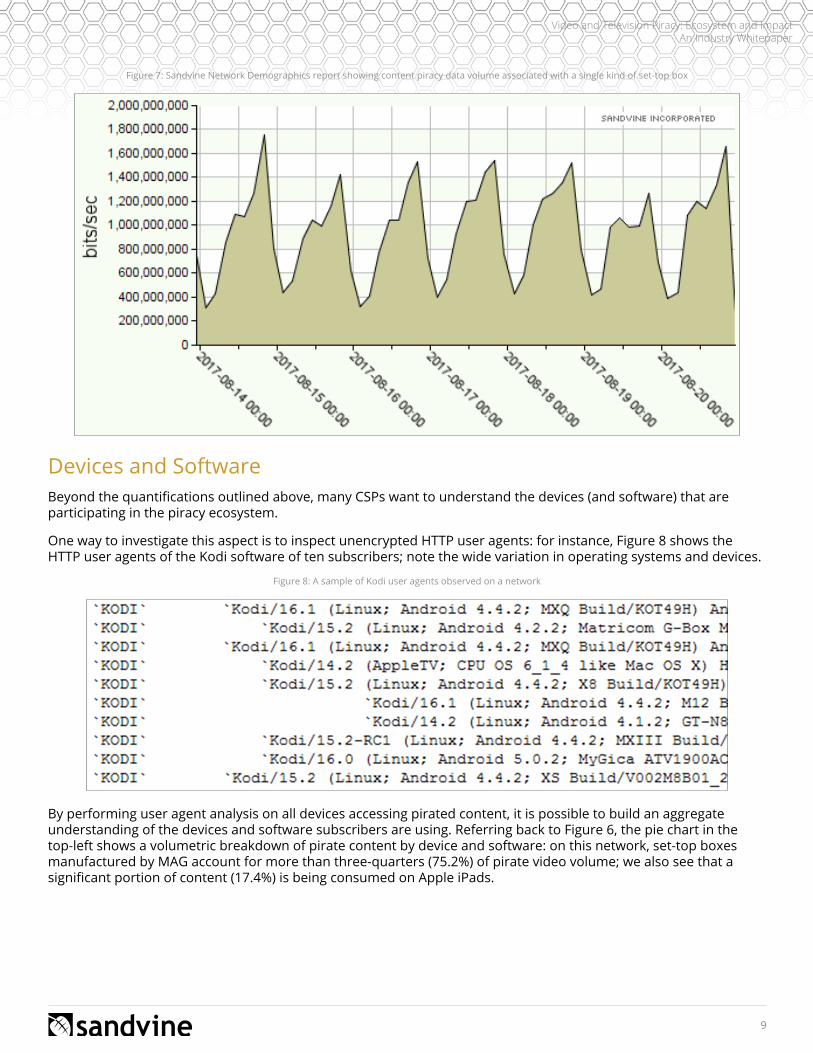
Figure 7 shows a possible quantification for phantom bandwidth: on this POP, pirate content bandwidth has a ‘floor’ of around 400 Mbps.
Combining these new measurements with the subscriber visibility allows CSPs to build detailed profiles of different piracy viewing behaviors. Of course, tracking these behaviors over time is also beneficial.
9
Video and Television Piracy: Ecosystem and Impact An Industry Whitepaper
Figure 7: Sandvine Network Demographics report showing content piracy data volume associated with a single kind of set-top box
Devices and SoftwareBeyond the quantifications outlined above, many CSPs want to understand the devices (and software) that are participating in the piracy ecosystem.
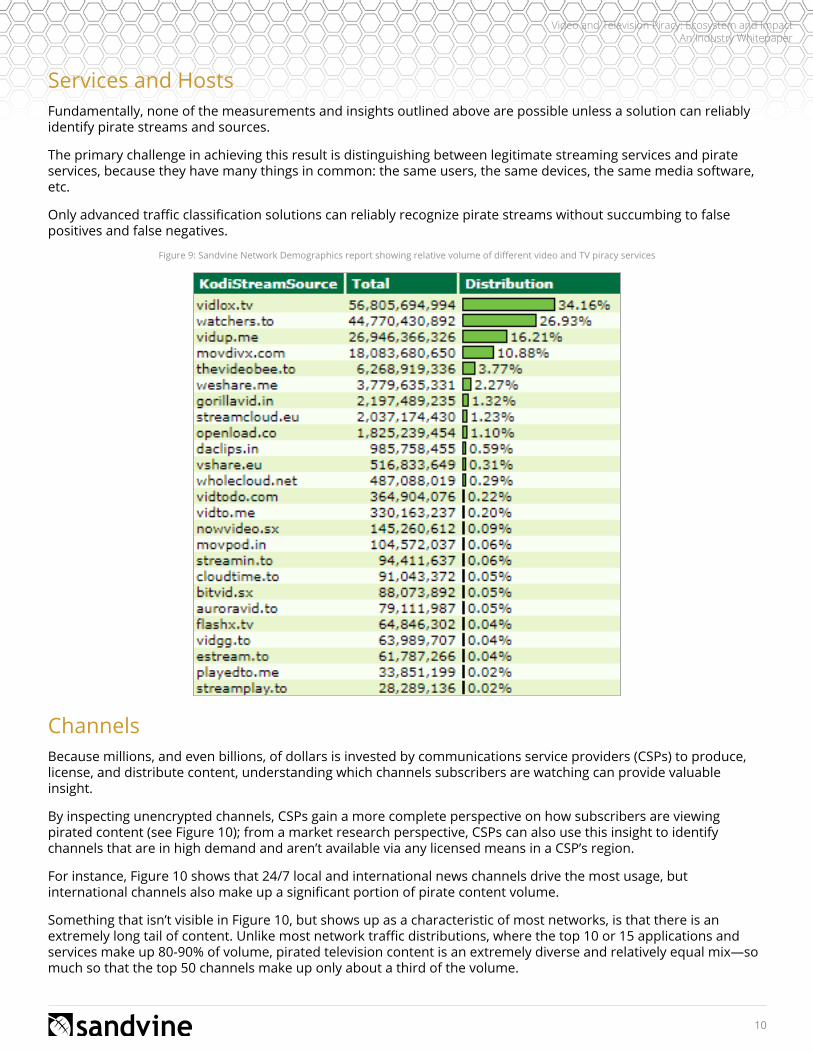
One way to investigate this aspect is to inspect unencrypted HTTP user agents: for instance, Figure 8 shows the HTTP user agents of the Kodi software of ten subscribers; note the wide variation in operating systems and devices.
Figure 8: A sample of Kodi user agents observed on a network
By performing user agent analysis on all devices accessing pirated content, it is possible to build an aggregate understanding of the devices and software subscribers are using. Referring back to Figure 6, the pie chart in the top-left shows a volumetric breakdown of pirate content by device and software: on this network, set-top boxes manufactured by MAG account for more than three-quarters (75.2%) of pirate video volume; we also see that a significant portion of content (17.4%) is being consumed on Apple iPads.
10
Video and Television Piracy: Ecosystem and Impact An Industry Whitepaper
Services and HostsFundamentally, none of the measurements and insights outlined above are possible unless a solution can reliably identify pirate streams and sources.
The primary challenge in achieving this result is distinguishing between legitimate streaming services and pirate services, because they have many things in common: the same users, the same devices, the same media software, etc.
Only advanced traffic classification solutions can reliably recognize pirate streams without succumbing to false positives and false negatives.
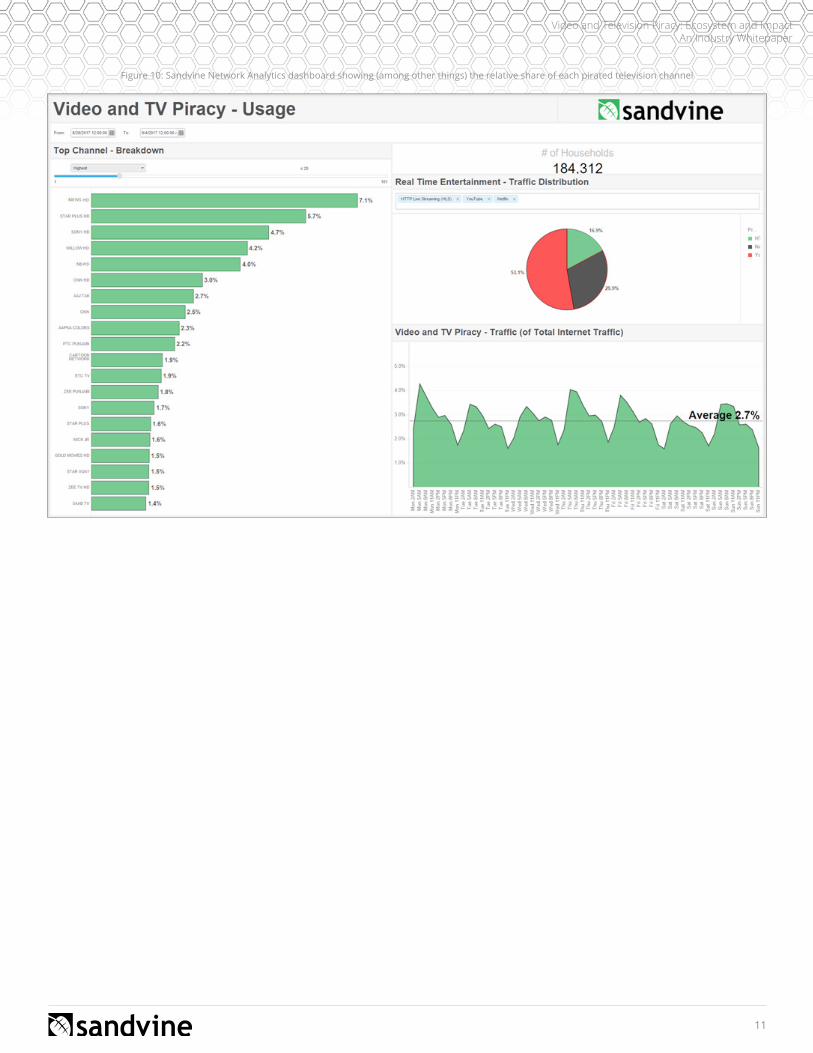
Figure 9: Sandvine Network Demographics report showing relative volume of different video and TV piracy services
ChannelsBecause millions, and even billions, of dollars is invested by communications service providers (CSPs) to produce, license, and distribute content, understanding which channels subscribers are watching can provide valuable insight.
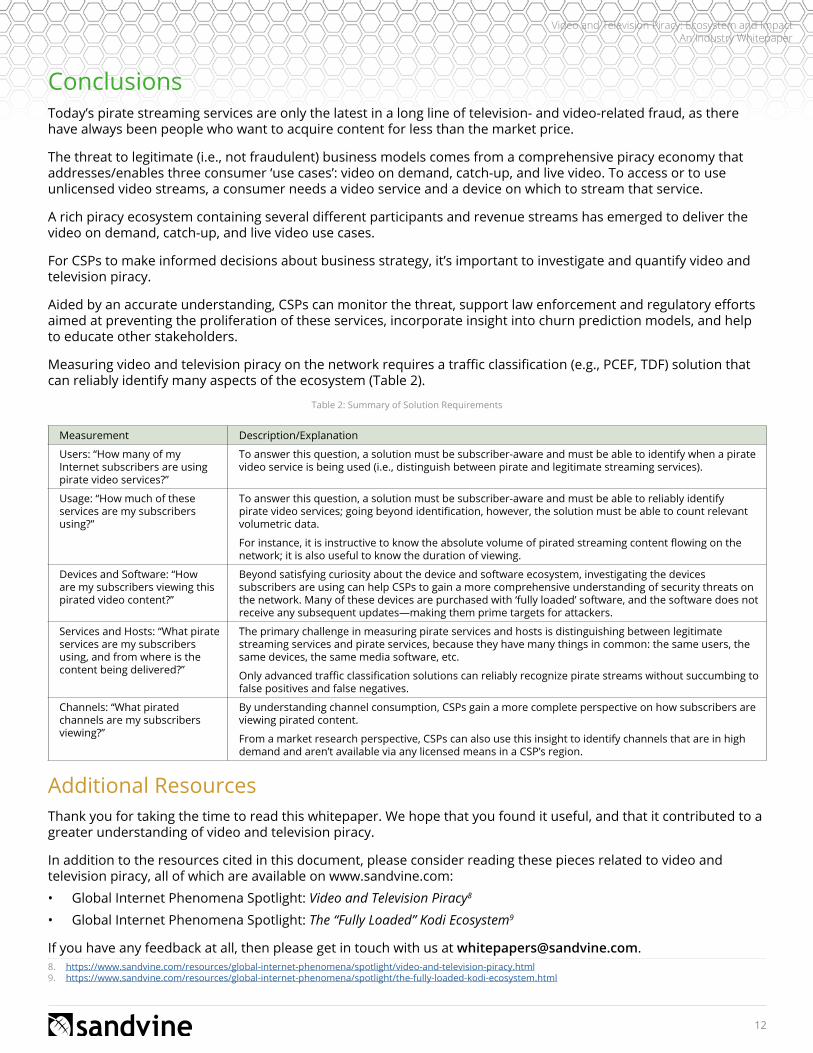
By inspecting unencrypted channels, CSPs gain a more complete perspective on how subscribers are viewing pirated content (see Figure 10); from a market research perspective, CSPs can also use this insight to identify channels that are in high demand and aren’t available via any licensed means in a CSP’s region.
For instance, Figure 10 shows that 24/7 local and international news channels drive the most usage, but international channels also make up a significant portion of pirate content volume.
Something that isn’t visible in Figure 10, but shows up as a characteristic of most networks, is that there is an extremely long tail of content. Unlike most network traffic distributions, where the top 10 or 15 applications and services make up 80-90% of volume, pirated television content is an extremely diverse and relatively equal mix—so much so that the top 50 channels make up only about a third of the volume.
11
Video and Television Piracy: Ecosystem and Impact An Industry Whitepaper
Figure 10: Sandvine Network Analytics dashboard showing (among other things) the relative share of each pirated television channel
12
Video and Television Piracy: Ecosystem and Impact An Industry Whitepaper
ConclusionsToday’s pirate streaming services are only the latest in a long line of television- and video-related fraud, as there have always been people who want to acquire content for less than the market price.
The threat to legitimate (i.e., not fraudulent) business models comes from a comprehensive piracy economy that addresses/enables three consumer ‘use cases’: video on demand, catch-up, and live video. To access or to use unlicensed video streams, a consumer needs a video service and a device on which to stream that service.
A rich piracy ecosystem containing several different participants and revenue streams has emerged to deliver the video on demand, catch-up, and live video use cases.
For CSPs to make informed decisions about business strategy, it’s important to investigate and quantify video and television piracy.
Aided by an accurate understanding, CSPs can monitor the threat, support law enforcement and regulatory efforts aimed at preventing the proliferation of these services, incorporate insight into churn prediction models, and help to educate other stakeholders.
Measuring video and television piracy on the network requires a traffic classification (e.g., PCEF, TDF) solution that can reliably identify many aspects of the ecosystem (Table 2).
Table 2: Summary of Solution Requirements
Measurement Description/Explanation
Users: “How many of my Internet subscribers are using pirate video services?”
To answer this question, a solution must be subscriber-aware and must be able to identify when a pirate video service is being used (i.e., distinguish between pirate and legitimate streaming services).
Usage: “How much of these services are my subscribers using?”
To answer this question, a solution must be subscriber-aware and must be able to reliably identify pirate video services; going beyond identification, however, the solution must be able to count relevant volumetric data.
For instance, it is instructive to know the absolute volume of pirated streaming content flowing on the network; it is also useful to know the duration of viewing.
Devices and Software: “How are my subscribers viewing this pirated video content?”
Beyond satisfying curiosity about the device and software ecosystem, investigating the devices subscribers are using can help CSPs to gain a more comprehensive understanding of security threats on the network. Many of these devices are purchased with ‘fully loaded’ software, and the software does not receive any subsequent updates—making them prime targets for attackers.
Services and Hosts: “What pirate services are my subscribers using, and from where is the content being delivered?”
The primary challenge in measuring pirate services and hosts is distinguishing between legitimate streaming services and pirate services, because they have many things in common: the same users, the same devices, the same media software, etc.
Only advanced traffic classification solutions can reliably recognize pirate streams without succumbing to false positives and false negatives.
Channels: “What pirated channels are my subscribers viewing?”
By understanding channel consumption, CSPs gain a more complete perspective on how subscribers are viewing pirated content.
From a market research perspective, CSPs can also use this insight to identify channels that are in high demand and aren’t available via any licensed means in a CSP’s region.
Additional ResourcesThank you for taking the time to read this whitepaper. We hope that you found it useful, and that it contributed to a greater understanding of video and television piracy.
In addition to the resources cited in this document, please consider reading these pieces related to video and television piracy, all of which are available on www.sandvine.com:
• Global Internet Phenomena Spotlight: Video and Television Piracy8
• Global Internet Phenomena Spotlight: The “Fully Loaded” Kodi Ecosystem9
If you have any feedback at all, then please get in touch with us at [email protected]. https://www.sandvine.com/resources/global-internet-phenomena/spotlight/video-and-television-piracy.html9. https://www.sandvine.com/resources/global-internet-phenomena/spotlight/the-fully-loaded-kodi-ecosystem.html

This whitepaper is published by Sandvine Incorporated ULC©. All rights reserved. No part of this publication may be reproduced, copied or transmitted in any form or by any means, or stored in a retrieval system of any nature, without the prior permission of Sandvine Incorporated ULC. Although the greatest care has been taken in the preparation and compilation of this whitepaper, no liability or responsibility of any kind, including responsibility for negligence is accepted by Sandvine Incorporated ULC.
© Copyright: Sandvine Incorporated ULC 2016
408 Albert St. Waterloo, Ontario Canada N2L 3V3
www.sandvine.com