vibrational study of phase transitions in (c3h7nh3)2pbcl4
TRANSCRIPT

JOURNAL OF RAMAN SPECTROSCOPY, VOL. 21, 709-716 (1990)
Vibrational Study of Phase Transitions in
Younes Abid* Ecole Nationale d'hgenieurs, 6029 Gab&, Tunisia
M. Kamoun and A. Daoud Laboratoire de 1'Etat Solide, Ecole Nationale d'ingenieurs, 3038 Sfax, Tunisia
F. Romain CNRS-LASIR, 2 rue Henri Dunant, 94320 Thiais, France
Infrared and Raman spectra (5-3500 cm-I) of polycrystaUine samples of (C3H,NH3),PbC14 and of its deuterated derivative were investigated in the temperature range 90-300 K. An assignment of the observed bands at room temperature is proposed. A temperature dependence study of the frequencies, v, and half-widths, Av1/*, of some low-frequency Raman bands revealed two phase transitions at about 110 and 170 K, whereas the deuterated com- pound showed only one phase transition at about 150 K in the same temperature range. These transitions are believed to be governed by libration of the cation coupled with NH, group jumps between different potential wells. The value of activation energy, E, = 3.2 kJ mol-I, was calculated from the plot of A V , ~ , vs. temperature; it is of the same order of magnitude as the potential barrier, V, = 3.53 kJ mol-I, calculated from the torsional frequency of NH3+ (288 cm-I).
INTRODUCTION
The compounds of general formula (C,H,,+ ,NH3),MX,, with X = C1, Br and M = metal, have the perovskite structure. The crystalline structure of these derivatives can be described as a sequence of alternating layers of corner-sharing MX, octahedra and of aligned organic chains situated between these layers. Recently, their magnetic properties and phase tran- sitions have attracted considerable interest.'-, So far, two main types of transitions have been demon- strated;lP3 the first is related to the flipping of the ter- minal NH, groups of the chains between several potential wells and the second involves conformational disorder of the long chains (when n > 3). In this paper we report a preliminary vibrational study of phase tran- sitions in di(propy1ammonium)lead tetrachloride [(C3H,NH3),PbCl,] and its ND, deuterated deriv- ative. We also discuss the crystal dynamics.
EXPERIMENTAL
(C,H,NH,),PbCl, was synthesized by mixing C3H,NH3C1 and PbCl, in HCI solution in the stoichio- metric ratio 1 : 2; the ND, deuterated derivative was obtained by exchange in D,O. Raman spectra were recorded on a Dilor RTI 30 spectrometer equipped with an argon ion laser (514.5 nm). Low-temperature mea- surements were performed with a DILOR liquid nitro- gen cryostat and a thermocouple was used to estimate
* Author to whom correspondence should be addressed.
03774486/90/110709-08 $05.00 6 1990 by John Wiley & Sons, Lld.
the sample temperature. Infrared spectra in the range 2004000 cm-' were recorded on a Perkin-Elmer 983 spectrometer.
~~~~~
STRUCTURE AND SELECTION RULES
(C3H,NH3),PbCI, [(PA),PbCl,] crystallizes in a perovskite-type layer structure consisting of nearly iso- lated layers of corner-sharing PbCl, octahedra. The cavities between octahedra contain the NH3+ groups of propylammonium cations (PA') which form hydrogen bonds with the chlorine atoms of the layers. At room temperature (phase I), (PA),PbCl, crystallizes in the Pnma (0;:) space group (2 = 4);4 (PA') cations occupy C, sites and PbC1, octahedra occupy C, sites. The numbers and classes of Raman- and infrared-active modes under the selection rules for the primitive cell, derived from group theoretical analysis, are summarized in Table 1.
Table 1. Factor group analysis of internal and lattice vibrations of (C,H,NH,)PbCI, at room temperature 14,(2 = 4) structure1
Internal vibrations" Lattice vibrations*
Symmetry PAt PbCI, layers PA+ PhCI, layers Activity
A, 36 8 3R', 3T' 1 7 Rarnan Bl, 36 5 3R. 3T' 1T' Raman B2, 36 8 3 R , 3T' 1T' Rarnan 8 3 9 36 6 3R', 3T' Rarnan A, 36 6 3 R . 3T' Inactive 8 1 , 36 8 3R. 3T' T, IR B," 36 5 3R'. 3T' T, IR 83, 36 8 3 R . 3T' Tx IR
a PA+ = C3H,NH3+; T,, T, and T, represent acoustic modes.
Received 15 March 1990 Accepted 10 June 1990

710 Y. ABID, M. KAMOUN, A. D A O U D A N D F. ROMAIN
RESULTS AND DISCUSSION
Assignment
Infrared and Raman spectra of (PA)2PbCI, and of its ND, deuterated derivative were recorded at room tem- perature (phase I). By comparison of these spectra and by analogy with the spectrum of n-pr~pylamine,~ com- plete assignments were established (Table 2).
Lattice modes. A detailed assignment of the low- frequency Raman bands is difficult because of their large number and their broadness and because of the similarity between some theoretical isotopic ratios; the calculated values of the isotopic ratio lp = v(PAf-
TaMe2. Observed frequencies (cm-') and assignment of (C3H,NH,),PbCl, and of (C,H,NH,),PbCI, in the D,, factor group structure at 300 K (phase I)
Raman"
10 vw 34 rn 42 m 47 rn 63 w 76 vs 84 w 113 rn 131 s 184 rn 247 vw 288 s 325 rn 452 s 827 m 870 vs 950 rn 990 rn 1027 rn 1052 vs 1076 w 1182vs 1284 rn 1296 m 1325 rn 1330 s 1395 rn 1400 rn 1452 s 1465 s 1508 s 1579 s 2870 m 2878 s 2906 w 2928 s 2940 w 2970 vs 2987 m 3010 w 3030 m 3220 m
IR
285 330 447
870 895 1000 1025 1050
1180
1290 1320 1371 1390
1450
1505 1580 2760 2770
2980 301 0 3030 3200
Raman
10 34 38 47 60 74 85 115 130 176
207 324 453
87 1
1000 1206
1182
1297 1324 1330 1395
1449 1462
2870 2876 2906 2920
2970 2985 21 82 2262 2303
IR
330 450
869
1024
1180
1370
1460
2805 2890
2969
21 83 2264 2321
Tentative assignments
? R'( PbCI,) ? R'( PbCI,)
Motion of PA'
v,(CIPbCI) R,' of PA+ u,( CI PbCI)
CCC bend CC bend CH, rock CCC stretch CH, rock NH, rock CCC stretch NH, twist CN stretch CH, rock
x(NH3)
CH, twist CH, wag CH, twist CH, wag
CH, deformation
a,( N H 3 1 6, ( N H,)
CH, and CH, stretch
CH, stretch
= Strong, vs = very strong, w = weak, vw =very weak, rn =medium.
h,)/v(PA'-d,)] for the external modes of the PA+ cation are pRy, = 1.051, pRz , = p R , , = 1.027 and p T , = 1.024. Hence only the R,' mode can be distinguished by deuteration. This band is observed at 184 cm-' and is shifted to 176 cm-' on deuteration.
The bands observed at 34, 47 and 10 cm-', on the other hand, do not shift on deuteration and they may correspond to layer deformation modes.
Internal modes. The Raman bands observed at 325 and 131 cm-' are easily assigned to CCC bending' and v 5( PbCl,), respectively.
The remaining bands between 250 and 3500 cm-' in the Raman and IR spectra are assigned to internal modes of the P A + cation. The band observed at 288 cm-', for instance, is shifted to 207 crr-' in the spec- trum of the deuterated compound @ = 1.39) and corre- sponds to the NH, torsional vibration.
The bands at 3010, 3030 and 3220 cm-' observed in the Raman and IR spectra are characterized by a high isotopic ratio (about 1.4), and can thus be assigned unambiguously to the N-H stretching modes.
The assignment of the other bands was confirmed by comparison with the spectra of n-propylamine, studied by Durig et al.'
Phase transitions
We recorded the Raman spectra of (C,H7NH3),PbC1, in the range 90-300 K. Above 110 K the low-frequency Raman spectra are not very well resolved (Fig. 1). The half-widths of some Raman bands shown in Fig. 2 were determined approximately by assuming that these bands have a Lorentzian profile and by using a spectral decomposition program. A systematic temperature dependence of some low-frequency modes and half- widths and a qualitative analysis of the spectra revealed two phase transitions at about 110 and 170 K:
l l O K 170 K
phase I11 - phase I1 - phase I The phase transition at 110 K is characterized by the following: 1. The curves v =f(T) of some low frequencies show
inflection points at 110 K (Fig. 3). 2. The appearance of the band at 11 cm-' and the dis-
appearance of another at 22 cm-' (Fig. 1). 3. The band assigned to v,(PbC1),6 which is inactive in
both phases I and 11, appears at 265 cm-l in the Raman spectra of phase 111 (below 110 K) (Fig. 4).
4. The sudden variation of widths of all the bands observed (Figs 1 and 4).
5. The sudden variation of the relative intensities of some bands; the curves in Fig. 5 describe the varia- tion of the ratios Z(81 cm-i)/1~70cm-l) and Z136 cF-lJl(l~l with temperature; they have inflection points at 110 K.
These discontinuities suggest a first-order character for this phase transition.
The second phase transition (I1 -+ I) is also character- ized by an inflection point on all of the curves v =f(T) at about 170 K (Fig. 3). On the other hand, on heating the sample through the phase TI -+ I transition we

VIBRATIONAL STUDY OF PHASE TRANSITIONS 711
i M I 1 I I I I
I
Phase II
133 K
P h a s e m
103 K
1 I
20 0 150 100 5 0 10 f- c m-'
Figure 1. Low-frequency Raman spectra (5-205 cm-') of (PA),PbCI, and characterization of the three phases.
observe a progressive disappearance of some Raman bands and a progressive coalescence of several other bands because of their broadening and their continuous displacement (Figs 2 and 3). This continuity in the spec- tral evolution may suggest a second-order character for this transition.
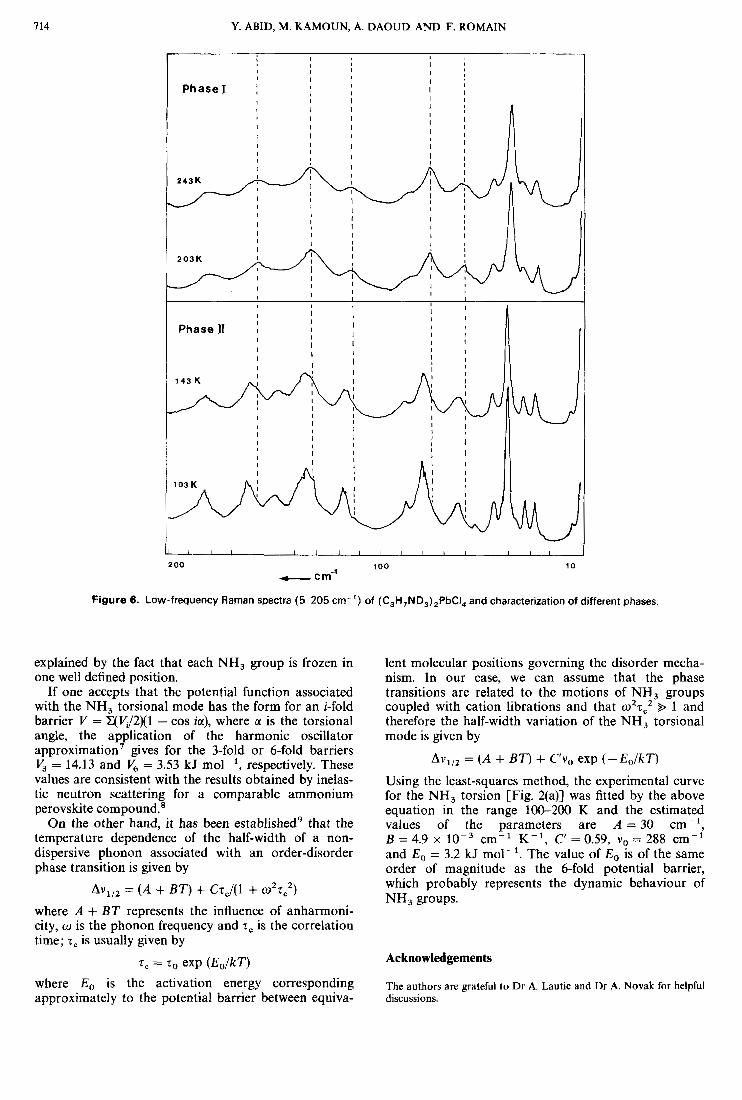
Raman spectra of (C,H7ND3),PbC1, were recorded in the same temperature range (9&300 K) (Fig. 6) but revealed only one phase transition at 150 K. The varia- tion of frequencies and half-widths as a function of tem- perature for some isolated bands are shown in Figs 7 and 8, and have inflection points at about 150 K.
As shown in Figs 1 and 6, only the Raman lines below 50 cm-l, assigned to chlorine lattice motions, remain relatively narrow; all other bands assigned to cation motions show a considerable broadening across
all transitions observed with both compounds. This broadening, in particular in the case of the NH, torsion mode at 288 cm-' [Fig. 2(a)], indicates that the cation motions and the NH, torsion are directly involved in the disordering process. This is confirmed by the shift of the transition temperature on deuteration [T, (I1 -+ I) = 170 K in (PA),PbCl, shifts to 150 K in the ND, derivative]. A similar behaviour has been found in the comparable compound NH,(CH,),NH,MnCI, ~'
Crystal dynamics
Several perovskite-type layer compounds have been extensively studied for their structural phase transi- tions, e.g. NH,(CH,),NH,MnCI, and

712 Y. ABID, M. KAMOUN, A. DAOUD AND F. ROMAIN
6a
56
5 2
4 8
4 4
4 0
36
10
B
6
8
6
4
6
4
100 150 2 00 2 5 0 T/K
Figure 2. Half-width variations of some Raman bands of (PA),PbCI, with temperature: (a) v =288 cm-'; (b) v = 184 cm-'; (c) v = 131 cm-'; (d) v=60cm-' .
(C,,H,,NH,),CdCI, . 12 The evolution of their spectra with increasing temperature is similar to that of (C,H,NH,),PbCl, and in several cases it has been established that the phase transitions are governed by the NH, torsional motion coupled with libration of the alkyl chains. In fact, in phase I only the lines below 50 cm- ' assigned to chlorine lattice motions, are relatively narrow. The broadness of all the other bands observed in the low-frequency Raman spectra indicates a large amount of disorder, mainly due to the large amplitudes of the NH, torsion and the PA' libration around its long axis. In phase 11, the lattice is less disordered and the motion of the cation may lead to a modification in the hydrogen bonding with chlorine atoms of the layers. In fact, the appearance of two bands characteristic of weak hydrogen bonds at 3162 and 3080 cm-' in the Raman spectra may indicate the presence of two differ- ent hydrogen bonds with N . . - C l distances of about 3.45 and 3.40 A, respectively. The strengths of these
interactions are similar to those observed in similar compounds.'
As shown in Figs 2 and 8, the broadening of the v(PbC1) band (at 131 C I I - ' ) reflects the degree of dis- order which is induced in the chlorine sublattice.
In phase 111 (below 110 K), the low-frequency Raman spectrum is very well resolved and the narrowness of the bands suggests an ordered structure for this phase. The splitting of the CCC bending band into two com- ponents (327-319 cm-') (Fig. 4) can be assigned to two different molecular conformers. The components at 327 and 319 cm-' correspond to trans and gauche con- formers of the chain, respectively ;5 this can be explained by the fact that at room temperature the correlation time is of the same order of magnitude as the observa- tion time, and at low temperature the residence time is long enough to distinguish two different conformers. The splitting of some other bands into two components and the noticeable order observed below 110 K may be

713
1 (crn ')
193 -
185 -
c
152 -
144 -
"2
7 8 1% 2 0 0 2 5 0 T/K
l , l l l l l l t l l ! l l l
100 150
Figure 3. Frequency variations of some Raman bands of (PA),PbCI, with temperature: v1 =184 cm-l, v,=144 cm-', v,=131 cm-', v,=76cm-'
2 4 0 K
319 289
C
350 300
cm-'
Figure 4. Raman spectra (260-360 cm-') of (PA,)PbCI, in dif- ferent phases: (a) phase I: (b) phase II: ( c ) phase Ill .
-
relative intensity
100 1 5 0 200 T/K Figure 5. Variation of relative intensities with temperature: (a) Ip r c m - t J 1 v o c m - l ) ; (b) 1,,36cm-jV//(123 c r n - 1 ) .
714 Y. ABID, M. KAMOUN, A. DAOUD AND F. ROMAIN
l l l l l l l l l l l , l l l l l l l l
200 100 10 t cm-'
Figure 6. Low-frequency Raman spectra (5-205 cm-') of (C,H,ND,),PbCI, and characterization of different phases.
explained by the fact that each NH, group is frozen in one well defined position.
If one accepts that the potential function associated with the NH, torsional mode has the form for an i-fold barrier V = qVJ2)(1 - cos ia), where a is the torsional angle, the application of the harmonic oscillator approximation7 gives for the 3-fold or 6-fold barriers V, = 14.13 and V, = 3.53 kJ mol-', respectively. These values are consistent with the results obtained by inelas- tic neutron scattering for a comparable ammonium perovskite compound.*
On the other hand, it has been established' that the temperature dependence of the half-width of a non- dispersive phonon associated with an order-disorder phase transition is given by
A V ' / ~ = ( A + BT) + CzJl + 0 ~ 7 , ' )
where A + BT represents the influence of anharmoni- city, o is the phonon frequency and T~ is the correlation time; T= is usually given by
T , = T, exp ( E , / k T ) where E , is the activation energy corresponding approximately to the potential barrier between equiva-
lent molecular positions governing the disorder mecha- nism. In our case, we can assume that the phase transitions are related to the motions of NH, groups coupled with cation librations and that 0 ~ 7 , ~ % 1 and therefore the half-width variation of the NH, torsional mode is given by
Avliz = ( A + BT) + C'v, exp ( - E , / k T )
Using the least-squares method, the experimental curve for the NH, torsion [Fig. 2(a)] was fitted by the above equation in the range 100-200 K and the estimated values of the parameters are A = 30 cm-', B = 4.9 x l op3 cm-' K-', C' = 0.59, v, = 288 cm-' and E , = 3.2 kJ mol-'. The value of E , is of the same order of magnitude as the 6-fold potential barrier, which probably represents the dynamic behaviour of NH, groups.
Acknowledgements
The authors are grateful to Dr A. Lautie and Dr A. Novak for helpful discussions.

VIBRATIONAL STUDY OF PHASE TRANSITIONS
130
715
135+-vb 100 1 5 0 200 Ti K
Figure 7. Frequency variations of some Raman bands of (C,H,ND,),PbCI, with temperature: (a) v = 144 Cm-’; (b) v = 183 Cm-’; (c) v=130cm-’; (d) v=76cm-’.
c
100 150 200 2 5 0 T/K
Figure 8. Half-width variations of some Raman bands of (C,H,ND3), PbCI, with temperature: (a) v1 = 183 cm-’; (b) v = 130 cm-’

716 Y. ABID, M. KAMOUN, A. DAOUD AND F. ROMAIN
REFERENCES
1. C. Sourisseau and G. Lucazeau. J. Raman Spectrosc. 8, 31 1 (1979).
2. N. B. Chanh, C. Hauw and A. Meresse. J. Phys. Chem. Solids 46, No. 12. 1413 (1985).
3. M. Couzi, A. Daoud and R. Perret, Phys. Status Solid; A 41, 271 (1977). 44,967 (1983).
4. A. Meresse and A. Daoud, Acta Crystallogr., Sect. C 45, 194 (1989).
5. J. R. Durig, W. B. Bechir, S. E. Godbey and T. J. Hizer, J. Raman Spectrosc. 20,311 ( 1 989).
6. K. Nakamoto, Infrared Spectra of Organic Compounds, 2nd ed.,
7. F. A. Miller, W. G. Fatley and R. E. Wikowski, Spectrochim.
8. C. Sourisseau, G. Lucazeau and A. J. Dianoux, J. Phys. (Paris)
9. P. Andrade and S. Porto, Solid State Commun. 14, 547 (1 974).
pp. 121 -1 23. Wiley-lnterscience, New York (1 970).
Acra, PartA 23, 591 (1967).