phase transitions and phase diagrams
TRANSCRIPT
MSE 3050, Phase Diagrams and Kinetics, Leonid Zhigilei
Phase Transitions and Phase Diagrams
One-component systems
Enthalpy and entropy dependence on P and T
Gibbs free energy dependence on P and T
Clapeyron equation
Understanding phase diagrams for one-component systems
Polymorphic phase transitions
Driving force for a phase transition
First order and second-order phase transitions
Reading: 1.2 of Porter and EasterlingChapter 7.1 – 7.4 of Gaskell

MSE 3050, Phase Diagrams and Kinetics, Leonid Zhigilei
PVT Surface of a Pure Substance
http://www.eng.usf.edu/~campbell/ThermoI/ThermoI_mod.html
MSE 3050, Phase Diagrams and Kinetics, Leonid Zhigilei
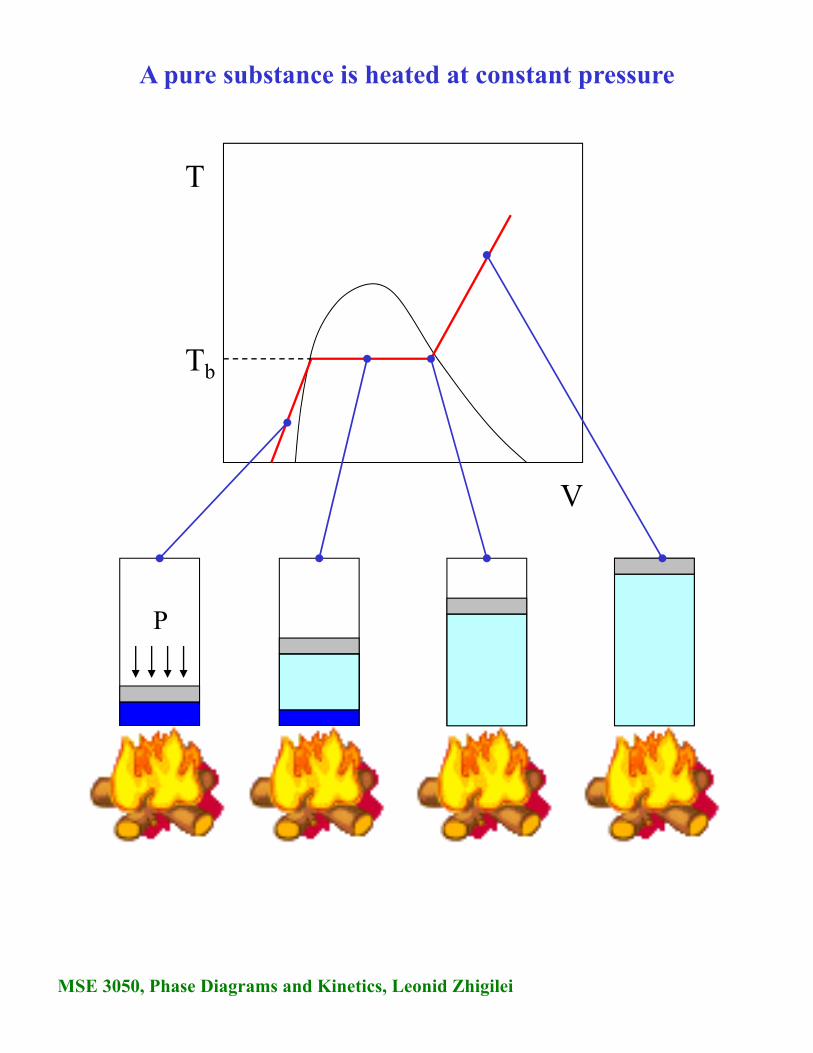
A pure substance is heated at constant pressure
T
Tb
V
P

MSE 3050, Phase Diagrams and Kinetics, Leonid Zhigilei
H and S as function of T at constant P
In a closed one-component system equilibrium, at temperature T andpressure P, corresponds to the state with minimum Gibbs free energy G.Therefore, in order to predict what phases are stable under differentconditions we have to examine the dependence of G on T and P.
Let’s use thermodynamic relations to predict the temperaturedependence of H, S, and G at constant P.
For H(T) we have T
298
P298 dTCHTHPP
CT
H
For S(T) we have T
0
P dTT
CTS
T
C
T
S P
P
0
0
0
CP
H
S
T, K
T, K
T, K298
Slope = CP
Slope = CP/T

MSE 3050, Phase Diagrams and Kinetics, Leonid Zhigilei
G as function of T at constant P
For G = H – TS we have dG = -SdT +VdP and for P = const
ST
G
P
for the slope
T
c
T
S
T
G P
PP
2
2
for the curvature
0
H
T, KTS
Slope = CP
Slope = -S
G
G(T) for a single phase at P = const

MSE 3050, Phase Diagrams and Kinetics, Leonid Zhigilei
G as function of T at constant P for liquid and solid phases
At all temperatures the liquid has a higher internal energy U andenthalpy H as compared to the solid. Therefore Gl > Gs at low T.
The liquid phase, however, has a higher entropy S than the solid phase atall T. Therefore Gl decreases more rapidly with T as compared to Gs.
At Tm Gl(T) crosses Gs(T) and both liquid and solid phases can co-existin equilibrium (Gl = Gs)
0
Hl
T, KTm
Gl
At Tm the heat supplied to the system will not rise its temperature butwill be used to supply the latent heat of melting Hm that is required toconvert solid into liquid. At Tm the heat capacity Cp = (H/T)P isinfinite – addition of heat does not increase T.
Hs
Gs
Hm
Hl > Hs
Sl > Ss
at all T
Hm = TmSm

MSE 3050, Phase Diagrams and Kinetics, Leonid Zhigilei
A typical P-T phase diagram for a pure material
The red lines on the phase diagram show the conditions where differentphases coexist in equilibrium: Gphase1 = Gphase2
liquid
solid
gas
T
P
triple point
1 atm
normal freezing point
criticalpoint
normal boilingpoint
G
P = 1 atmvapor
T
liquid
solid
liquid is stable
vapor is stable
solid is stable

MSE 3050, Phase Diagrams and Kinetics, Leonid Zhigilei
G as function of P at constant T for liquid and solid phases
As we can see from the fundamental equation, dG = VdP – SdT, the freeenergy of a phase increases with pressure:
If the two phases have different molar volumes, their free energies willincrease by different amounts when pressure changes at a fixed T.
0VP
G
T
G
T = 0ºC
1 atm P
Vl < Vs for water
Vl > Vs for most materials
How the unusual change of V upon melting of water could be related toice-skating?
What is the curvature of the G(P) at constant T?
TT P
V
V
1k
TV
PVB
- isothermal compressibility
- bulk modulus

MSE 3050, Phase Diagrams and Kinetics, Leonid Zhigilei
Equilibrium between two phases: Clapeyron equation
If two phases in equilibrium have different molar volumes, their freeenergies will increase by different amounts when pressure changes at afixed T. The equilibrium, therefore will be disturbed by the change inpressure. The only way to maintain equilibrium at different pressures isto change temperature as well.
For two phases in equilibrium Gl = Gs and dGl = dGs for infinitesimalchange in T and P (so that the system remains in equilibrium)
dTS-dPVdG lll
At equilibrium
ΔV
ΔS
VV
SS
dT
dP
ls
ls
eq.
dTS-dPVdG sss dTS-dPVdTS-dPV ssll
0S TΔΔHΔG S TΔΔH and
Therefore V TΔ
ΔH
dT
dP
eq.
- the Clapeyron equation
The Clapeyron equation gives the relationship between the variations ofpressure and temperature required for maintaining equilibrium betweenthe two phases.

MSE 3050, Phase Diagrams and Kinetics, Leonid Zhigilei
G as function of P and T for liquid and solid phases
Schematic representation of the equilibrium surfaces of the solid andliquid phases of water in G-T-P space.
The planes show the free energies of liquid and solid phases, theintersections of the planes correspond to the (P, T) conditions needed formaintaining equilibrium between the phases, Gl = Gs.
G
T
P
liquid
solid
0ºC
1 atm

MSE 3050, Phase Diagrams and Kinetics, Leonid Zhigilei
For liquid to gas transition: V =Vg - Vl >> 0
H = Hg - Hl > 0 – we have to addheat to convert liquid to gas.
Therefore 0V TΔ
ΔH
dT
dP
eq.
Clapeyron equation: examples
A typical diagram for a pure material:liquidsolid
gas
T
P
For liquid to solid transition: V = Vs – Vl < 0 for most materials
H = Hs - Hl < 0 – heat is released upon crystallization.
Therefore 0V TΔ
ΔH
dT
dP
eq.
For some materials, however, V = Vs – Vl > 0 and 0dT
dP
eq.
Si, Ge, Ga, Bi, GaAs, diamond …
In general, it takes heat (H > 0) to proceed from a low-temperature to ahigh-temperature phase (entropy of a high-temperature phase is higherthan the entropy of a low-temperature phase). Therefore, the slope ofthe equilibrium lines in a P-T phase diagram of a pure materialreflects the relative densities of the two phases.
liquidsolid
gas
T
P
liquid
solid gas
TFe, Ni, Au, CuZn, Ar, …
0dT
dP
m
P
0dT
dP
m

MSE 3050, Phase Diagrams and Kinetics, Leonid Zhigilei
Clapeyron equation: more examples
Some materials may exist in more than one crystal structure, this iscalled polymorphism. If the material is an elemental solid, it is calledallotropy.
Close-packed FCC -Fe has asmaller molar volume than BCC-Fe: V = V - V < 0
At the same timeH = H - H > 0
Therefore 0V TΔ
ΔH
dT
dP
eq.
The diagram shows the stable phases for pure iron at varyingtemperature and pressure.
-Fe
-Fe
The effect of increasing pressure is to increase the area of the phasediagram over which the phases of the smaller molar volume (higherdensity) is stable.
-Fe
G
T
BCCFCC
P = constliquid
vapor

MSE 3050, Phase Diagrams and Kinetics, Leonid Zhigilei
-Fe
-Fe
-Fe
V TΔ
ΔH
dT
dP
eq.

MSE 3050, Phase Diagrams and Kinetics, Leonid Zhigilei
V TΔ
ΔH
dT
dP
eq.

MSE 3050, Phase Diagrams and Kinetics, Leonid Zhigilei
V TΔ
ΔH
dT
dP
eq.

MSE 3050, Phase Diagrams and Kinetics, Leonid Zhigilei
V TΔ
ΔH
dT
dP
eq.
Can the volume expansion of water upon melting explain ice-skating?
kg 100m
lengthcontact cm 1 wide,mm 2 :skateJ/mol 5636
/molcm 0.18/molcm 63.193
3
m
liquid
ice
HVV

MSE 3050, Phase Diagrams and Kinetics, Leonid Zhigilei
Squeezing diamond from graphite: What pressure should we apply to transform graphite to diamond at 298 K?
In reference books we can find that at 298 K and 1 atm:
Hdiamond = 1900 J/molSgraphite = 5.73 J/KSdiamond = 2.43 J/Kgraphite = 2.22 g/cm3
diamond = 3.515 g/cm3

MSE 3050, Phase Diagrams and Kinetics, Leonid Zhigilei
The driving force for the phase transformation
If solid and liquid are in equilibrium, Gs = Gl and a slow addition of heatleads to the melting of some part of the solid, but do not change the totalG of the system:
G = nl Gl + ns Gs = const, where nl and ns are the numbers of moles ofliquid and solid phases, and Gl and Gs are the molar Gibbs free energies.
If energy is added/removed quickly, the system can be brought out ofequilibrium (overheated or undercooled) – the melting/freezing processis spontaneous/irreversible and G is decreasing.
G
T*
G
Gs
At temperature T*
Gl
Tm
T
l*
ll ST-HG
s*
ss ST-HG
ST-HG *
At temperature Tm
0ST-HG m
m
m
T
HS
For small undercooling T we can neglect the difference in Cp ofliquid and solid phases and assume that H and S are independent oftemperature.
m
m*m T
ΔHTΔHΔG
m
m
T
ΔTΔHΔG The driving force for solidification
At temperature T*:

MSE 3050, Phase Diagrams and Kinetics, Leonid Zhigilei
First-order and second-order phase transitions (I)
The classification of phase transitions proposed by Ehrenfest is based onthe behavior of G near the phase transformation.
G
Ttrs
trs
trstrs T
HS
0ΔGtrs
First-order phase transition: first derivatives of G arediscontinuous.
Second-order phase transition: first derivatives of G arecontinuous, but second derivatives of G are discontinuous.
First-order phase transition
T
V
Ttrs T
S
Ttrs T
H Cp
-ST
G
P
VP
G
T
- discontinuous
Ttrs T Ttrs T 0Strs
0Htrs
PP dT
dHC
e.g. melting, boiling, sublimation, some polymorphous phase transitions.

MSE 3050, Phase Diagrams and Kinetics, Leonid Zhigilei
First-order and second-order phase transitions (II)
G
Ttrs
0ΔGtrs
Second-order phase transition
T
V
Ttrs T
S
Ttrs T
H Cp
-ST
G
P
VP
G
T
- continuous (S and V do not jump at transition)
Ttrs T Ttrs T
0Strs
0Htrs
PP dT
dHC
e.g. conducting-superconducting transition in metals at lowtemperatures.
0Vtrs
P
2
T
V
PT
G
T
2
P
S
TP
G
- discontinuous

MSE 3050, Phase Diagrams and Kinetics, Leonid Zhigilei
Summary
Make sure you understand language and concepts:
Enthalpy and entropy dependence on P and T
Gibbs free energy dependence on P and T
Clapeyron equation
Understanding phase diagrams for one-component systems
Driving force for a phase transition
First order and second-order phase transitions
Make sure you understand P-T, G-P, G-T 2D phase diagrams fora one-component system (what is shown, what are the linesseparating different regions, how to predict the slopes of thelines, etc.)