vibration and shock sensitivity: a comparative study of oscillators · · 2017-01-11since crystal...
TRANSCRIPT
1SNAA296–January 2017Submit Documentation Feedback
Copyright © 2017, Texas Instruments Incorporated
Vibration and Shock Sensitivity: A Comparative Study of Oscillators
All trademarks are the property of their respective owners.
Application ReportSNAA296–January 2017
Vibration and Shock Sensitivity: A Comparative Study ofOscillators
Chao Li, Arvind Sridhar
ABSTRACT
(1) “MIL-STD-883H, Test Method Standard, Microcircuits.” Department of Defense. 26 February 2010.
When designing a system that incorporates a clock oscillator, the vibration sensitivity of the oscillatordevice is a specification that is easily overlooked. Sensitivity to vibration can have a detrimental impact onthe overall system performance. Since crystal oscillators fundamentally rely on the vibration andmechanical resonance of a piezoelectric material, external disturbances can couple into the device anddegrade its performance. These external disturbances can result in output frequency shifts, elevatedphase noise and spurs. Mechanical shocks of sufficient magnitude can also cause irreversible frequencyshifts at the output of the crystal oscillator.
In the tests outlined in this study, the TI oscillator exhibited an order of magnitude improved resilience tovibration versus two competitor offerings. It also had the least frequency perturbations in response tomechanical shock. Test procedure details and measured results are presented in the following sections.
Contents1 Introduction ................................................................................................................... 22 Test Setup and Procedure.................................................................................................. 23 Data and Results ............................................................................................................ 84 Conclusion .................................................................................................................. 115 References .................................................................................................................. 11
List of Figures
1 Orientation Of The Devices On The Cube With respect To Pin 1. Movement Of The Cube Is Along The ZAxis. ........................................................................................................................... 3
2 Photo of Vibration Test Equipment ........................................................................................ 43 Sinusoidal and Random Vibration Test Setup Diagram ................................................................ 44 Vibration Test Setup Showing Cube On Vibration Table With The DUTs Connected To A Power Supply
And Signal Source Analyzer ............................................................................................... 55 MIL-STD-883H, Method 2026: Random Vibration (1).................................................................... 66 Shock Test Setup Diagram................................................................................................. 77 Shock Test Setup Showing Cube On Shock Table And Guide Rail. Only 1 Dut Is Attached At A Time To
Avoid Causing Damage To The Others................................................................................... 88 Sensitivity To X-axis Acceleration Over Frequency Of Vibration. Lower Is Better. ................................. 99 Sensitivity To Y-axis Acceleration Over Frequency Of Vibration. Lower Is Better. ................................. 910 Sensitivity To Z-axis Acceleration Over Frequency Of Vibration. Lower Is Better. ................................. 911 Phase Jitter Induced by Random Vibration. Lower Is Better. ........................................................ 1012 Frequency Deviation in ppm Under 500-g Shock. Lower Is Better. ................................................. 10
List of Tables
1 Typical Acceleration Levels in Various Environments .................................................................. 22 Devices Tested and Their Specifications ................................................................................. 2
Introduction www.ti.com
2 SNAA296–January 2017Submit Documentation Feedback
Copyright © 2017, Texas Instruments Incorporated
Vibration and Shock Sensitivity: A Comparative Study of Oscillators
1 IntroductionTable 1 below shows typical levels of acceleration that a device might experience in various operatingenvironments. Sources of vibration are present anywhere from inside a moving vehicle or aircraft, to ahandheld mobile device. Systems are also susceptible to vibrations from sources such as cooling fans inthe equipment chassis. The performance of aircraft radar, for example, is directly related to the referenceoscillator phase noise in the system. Vibration induced elevated phase noise translates to the blurring oftargets and a decrease in accuracy of detection. Medical imaging and ultrasound applications are alsoquite sensitive to vibration. In these systems, the reference oscillator phase noise limits the maximumachievable resolution, so the system must be resilient to vibration to operate reliably.
(1) John R. Vig, “Quartz Crystal Resonators and Oscillators,” US Army Communications-Electronics Research, Development &Engineering Center. January 2004.
Table 1. Typical Acceleration Levels in Various Environments (1)
ENVIRONMENT TYPICAL ACCELERATION (G's)Buildings, quiescent 0.02 rms
Tractor-trailer (3-80 Hz) 0.2 peakArmored personnel carrier 0.5 to 3 rms
Ship - calm seas 0.02 to 0.1 peakShip - rough seas 0.8 peak
Railroads 0.1 to 1 peakPropeller aircraft 0.3 to 5 rms
Helicopter 0.1 to 7 rmsJet aircraft 0.02 to 2 rms
Missile - boost phase 15 peak
The LMK6xxx family of high-performance fixed and programmable oscillators from Texas Instruments (TI)is resilient to the effects of vibration and mechanical shock. Integrated circuit (IC) packaging and layouttechniques are optimized to minimize the coupling of external vibrations through the body of the device tothe resonating element.
To test resilience to vibration, three tests were performed on the LMK61E2, the flagship oscillator from TI,and a similar PLL-based oscillator from another vendor. A surface acoustic wave (SAW) based oscillatorfrom competition was also added to the test for vibration sensitivity to compare different oscillatortechnologies. The units were first subjected to sinusoidal vibration at various frequencies along x, y and zdirections. The test was repeated a second time along each axis with random vibration profiles. The finaltest measured the transient frequency deviation of the units during operation in response to mechanicalshock. Phase noise (including spurs) and frequency excursion data was recorded during the tests.
2 Test Setup and Procedure
2.1 General SetupTable 2 lists the 3 devices tested as part of this comparative study. The TI LMK61E2 and Silicon LabsSi536 utilize a quartz resonator and an internal PLL to synthesize output frequencies (156.25 MHz for thisstudy). The third device selected for the test was an Epson EG-2102CA 125 MHz fixed frequency SAW-based oscillator. The measured data for the Epson device was normalized with respect to frequency togive an accurate representation of relative performance.
Table 2. Devices Tested and Their Specifications
LABEL MANUFACTURER PART NUMBER TECHNOLOGY FREQUENCY OUPUTTI Texas Instruments LMK61E2-SIA XO + PLL 156.25 MHz LVPECLSL Silicon Labs 536AB156M250DG XO + PLL 156.25 MHz LVPECL
EP Epson EG-2102CA125.0000M-PHPAL3 SAW 125 MHz LVPECL

www.ti.com Test Setup and Procedure
3SNAA296–January 2017Submit Documentation Feedback
Copyright © 2017, Texas Instruments Incorporated
Vibration and Shock Sensitivity: A Comparative Study of Oscillators
All devices were installed on identical boards for testing. The board was square shaped with the oscillatormounted in the center and standoffs at each corner so that when mounted to a test fixture, vibrationscouple into the device uniformly. The board was also designed to minimize extraneous components thatcould affect the response of the measurement system to vibration, leading to incorrect conclusions. Inaddition to connectors for the output signal and power, the only other components on the boards werepower supply filtering capacitors and LVPECL output passive termination components.
The test fixture for vibration and shock transmitted accelerations along one axis. To test the devices in allaxes with minimum re-configuration, the three boards (one with each device under test, or DUT) weremounted to a metal plate. A fourth board for which data was not taken was added to each plate to eventhe weight distribution on the plate. Three of these plates were then prepared and mounted on differentsides of a metal cube attached to the test fixture. The plates were oriented on the cube such thatmovement of the cube in one axis transmits accelerations in a different axis for each plate and set ofdevices. Figure 1 and Figure 2 depict the finished cube setup.
Figure 1. Orientation Of The Devices On The Cube With respect To Pin 1. Movement Of The Cube IsAlong The Z Axis.
Cube
Vibration table
BalunAgilent E5052BSignal source
analyzer
Agilent E3631APower supply
PC for data capture
Axis ofacceleration
LVPECL out
Test Setup and Procedure www.ti.com
4 SNAA296–January 2017Submit Documentation Feedback
Copyright © 2017, Texas Instruments Incorporated
Vibration and Shock Sensitivity: A Comparative Study of Oscillators
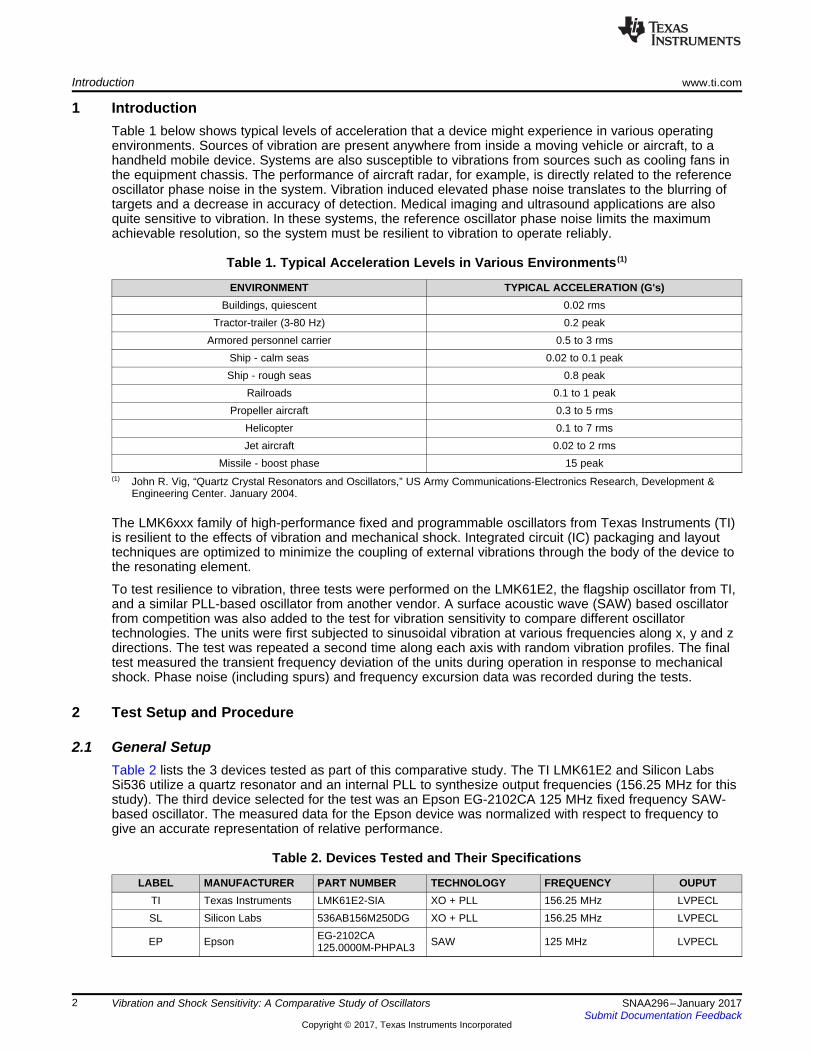
Figure 2. Photo of Vibration Test Equipment
Figure 3. Sinusoidal and Random Vibration Test Setup Diagram
Figure 3 shows the sinusoidal and random vibration test setup. In this test, the cube was mounted on avibration table which subjected the units under test to an acceleration of a specific magnitude along oneaxis. The DUTs were all powered by a bench power supply. LVPECL differential outputs from the DUTswere converted to single-ended waveforms before being measured by a signal source analyzer (SSA).The output clock phase noise and frequency data was then transmitted from the SSA to a PC.

www.ti.com Test Setup and Procedure
5SNAA296–January 2017Submit Documentation Feedback
Copyright © 2017, Texas Instruments Incorporated
Vibration and Shock Sensitivity: A Comparative Study of Oscillators
(1) “MIL-STD-883H, Test Method Standard, Microcircuits.” Department of Defense. 26 February 2010.
2.1.1 Test 1: Sinusoidal VibrationThe vibration table was set for a peak acceleration of 4-g. A dwell time of 1 minute was allowed beforetaking data to rule out settling effects. The vibration frequencies selected for the test were: 15 Hz, 30 Hz,60 Hz, 100 Hz, 300 Hz, 600 Hz, 1000 Hz, and 2000 Hz.
Vibrations at a specific frequency manifest as spurs on the output clock phase noise plot that occur at thecorresponding offset from the carrier frequency. The magnitude of these spurs, in dBc, was recorded andconverted into parts per billion (ppb) frequency shifts. Finally, the ppb value was normalized by the peakacceleration of 4-g to obtain a frequency shift per g of acceleration value (ppb/g), which is a measure ofresilience to vibration for an oscillator.
Figure 4. Vibration Test Setup Showing Cube On Vibration Table With The DUTs Connected To A PowerSupply And Signal Source Analyzer
2.1.1.1 Random VibrationIn this test, the cube was subjected to accelerations with random frequency content that mimicked a realworld application. The test setup was similar to the previous one where we measured the impact ofsinusoidal vibration. For the random vibration test, the vibration table was set to generate an accelerationprofile as defined by MIL-STD-883H, Method 2026, Condition B. (1) This profile subjects the DUTs to anacceleration of 7.5-g rms.
Random vibrations also increase oscillator phase noise. The test hardware generated random vibrationover the specified frequency range, based on the power spectral density level as shown in Figure 5. Sincethe vibration was spread over a range of frequencies, there was an overall increase in the phase noise ofthe output clock from the DUT rather than just spurs at specific frequency offsets. The integrated RMSphase jitter values were measured over an integration band from 15 Hz to 10 kHz, which wasapproximately the range of vibration frequency content generated by the vibration table according to MIL-STD-883H. Measurements were taken with and without the vibrations present and the RMS jitterdifference between the two cases was calculated to determine the jitter induced by the vibration for eachDUT.

Test Setup and Procedure www.ti.com
6 SNAA296–January 2017Submit Documentation Feedback
Copyright © 2017, Texas Instruments Incorporated
Vibration and Shock Sensitivity: A Comparative Study of Oscillators
(2) “MIL-STD-883H, Test Method Standard, Microcircuits.” Department of Defense. 26 February 2010.
Figure 5. MIL-STD-883H, Method 2026: Random Vibration (2)

Cube
Shock table
BalunAgilent E5052BSignal source
analyzer
Agilent E3631APower supply
PC for data capture
Direction of drop
LVPECL out
www.ti.com Test Setup and Procedure
7SNAA296–January 2017Submit Documentation Feedback
Copyright © 2017, Texas Instruments Incorporated
Vibration and Shock Sensitivity: A Comparative Study of Oscillators
(3) “MIL-STD-883H, Test Method Standard, Microcircuits.” Department of Defense. 26 February 2010.
2.1.2 Test 3: Mechanical Shock
Figure 6. Shock Test Setup Diagram
In this test, the cube was subjected to an impulsive acceleration to determine the impact of shock on theDUT output frequency. Instead of the cube being mounted on a vibration table, it was attached to a guiderail on a shock table which allowed the cube to be lifted and then dropped in a controlled manner,resulting in mechanical shock when it hit the table. Also, only 1 DUT was attached to the cube at a time, toavoid causing damage to units not being tested. The shock applied is defined by MIL-STD-883H, Method2002, Condition A. (3) This profile subjects the DUTs to a 1 ms half sine wave shock pulse with anacceleration of 500-g.
A shock impact could result in a momentary output frequency excursion or in extreme cases a permanentshift in the operating frequency. Data was measured using the transient mode of the signal sourceanalyzer to record the output frequency every 100 μs for a 10 second duration surrounding the moment ofimpact. Three trials were run to account for any inaccuracy that may have resulted from the frequencyexcursion falling within the sampling interval. The worst case frequency deviation and any persistentfrequency offset after the impulse was then used to compare the resilience of the DUTs to shock.

Data and Results www.ti.com
8 SNAA296–January 2017Submit Documentation Feedback
Copyright © 2017, Texas Instruments Incorporated
Vibration and Shock Sensitivity: A Comparative Study of Oscillators
Figure 7. Shock Test Setup Showing Cube On Shock Table And Guide Rail. Only 1 Dut Is Attached At ATime To Avoid Causing Damage To The Others.
3 Data and Results
3.1 Test 1: Sinusoidal VibrationThe two PLL based oscillators showed roughly similar levels of sensitivity to sinusoidal vibration. Theaverage frequency shift per ‘g’ of acceleration also did not change significantly as the frequency wasvaried for any of the devices. The TI oscillator showed less sensitivity than the other PLL based device at1 kHz of vibration along the Y-axis, but in general, the devices had comparable performance. The EpsonSAW oscillator was the most sensitive to sinusoidal vibration, exhibiting an order of magnitude morefrequency shift along the X and Z axes.

www.ti.com Data and Results
9SNAA296–January 2017Submit Documentation Feedback
Copyright © 2017, Texas Instruments Incorporated
Vibration and Shock Sensitivity: A Comparative Study of Oscillators
Figure 8. Sensitivity To X-axis Acceleration Over Frequency Of Vibration. Lower Is Better.
Figure 9. Sensitivity To Y-axis Acceleration Over Frequency Of Vibration. Lower Is Better.
Figure 10. Sensitivity To Z-axis Acceleration Over Frequency Of Vibration. Lower Is Better.
Data and Results www.ti.com
10 SNAA296–January 2017Submit Documentation Feedback
Copyright © 2017, Texas Instruments Incorporated
Vibration and Shock Sensitivity: A Comparative Study of Oscillators
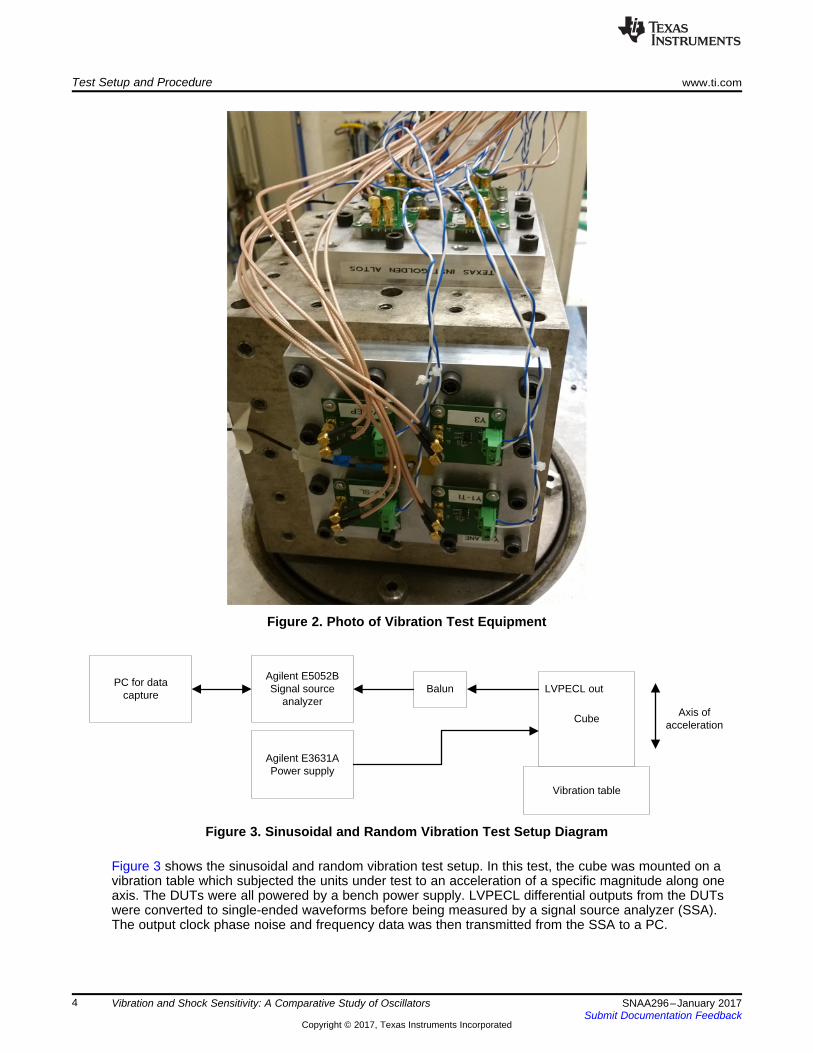
3.2 Test 2: Random VibrationThe TI oscillator clearly stood out with superior vibration resistance when subjected to random vibration. Itexhibited the lowest average induced phase jitter out of the devices tested. Its performance exceeds thatof the Silicon Labs part along every axis of vibration, with about 25 times less induced jitter along the Zaxis. The Epson SAW oscillator was again the most vibration susceptible device in the test group, with theworst average induced jitter. The fact that the induced jitter can sometimes exceed 100 ps RMS, which issignificantly higher than baseline values, underscores the importance of considering vibration whendesigning an oscillator into a system.
Figure 11. Phase Jitter Induced by Random Vibration. Lower Is Better.
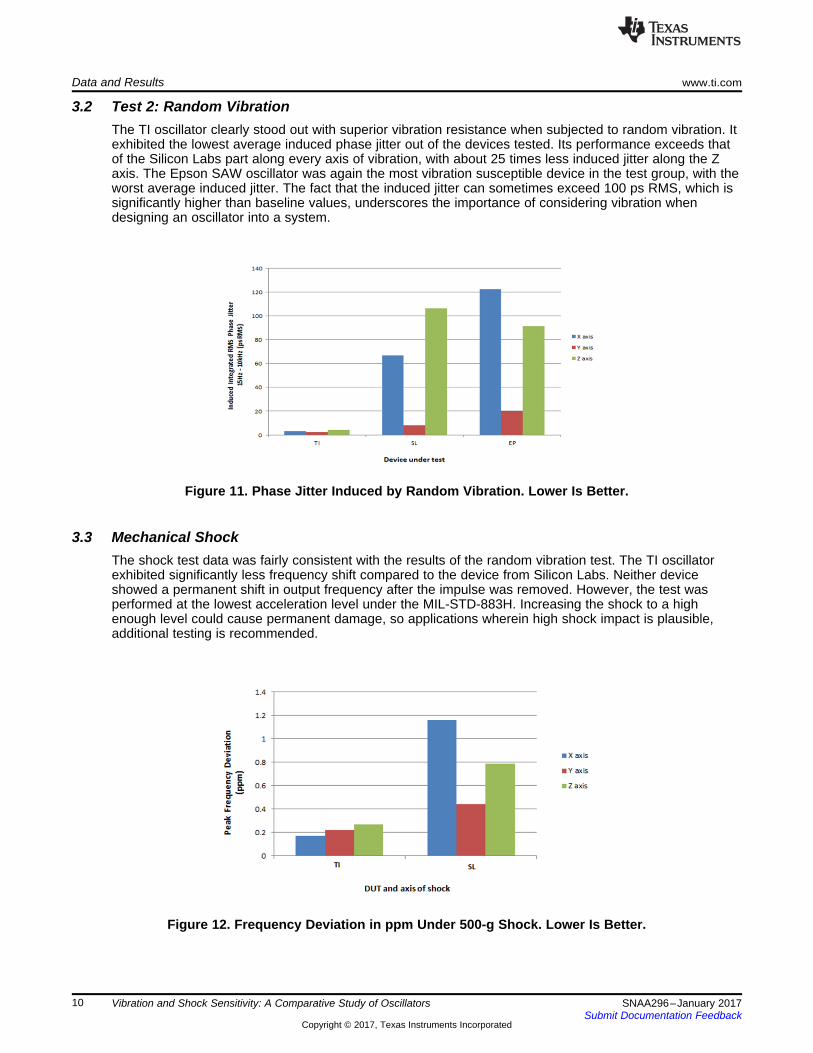
3.3 Mechanical ShockThe shock test data was fairly consistent with the results of the random vibration test. The TI oscillatorexhibited significantly less frequency shift compared to the device from Silicon Labs. Neither deviceshowed a permanent shift in output frequency after the impulse was removed. However, the test wasperformed at the lowest acceleration level under the MIL-STD-883H. Increasing the shock to a highenough level could cause permanent damage, so applications wherein high shock impact is plausible,additional testing is recommended.
Figure 12. Frequency Deviation in ppm Under 500-g Shock. Lower Is Better.

www.ti.com Conclusion
11SNAA296–January 2017Submit Documentation Feedback
Copyright © 2017, Texas Instruments Incorporated
Vibration and Shock Sensitivity: A Comparative Study of Oscillators
4 ConclusionWhen designing a clock oscillator into a system, the impact of vibration is often overlooked. However, asdemonstrated above, oscillators with similar specifications can exhibit vastly different behaviors whensubject to vibration or shock, possibly resulting in the addition of tens of picoseconds of jitter and violationof design requirements. TI’s LMK61E2 and LMK6xxx family of oscillators are engineered with robustnessin mind and the tests performed in this study demonstrate the effectiveness of their design. The vibrationand shock resilience of TI oscillators complements their ultra-low phase noise, making Texas Instrumentsthe optimal choice for current and next generation high performance systems
5 ReferencesVig, John R. “Quartz Crystal Resonators and Oscillators.” US Army Communications-ElectronicsResearch, Development & Engineering Center. January 2004.
“MIL-STD-883H, Test Method Standard, Microcircuits.” Department of Defense. 26 February 2010.
IMPORTANT NOTICE FOR TI DESIGN INFORMATION AND RESOURCES
Texas Instruments Incorporated (‘TI”) technical, application or other design advice, services or information, including, but not limited to,reference designs and materials relating to evaluation modules, (collectively, “TI Resources”) are intended to assist designers who aredeveloping applications that incorporate TI products; by downloading, accessing or using any particular TI Resource in any way, you(individually or, if you are acting on behalf of a company, your company) agree to use it solely for this purpose and subject to the terms ofthis Notice.TI’s provision of TI Resources does not expand or otherwise alter TI’s applicable published warranties or warranty disclaimers for TIproducts, and no additional obligations or liabilities arise from TI providing such TI Resources. TI reserves the right to make corrections,enhancements, improvements and other changes to its TI Resources.You understand and agree that you remain responsible for using your independent analysis, evaluation and judgment in designing yourapplications and that you have full and exclusive responsibility to assure the safety of your applications and compliance of your applications(and of all TI products used in or for your applications) with all applicable regulations, laws and other applicable requirements. Yourepresent that, with respect to your applications, you have all the necessary expertise to create and implement safeguards that (1)anticipate dangerous consequences of failures, (2) monitor failures and their consequences, and (3) lessen the likelihood of failures thatmight cause harm and take appropriate actions. You agree that prior to using or distributing any applications that include TI products, youwill thoroughly test such applications and the functionality of such TI products as used in such applications. TI has not conducted anytesting other than that specifically described in the published documentation for a particular TI Resource.You are authorized to use, copy and modify any individual TI Resource only in connection with the development of applications that includethe TI product(s) identified in such TI Resource. NO OTHER LICENSE, EXPRESS OR IMPLIED, BY ESTOPPEL OR OTHERWISE TOANY OTHER TI INTELLECTUAL PROPERTY RIGHT, AND NO LICENSE TO ANY TECHNOLOGY OR INTELLECTUAL PROPERTYRIGHT OF TI OR ANY THIRD PARTY IS GRANTED HEREIN, including but not limited to any patent right, copyright, mask work right, orother intellectual property right relating to any combination, machine, or process in which TI products or services are used. Informationregarding or referencing third-party products or services does not constitute a license to use such products or services, or a warranty orendorsement thereof. Use of TI Resources may require a license from a third party under the patents or other intellectual property of thethird party, or a license from TI under the patents or other intellectual property of TI.TI RESOURCES ARE PROVIDED “AS IS” AND WITH ALL FAULTS. TI DISCLAIMS ALL OTHER WARRANTIES ORREPRESENTATIONS, EXPRESS OR IMPLIED, REGARDING TI RESOURCES OR USE THEREOF, INCLUDING BUT NOT LIMITED TOACCURACY OR COMPLETENESS, TITLE, ANY EPIDEMIC FAILURE WARRANTY AND ANY IMPLIED WARRANTIES OFMERCHANTABILITY, FITNESS FOR A PARTICULAR PURPOSE, AND NON-INFRINGEMENT OF ANY THIRD PARTY INTELLECTUALPROPERTY RIGHTS.TI SHALL NOT BE LIABLE FOR AND SHALL NOT DEFEND OR INDEMNIFY YOU AGAINST ANY CLAIM, INCLUDING BUT NOTLIMITED TO ANY INFRINGEMENT CLAIM THAT RELATES TO OR IS BASED ON ANY COMBINATION OF PRODUCTS EVEN IFDESCRIBED IN TI RESOURCES OR OTHERWISE. IN NO EVENT SHALL TI BE LIABLE FOR ANY ACTUAL, DIRECT, SPECIAL,COLLATERAL, INDIRECT, PUNITIVE, INCIDENTAL, CONSEQUENTIAL OR EXEMPLARY DAMAGES IN CONNECTION WITH ORARISING OUT OF TI RESOURCES OR USE THEREOF, AND REGARDLESS OF WHETHER TI HAS BEEN ADVISED OF THEPOSSIBILITY OF SUCH DAMAGES.You agree to fully indemnify TI and its representatives against any damages, costs, losses, and/or liabilities arising out of your non-compliance with the terms and provisions of this Notice.This Notice applies to TI Resources. Additional terms apply to the use and purchase of certain types of materials, TI products and services.These include; without limitation, TI’s standard terms for semiconductor products http://www.ti.com/sc/docs/stdterms.htm), evaluationmodules, and samples (http://www.ti.com/sc/docs/sampterms.htm).
Mailing Address: Texas Instruments, Post Office Box 655303, Dallas, Texas 75265Copyright © 2017, Texas Instruments Incorporated