vibration analysis of logs with electronic speckle pattern interferometry
TRANSCRIPT

Vibration analysis of logs withelectronic speckle pattern interferometry
Astrid Aksnes Dyrseth and Sondre Skatter
Electronic speckle pattern interferometry combined with phase-shifting techniques for vibration analysisof logs is presented. Changes in the vibration pattern were followed on a television monitor at the videorate. We determined resonant vibrations by scanning through the frequency range of interest and bychanging the point of excitation. We observed bending and torsional modes of vibration by changing thesupport and point of excitation. The vibrational modes reflect the structural properties of the material.The longitudinal modulus of elasticity and the shear modulus were calculated, giving valuable informa-tion for the strength grading of logs. © 1997 Optical Society of America
Key words: Electronic speckle pattern interferometry, logs, modal analysis, nondestructive testing,roundwood, television holography.
1. Introduction
In the sawmill industry mechanical properties of thesawn lumber are determined with static bendingtechniques such as machine stress rating. Withsimple load-deflection relationships, the modulus ofelasticity ~MOE! is calculated, giving an indication ofthe strength of the material.1 When the lumber isstrength graded, 30–50 pointwise measurements ofthe machine-registered MOE are done on each plank,which is moving at a rate of 100–150 mymin. Thegrading is decided by the lowest registered stiffnessmeasurement. In addition, the lumber is graded vi-sually and manually to ensure that defects not reg-istered with machine stress rating are revealed.Modal analysis is a dynamic method well suited to
determining the elastic properties of wood and hasreceived considerable attention during recent years.By determining different vibrationmodes, we can cal-culate material parameters such as the modulus ofelasticity, shear modulus, and damping factors. Vi-bration analysis has been used for strength gradingof lumber2,3 but the techniques used at present aretime consuming, and information is obtained point-
A. A. Dyrseth is with the Applied Optics Group, Department ofPhysics, Norwegian University of Science and Technology, N-7034Trondheim, Norway. S. Skatter is with the Norwegian ForestResearch Institute, N-1432 Aas, Norway.Received 30 September 1996; revised manuscript received 27
November 1996.0003-6935y97y163649-08$10.00y0© 1997 Optical Society of America
wise, not full field. An accelerometer fitted to thespecimen with wax measures the vibration in differ-ent points in the x, y, z direction.4 Evaluation of themeasured accelerances must then be made.A rapid and accurate method to determine the
structural parameters of logs ~and lumber! is inter-esting for the sawmill industry. An increase in theamount of logs and lumber with high-strength grad-ing andyor the degree of use of the logs will cause anincrease in the profitability of the sawmill industry.In addition, quality control will be improved.In this paper we present the use of electronic
speckle pattern interferometry ~ESPI! for the modalanalysis of logs. ESPI, also known as television ho-lography or electronic holography, is a nondestruc-tive technique used for full-field vibration anddeformation analysis. The technique was intro-duced in the early 1970’s by three independentgroups.5–7 A video camera is used as the recordingdevice, allowing object changes to be followed in nearreal time. Quantitative information can be obtainedwith phase-stepping routines.8,9 ESPI has beenused for nondestructive testing both in the laborato-ry10,11 and in industry.12,13Changes in the vibration pattern of logs were fol-
lowed on a television monitor at the video rate withESPI. We determined resonant vibrations by scan-ning through the frequency range of interest and bychanging the point of excitation. We observed bend-ing and torsional vibration modes by changing themethod of support and the point of excitation. Thelongitudinal MOE and the shear modulus were cal-
1 June 1997 y Vol. 36, No. 16 y APPLIED OPTICS 3649

culated, giving valuable information for the strengthgrading of logs.We believe that vibration analysis with ESPI has
potential in the sawmill industry because the vibra-tion can be studied in full field and the information isobtained relatively quickly. We do not propose thatthe technique be used for on-line calculations in itspresent form. Suggested areas of application arequality inspection of spot tests of logs before sawingand basic research of the dynamic properties of treesand wood. Vibration analysis with ESPI may, infact, be used to study the mechanics of standing treesto understand, for example, which parameters maylead to failure.
2. Vibration Analysis with ESPI
A. Experimental Setup
ESPI is used for both deformation and vibration anal-ysis. Vibration analysis is used for the modal anal-ysis of logs and will therefore be treated here. For acomplete description of ESPI, we refer to the litera-ture.14,15Figure 1 shows a schematic illustration of the ex-
perimental setup used for vibration analysis. Theoptical system is based on a commercial ESPI instru-ment, RETRA 1000 ~Conspec AyS, Trondheim, Nor-way!. Coherent light from the argon laser is splitinto two branches, the reference branch and the ob-ject branch. The laser beam in the object branch ispassed through a speckle-averaging mechanism thatis used to create uncorrelated speckle patterns byaltering the object illumination angle in small steps.This improves the quality of the recording. The ob-ject beam is then expanded to illuminate the sinusoi-dally vibrating object. The reflected object wave is aspeckle wave that carries information about the ob-ject’s topography and position. It is focused by alens onto the video camera. To make the techniquephase-sensitive, the mirror in the reference branch isvibrated sinusoidally at the same frequency as theobject; this is known as sinusoidal phase modulation.~If we want to use phase stepping for deformation
Fig. 1. Schematic illustration of the ESPI setup used for thevibration analysis of logs.
3650 APPLIED OPTICS y Vol. 36, No. 16 y 1 June 1997
analysis, the same mirror in the reference branchprovides for a controlled optical phase shift of thereference beam.! A pinhole in the reference branchspatially filters the reference wave to create a uni-form wave that is combined with the reflected objectwave on the target of the video camera. To resolvethe speckle interferogram, an in-line configurationwith angles between the reference and object wave ofless than 1° is necessary because of the low resolvingpower of the video camera. The resulting interfer-ence pattern is recorded by the video camera andconverted into a video signal.Electronic reconstruction is performed in the signal
processing unit and in the image processing system.The image processing system consists of a PC, aframe grabber ~Data Translation, DT-2861!, and aframe processor ~Data Translation, DT-2858!. Firstthe video signal is high-pass filtered and rectified inthe signal processing unit. Then the analog signal isdigitized in the image processing system and the in-terference fringes that are superimposed on the im-age of the object can be seen in near real time on themonitor. The speckle interferogram can be pro-cessed further in the image processing system.
B. Vibration Analysis
The vibration amplitude of a harmonically vibratingobject is mapped as a time-averaged recording.When the object vibration is sinusoidal, the intensityI~x, y! is proportional to the squared zero-orderBessel function of the first kind15,16:
I~x, y! } Jo2Fao~x, y!gf
2p
l G , (1)
where ao~x, y! is the vibration amplitude of the objectat pixel ~x, y!; gf is a geometrical factor dependent onthe illumination, observation, and vibration direc-tions; and l is the wavelength of the laser. For par-allel observation, illumination, and vibrationdirections, gf is 2.As previously mentioned, to make the technique
phase-sensitive, we phase modulate the referencebeam by vibrating a mirror in the reference arm; thisis known as sinusoidal phasemodulation. When theobject and the reference beam vibrate sinusoidally,the intensity I~x, y! in pixel ~x, y! is proportional tothe squared zero-order Bessel function of the firstkind15,16:
I~x, y! } Jo2H4p
l@uao2~x, y!u 1 uar2u 2 2
3 uao~x, y!uuaru 3 cos u~x, y!#1y2J , (2)
for parallel illumination, observation, and vibrationdirections. Here u~x, y! 5 uo~x, y! 2 ur~x, y! is thephase difference between the object and the referencevibrations, and ar is the vibration amplitude of thereference beam. The fringe pattern overlaying theobject is determined by the relative amplitude and
the phase between the object and the reference beam.The phase and the amplitude can be separated withthe phase-stepping routines developed by ourgroup.16
C. Linear Approximation
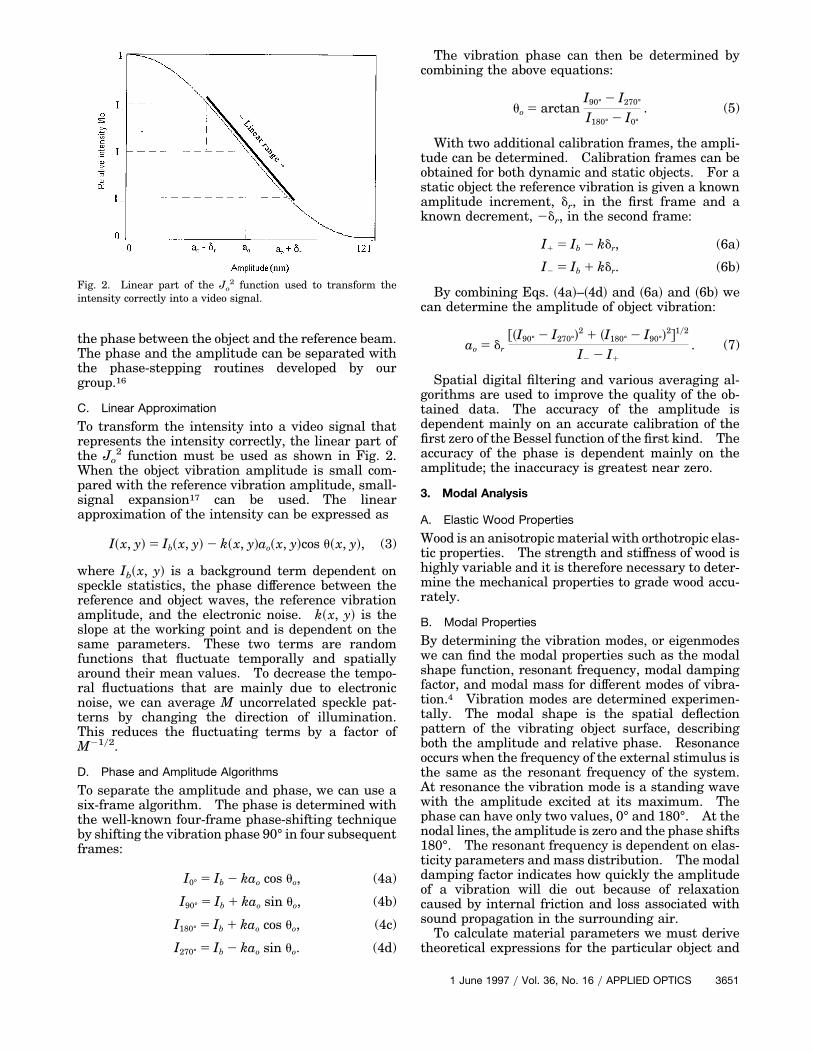
To transform the intensity into a video signal thatrepresents the intensity correctly, the linear part ofthe Jo
2 function must be used as shown in Fig. 2.When the object vibration amplitude is small com-pared with the reference vibration amplitude, small-signal expansion17 can be used. The linearapproximation of the intensity can be expressed as
I~x, y! 5 Ib~x, y! 2 k~x, y!ao~x, y!cos u~x, y!, (3)
where Ib~x, y! is a background term dependent onspeckle statistics, the phase difference between thereference and object waves, the reference vibrationamplitude, and the electronic noise. k~x, y! is theslope at the working point and is dependent on thesame parameters. These two terms are randomfunctions that fluctuate temporally and spatiallyaround their mean values. To decrease the tempo-ral fluctuations that are mainly due to electronicnoise, we can average M uncorrelated speckle pat-terns by changing the direction of illumination.This reduces the fluctuating terms by a factor ofM21y2.
D. Phase and Amplitude Algorithms
To separate the amplitude and phase, we can use asix-frame algorithm. The phase is determined withthe well-known four-frame phase-shifting techniqueby shifting the vibration phase 90° in four subsequentframes:
I0° 5 Ib 2 kao cos uo, (4a)
I90° 5 Ib 1 kao sin uo, (4b)
I180° 5 Ib 1 kao cos uo, (4c)
I270° 5 Ib 2 kao sin uo. (4d)
Fig. 2. Linear part of the Jo2 function used to transform the
intensity correctly into a video signal.
The vibration phase can then be determined bycombining the above equations:
uo 5 arctanI90° 2 I270°I180° 2 I0°
. (5)
With two additional calibration frames, the ampli-tude can be determined. Calibration frames can beobtained for both dynamic and static objects. For astatic object the reference vibration is given a knownamplitude increment, dr, in the first frame and aknown decrement, 2dr, in the second frame:
I1 5 Ib 2 kdr, (6a)
I2 5 Ib 1 kdr. (6b)
By combining Eqs. ~4a!–~4d! and ~6a! and ~6b! wecan determine the amplitude of object vibration:
ao 5 dr@~I90° 2 I270°!
2 1 ~I180° 2 I90°!2#1y2
I2 2 I1
. (7)
Spatial digital filtering and various averaging al-gorithms are used to improve the quality of the ob-tained data. The accuracy of the amplitude isdependent mainly on an accurate calibration of thefirst zero of the Bessel function of the first kind. Theaccuracy of the phase is dependent mainly on theamplitude; the inaccuracy is greatest near zero.
3. Modal Analysis
A. Elastic Wood Properties
Wood is an anisotropicmaterial with orthotropic elas-tic properties. The strength and stiffness of wood ishighly variable and it is therefore necessary to deter-mine the mechanical properties to grade wood accu-rately.
B. Modal Properties
By determining the vibration modes, or eigenmodeswe can find the modal properties such as the modalshape function, resonant frequency, modal dampingfactor, and modal mass for different modes of vibra-tion.4 Vibration modes are determined experimen-tally. The modal shape is the spatial deflectionpattern of the vibrating object surface, describingboth the amplitude and relative phase. Resonanceoccurs when the frequency of the external stimulus isthe same as the resonant frequency of the system.At resonance the vibration mode is a standing wavewith the amplitude excited at its maximum. Thephase can have only two values, 0° and 180°. At thenodal lines, the amplitude is zero and the phase shifts180°. The resonant frequency is dependent on elas-ticity parameters and mass distribution. The modaldamping factor indicates how quickly the amplitudeof a vibration will die out because of relaxationcaused by internal friction and loss associated withsound propagation in the surrounding air.To calculate material parameters we must derive
theoretical expressions for the particular object and
1 June 1997 y Vol. 36, No. 16 y APPLIED OPTICS 3651

support conditions. The experimental values ob-tained frommodal analysis are then inserted into theequations, and parameters such as the longitudinalMOE can be calculated. Modal analysis permits in-dependent estimates of the parameters to be made indifferent modes and thus reduces error.
C. Bending Modes
Bending occurs in oblong elastic objects. If we as-sume that the beam or cylinder being investigatedhas a large length-to-width ratio ~;20!, EulerySt.Venant beam theory can be used. If the length-to-width ratio is less than 20, Timoshenko beam the-ory must be used because shear deformation androtary inertia must be taken into account.18 Usingeither EulerySt. Venant or Timoshenko beam the-ory, we can derive expressions for the eigenfrequen-cies.2Logs having the shape of a cylinder are investi-
gated in this paper. We modified the EulerySt. Ve-nant eigenfrequency equations for cylinders withcross-sectional area pR2 and moment of inertiapR4y4. The eigenfrequencies for pure bending of afree–free cylinder are
fB2n 5 gn
p
4RL2 SEL
r D1y2
, (8)
where n is the mode number, g1 is 2.267, g2 is 6.249,and for n . 2 gn ' ~n 1 1y2!2, R is the radius of thecylinder, L is the length of the cylinder, EL is thelongitudinal MOE, and r is the mass density.
D. Torsional Modes
For torsional vibration of a free–free cylinder withcross-sectional area pR2 and moment of inertiapR4y4, the eigenfrequencies are
fT2n 5n2L SGLT
r D1y2
. (9)
GLT is the shear modulus associated with torsionalmodes, that is, shear deformation in thelongitudinal–tangential plane. If the mass is dis-tributed unevenly, the equation must be modified.In the calculations performed in this paper, uniformmass is assumed.
4. Experiment
The freshly chopped logs were barked and paintedwith silver retroreflective liquid ~Scotchlite! to in-crease the reflectivity. A mirror was used to imagepart of the top and backside of the log to enablecorrect interpretation of the fringe pattern. In theexperiment outlined in this paper only transversecomponents are measured. A different setup is re-quired to measure longitudinal motion. A sketch ofthe bending and torsional modes is shown in Fig. 3.All calculations assumed free–free ends condition.To ensure free–free ends condition, we had to usevarious methods of support for the various types ofmodes being investigated.
3652 APPLIED OPTICS y Vol. 36, No. 16 y 1 June 1997
Bending and torsional vibration modes were ex-cited. When bending modes were excited, the logwas supported on foam rubber placed underneath theends to simulate free–free ends condition. Theshaker was placed against the log with a horizontalradial direction of force as illustrated in Fig. 4~a!.For a bending mode to be excited, the excitation pointcannot coincide with a nodal line. When excitingtorsional modes, we hung up the log on screws thatwere embedded into the pith, as shown in Fig. 4~b!.This method of support proved to be good because thecylinder center is fixed and tangential motion is al-
Fig. 3. Sketch of the ~a! first bending mode and the ~b! firsttorsional mode. The direction of sensitivity of the ESPI setup isindicated and is perpendicular to the front of the log.
Fig. 4. Methods of support to ensure free–free ends condition for~a! bending modes and ~b! torsional modes.

Table 1. Properties of Scots Pine Logs
Log KnotsLength
~m!Average Diameter
~mm!Average Density
~kgym3!
Scots pine, 1a No knots 2.0 155 1015 6 30Scots pine, 2b Regular branch whorls 2.0 149 1015 6 15Scots pine, 1b Regular branch whorls 1.43 172 1085 6 30Scots pine, 2c Grown-over knots 1.43 169 940 6 15
Table 2. Properties of Mountain-Grown Scots Pine Logs
Log KnotsLength
~m!Average Diameter
~mm!Density~kgym3!
Scots pine, jon 1 14 dry knots 0.92 236 634Scots pine, jon 2 11 dry knots, 4 fresh knots 1.16 213 762Scots pine, jon 3 5 dry knots, 3 fresh knots 0.95 221 782Scots pine, jon 4 6 dry knots 0.94 284 747
Table 3. Resonant Frequency of First Four Bending Modes of Scots Pine Specimens
Log
Resonant Frequency of Bending Mode MOE1 ~109 Pa!a
1st ~Hz! 2nd ~Hz! 3rd ~Hz! 4th ~Hz! Static ESPI
Scots pine, 1a 120 286 492 708 12.3 6 0.4Scots pine, 2b 116 273 460 652 9.5 6 1.5 12.4 6 0.2Scots pine, 1b 239 550 880 1206 9.0 6 1.4 11.1 6 0.3Scots pine, 2c 250 556 871 1194 9.8 6 1.4 10.9 6 0.2
aMOE is calculated with the frequency of the first bending mode and with static bending techniques.
lowed elsewhere. The shaker was again placed witha tangential direction of force.The specimens in the first series of measurements
were chosen carefully to enable comparison of themodal properties of the different logs. Scots pine~pinus sylvestris! was chosen because of the regu-larity of the branch whorls; there are no knots be-tween the branch whorls. Log 1a was a Russianpruned log; it was completely knot free both exter-nally and internally. As the tree grew, the knotswere removed immediately after budding. Log 2bwas chosen to have approximately the same dimen-sions as log 1a but it had regular branch whorls.
Log 1b and log 2c had approximately the same di-mensions, but log 1b had regular branch whorls andlog 2c had grown-over knots as well as a few en-cased knots. We calculated the density of the fourlogs in two ways: by dividing the total mass by anestimate of the volume and by computer tomogra-phy scanning the log. Table 1 summarizes theproperties of the logs. The logs were frozen be-tween the various experiments to keep the watercontent approximately the same throughout the ex-periments.Another series of measurements was performed on
Scots pine ~pinus sylvestris! logs grown in a typical
Fig. 5. ESPI recordings of the amplitude andthe phase of the first four bending modes of theScots pine, log 1b.
1 June 1997 y Vol. 36, No. 16 y APPLIED OPTICS 3653

mountain climate. These logs had a relatively largenumber of knots, both dry and fresh. Table 2 sum-marizes the properties of the logs. The density was
Fig. 6. Phase map overlaying the amplitude contours of the firstbending modes of Scots pine, log 1b.
3654 APPLIED OPTICS y Vol. 36, No. 16 y 1 June 1997
found by dividing the mass by an estimate of the totalvolume.
5. Results and Discussion
A. Bending Modes
Bending modes were found easily on all the speci-mens by exciting the logs with a horizontal radial
Table 4. Resonant Frequency of Torsional Modes Found in Pine Logs
Loga
Resonant Frequency ofTorsional Mode
GLTb
~108 Pa!1st ~Hz! 2nd ~Hz! 3rd ~Hz!
Scots pine, 1a 626 7.6Scots pine, 2b 190 381 569 6.2Scots pine, jon 1 440 4.2Scots pine, jon 2 366 5.3Scots pine, jon 3 440 880 1360 5.5Scots pine, jon 4 443 876 1308 5.4
aThe mountain-grown Scots pine trees are the jon1–jon4 sam-ples.
bShear modulus, GLT, is calculated with the frequency of thetorsional modes.
Fig. 7. ESPI recordings of the amplitudeand the phase of the first three torsionalmodes of the mountain-grown Scots pine log,jon 4. The square area over the log is themirror that is imaging a part of the top andthe backside of the log.

direction of force. The vibration pattern was fol-lowed on the monitor and the excitation frequencywas varied until the resonant frequency was found.The shaker had to be moved when its position coin-cided with a nodal line.The EulerySt. Venant eigenfrequency equation
@Eq. ~8!# was used to calculate the longitudinal MOEfrom the results obtained with ESPI. Because Eu-lerySt. Venant theory is most accurate for the lower-order modes, the frequency of the first-order modewas used to calculate the longitudinal MOE. Theresonant frequency of the first four bending modes ofthe Scots pine logs determined with ESPI is tabu-lated in Table 3. The longitudinal MOE for three ofthe specimens was also calculated with static bend-ing techniques according to international stan-dards.19 The static calculation applies for smallclear specimens and does not take into accountchanges in strength due to knots, for example. Thedynamic longitudinal MOE is higher than the staticlongitudinal MOE in accordance with previous stud-
Fig. 8. Phase map overlaying amplitude contours of the firstthree bending modes of the mountain-grown Sots pine log, jon 4.The square area over the log is the mirror that is imaging a part ofthe top and the backside of the log.
ies.2 This must be taken into account when we com-pare the two calculations, and the method used mustalways be stated. For a more accurate comparisonof static and dynamic longitudinalMOE, Timoshenkotheory should be used to calculate the dynamic MOEbecause it is more accurate for thick specimens ~witha length-to-depth ratio of less than 20! and can beused to calculate higher-order modes. Although thelogs were frozen between measurements to ensurethat the water content was nearly the same, experi-ments in a more controlled environment must be per-formed to compare accurately the static and dynamiccalculations. ESPI, with its fast and accurate dataacquisition, allows us to study dynamic modal testsmore easily and in detail.Figure 5 shows the ESPI recordings of the four
bending modes of Scots pine log 1b. Both the am-plitude and the phase recordings are shown. Theseresults are median filtered and the phase map isoverlaying the amplitude contours in Fig. 6.
B. Torsional Modes
Torsional modes were excited as shown in Fig. 4~b!.These modes were slightly more difficult to detectthan the bending modes. However, when the firstmode was found, the next mode was easier to findbecause, according to the eigenfrequency Eq. ~9!, it isa multiple, which also agreed experimentally. Thetorsional modes found in two samples of the Scotspine and four samples of the mountain-grown Scotspine are tabulated in Table 4. The shear moduluswas calculated with Eq. ~9!. Log 1a was cut to0.67 m, resulting in a higher resonant frequency, aswas expected according to the eigenfrequency equa-tion. The second- and third-order modes for some ofthe samples were not measured. Static techniqueswere not used to determine the shear modulus be-cause the equipment necessary to perform the exper-iments was not available.Figure 7 shows the three torsional modes of the
Scots pine grown in a mountain climate, jon 4, re-corded with ESPI. Both the amplitude and thephase recordings are shown. The square area abovethe log is the mirror imaging part of the top and thebackside of the log. These results are median fil-tered and the phase map is overlaying the amplitudecontours in Fig. 8.
6. Conclusion
Vibration analysis with ESPI was used to determinethe bending and torsional modes of logs. The vibra-tion pattern was followed on the monitor and theexcitation frequency was varied until the resonantfrequency was found. The possibility of followingthe vibration pattern in near real time is one of thegreat advantages with ESPI. Other advantages arethat the vibration pattern is full field, the techniqueis nondestructive, and data acquisition is fast.EulerySt. Venant eigenfrequency equations were
modified for cylinders, allowing the MOE and theshear modulus to be calculated, giving an indicationof the strength of the logs. We believe that ESPI has
1 June 1997 y Vol. 36, No. 16 y APPLIED OPTICS 3655

potential in the sawmill industry for strength gradingin certain cases and for spot test quality control ofboth logs and lumber. In addition, modal analysiswith ESPI can be used for basic research of dynamicproperties of trees and wood.To better compare dynamic and static calculations,
the modal analysis of logs with ESPI should be per-formed on a greater number of specimens in a morecontrolled environment. Calculations should bemade with the more accurate Timoshenko beam the-ory. Further work also includes studying the me-chanical properties of standing trees. Deformationanalysis of logs with ESPI should also be investi-gated.
This research was supported by the Norwegian Re-search Council. The authors thank Ole Johan Løk-berg and HansMagne Pedersen for useful comments.
References1. R. J. Ross and R. F. Pellerin, “Nondestructive testing for as-
sessing wood members in structures: a review,” GeneralTechnical Report FPL-GTR-70 ~Rev.! ~U.S. Department of Ag-riculture, Forest Service, Forest Products Laboratory, Madi-son, Wis., 1994!, pp. 1–28.
2. M. Perstorper, “Dynamic modal tests of timber evaluation ac-cording to the Euler and Timoshenko theories,” in Proceedingsof the Ninth International Symposium on Nondestructive Test-ing of Wood ~Conferences and Institutes, Washington StateUniversity, Pullman, Wash., 1994!, pp. 45–54.
3. Y. H. Chui, “Vibration testing of wood and wooden structures;practical difficulties and possible sources of error,” in Proceed-ings of the Seventh International Symposium on the Nonde-structive Testing of Wood ~Conferences and Institutes,Washington State University, Pullman, Wash., 1989!.
4. S. Ohlsson and M. Perstorper, “Elastic wood properties fromdynamic tests and computer modeling,” J. Struct. Eng. 118,2677–2690 ~1992!.
5. J. N. Butters and J. A. Leendertz, “Holographic and videotechniques applied to engineering measurements,” J. Meas.Control 4, 349–354 ~1971!.
3656 APPLIED OPTICS y Vol. 36, No. 16 y 1 June 1997
6. O. Schwomma, “Holografisch-interferometrisches oder moi-remetrisches verfahren,” Austria patent 298,830 ~15 Septem-ber 1971!.
7. A. Macovski, D. Ramsey, and L. F. Schaefer, “Time-lapse in-terferometry and contouring using television systems,” Appl.Opt. 10, 2722–2727 ~1971!.
8. O. J. Løkberg and K. Høgmoen, “Vibration phase mappingusing electronic speckle pattern interferometry,” Appl. Opt. 15,2701–2704 ~1976!.
9. K. Creath, “Phase-shifting speckle interferometry,” Appl. Opt.24, 3053–3058 ~1985!.
10. O. J. Løkberg, K. Høgmoen, and O. M. Holje, “Vibration mea-surement on the human ear drum in vivo,” Appl. Opt. 18,763–765 ~1979!.
11. O. J. Løkberg, “Sound in flight: measurement of sound fieldsby use of TV holography,” Appl. Opt. 33, 2574–2584 ~1994!.
12. J. Davies, C. H. Buckberry, J. D. C. Jones, and C. N. Pannell,“Developments in electronic speckle pattern interferometry forautomotive vibration analysis,” in Laser Technologies in In-dustry, S. P. Almeida, L. M. Bernardo, and O. D. Soares, eds.,Proc. SPIE 952, 260–274 ~1988!.
13. O. J. Løkberg and P. Svenke, “Design and use of an electronicspeckle interferometer for testing of turbine parts,” Opt. LaserEng. 2, 1–12 ~1981!.
14. O. J. Løkberg, “Electronic speckle pattern interferometry,”Phys. Technol. 11, 16–22 ~1980!.
15. O. J. Løkberg and G. A. Slettemoen, “Basic electronic specklepattern interferometry,” in Applied Optics and Optical Engi-neering, R. R. Shannon and J. Wyant, eds. ~Academic, NewYork, 1987!, Vol. 10, pp. 455–504.
16. S. Ellingsrud and G. O. Rosvold, “Analysis of a data-basedTV-holography system used to measure small vibration am-plitudes,” J. Opt. Soc. Am. A 9, 237–251 ~1992!.
17. K. Høgmoen and O. J. Løkberg, “Detection and measurementof small vibrations using electronic speckle pattern interferom-etry,” Appl. Opt. 16, 1869–1875 ~1977!.
18. Y. H. Chui and I. Smith, “Influence of rotary inertia, sheardeformation and support condition on natural frequencies ofwooden beams,” Wood Sci. Technol. 24, 233–245 ~1990!.
19. ISO Standard 3349:75, “Wood—Determination of modulus ofelasticity in static bending,” Ed. 1, 3p.~B!, TC55 ~InternationalOrganization for Standardization, Switzerland, 1975!.