speckle interferometry: a review of the principal methods ...nam.epfl.ch/pdfs/113.pdf · principal...
TRANSCRIPT

Speckle Interferometry: A Review of thePrincipal Methods in Use for ExperimentalMechanics Applications
P. Jacquot
Nanophotonics and Metrology Laboratory, Swiss Federal Institute of Technology, CH-1015 Lausanne, Switzerland
ABSTRACT: With its nearly 40 years of existence, speckle interferometry (SI) has become a
complete technique, widely used in many branches of experimental mechanics. It is thus a challenging
task to try to summarise in a couple of pages its principal characteristics from both theoretical and
practical points of view. Admittedly, even though this goal is not met here, it appeared worth
attempting to provide the photomechanics community with a discussion of the ins and outs of the
technique. The necessity of a vocabulary free of ambiguity was a prerequisite, and hence the first
section is a plea for a clearer definition of the discipline. Moreover, this section offers the oppor-
tunity to re-examine the basic aspects of SI. Then, the main features of the method are briefly
considered following a strengths, weaknesses, opportunities and threats (SWOT) analysis. Endowed
with a lot of specific advantages, compared with other whole-field methods, SI can play an increasing
role in photomechanics.
KEY WORDS: deformation analysis, experimental mechanics applications, methodologies, speckle
interferometry
Introduction
The birth of SI dates back at least to the early 1970s,
when Leendertz and Butters published their seminal
articles [1, 2]. These articles arouse a considerable
interest among the holographic interferometry (HI)
community. Scientists of this field then realised that
the direct recording of a two-beam interference pat-
tern between a reference and a speckle wave carries in
itself the phase information of the speckle wave,
without the need to reconstruct its 3D complex
amplitude as in holography – a step appearing
deceptively simple nowadays. A huge amount of
scientific literature pertaining to SI, impossible to be
all cited here, is currently available, very rich in both
theoretical and practical considerations. The few
references [3–7], and the references therein, give at
least the first bases of the discipline. Referring to the
number of recent well-attended international con-
ferences including in their programmes SI techniques
as a major topic (as e.g. [8]), the research and appli-
cation fields are by no means exhausted. Besides such
bootstraps, this contribution attempts to analyse the
role of SI in experimental mechanics, mainly inspired
by the papers [9–11]. For this purpose, it seemed
convenient to borrow an approach usually employed
in a business context, i.e. the strengths, weaknesses,
opportunities and threats (SWOT) analysis.
A serious difficulty accompanying any treatment of
SI lies in the absence of a clear and agreed upon
definition of the discipline. On the contrary, many
designations can be found, not exempt of possible
confusions. Examples of these designations are,
besides the old terminology ‘ESPI’, for electronic
speckle-pattern interferometry, electro-optic inter-
ferometry, TV holography, digital speckle interfer-
ometry, etc., with many adjunctions such as in-line,
shearing or phase-shifting SI, and so on. ‘Digital
holography’ (DH) is usually free of misinterpretation,
but when an expression like ‘image-plane digital
holography’ is encountered, it becomes difficult to
perceive the distinction between HI and SI. And what
to say about lensless SI? This is why the paper starts
with a series of comments about the SI jargon,
suggesting at the same time a classification of the
questions of general interest.
Being an established technique, SI can be practised
using turnkey systems or self-made set-ups, offered
on the vast quality equipments and components
market. Deliberately, technical considerations about
� 2008 The Author. Journal compilation � 2008 Blackwell Publishing Ltd j Strain (2008) 44, 57–69 57
sources, lenses, cameras, acquisition and processing
tools, etc., though of primary importance for a sound
and correct operation of the technique, are not
treated in order not to overload the manuscript. Let
us simply mention that the Internet sites of the many
providers are easy to access and well documented.
Glossary and Categorisation
In interferometry, a highly discriminating feature is
the state of smoothness of the interfering waves.
Smooth waves, similar to plane or spherical waves,
arising from optically polished components, possess
nearly constant amplitudes and gently varying pha-
ses over large volumes. Speckle waves, reflected or
transmitted by rough diffusing surfaces, on the con-
trary, exhibit rapid amplitude and phase fluctuations.
There is no way to make a prediction of the evolution
of these waves outside the correlation volume – as
small as 3 · 3 · 100 lm3 for visible wavelengths and
usual apertures (cf. Equation 3). Although formally
the same two-beam interference formula:
IR ¼ I1 þ I2 þ 2ffiffiffiffiffiffiffiffiI1I2
pjcj cos u; (1)
is applicable, the appearance and the general prop-
erties of the resultant intensity, IR, are at considerable
variance, depending on whether the two waves are
smooth or whether at least one is a speckle wave. In
Equation (1), I1 and I2 are the intensities of the two
waves, u their phase difference, and |c| (taken equal
to 1 in the rest of the paper) the normalised module
of the cross-correlation of the two amplitudes. The
arguments of the functions, specifying the observa-
tion point, are omitted for simplicity. Among many
others, let us point out just two substantial differ-
ences:
(i) the resultant intensity has a speckle appearance
and not that of a constituted fringe pattern in a
speckle interference;
(ii) smooth wave interferometry is invariant under
in-plane displacement of plane mirrors placed in
either of the beam paths, whereas, with a
speckle wave, the in-plane displacement of the
diffuser generally creates a new uncorrelated
pattern.
Speckle interference patterns need in any case a kind
of further decoding step in order to become a source
of useful information. Thus, while ‘classical
interferometry’ (CI) is the unanimously accepted
designation for smooth wave interferometry, it could
be natural to term ‘SI’ all types of interferences
involving speckle waves. Hence, recording the holo-
gram of a diffusing object – nothing else than the
recording of an interference pattern between a
smooth ‘reference’ wave and the object speckle
wave – would indeed be an SI process. Holographic
interferometry, making possible the concomitant
reconstruction and the interferometric comparison
of two speckle waves recoded at two different instants
for two distinct states of a diffuser too would be a
genuine SI experiment. Clearly, though logical, the
above definition is against common practice. Holog-
raphy and HI happened before SI [12]. Many treatises
on holography and HI, perhaps wrongly, do not pay
much attention to the speckle phenomenon. An-
other strong reason for not including holography
and HI in the bosom of SI is the distinctive feature
attached to all forms of holography, namely the full
3D reconstruction of the recorded wave – a step ab-
sent in SI. This last point will be useful later to dis-
tinguish DH from SI techniques. In particular, all the
very important discussions in HI about the 3D loci of
fringe localisation and the 3D search for the best
fringe contrast regions [13] have no counterparts in
SI. This does not mean, of course, that the transpo-
sition into SI of results specifically obtained in HI is
forbidden.
At this point, and according to the first descriptions
given in Refs [1, 2], SI can be defined as the set of
techniques aiming at creating, recording and taking
advantage of a two-beam interference pattern involv-
ing at least one speckle wave, with the purpose of di-
rectly exploiting the 2D phase information contained
in the recording. This definition seems operational, as
apparently no known optical arrangements of SI are
excluded, and no intruders hosted. Obviously, the
generic name ‘SI’ will have to be complemented with
appositions in order to account for the many existing
variants of the technique, and for the needs of further
categorisation.
Speckle interferometry can be looked at from no
less than four cardinal points: the statistical, optical,
mechanical and processing points of view, each
reflecting a particular centre of interest (Figure 1).
Statistical aspects
Statistically, Equation (1) gives rise to several inter-
pretations: the resultant intensity, IR, obeys different
groups of statistical behaviour, depending on whe-
ther one smooth and one speckle or two speckle
waves interfere. On the usual assumptions leading to
Gaussian speckle fields [14], the speckle phase itself
is uniformly distributed on a 2p interval. It follows
that the interferometric phase u of Equation (1),
58 � 2008 The Author. Journal compilation � 2008 Blackwell Publishing Ltd j Strain (2008) 44, 57–69
Methods of Speckle Interferometry : P. Jacquot

irrespective of its exact probability density, also takes
values in a 2p interval, and all possible realisations of
IR oscillate around the background 2B with a modu-
lation ±2M, where B and M are given by:
B ¼ I1 þ I2
2; M ¼
ffiffiffiffiffiffiffiffiI1I2
p; IR ¼ 2ðBþM cos uÞ: (2)
The background and modulation, which determine
the maximum, the minimum and the average of all
possible realisations of the signal – just what is nee-
ded for a proper recording – are thus the relevant
random variables (RVs) of SI. Clearly, these RVs obey
four distinct categories of properties, as depicted in
Figure 1A, made of the combination of the two types
of interference – one smooth and one speckle or two
speckle waves – and of the two spatial integration
regimes – with or without spatial integration. Fortu-
nately, the eight probability density functions for
background and modulation associated with the four
categories are known [14–16]. These statistics are not
only of fundamental interest but also of very practical
significance, because they lead to record in the best
possible conditions the interferometric signal, by
choosing the intensities of the fields and the lens
apertures, which, given the characteristics of the
photo-detector, will optimise the modulation. Sec-
ond-order statistics are also of great interest, because
they give, through the autocorrelation functions, the
average spatial variation rate of the RVs. Here, the
result can be related to the case of a single speckle
field, as the coherent addition with a constant field
simply adds a bias to the autocorrelation, and the
coherent addition with an uncorrelated speckle field
of the same strength follows the same constitutive
mechanism as that of a single speckle. The autocor-
relations of the complex amplitude and intensity of a
single speckle field are narrow-peaked functions,
nearly vanishing outside a small volume element –
the correlation volume – of transversal and longitu-
dinal dimensions, ÆStæ and ÆSlæ given by:
hSti ¼kd
a; hSli ¼
8kd2
a2(3)
where k is the wavelength, and d/a is related to the
maximal aperture of the marginal rays creating the
speckle, d being either the distance lens – or diffuser –
observation plane, and a the lens aperture or the
diffuser transversal dimension. The first case corre-
sponds to the usual speckle formation in SI by
means of a lens imaging the diffuser onto the photo-
Statistical SI: background & modulation RVs
1 smooth & 1 speckle waves
Spatially integratedSpatially resolved Spatially integratedSpatially resolved
2 speckle waves
Same incidence Different incidenceDifferent direction
no image shift Same direction
image shift
In-line reference & single illumination-observation
2 illumination beams 2 observation beams
Optical SI
In-plane Out-of-plane ContouringSlopes/derivatives
Mechanical SI
Phase-shifting …Signal dependent transforms
Processing: static or dynamic regimes
Definite transformsMorphology
(A)
(B)
(C)
(D)
Figure 1: Possible categorisation of SI, according to the underlying principles of the method: the statistical (A), optical (B),
mechanical (C) and processing (D) viewpoints
� 2008 The Author. Journal compilation � 2008 Blackwell Publishing Ltd j Strain (2008) 44, 57–69 59
P. Jacquot : Methods of Speckle Interferometry
detector, called subjective speckle. Incidentally, the
influence of the lens aperture on the dimension of
the correlation volume can be noticed in Figure 3,
drawn for another purpose. The second case, the so-
called objective speckle, rather unusual in SI, corre-
sponds to a lensless speckle formation, from diffrac-
tion of the diffuser. As far as the statistical aspects of
SI are concerned, ‘subjective’ and ‘objective’ do not
represent a really meaningful labelling. The correla-
tion dimensions, Equation (3), are as a rule likened to
the dimensions of the ‘average’ speckle grain. Even in
these small volumes, the speckle complex amplitude
is not constant, but worse, outside, it is not possible
to predict the value of the complex amplitude, except
that it follows a circular Gaussian distribution –
a fundamental and major difficulty of all interfero-
metric methods involving speckle waves.
The question of the spatial integration regimes may
have two answers. Initially, SI recordings were made
mostly with very high resolution emulsions, the same
as in HI, and the aerial speckle fields could be con-
sidered as spatially resolved. However, soon, video
cameras, and later charge-coupled device and Com-
plementary Metal Oxide Semiconductor (CMOS),
became a standard, moving SI techniques towards the
low spatial resolution domain. Evident convenience
reasons led to this choice, and now, photo-electric
recording is an intrinsic part of SI. Consequently,
most of the recordings are now performed in a weak
integration regime: there are among one to 10 inde-
pendent cells within a 6 · 8 lm2 pixel, at 514 nm, for
the usual f-number apertures between 5.6 and 22 [11,
15]. The strictly resolved regime is almost impossible
to realise, requiring apertures as small as one-hun-
dredth of the focal length. On the contrary, regimes of
strong integration, exceeding 100 cells may well exist
at larger aperture, for f-numbers smaller than 1.5. It
should be recognised that spatial integration changes
neither the generic interference formula (Equation 1),
nor the existence of singularities. The integrated re-
gime, involving, say, m independent cells, obeys for-
mally the same equation as the perfectly resolved
case, on conditions of replacing the background B by
the integrated background, B+, sum of the m constit-
uent backgrounds, and to define an integrated com-
plex modulation, MC – sum in the complex plane of
the m independent cell modulations, whose modulus
M+ and phase u are the resultant modulation and
phase of the rewritten interferometric formula
respectively. An important general result is further-
more readily obtained: M+ drops to 1/�m with a sat-
urating detector, but grows to �m without saturation.
From the random walk followed by the integrated
modulation, it can be seen that singularities exist in
integrated regimes too. In the resolved case, singu-
larities are points of zero speckle intensity, where the
phase is not defined [17, 18], thereby preventing
interferometric measurements in those points. When
the modulus of the integrated modulation is zero, the
phase information is also lost. Singular pixels are
those whose grey levels remain unchanged by phase
shifting. Of note, singular pixels are discarded at the
processing stage by linear sine/cosine phase filters
using kernels proportional to the square of the pixel
modulation – filters known to lead to the maximum-
likelihood phase estimation [15, 19]. The best and
more complete information that can be obtained in SI
is the knowledge of the statistical properties of the
background and modulation RVs in the four principal
cases listed in Figure 1A. The corresponding known
probability density functions allow choosing the
mean intensities of the interfering waves and the
aperture number optimally, so that the recordings are
at their best.
Optical aspects
Within the definition given above, there are many
ways to create SI arrangements. The optical view-
point involves the examination of the different
means to divide and recombine two waves, with at
least one being a speckle wave (Figure 1B). Three
main possibilities emerge (Figure 2):
(1) The output of the laser can be divided in order
to form, on the one hand, a single illumination-
observation of the object surface and, on the other
hand, a reference beam, recombined in-line with the
observation wave in front of the detector (Figure 2A).
This recombination is said to be in-line because the
angle between the object and the reference waves
should be kept small enough so that the resulting
fringe pattern has a carrier frequency that can be
resolved by the photo-detector. The phase of the
object speckle wave is changed according to the ob-
ject deformation (see the next section). The reference
wave can be a smooth wave, an arbitrary speckle
wave or even a speckle wave arising from a macro-
scopically identical object for direct comparison
purposes; the reference wave can be modified or not
in the final state, leading to adaptive or comparative
versions of the method; when the object stays at rest,
small changes in the wavelength, the illumination
angle, the refractive index of the medium surround-
ing the object, all small enough for not destroying
the correlation conditions, give rise to interference
phase changes related to the shape of the object;
the in-line arrangement is quite close to the DH
arrangement; however, in SI, no attempt is made to
60 � 2008 The Author. Journal compilation � 2008 Blackwell Publishing Ltd j Strain (2008) 44, 57–69
Methods of Speckle Interferometry : P. Jacquot

reconstruct, either in a numerical or analogous way,
the object wave in the 3D space; only the phase of the
recorded pattern in the detector plane is of concern;
this important difference suffices to distinguish the SI
and DH techniques unambiguously.
(2) The division of the laser beam may serve to
create two illumination beams, each producing
its own speckle field, and a single observation
(Figure 2B). Here, both speckles are affected by the
object deformation, so that the net phase increment
for the new interference pattern, depicting the new
state of deformation, is the difference between the
two speckle phase changes. The conditions of object
at rest and same modifications as before will result
again in interference phase changes related to the
object shape; particular cases of double illuminations
include a small angular separation between the two
beams, giving rise to the well-known sets of con-
touring methods by coherent fringe projection [20];
another interesting double illumination scheme is
made of two parallel unexpanded beams interrogat-
ing two neighbouring regions of the object [21].
The separation and recombination can be
performed only on the side of the observation
(Figure 2C). It is still possible here to distinguish
observation beams of different directions from
beams only transversally shifted one with respect to
the other; this latter case represents the set of well-
known shearing arrangements [22]. As a result of the
diffusing properties of rough surfaces, it is seen that
there are much more possible arrangements in SI
than in CI or grating interferometry (GI). The simple
two-beam cases presented in Figure 2 can be easily
extended to more complicated geometries, involving
more than one reference or more than two illumi-
nation or observation beams, taken two by two, for
the general purpose of information multiplexing.
The diagrams presented in Figure 2 – in which the
boxes ‘beam division & recombination’ can be any
realisations of the well known types of classical
interferometry, either by ‘amplitude’ (Michelson,
Mach-Zehnder, Fizeau, Jamin, etc.) or by ‘wave-
front’ division (Young, Fresnel bi-mirror or bi-prism,
Meslin bi-lens, Smartt, etc.) – are thus nothing else
Small aperture Large aperture
Hologram
Reference
Object Imaging lens
Speckles
Compensation of Ω
(A) (B) (C)
Figure 3: Fulfilling the correlation conditions in real-time HI: appropriate displacement steps of the reference beam and the
hologram aim at the best superimposition of the speckle grains corresponding to the two deformation states. The subsequent
increase of the lens aperture leads to the formation of smaller speckles
Photodetectorarray
Beam division & shaping
In-line beam recombination
Laser
Single object- illumination
Single object- observation
Reference arm
Laser Single object- observation
Laser Single object- illumination
1st object- observation
1st object- illumination
2nd object-illumination
2nd object-observation
(A)
(B)
(C)
Figure 2: Diagram of the three categories of optical set-ups in SI: (A) in-line reference beam and single illumination-observation;
(B) two illuminations beams; (C) two observation beams
� 2008 The Author. Journal compilation � 2008 Blackwell Publishing Ltd j Strain (2008) 44, 57–69 61
P. Jacquot : Methods of Speckle Interferometry

but the building blocks of innumerable set-up
architectures.
Mechanical aspects
Speckle interferometry has been mainly developed
for the purposes of experimental mechanics and an
important part of this paper is devoted to the
mechanical aspects of SI. As is well known, Equation
(1) serves to code a reference state, and deterministic
information is only obtained from correlated evolu-
tions of this initial interference pattern. How does a
speckle field respond to a small perturbation of the
factors which led to its creation? A small perturbation
may be a minute wavelength or refractive index
change, a micro-displacement or deformation of the
object surface, a slight modification of the illumina-
tion or observation geometry. The most thorough
treatment of this question has been given in the
framework of HI [4, 5, 13, 23]. Qualitatively, the
answer is that the speckle field first responds locally,
in a region surrounding the position vector, r, by a
3D displacement, X, without significant structural
change, i.e. in maintaining the same complex
amplitudes Af and Ai, before and after the application
of the perturbation:
Af ðrþXÞ ¼ AiðrÞ: (4)
This result can be readily derived from the com-
parison of the expressions of the diffraction integral,
as e.g. the Rayleigh–Sommerfeld integral, related to
the two states of object deformation. Another
straightforward approach is to rely on the stationarity
of the optical path difference between the two states
which must be zero far all rays in the neighbourhood
of the point of the surface under examination.
Unfortunately, this quite simple result is heavily
impaired by a series of weaknesses: there is no general
relationship between X and the parameters of the
perturbation, and, when this relationship is known
in particular cases (as, e.g. wavelength change alone,
or micro-deformation of the object surface limited in
its description to the three displacement components
and the six in-surface derivatives), it is far too much
complicated to give rise to effective measurement
capabilities. Moreover, the limits of validity of
Equation (4), indicating the failure of the structural
invariance when the amplitude of the perturbation is
too large, are not clarified in any theory. This point
remains essentially a matter of experimental concern.
However, these drawbacks are detrimental only in
defocused speckle photography, where the measured
quantity is precisely X. In focused speckle photogra-
phy, and for a perturbation involving a micro-
deformation of the object surface, the situation im-
proves already: X reduces to the 3D displacement
vector of the surface points and the speckle grains
move as if attached to the surface. In SI and HI an
opposite situation must prevail: X must not be re-
solved, meaning that the correlation volume, Equa-
tion (3), must be bigger than the modulus of X:
hSti > jXjt; hSli > jXjl: (5)
Although these conditions must be fulfilled both in
HI and SI, they lead to quite distinct modus operandi.
In HI, and possibly in DH too, as briefly evoked at the
beginning of the section, the procedure is to search in
the 3D space for fringe localisation, i.e. for regions
where the condition is fulfilled, and when X is neg-
ligibly small compared with the correlation volume,
a so-called complete localisation is reached [13]. In SI,
both in the cases of one or two speckle waves, the
condition must be a priori satisfied in the recording
plane. The very efficient approach followed in real-
time HI, which optimises the fulfilment of Equation
(5), sketched in Figure 3, is unfortunately difficult to
transpose in SI. In SI, the dimensions of the correla-
tion volume are fixed at the initial state, by choosing
an appropriate aperture for the observation system,
and the experiment should be restarted for testing
another aperture. It should be realised that a perfect
correlation between the two compared states is
always elusive, because Equation (4) is basically an
approximation, and because the perfect overlapping
of the two states (X ¼ 0), both in the pupil plane and
in the observation plane cannot be granted, with the
effect of modifying the final complex amplitude.
Some additional comments are given in the section
‘Decorrelations’. However, when the experiment
shows that the initial and final states are well enough
correlated and the superposition condition, Equation
(5), fulfilled, the so-called correlation fringes can be
obtained, generally by taking the absolute value of
the difference of the two realisations IRf and IRi of
Equation (1) leaving a distribution I):
I� ¼ jIRf � IRij ¼ 4M sin uþ Du2
� ��������� sin
Du2
�������� (6)
where, besides fluctuating quantities, the deter-
ministic term Du represents the net phase change
between the two arms of the interferometer related
to the perturbation applied to the interferometric
arrangement. Equation (6) depicts the fringe
pattern sought. For a single speckle field and in the
case of micro-deformation, the general expression
for the phase change is proportional to the pro-
jection of the displacement vector L, describing the
62 � 2008 The Author. Journal compilation � 2008 Blackwell Publishing Ltd j Strain (2008) 44, 57–69
Methods of Speckle Interferometry : P. Jacquot

deformation, onto the sensitivity vector S, differ-
ence between the observation and illumination
unit vectors Ko and Ke, oriented along the bisector
of the two directions:
Du ¼ 2pkðKo�KeÞ � L ¼
2pk
S � L: (7)
We see in the next section how Du can be
computed. According to Equation (7), there is an
infinite number of ways for producing phase
changes corresponding to a given object deforma-
tion. This can be simply achieved by changing the
geometry of the arrangement. In experimental
mechanics, the classical set-ups are the double
symmetrical illumination, providing in-plane sen-
sitivity in the direction of the plane of incidence;
the in-line reference arrangement, with normal or
symmetrical illumination and observation beams,
giving an out-of-plane sensitivity; a shearing device
placed in front of the observation lens creates two
superimposed shifted images of the object surface
and is sensitive to the six in-surface derivatives of
the three displacement components, reducing to
the slope in the shearing direction when the illu-
mination and observation beams are orthogonal to
the object surface. When the object stays at rest,
the contouring of its surface can be obtained either
by an in-line arrangement or by the symmetrical
beam illumination, by changing the wavelength,
the refractive index or the incidence of the illumi-
nation beam(s). These different possibilities are
summarised in Figure 1C. From its definition,
Equation (7), it is clear that the sensitivity vector is
generally not constant over the object surface. Only
parallel beam illumination and telecentric observa-
tion can guarantee the constancy of the sensitivity
vector, which is only possible for small objects. For
spherical illumination wave and observation system
ruled by central projection, the sensitivity is never
purely associated with a single component over the
whole surface. When small compared with the
main component of the deformation, the unwanted
components can however often be neglected by
selecting a sensitivity vector as orthogonal as pos-
sible to these components. Nonetheless, the actual
trends in experimental mechanics are to create
more and more precise analytical or numerical
models. This is a strong incentive to try to solve
the general three-component (3C)–3D problem, i.e.
to determine the three components of the
displacement for 3D, arbitrarily shaped objects.
Several sensitivity vectors are needed – at least
three and more when the absolute fringe order
cannot be assessed [24].
Two categories of solutions exist, endowed with
their own advantages and drawbacks:
1 an arrangement with multiple illuminations only
[25];
2 an arrangement with multiple illumination and
in-line reference [26].
Both categories lend themselves to shape mea-
surement of the object and sensitivity vector
determination. The multiple illumination scheme,
with a single observation and without the burden
of an in-line reference is simple to realise and
adjust, especially by means of optical fibres. By
switching on two by two the illumination beams,
sensitivity vectors equal to the difference of the two
unit vectors of the concerned illuminations are
created. The resultant linear system from Equation
(7) is inverted to recover the three displacement
components. The scheme including an in-line ref-
erence is a bit more complicated, but smooth ref-
erence wave interferometers generally give less
noisy interferometric signals and make a better use
of the available laser power. Here again, the nec-
essary equations are obtained by switching on one
by one the different illumination beams, while
always keeping the same reference. Both schemes
have their own predominant sensitivities and care
should be exercised to produce well-conditioned
systems [27]. It is also possible to create synthetic
sensitivity vectors by computing linear combina-
tions of Equation (7). Multiplexing of the record-
ings is a serious problem. In the hypothesis of a
phase computation by a three-image phase-shifting
algorithm, the acquisition of at least 24 interfero-
grams is needed to solve the 3C-3D problem. This
number grows to 50 for a five-image algorithm and
a fourth redundant equation. Furthermore, not
only specific to SI, but also mandatory, are the
geometrical and radiometric calibrations of the
observation system. The mapping between the pixel
coordinates and the 3D surface coordinates must be
known. As a start, the simplest procedure, based on
the pinhole camera model requires the determina-
tion of no less than nine parameters. The linearity
and the uniformity of the photo-electric response
of each pixel must be verified and corrected if
necessary. The solution of the 3C–3D problem is
not at all simple. There are very few examples of a
complete and careful application of the above
procedures [25, 26]. A sound analysis of what
should be measured should thus accompany the
design of any SI experiment.
� 2008 The Author. Journal compilation � 2008 Blackwell Publishing Ltd j Strain (2008) 44, 57–69 63
P. Jacquot : Methods of Speckle Interferometry
Processing aspects
A last possible categorisation of SI techniques is
linked to the principal processing routines (Fig-
ure 1D). This is perhaps the domain still most open
to new ideas; the successive proceedings of the
‘Fringe’ Conferences series give the principal mile-
stones [28]. Here, the main distinction appears to be
between the static and dynamic regimes of defor-
mation. Exposure types – continuous, time average,
pulsed, stroboscopic – also play a discriminating role.
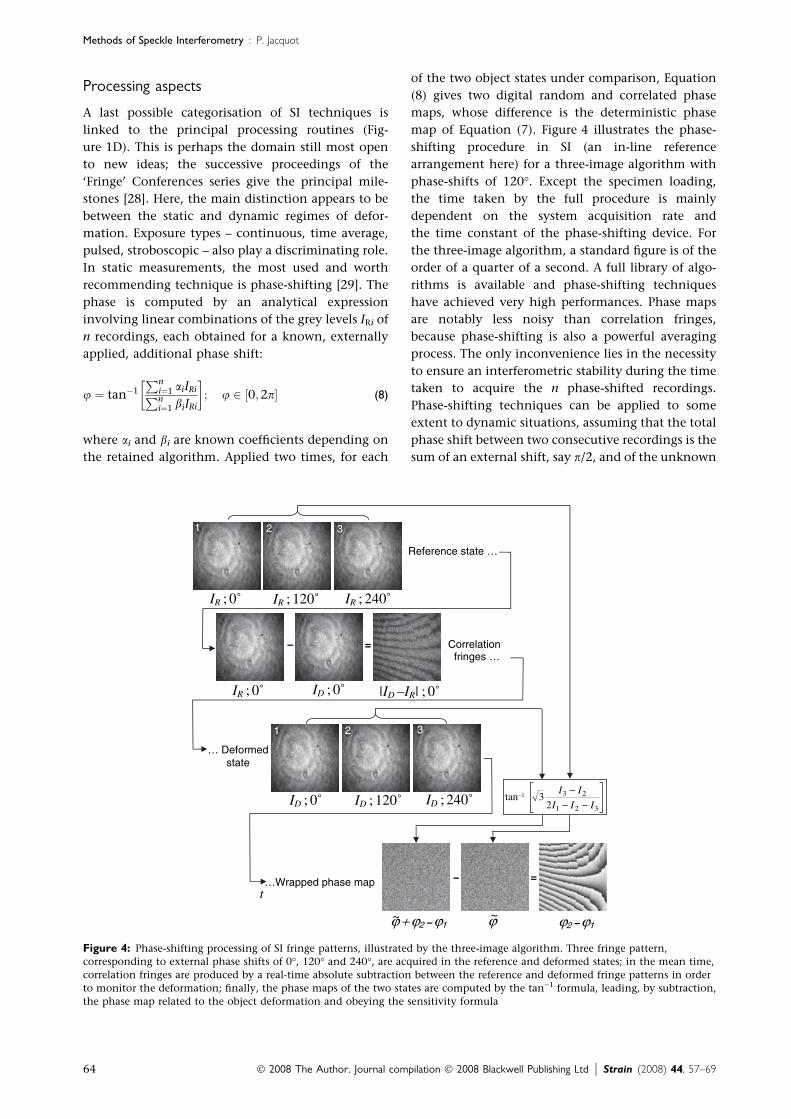
In static measurements, the most used and worth
recommending technique is phase-shifting [29]. The
phase is computed by an analytical expression
involving linear combinations of the grey levels IRi of
n recordings, each obtained for a known, externally
applied, additional phase shift:
u ¼ tan�1
Pni¼1 aiIRiPni¼1 biIRi
� �; u 2 ½0;2p� (8)
where ai and bi are known coefficients depending on
the retained algorithm. Applied two times, for each
of the two object states under comparison, Equation
(8) gives two digital random and correlated phase
maps, whose difference is the deterministic phase
map of Equation (7). Figure 4 illustrates the phase-
shifting procedure in SI (an in-line reference
arrangement here) for a three-image algorithm with
phase-shifts of 120�. Except the specimen loading,
the time taken by the full procedure is mainly
dependent on the system acquisition rate and
the time constant of the phase-shifting device. For
the three-image algorithm, a standard figure is of the
order of a quarter of a second. A full library of algo-
rithms is available and phase-shifting techniques
have achieved very high performances. Phase maps
are notably less noisy than correlation fringes,
because phase-shifting is also a powerful averaging
process. The only inconvenience lies in the necessity
to ensure an interferometric stability during the time
taken to acquire the n phase-shifted recordings.
Phase-shifting techniques can be applied to some
extent to dynamic situations, assuming that the total
phase shift between two consecutive recordings is the
sum of an external shift, say p/2, and of the unknown
Reference state …
Correlation fringes …
… Deformedstate
…Wrapped phase map
1 2 3
–
1 2 3
=−
ϕ + ϕ2 −ϕ1 ϕ2 −ϕ1~ ϕ~
−−−
321
23
23tan−1
III
II
t
=
IR ; 0˚
IR ; 0˚ IR ; 120˚ IR ; 240˚
ID ; 0˚
ID ; 0˚ ID ; 120˚ ID ; 240˚
|ID –IR| ; 0˚
Figure 4: Phase-shifting processing of SI fringe patterns, illustrated by the three-image algorithm. Three fringe pattern,
corresponding to external phase shifts of 0�, 120� and 240�, are acquired in the reference and deformed states; in the mean time,
correlation fringes are produced by a real-time absolute subtraction between the reference and deformed fringe patterns in order
to monitor the deformation; finally, the phase maps of the two states are computed by the tan)1 formula, leading, by subtraction,
the phase map related to the object deformation and obeying the sensitivity formula
64 � 2008 The Author. Journal compilation � 2008 Blackwell Publishing Ltd j Strain (2008) 44, 57–69
Methods of Speckle Interferometry : P. Jacquot
object phase increment itself, considered as constant
over the four to five frames needed, and proportional
to the slope of the object phase at this moment [30].
Four- or five-image algorithms account for the addi-
tional unknown. Dynamic phase-shifting is limited
to situations where the ratio (frame rate/phase
change rate) is high. For broader dynamic situations,
several standard solutions exist, based either on the
spatial processing of 2D interferograms acquired in a
single frame mode, or on the temporal processing of
the 1D pixel signals of sequence of frames. In both
cases, the introduction of an external carrier fre-
quency, spatial or temporal, is advantageous for
removing the sign ambiguity and for a more accurate
phase extraction. The best known and widely used
methods rely either on definite transforms, as
Fourier, Morlet wavelet, modified 2D Hilbert trans-
forms [31–33], or on correlation techniques [34, 35].
A new trend is to reshape the interferometric signal
into a sinusoidal form amenable to more standard
processing, using signal-dependent transformation
[36]. Vibration analysis is an important sub-domain
of dynamic regimes and has received as much
attention in SI as in HI [37]. Procedures are available
to obtain simultaneously the amplitude and phase of
the mechanical vibrations. It should be acknowl-
edged that DH completely escapes the dynamic
regime difficulty, because amplitude and phase of
the object are numerically reconstructed from the
recording of a single interferogram. [0–2p] or wrap-
ped phase maps are efficiently filtered by linear filters
applied to the sine and cosine of the phase images.
The last step of the processing, phase unwrapping,
not specific to SI, formed the subject of many studies;
many operational algorithms are available, just open
to improvements [38]. From the processing point of
view, and contemplating the high quality reached
by the phase maps, SI now enjoys a good status –
certainly equivalent to the other whole-field
methods – and much better than in the past, when
(E) (F)
(I) (J)
(G) (H)
(A) (B) (C) (D)
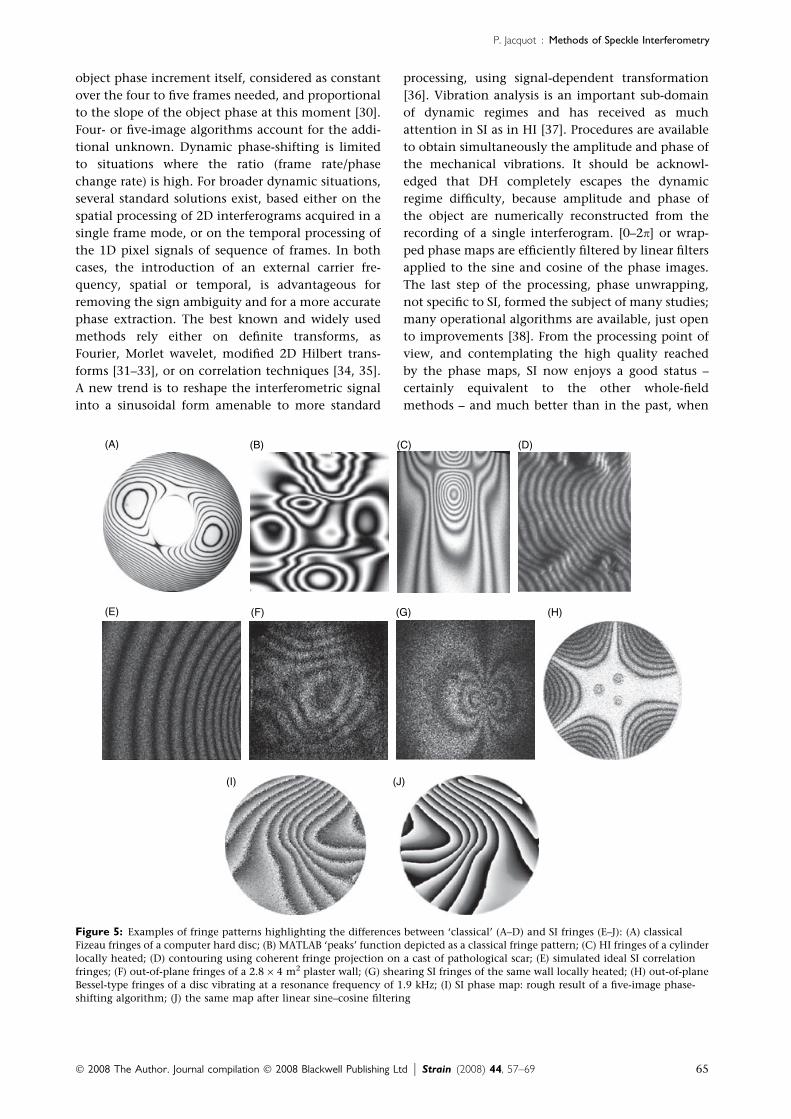
Figure 5: Examples of fringe patterns highlighting the differences between ‘classical’ (A–D) and SI fringes (E–J): (A) classical
Fizeau fringes of a computer hard disc; (B) MATLAB ‘peaks’ function depicted as a classical fringe pattern; (C) HI fringes of a cylinder
locally heated; (D) contouring using coherent fringe projection on a cast of pathological scar; (E) simulated ideal SI correlation
fringes; (F) out-of-plane fringes of a 2.8 · 4 m2 plaster wall; (G) shearing SI fringes of the same wall locally heated; (H) out-of-plane
Bessel-type fringes of a disc vibrating at a resonance frequency of 1.9 kHz; (I) SI phase map: rough result of a five-image phase-
shifting algorithm; (J) the same map after linear sine–cosine filtering
� 2008 The Author. Journal compilation � 2008 Blackwell Publishing Ltd j Strain (2008) 44, 57–69 65
P. Jacquot : Methods of Speckle Interferometry

the then heavily speckled aspects of the interfero-
grams raised doubts about the value of the recorded
information. This assessment is backed up by Fig-
ure 5, which shows a series of interferograms ob-
tained in classical or holographic interferometry, of
high quality, whereas SI correlation fringes exhibit
their characteristic grainy aspects. Even so, the final
quantitative SI result represented by the phase maps,
obtained by the processing procedures mentioned
above, is fully satisfactory.
Decorrelations
The two compared interferograms associated with the
reference and deformed states of the specimen differ
more than only by the deterministic phase factor of
Equation (7). Because of the object displacement field,
speckle grains do not superimpose exactly in the im-
age plane. They are not even exactly the same, in
particular because the speckle wavefront is displaced
and deformed in the plane of the pupil. The actual
final phase maps are thus fundamentally the result of
a much more intricate series of phenomena than
those described above. While in principle completely
deterministic, these phenomena cannot be tackled by
analytical relationships. The reason is that, because of
the form of the diffraction integrals, the derivations
would necessitate a perfect knowledge of the surface
micro-roughness and its evolution. The only practical
approach – still quite involved itself – is statistical
[15, 16, 19, 39]. A brief summary of the findings
presented in the later reference is given below.
Eight separate cases should be treated, made of the
two decorrelation sources – pupil and image plane, the
two types of interference – two speckles or one speckle
and one smooth wave, and the two spatial integration
regimes – resolved or not resolved. Let us define the
phase error as the difference between the phase of
Equation (7) and the actual phase involving the dec-
orrelation effects. The probability density function of
the phase error is formally the same for seven cases.
The only exception is for the case, pupil plane decor-
relation, two speckles, unresolved speckles, which is
without analytical expression. However, the behav-
iour of the standard deviation of the phase error in this
case can be estimated as �2 times greater than the
other cases. The probability densities are not repeated
here, because they are not easily interpretable. On the
other hand, Figure 6 reproduces the evolution of the
standard deviation of the phase error, ru, as a function
of the decorrelation parameter D, ratio of the common
to the total area between the displaced patterns,
varying between 0 and 1. The rule for the composition
of the pupil and image decorrelations reads:
1� Dt ¼ ð1� DpÞð1� DiÞ (9)
with Dt the total decorrelation parameter and the
subscripts ‘p’ and ‘i’ designating the pupil and image
plane decorrelation parameters respectively. The
diagram confirms the primary role played by the
modulation M, cf. Equations (2) and (6), a strong
modulation meaning much smaller errors. The stan-
dard deviation of the phase error is rapidly quite
high, 0.1 of the decorrelation parameter producing
already a ru of 0.38 rad at the mean modulation.
While phase-shifting in itself is usually easily accu-
rate to 0.06 rad, the phase error in SI is rather five
times less accurate or even worse. It can also be seen
that near the total decorrelation, the standard devi-
ation, as expected, tends towards p/�3, the standard
deviation of a uniform distribution over [)p, p].
Pupil and image plane decorrelations should be
avoided as much as possible. Image plane decorrela-
tions can be efficiently combated by physical or
numerical re-superimposition of the speckle fields.
A general measure for decreasing pupil plane decor-
relation effects is to work with large apertures. In
both cases, fractioning the total deformation into n
loading steps of magnitude 1/n, as well as preventing
rigid-body motions of the specimen, is also quite
rewarding. Linear sine–cosine phase map filtering
using kernel proportional to the square of the mod-
ulation is an additional effective improvement.
Strengths
As an interferometric method, the sensitivity of SI is
basically of 2p per k optical path change. Taking in
account the existing fringe interpolation techniques,
the displacement measurement range and the dis-
placement resolution are thus of the order of 10 nm to
10 lm and 10 nm per loading step respectively. These
characteristics are extraordinarily well adapted to the
0.2 0.4 0.6 0.8 1 0 0
0.25
0.5
0.75
1
1.25
1.5
1.75
2
3
4 5
1
Δ
σ ϕ
1. <M>M 25 . 0 = 2. <M>M 5 . 0 = 3. <M>M = 4. <M>M 2 = 5. <M>M 4 =
Figure 6: Standard deviation ru of the phase error associated
to pupil and image plane decorrelation effects as a function
of the normalised decorrelation parameter D, for different
values of the modulation M [39]
66 � 2008 The Author. Journal compilation � 2008 Blackwell Publishing Ltd j Strain (2008) 44, 57–69
Methods of Speckle Interferometry : P. Jacquot
general requirements of experimental mechanics, a
great number of mechanical phenomena occurring at
this scale. As an imaging technique based on photo-
electric arrays, millions of points can be interrogated
simultaneously, each pixel acting a priori as an inde-
pendent detector. In a sound designed experiment,
the lens aperture and magnification, the pixel
dimension and the wavelength are such that the pixel
has just the transversal dimension of the correlation
volume (Equation 3). Consequently, the effective
spatial resolution, before linear filtering, is the spatial
resolution of the recording medium. The overall per-
formances of SI in spatial, temporal and measurement
resolutions are thus exceptionally high, only chal-
lenged by classical HI. But classical HI suffers a strong
recession stage simply because high spatial resolution
media have progressively ceased to be commercially
available. Tied to the intrinsic properties of SI, the
photo-electric technology introduces many advanta-
ges: real-time visualisation, high radiometric sensi-
tivity, simplicity, robustness, no consumables and low
cost. Its connection with computer and digital image
processing is considerably developed and the future in
these domains can only be still brighter. With its
innumerable arrangements and not requiring specific
surface preparations, SI counts an impressive set of
variants, showing extreme flexibility and the possi-
bility to choose multiple displacement sensitivities,
both in the nature and the magnitude of the compo-
nents. None of the other whole-field interferometric
techniques – Cl, GI, HI, DH – exhibit such a high de-
gree of adaptability to many experimental situations.
Weaknesses
Even if very high spatial resolution recording media
are avoided, SI is nonetheless an interferometric
technique and, except for the object deformation, no
perturbation likely to change the optical path lengths
between the two arms of the interferometer by more
than a fraction of the wavelength during the exposure
time should intervene. This is an obvious require-
ment when the aim is to measure displacements with
a resolution in the nanometric range. A more serious
and fundamental problem lies in the fulfilment of the
correlation conditions. As indicated previously,
the problem is theoretically hard, not fully treated.
The solution still rests mainly on tedious experi-
mental trial and error procedures. The compensation
of speckle displacements in the pupil and in the im-
age plane is not easy in SI as in HI. The absence of
high spatial resolution medium forces us to use lens
apertures moderately open and explains the residual
grainy aspects of the interferograms. If ru denotes the
standard deviation of the phase error currently found
in the usual practice of CI, GI, HI, DH and SI, the
following ranking can be established [15, 40]:
ruðCIÞ � 0:1� < ruðGIÞ � 0:4� < ruðHIÞ � 1�
< ruðDHÞ � ruðISÞ � 10�(10)
A series of measures, briefly evoked above, aiming at
a better fulfilment of the correlation conditions and at
reducing the effects of the perturbations have been
proposed and proved effective [11, 15, 41]. Yet, these
measures, sometimes difficult to implement, are still
to be improved. As a final weak point, powerful con-
tinuous wave (CW) or pulsed laser sources for large
objects in difficult environments are, for the time
being, expensive.
Opportunities
The list of mechanical applications of SI is impressively
long [6, 42]. A full paper would not suffice to present,
even shortly, the most significant of them. The future
is essentially dependent on the needs and expecta-
tions of experimental mechanics. Now, there are
many signs that the demand is strongly up. All major
branches of experimental mechanics – material prop-
erties, structural analysis, non-destructive testing – are
facing challenges of unprecedented complexity. As
exemplified by civil or aeronautical engineering, the
trends are towards ever more streamlined construc-
tions, having to bear record loadings, while under
increasingly severe environmental constraints and
security levels. Modelling tasks need to be more and
more accurate and computer simulations must be
checked carefully. SI can certainly take advantage of
this favourable orientation of experimental mechan-
ics. Structural and material property identification,
modelling assessment, residual stress, rheology, dam-
age and ageing are in particular the sub-fields where SI
looks likely to become a standard tool. The next
chance of SI is in its very constitution: it is naturally
boosted by the continuous progress of electronic
imaging and digital image acquisition and process-
ing. SI remains open to significant improvements, in
particular in the sense of becoming a genuine adaptive
method, efficient against external perturbations,
thanks to the rapid development of phase modula-
tors. Continuous progresses in speed, independence
from the operator, reliability, made on the side of
the processing of the acquired patterns are very
encouraging. Even if it appears as a brute-force
� 2008 The Author. Journal compilation � 2008 Blackwell Publishing Ltd j Strain (2008) 44, 57–69 67
P. Jacquot : Methods of Speckle Interferometry

solution, the strong increase of the volume of recorded
data allowed by present-day computers, when
supplemented by clever data reduction methods,
considerably extends the applicability of SI. As simple
yet pertinent numerical models for the mathematical
generation of speckle fields are available [43], the same
computing power may be used to simulate SI experi-
ments, for testing or benchmarking processing
programmes or checking the efficiency of particular
configurations, thereby contributing to the success of
the method. Finally, by shifting to low coherence
sources, SI has the prospect to become a whole-field
optical coherence tomography (OCT) method, allow-
ing the exploration of an important and completely
new field: performing deformation measurements in
the bulk of 3D diffusing media [44, 45].
Threats
As an established method, SI does not appear to be
spoilt by appalling shortcomings. Perhaps the great-
est peril for SI (but not for photomechanics!) would
be the appearance of a new very efficient high spatial
resolution photosensitive material, liable to be easily
processed in situ, something similar to the photore-
fractive crystals, but with much better radiometric
sensitivity and more manageable erasure. In this case,
HI techniques would probably recover a prominent
place. Another possible obstacle would be that the
photomechanics community massively prefers the
rival image correlation techniques, under the ques-
tionable pretexts of simplicity. This would be a wor-
rying choice. In fact, without denying the qualities of
image correlation techniques, it is probably wrong to
bring the two types of methods into conflict. Real-
time operation, spatial, temporal and measurement
resolutions on the side of SI, simplicity and apparent
robustness for image correlation are some of the
features which clearly separate the two types of
method. The last danger lies in the near non-exis-
tence of a structured and coordinated teaching of SI:
unfortunately, very few engineering curricula inte-
grate it into their programmes.
Conclusion
It is hoped that these few thoughts about SI will
reinforce the practitioners’ faith in the soundness of
their choice and encourage newcomers to acquire the
scientific background and the optical equipment
needed for sound and successful operations of the
method.
ACKNOWLEDGEMENTS
This study was mainly supported by Swiss National
Science Foundation grants.
REFERENCES
1. Leendertz, J. A. (1970) Interferometric displacement
measurement on scattering surfaces utilizing speckle
effect. J. Phys. E: Sci. Instrum. 3, 214–218.
2. Butters, J. N. and Leendertz, J. A. (1971) Speckle pattern
and holographic techniques in engineering metrology.
Opt. Laser Technol., 3, 26–30.
3. Dainty, J. C. (Ed.) (1975) Laser Speckle and Related
Phenomena. Springer Verlag, Berlin.
4. Jones, R. and Wykes, C. (1989) Holographic and Speckle
Interferometry. Cambridge University Press, Cambridge.
5. Dandliker, R. and Jacquot, P. (1992) Holographic Interfer-
ometry and Speckle Techniques. Optical Sensors. VCH
Verlagsgesellschaft, Weinheim, 589–628.
6. Meinlschmidt, P., Hinsch, K. D. and Sirohi, R. S. (Eds)
(1996) Selected Papers on Electronic Speckle Pattern Interfer-
ometry: Principles and Practice. SPIE Milestone Series, SPIE
Optical Engineering Press, Bellingham, WA, Vol. MS 132.
7. Jacquot, P., and Fournier, J.-M. (Eds) (2000) Interfero-
metry in Speckle Light: Theory and Applications. Springer,
Berlin.
8. Slangen, P., and Cerruti, C. (Eds) (2006) Speckle06. Proc. of
SPIE, Nımes, France, Vol. 6341.
9. Stetson, K. A. (2001) Roads not Taken in Holographic Inter-
ferometry. Fringe 2001. Elsevier, Paris, 581–586.
10. Trolinger, J., Markov, V. and Khizhnyak, A., (2005)
Applications, challenges, and approaches for electronic,
digital holography. Proc. of SPIE 6252, 625218-1-11.
11. Jacquot, P. (2005) Speckle interferometry: refining the
methods for taming disorder. Proc. of SPIE 6252, 62521S-1-
12.
12. Stetson, K. A. and Powell, R. L. (1965) Interferometric
hologram evaluation and real-time vibration analysis of
diffuse objects. J. Opt. Soc. Am., 54, 1964–1965.
13. Schumann, W. and Dubas, M. (1979) Holographic Interfer-
ometry. Springer Verlag, Berlin.
14. Goodman, J.W. (1975) Statistical Properties of Laser Speckle
Patterns. Laser Speckle and Related Phenomena. Springer
Verlag, Berlin, 9–75.
15. Lehmann, M. (1998) Statistical Theory of Two-wave Speckle
Interferometry and its Application to the Optimization of
Deformation Measurements. EPFL thesis, Swiss Federal
Insitute of Technology, Lausanne, no. 1797.
16. Lehmann, M. (1996) Phase-shifting speckle interferome-
try with unresolved speckle: a theoretical investigation.
Opt. Comm. 128, 325–340.
17. Baranova, N. B., and Zel’dovich, B. Y. (1981) Dislocations
of the wave-front surface and zeros of the amplitude. Sov.
Phys. JETP 53, 925–929.
18. Freund, I. (1994) Optical vortices in Gaussian random
wave fields: statistical probability densities. J. Opt. Soc. Am.
11, 1644–1652.
68 � 2008 The Author. Journal compilation � 2008 Blackwell Publishing Ltd j Strain (2008) 44, 57–69
Methods of Speckle Interferometry : P. Jacquot

19. Huntley, J. M. (1995) Random phase measurement error
in digital speckle pattern interferometry. Proc. of SPIE,
2544, 246–257.
20. Liu, H., Lu, G., Wu, S., Yin, S. and Yu, F. T. S. (1999)
Speckle-induced phase error in laser-based phase-shifting
projected fringe profilometry. J. Opt. Soc. Am. A 16, 1484–
1495.
21. Kadono, H., Bitoh, Y. and Toyooka, S. (2001) Statistical
interferometry based on a fully developed speckle field: an
experimental demonstration with noise analysis. J. Opt.
Soc. Am. A 18, 1267–1274.
22. Steinchen, W. and Yang, L. (2003) Digital Shearography.
SPIE Press, Bellingham, WA.
23. Stetson, K. A. (1976) Problem of defocusing in speckle
photography, its connection to hologram interferometry
and its solution. J. Opt. Soc. Am. 66, 1267–1670.
24. Siebert, Th., Splitthof, K. and Ettemeyer, A. (2004) A
practical approach to the problem of the absolute phase in
speckle interferometry. J. Hologr. Speckle 1, 32–38.
25. Goudemand, N. (2005) 3D-3C Speckle Interferometry: Opti-
cal Device for Measuring Complex Structures. ETHZ thesis,
Swiss Federal Institute of Technology, Zurich, no. 15961.
26. Gautier, B. (2005) Etudes et realisation d’un interferometre de
speckle a mesure de forme integree. These Ecole des Mines de
Paris, Paris.
27. Osten, W. (1985) Some considerations on the statistical
error analysis in holographic interferometry with applica-
tion to an optimized interferometer. Opt. Acta, 32, 827–838.
28. Juptner, W. and Osten, W. (Eds) (1989) (1993) (1997)
(2001) (2005) Proceedings of the ‘‘Fringe’’ Conferences Series.
Akademie Verlag, Berlin (89-93-97), Elsevier, Paris (01),
Springer, Berlin (05).
29. Creath, K. (1988) Phase-Measurement Interferometry Tech-
niques, Progress in Optics XXVI. Elsevier Science Publish-
ers B.V., Amsterdam, 349–393.
30. Colonna de Lega, X. and Jacquot, P. (1996) Deformation
measurement with object-induced dynamic phase-shift-
ing. Appl. Opt. 35, 5115–5121.
31. Takeda, M., Ina, H. and Kobayashi S. (1982) Fourier-
transform method of fringe-pattern analysis for computer-
based topography and interferometry. J. Opt. Soc. Am. 72,
156–160.
32. Colonna de Lega, X. (1997) Processing of Non-stationary
Interference Patterns: Adapted Phase-shifting Algorithms and
Wavelet Analysis. Application to Dynamic Deformation
Measurements by Holographic and Speckle Interferometry.
EPFL thesis, Swiss Federal Institute of Technology, Lau-
sanne, no. 1666.
33. Larkin, K. G. (2001) Natural demodulation of two-
dimensional fringe patterns. I. General background of the
spiral phase quadrature transform & II. Stationary phase
analysis of the spiral phase quadrature transform. J. Opt.
Soc. Am. A 18, 1862–1881.
34. Servin, M., Marroquin, J. L. and Quiroga, J. A. (2004)
Regularized quadrature and phase tracking from a single
closed-fringe interferogram. Opt. Im. Sci. Vis. 21, 411–419.
35. Robin, E., Valle, V. and Bremand, F. (2005) Phase
demodulation method from a single fringe pattern based
on correlation technique with a polynomial form. Appl.
Opt., 44, 7261–7269.
36. Equis, S., Baldi, A. and Jacquot, P. (2007)Phase Extraction in
Dynamic Speckle Interferometry by Empirical Mode
Decomposition. CDR Proc ICEM13 Conf, Alexandroupolis,
Greece.
37. Doval, A. F. (2000) A systematic approach to TV holog-
raphy. Meas. Sci. Tech. 11, R1–R36.
38. Ghiglia, D. C. and Pritt, M. D. (1998) Two-dimensional Phase
Unwrapping: Theory, Algorithms, and Software. Wiley, New
York.
39. Lehmann, M. (1997) Decorrelation-induced phase errors
in phase-shifting speckle interferometry. Appl. Opt. 36,
3657–3667.
40. Thalmann, R., and Dandliker R. (1986) Statistical properties
of interference phase detection in speckle fields applied to
holographic interferometry. J. Opt. Soc. Am. A. 3, 972–981.
41. Svanbro, A. and Sjodahl M. (2006) Complex amplitude
correlation for compensation of large in-plane motion in
digital speckle pattern interferometry. Appl. Opt. 45, 8641–
8647.
42. Jacquot, P., Fournier, J.-M., Gastinger, K., Løkberg, O. J.,
Winther, S., Slangen, P. and Cerruti, C. Eds. (2000, 2003,
2006) Proceedings of the ‘‘Speckle’’ Conferences Series. Lau-
sanne, Trondheim, Nımes.
43. Equis, S. and Jacquot, P. (2006) Simulation of speckle
complex amplitude: advocating the linear model. Proc.
SPIE 6341, 634138-1–6.
44. Gulker, G., Hinsch, K. D. and Kraft, A. (2001) Deformation
monitoring on ancient terracotta warriors by microscopic
TV-holography. Opt. Lasers Eng. 36, 501–512.
45. Ruiz, P. D., Huntley, J. M. and Wildman, R. D. (2005)
Depth-resolved whole-field displacement measurements
by wavelength scanning electronic speckle pattern inter-
ferometry. Appl. Opt. 44, 3945–3953.
� 2008 The Author. Journal compilation � 2008 Blackwell Publishing Ltd j Strain (2008) 44, 57–69 69
P. Jacquot : Methods of Speckle Interferometry