vi semester environmental engineering-i · environmental engineering-i dept. civil engg. ace,...
TRANSCRIPT

ENVIRONMENTAL ENGINEERING-I
Dept. civil engg. ACE, Bangalore Page 1
VI SEMESTER
ENVIRONMENTAL ENGINEERING-I
Subject Code : 10CV61 IA Marks : 25
No. of Lecture Hours/Week : 04 Exam Hours : 03
Total No. of Lecture Hours : 52 Exam Marks : 100
Part - A
Unit - 1
INTRODUCTION: Human activities and environmental pollution. Water for various
beneficial uses and quality requirement. Need for protected water supply. 2 Hours
DEMAND OF WATER: Types of water demands- domestic demand in detail,
institutional and commercial, public uses, fire demand. Percapita consumption –factors
affecting per capita demand, population forecasting, different methods with merits
&demerits- variations in demand of water. Fire demand – estimation by Kuichling‟s
formula, Freeman formula & national board of fire underwriters formula, peak factors,
design periods & factors governing the design periods 6 Hours
Unit - 2
SOURCES: Surface and subsurface sources – suitability with regard to quality and
quantity. 3 Hours
COLLECTION AND CONVEYANCE OF WATER: Intake structures – different
types of intakes; factor of selection and location of intakes. Pumps- Necessity, types –
power of pumps; factors for the selection of a pump. Pipes – Design of the economical
diameter for the rising main; Nomograms – use; Pipe appurtenances.
6 Hours
Unit - 3
QUALITY OF WATER: Objectives of water quality management. wholesomeness&
palatability, water borne diseases. Water quality parameters – Physical, chemical and
Microbiological.Sampling of water for examination. Water quality analysis (IS: 3025 and
IS: 1622) using analytical and instrumental techniques. Drinking waterstandards BIS &

ENVIRONMENTAL ENGINEERING-I
Dept. civil engg. ACE, Bangalore Page 2
WHO guidelines. Health significance of Fluoride, Nitrates and heavy metals like
Mercury, Cadmium, Arsenic etc. andtoxic / trace organics.6 Hours
Unit - 4
WATER TREATMENT: Objectives – Treatment flow-chart. Aeration- Principles, types
of Aerators .2Hours
SEDIMENTATION: Theory, settling tanks, types, design. Coagulant aided
sedimentation, jar test, chemical feeding, flash mixing, and clariflocculator. 4Hours
Part - B
Unit - 5
FILTRATION: Mechanism – theory of filtration, types of filters, slow sand, rapid sand
and pressure filters including construction, operation, cleaning and their design –
excluding under drainage system – back washing of filters. Operational problems in
filters.6 Hours
Unit - 6
DISINFECTION: Theory of disinfection, types of disinfection, Chlorination, chlorine
demand, residual chlorine, use of bleaching powder. UV irradiation treatment – treatment
of swimming pool water 4Hours
SOFTENING – definition, methods of removal of hardness by lime soda process and
zeolite process RO & Membrane technique. 3 Hours
Unit - 7
MISCELLANEOUS TREATMENT: Removal of color, odor, taste, use of copper
sulfate,adsorption technique, fluoridation and defluoridation. 4 Hours
DISTRIBUTION SYSTEMS: System of supply, service reservoirs and their capacity
determination, methods of layout of distribution system. 4 Hours
Unit - 8
MISCELLANEOUS: Pipe appurtenances, various valves, type of fire hydrants,
pipefitting, Layout of water supply pipes in buildings. 2Hours
TEXT BOOKS:

ENVIRONMENTAL ENGINEERING-I
Dept. civil engg. ACE, Bangalore Page 3
1. Water supply Engineering –S.K.Garg, Khanna Publishers
2. Environmental Engineering I –B C Punima and Ashok Jain
3. Manual on Water supply and treatment –CPHEEO, Minstry of
Urban Development, New Delhi
REFERENCES
1. Hammer, M.J., (1986), Water and Wastewater Technology –SI Version, 2nd
Edition,
John Wiley and Sons.
2. Karia, G.L., and Christian, R.A., (2006), Wastewater Treatment – Concepts and
Design Approach, Prentice Hall of India Pvt. Ltd.,New Delhi.
3. Metcalf and Eddy, (2003), Wastewater Engineering, Treatment and Reuse ,4th
Edition, Tata McGraw Hill Edition, Tata McGraw HillPublishing Co. Ltd.
4. Peavy, H.S., Rowe, D.R., and Tchobanoglous, G., (1986),Environmental
Engineering–McGraw Hill Book Co.
5. Raju, B.S.N., (1995), Water Supply and Wastewater Engineering, Tata McGraw
Hill Pvt. Ltd., New Delhi.
6. Sincero, A.P., and Sincero, G.A., (1999), Environmental Engineering – A Design
Approach–Prentice Hall of India Pvt.Ltd., New Delhi.
CHAPTER 1

ENVIRONMENTAL ENGINEERING-I
Dept. civil engg. ACE, Bangalore Page 4
INTRODUCTION
Human activities and environment pollution
Humans impact the environment in several ways. Common effects include decreased
water quality, increased pollution and greenhouse gas emissions, depletion of natural resources
and contribution to global climate change. Some of these are the direct result of human activities,
whereas others are secondary effects that are part of a series of actions and reactions.
Water Pollution
Perhaps the most obvious examples of a negative human impact on the environment is water
pollution. It's obvious we need water to survive but few people realize how much we need and
just how much is available. Consider these facts from the United Nations Environment
Programme:
1 Of all the water on Earth, only 2.5% of it is freshwater.
2 Of that 2.5%, less than 1% is available to us.
3 Humans each require up to 13 gallons (50 litres) a day of fresh water for drinking,
cooking and cleaning. This does NOT take into account the countless gallons of water
needed to grow food or care for animals.
4 70% of all freshwater usage goes to irrigation.
According to Organic Farming Research Foundation, only 2% of farms are organic. This equates
to almost 69% of our freshwater supply is being contaminated by chemical pesticides, herbicides,
and chemical fertilizers, while also compounded with fossil fuels and emissions from heavy
farming machinery. These chemical compounds contribute to acid rain. Since very little can live
in an acidic environment, acid rain has harmful effects on plants, animals, and aquatic life, as well
as humans and even buildings, statues or other objects. Acid rain also contaminates our limited
freshwater supply, and thus the cycle of water pollution continues. According to the U.S.
Environmental Protection Agency, 45% of assessed stream miles, 47% of assessed lake acres, and
32% of assessed bay and estuarine square miles were not clean enough to support uses such as
swimming or fishing. The following reasons and possible sources for this include: Sediments,
pathogens and habitat alterations from agricultural activity and hydrologic modifications (such as
dams Excessive nutrients, metals and organic enrichment from agricultural activity and

ENVIRONMENTAL ENGINEERING-I
Dept. civil engg. ACE, Bangalore Page 5
atmospheric deposition (the movement of pollutants from one environment to another, such as
from water to air) Heavy metals (primarily mercury), excess nutrients and "organic enrichment"
from industrial and municipal discharges ("treated" or untreated waste water released from sewer
plants and industrial factories into natural water sources) These points listed above lead to a
poisoned and uninhabitable environment for plants and aquatic life, as well as affect land animals
and humans reliant on these systems for survival and other land-bound plant life in need of clean
water for growth.
Land Pollution
Land pollution, the degradation of the Earth's surfaces and soil, is caused by human
activity and a misuse of natural resources. Causes of land pollution and degradation include:
1. Urban sprawl: Natural habitats are removed to make room for communities, usually with
inefficient or irresponsible planning. Urban sprawl generally results in a waste of land
area for unused development (such as excessive roads, decorative and unused areas, etc).
2. Poor agricultural practices: Animal manure runoff from CAFO (Confined Animal
Feeding Operations), the use of chemical fertilizers, herbicides and pesticides, the
practice of growing monocultures (only one crop season after season) and the
deforestation required to expand farm land all contribute to degradation and pollution.
3. Personal consumption: Our modern culture's desire to have more, bigger and better
"things", as well as our relationship to and habit of waste, has led to stripping of the land,
excessive mining and pollution from industrial activities.
4. Industrial activities: The production of chemical-laden plastics, poor quality of products,
unethical practices (such as illegal dumping), and extreme emissions affect both
surrounding and far-reaching areas.
None of this takes into account illegal dumping, diminishing landfill space, litter, overproduction
of synthetic materials, radioactive waste and more.All land pollution is caused by a human impact
on the environment and thus can be averted by our actions alone. Two of the necessary actions
must be proper planning and proper usage of natural resources. For instances, animals could be
taken out of CAFO and allowed to graze on mountainous or wooded areas unsuitable for
buildings or crops. Using organic and sustainable farming techniques can eliminate our need for

ENVIRONMENTAL ENGINEERING-I
Dept. civil engg. ACE, Bangalore Page 6
chemical applications. Clean energy, such as wind or solar power, can slowly begin to replace
coal or nuclear plants. And as consumers we can lessen our human impact on the environment by
demanding better quality products, environmentally ethical practices from industries and a shift
toward sustainable energy.
Air Pollution
One bit of good news about our human impact on the environment is that air pollution is
lowering and air quality is increasing. According to the U.S. Environmental Protection Agency,
since 1990 to 2008:
Ozone decreased 14%
Lead decreased 78%
Nitrogen dioxide decreased 35%
Carbon monoxide decreased 68%
Sulfur dioxide decreased 59%
However, 127 million people still live in areas that exceed quality standards. And some
of the quality standards are far from ideal, such as ozone. The question is: what amount of air
pollution is really okay? Shouldn't we be striving for technologies or practices that virtually
eliminate major polluters, such as: Better public transit, electric cars, rail, and city planning etc to
replace heavy commutes, fossil fuels, air travel and unwalkable communities Retrofitting or
otherwise upgrading existing factories with greener technologies such as solar panels or air
filtration systems Removing animals from factory farms and raising them on natural diets and
rotating pasture to reduce methane emissions and pollution The greatest human impact on the
environment we can have is to vote with our pocket book and our actions. By supporting
companies that use greener technologies, we can start a trend toward better solutions. By getting
involved in community planning and zoning we can have a global impact on a local level. And by
buying less "stuff", eating less animal products and sourcing our food from sustainable farms, we
can spread the word that better solutions do exist and they don't have to cater to mega-
corporations and lobbyist pressure.

ENVIRONMENTAL ENGINEERING-I
Dept. civil engg. ACE, Bangalore Page 7
Some important impacts of human activities on environment are outlined below:
1 .Deforestation: In order to provide timber and farm land to increased population, large number
of forest trees are cut and forest area is converting to farm lands. The rate of deforestation is so
faster that around 1.5 million hectare of forest cover is lost every year is India alone. The process
of deforestation results in decreasing rainfall, increasing global temperature, loss of top soil,
modification of climatic conditions etc.
2. Industrialization: Although the industrial activities of man provide basic need of the society,
simultaneously the same release a lot of pollutants to the environment. The pollutants in
environment cause loss of raw materials, health hazards, increase in death rate, damage to crop,
making environment unfit for living organisms etc.
3. Loss of ecological balance: The excessive use, misuse and mis-management of biosphere
resources results in disturbance in ecosystem or ecological imbalance.
4. Air pollution: The anthropogenic release of various air pollutants to the environment causes a
number of dreaded phenomena like green house effect, ozone layer depletion, acid rain and smog
formation etc.
5. Water pollution: Human activities in respect of disposal of sewage wastes, solid wastes,
municipal wastes, agricultural and industrial wastes cause the environment unfit for day to day
use. Besides, polluted water spreads or leads to different diseases.
6. Increased consumption of natural resources: Since the starting of industrial era, the natural
resources are constantly utilised for the production of one or more products for the day to day use
of society.
7. Production of waste: Rapid industrialization and unplanned urbanization release a lot of toxic
waste material either in solid or liquid or gaseous state which induces a number of serious
environmental hazards.
8. Extinction of Wildlife: Since forests are natural habitats of wild life (both plants and animals)
deforestation leads to the extinction of valuable wild life and loss of biodiversity.

ENVIRONMENTAL ENGINEERING-I
Dept. civil engg. ACE, Bangalore Page 8
9. Habitual destruction: The commercial and industrial activities associated with mining,
construction of dams, fishing, agriculture etc. cause habitat destruction which is a pathway to
pollution.
10. Noise pollution: The man-made noise due to mechanized automobile, industries, trains, aero
planes, social functions etc. causes noise pollution which has impact on both biotic and a biotic
components of environment.
11. Radiation pollution: The radiations from radioactive substances used in nuclear reactors and
nuclear weapons can have significant impact on genetic materials of body (DMA, RHA etc.)
12. Soil erosion: The anthropogenic processes like deforestation and overgrazing induce soil
erosion which causes soil moisture reduction, lowering of productivity, decline in soil fertility etc.
NEED FOR PROTECTED WATER SUPPLY
Protected water supply means the supply of water that is treated to remove the impurities
and made safe to public health. Water may be polluted by physical and bacterial agents. Water is
also good carrier of disease causing germs. The causes of outbreak of epidemics are traced to
pollute water and poor sanitation hospital are continued to be flooded with the sick due to
ignorance about health continues to be profound. However during the last few decades,
improvements in the public health protection by supplying safe water and sanitation to all the
people in the developing countries. In 1977, united nations declare to launch a movement known
as “HEALTH FOR ALL BY THE YEAR 2000 A.D.” India is also a signatory to that conference.
The working group appointed by the planning commission while suggesting strategies for
achieving the above goal emphasized that potable water from protected water supply should be
made available to the entire population. Pure and whole some water is to be supplied to the
community alone can bring down the morbidity rates.
Sl.No. Description India 1970-75 U.S.A 1970-75
1 Average per capita G.N.P. 133 7024 2 Infant mortality rate (per 129 15

ENVIRONMENTAL ENGINEERING-I
Dept. civil engg. ACE, Bangalore Page 9
thousand)
3 Life Expectancy (years) 49 73
4 Literacy 34 99
The objectives of the community water supply system are
1. To provide whole some water to the consumers for drinking purpose.
2. To supply adequate quantity to meet at least the minimum needs of the individuals and to
make adequate provisions for emergencies like fire fighting, festivals, meeting etc
3. To make provision for future demands due to increase in population, increase in standard
of living, storage and conveyance
4. To prevent pollution of water at source, storage and conveyance
5. To maintain the treatment units and distribution system in good condition with adequate
staff and materials
6. To design and maintain the system that is economical and reliable
WATER DEMANDS
VARIOUS TYPES OF WATER DEMANDS
While designing the water supply scheme for a town or city, it is necessary to determine
the total quantity of a water required for various purposes by the city. As amatter of fact the first
duty of the engineer is to determine the water demand of the town and then to find suitable water
sources from where the demand can be met. But as there are so many factors involved in demand
of water, it is not possible to accurately determine the actual demand. Certain empirical formulae
and thumb rules are employed in determining the water demand, which is very near to the actual
demand.
Following are the various types of water demands of a city or town:
1. Domestic water demand
2. Industrial demand
3. Institution and commercial demand
4. Demand for public use

ENVIRONMENTAL ENGINEERING-I
Dept. civil engg. ACE, Bangalore Page 10
5. Five demand
6. Loses and wastes
DOMESTIC WATER DEMAND
The quantity of water required in the houses for drinking, bathing, cooking, washing etc
is called domestic water demand and mainly depends upon the habits, social status, climatic
conditions and customs of the people. As per IS: 1172-1963, under normal conditions, the
domestic consumption of water in India is about 135 litres/day/capita. But in developed countries
this figure may be 350 litres/day/capita because of use of air coolers, air conditioners,
maintenance of lawns, automatic household appliances.
The details of the domestic consumption are
a) Drinking------ 5 litres
b) Cooking------ 5 litres
c) Bathing------ 55 litres
d) Clothes washing------ 20 litres
e) Utensils washing------ 10 litres
f) House washing------ 10 litres
--------------------------
135 litres/day/capita
INDUSTRIAL DEMAND
The water required in the industries mainly depends on the type of industries, which are
existing in the city. The water required by factories, paper mills, Cloth mills, Cotton mills,
Breweries, Sugar refineries etc. comes under industrial use. The quantity of water demand for
industrial purpose is around 20 to 25% of the total demand of the city.
INSTITUTION AND COMMERCIAL DEMAND
Universities, Institution, commercial buildings and commercial centers including office
buildings, warehouses, stores, hotels, shopping centers, health centers, schools, temple, cinema
houses, railway and bus stations etc comes under this category. As per IS: 1172-1963, water
supply requirements for the public buildings other than residences as follows.

ENVIRONMENTAL ENGINEERING-I
Dept. civil engg. ACE, Bangalore Page 11
Sl.No. Type of Building Construction per capita
per day (litres)
1. a) Factories where bathrooms are
required to be provided. 45
b) Factories where no bathrooms are
required to be provided 30
2. Hospitals per bed
a) No. of beds not exceeding 100 No. 340
b) No. of beds exceeding 100 No. 450
3. Nurses homes and medical quarters. 135
4. Hostels 135
5. Offices 45
6. Restaurants (per seat) 70
7. Hotel (per bed) 180
8. Cinema concert halls and theatres (per
seat) 15
9. Schools
a) Day schools 45
b) Boarding schools 135
10. Garden, sports grounds 35 per sq.m
11. Animal/vehicles 45
DEMAND FOR PUBLIC USE
Quantity of water required for public utility purposes such as for washing and sprinkling
on roads, cleaning of sewers, watering of public parks, gardens, public fountains etc comes under
public demand. To meet the water demand for public use, provision of 5% of the total
consumption is made designing the water works for a city.The requirements of water for public
utility shall be taken as given in Table
Sl.No. Purpose Water Requirements
1. Public parks 1.4 litres/m2/day

ENVIRONMENTAL ENGINEERING-I
Dept. civil engg. ACE, Bangalore Page 12
2. Street washing 1.0-1.5 litres/m2/day
3. Sewer cleaning 4.5 litres/head/day
FIRE DEMAND
Fire may take place due to faulty electric wires by short circuiting, fire catching
materials, explosions, bad intension of criminal people or any other unforeseen mishappenings. If
fires are not properly controlled and extinguished in minimum possible time, they lead to serious
damage and may burn cities.
All the big cities have full fire-fighting squads. As during the fire breakdown large
quantity of water is required for throwing it over the fire to extinguish it, therefore provision is
made in the water work to supply sufficient quantity of water or keep as reserve in the water
mains for this purpose. In the cities fire hydrants are provided on the water mains at 100 to 150 m
apart for fire demand.
The quantity of water required for fire fighting is generally calculated by using different empirical
formulae. For Indian conditions kuichings formula gives satisfactory results.
Q=3182 √p
Where „Q‟ is quantity of water required in
litres/min „P‟ is population of town or
city in thousands
Buston‟s formula _
Q = 5663√p
Freeman‟s formula Q = 1136 (P/5+10) And F = 2.8 √p Where F= number of simultaneous fire streams
Q = 4637√p (1-0.01√p)

ENVIRONMENTAL ENGINEERING-I
Dept. civil engg. ACE, Bangalore Page 13
Though the total demand of water for extinguishing fire is usually very small, the rate of
consumption is very high. It depends upon bulk, congestion and fire resistance buildings. The
minimum limitof fire demand is the amount and rate of supply that would extinguish the largest
propable fire in the city. Fire hydrants of 15 to 20 cm diameter are normally provided on all street
corners, and at suitable intermediate points. These are generally connected to water supply mains.
When fire occurs, pumps installed on fire brigade trucks are rushed to the site and connected to
fire hydrants from where they throw jet of water under very high pressure. The pressure varies
between 1 to 2kg/cm2. For a fire of moderate ,three streams each of 1100 litres/minute are
required. For a city of one lac population, the fire flow required, by National Board of Fire
Underwriters comes out to be 40500 litres/minute. Assuming an average total consumption of
150litres/day .thus the rate of flow required for the fire demand, is very much higher than the total
flow rate required for the purposes. However, the provision for fire demand is made only for 3 to
5 hours fire flow. The total quantity of water calculated on yearly basis is usually very small
because fire breaks out only few times in a year.
LOSSES AND WASTES
All the water, which goes in the distribution, pipes does not reach the consumers. The following
are the reasons
1. Losses due to defective pipe joints, cracked and broken pipes, faulty valves and fittings.
2. Losses due to, consumers keep open their taps of public taps even when they are not
using the water and allow the continuous wastage of water
3. Losses due to unauthorised and illegal connections
While estimating the total quantity of water of a town; allowance of 15% of total quantity of
water is made to compensate for losses, thefts and wastage of water
PER CAPITA DEMAND
If „Q‟ is the total quantity of water required by various purposes by a town per year and „p‟ is
population of town, then per capita demand will be
Q
Per capita demand = ------------------ litres/day
P x 365
Per capita demand of the town depends on various factors like standard of living, no. and type of
commercial places in a town etc. For an average Indian town, the requirement of water in various
uses is as under
ENVIRONMENTAL ENGINEERING-I
Dept. civil engg. ACE, Bangalore Page 14
i. Domestic purpose -------- 135 litres/c/d
ii. Industrial use-------- 40 litres/c/d
iii. Public use-------- 25 litres/c/d
iv. Fire Demand-------- 15 litres/c/d
v. Losses, Wastage
and thefts -------- 55 litres/c/d
--------------------------
Total : 270 litres/capita/day
The total quantity of water required by the town per day shall be 270 multiplied
with the total population in litres/day.
FACTORS AFFECTING PER CAPITA DEMAND
The following are the main factors affecting for capita demand of the city or town.
Climatic conditions : The quantity of water required in hotter and dry places is more
than cold countries because of the use of air coolers, air conditioners, sprinkling of water
in lawns, gardens, courtyards, washing of rooms, more washing of clothes and bathing
etc. But in very cold countries sometimes the quantity of water required may be more due
to wastage, because at such places the people often keep their taps open and water
continuously flows for fear of freezing of water in the taps and use of hot water for
keeping the rooms warm.
Size of community : Water demand is more with increase of size fo town because more
water is required in street washing, running of sewers, maintenance of parks and gardens.
Living standard of the people : The per capita demand of the town increases with the
standard of living of the people because of the use of air conditioners, room coolers,
maintenance of lawns, use of flush, latrines and automatic home appliances etc.
Industrial and commercial activities : As the quantity of water required in
certainindustries is much more than domestic demand, their presence in the town will
enormously increase per capita demand of the town. As a matter of the fact the water
required by the industries has no direct link with the population of the town.

ENVIRONMENTAL ENGINEERING-I
Dept. civil engg. ACE, Bangalore Page 15
Pressure in the distribution system: The rate of water consumption increase in the
pressure of the building and even with the required pressure at the farthest point, the
consumption of water will automatically increase. This increase in the quantity is firstly
due to use of water freely by the people as compared when they get it scarcely and more
water loss due to leakage, wastage and thefts etc.
System of sanitation: Per capita demand of the towns having water carriage system will
be more than the town where this system is not being used.
Cost of water: The cost of water directly affects its demand. If the cost of water is more,
less quantity of water will be used by the people as compared when the cost is low.
POPULATION FORECASTING METHODS AND PROBLEMS
When the design period is fixed the next step is to determine the population of a
town or city population of a town depends upon the factors like births, deaths, migration
and annexation. The future development of the town mostly depends upon trade
expansion, development industries, and surrounding country, discoveries of mines,
construction of railway stations etc may produce sharp rises, slow growth, stationary
conditions or even decrease the population. For the prediction of population, it is better to
study the development of other similar towns, which have developed under the same
circumstances, because the development of the predicted town will be more or less on the
same lines.
The following are the standard methods by which the forecasting population is done.
i. Arithmetical increase method
ii. Geometrical increase method
iii. Incremental increase method
iv. Simple graph method
v. Decrease rate of growth method
vi. Comparative graph method and The master plan method

ENVIRONMENTAL ENGINEERING-I
Dept. civil engg. ACE, Bangalore Page 16
Problem: The following data have been noted from the census department.
YEAR POPULATION
1940 8000
1950 12000
1960 17000
1970 22500
Find the probable population in the year 1980, 1990 and 2000.
ARITHEMATICAL INCREASE METHOD
This method is based on the assumption that the population is increasing at a
constant rate. The rate of change of population with time is constant. The population after
„n‟ decades can be determined by the formula.
Pn = P + n.c where P → population at present n → No.
ofdecades
c→ Constant determined by the average of
increase of „n‟ decades
Solution:
YEAR POPULATION
1980 22500 + 1 x 4833 = 27333
YEAR POPULATION INCREASE IN
POPULATION
1940 8000 ---
1950 12000 4000
1960 17000 5000
1970 22500 5500
TOTAL 14500
AVERAGE 4833
ENVIRONMENTAL ENGINEERING-I
Dept. civil engg. ACE, Bangalore Page 17
1990 22500 + 2 x 4833 = 32166
2000 22500 + 3 x 4833 = 36999
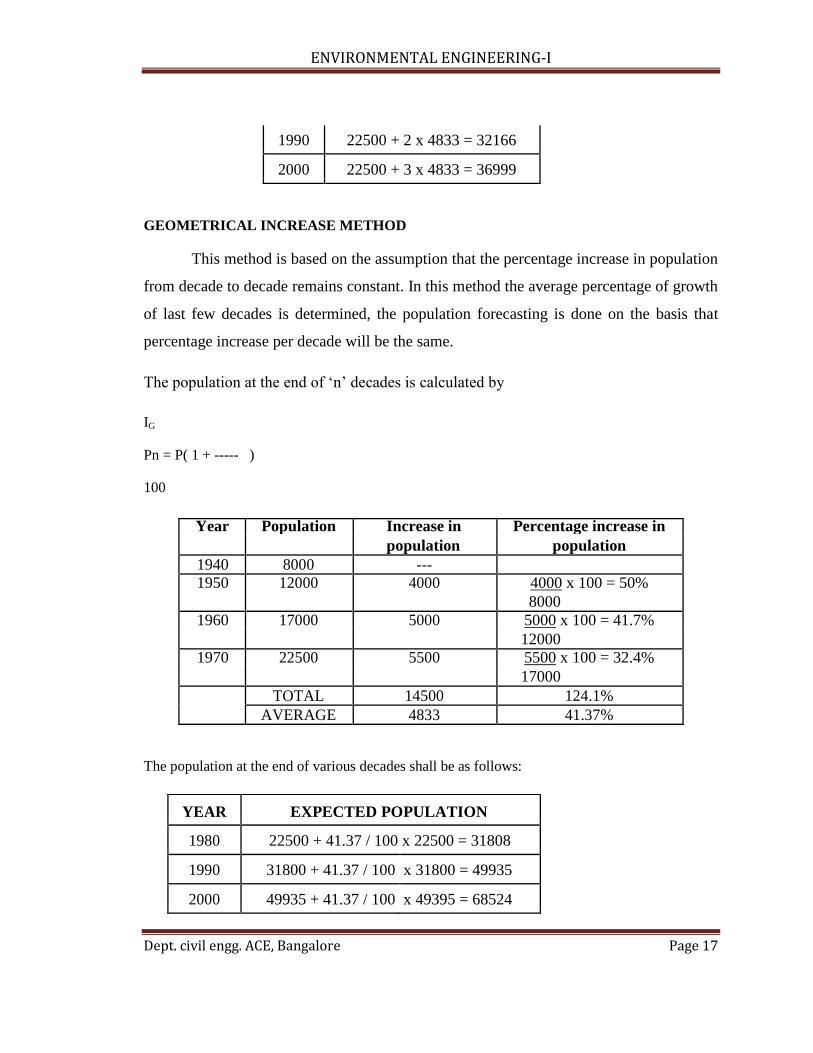
GEOMETRICAL INCREASE METHOD
This method is based on the assumption that the percentage increase in population
from decade to decade remains constant. In this method the average percentage of growth
of last few decades is determined, the population forecasting is done on the basis that
percentage increase per decade will be the same.
The population at the end of „n‟ decades is calculated by
IG
Pn = P( 1 + ----- )
100
The population at the end of various decades shall be as follows:
Year Population Increase in Percentage increase in
population population
1940 8000 ---
1950 12000 4000 4000 x 100 = 50%
8000
1960 17000 5000 5000 x 100 = 41.7%
12000
1970 22500 5500 5500 x 100 = 32.4%
17000
TOTAL 14500 124.1%
AVERAGE 4833 41.37%
YEAR EXPECTED POPULATION
1980 22500 + 41.37 / 100 x 22500 = 31808
1990 31800 + 41.37 / 100 x 31800 = 49935
2000 49935 + 41.37 / 100 x 49395 = 68524

ENVIRONMENTAL ENGINEERING-I
Dept. civil engg. ACE, Bangalore Page 18
INCREMENTAL INCREASE METHOD
This method is improvement over the above two methods. The average increase
in the population is determined by the arithmetical method and to this is added the
average of the net incremental increase once for each future decade.
Solution:
Year Population Increase in Incremental
population increase
1940 8000 --- ---
1950 12000 4000 ---
1960 17000 5000 + 1000
1970 22500 5500 + 1500
TOTAL 14500 + 2500
AVERAGE 4833 1,250
The population at the end of the various decades shall be as follows:
YEAR EXPECTED POPULATION
1980 22500 + (4833 + 1250) x 1 = 28583
1990 22500 + (4833 + 1250) x 2 = 34666
2000 22500 + (4833 + 1250) x 3 = 40749
VARIATIONS IN DEMAND
The per capita demand of town is the average consumption of water for a year. In
practice it has been seen that this demand doesnot remain uniform throughout the year
but it various from season to season, even hour to hour.
ENVIRONMENTAL ENGINEERING-I
Dept. civil engg. ACE, Bangalore Page 19
SEASONAL VARIATIONS
The water demand varies from season to season. In summer the water demand is
maximum, because the people will use more water in bathing, cooling, lawn watering and
street sprinkling. This demand will becomes minimum in winter because less water will
be used in bathing and there will be no lawn watering. The variations may be upto 15%
of the average demand of the year.
DAILY VARIATIONS
This variation depends on the general habits of people, climatic conditions and
character of city as industrial, commercial or residential. More water demand will be on
Sundays and holidays due to more comfortable bathing, washing etc as compared to other
working days. The maximum daily consumption is usually taken as 180% of the average
consumption.
HOURLY VARIATIONS
On Sundays and other holidays the peak hours may be about 8 A.M. due to late
awakening where as it may be 6 A.M. to 10 A.M. and 4 P.M. to 8 P.M. and minimum
flow may be between 12P.M. to 4P.M. when most of the people are sleeping. But in
highly industrial city where both day and night shifts are working, the consumption in
night may be more. The maximum consumption may be rise upto 200% that of average
daily demand.
The determination of this hourly variations is most necessary, because on its basis the
rate of pumping will be adjusted to meet up the demand in all hours.
DESIGN PERIOD
The complete water supply project includes huge and costly constructions such as
dams, reservoirs, treatment works and network of distribution pipelines. These all works
cannot be replaced easily or capacities increased conveniently for future expansions.

ENVIRONMENTAL ENGINEERING-I
Dept. civil engg. ACE, Bangalore Page 20
While designing and constructing these works, they should have sufficient capacity to
meet future demand of the town for number of years. The number of years for which the
designs of the water works have been done is known as design period. Mostly water
works are designed for design period of 22-30 years, which is fairly good period.
Design period is estimated based on the following:
1. Useful life of the component, considering obsolescence, wear, tears, etc.
2. Expandability aspect. Anticipated rate of growth of population, including
industrial, commercial developments & migration-immigration.
3. Available resources.
4. Performance of the system during initial period
CHAPTER-2
SOURCES OF WATER SUPPLY
INTRODUCTION

ENVIRONMENTAL ENGINEERING-I
Dept. civil engg. ACE, Bangalore Page 21
Water is the most abundant compound in nature. It covers 75% of the earth surface.
About 97.3% of water is contained in the great oceans that are saline and 2.14% is held in icecaps
glaciers in the poles, which are also not useful. Barely the remaining 0.56% found on earth is in
useful form for general livelihood. Total quantity of water available on the planet “EARTH” in
various states and religions are given in the table
LOCATION VOLUME (m3) % OF TOTAL
Land Areas 152 x 10
12 0.009
Fresh water lakes
Saline lakes 104 x 1012
0.008
Inland seas, Rivers 1.25 x 10¹²
0.001
Soil moisture 67 x 1012
0.005
Ground water 8350 x 1012
0.005
Icecaps and glaciers 52 x 1012
0.610
--------------------------
TOTAL 37,800 x 1012
2.80
---------------------------
Atmosphere
13 x 1012
0.001
Water vapour (clouds)
Oceans 13,20,000 x 10
12 97.3
Water in the oceans
---------------------------------- ---------
13,60,000 x 1012
TOTAL ON PLANET 100
----------------------- ---------
Hydrological concepts
Hydrology is the science, which deals with the increment of the water on the
ground, under the ground, evaporation from the land and water surface and transportation
from the vegetation and going back into atmosphere where it precipitates.
Definition
The water which goes in atmosphere by evaporation and transpiration again
comes back in the form of precipitation under favourable climatic conditions is known as
hydrological cycle of water.

ENVIRONMENTAL ENGINEERING-I
Dept. civil engg. ACE, Bangalore Page 22
Precipitation
The evaporated water from the surfaces of streams, rivers, sea, ponds, wet
surfaces, trees and plants etc again returned to the earth surface by the condensation in
the form of rain, hails, dew, sleet etc is known as precipitation. The major part of the
precipitation occurs in the form of rain and other forms quantities are very small.
Thewater of precipitation further goes off in the following ways.
Run-off: After precipitation a portion of its water flows over the ground in the form of
rivers and streams and some water flows towards lakes and ponds and collected there.
Infiltration: A portion of precipitation, percolates in the ground and it is stored in the
form of sub-soil or ground water.
Evaporation: some portion of the precipitation is also evaporated from the lakes, rivers,
reservoirs and wet surfaces in the form of vapour due to sun‟s heat is known as
evaporation
Evapo-transpiration: The roots of the trees sucks water from the ground and some portion
of it evaporates in the atmosphere through leaves in the form of transpiration.
Surface sources
All the sources of water can be broadly divided into
1. Surfaces sources and
2. Sub surface sources
The surface sources further divided into
1. Streams
2. Rivers
3. Ponds
4. Lakes

ENVIRONMENTAL ENGINEERING-I
Dept. civil engg. ACE, Bangalore Page 23
5. Impounding reservoirs etc.
Natural ponds and lakes
In mountains at some places natural basin‟s are formed with impervious bed by
springs and streams are known as “lakes”. The quality of water in the natural ponds and
lakes depends upon the basin‟s capacity, catchment area, annual rainfall, porosity of
ground etc. But lakes and ponds situated at higher altitudes contain almost pure water
which can be used without any treatment. But ponds formed due to construction of
houses, road, railways conatins large amount of impurities and therefore cannot be used
for water supply purposes.
Streams and rivers
Rivers and streams are the main source of surface source of water. In summer the
quality of river water is better than mansoon.because in rainy season the run-off water
also carries with clay, sand, silt etc which make the water turbid. So river and stream
water require special treatments. Some rivers are snow fed and perennial and have water
throughout the year and therefore they do not require any arrangements to hold the water.
But some rivers dry up wholly or partially in summer. So they require special
arrangements to meet the water demand during hot weather. Mostly all the cities are
situated near the rivers discharge their used water of sewage in the rivers, therefore much
care should be taken while drawing water from the river.
Impounding reservoirs
In some rivers the flow becomes very small and cannot meet the requirements of
hot weather. In such cases, the water can be stored by constructing a bund, a weir or a
dam across the river at such places where minimum area of land is submerged in the
water and max. Quantity of water to be stored. In lakes and reservoirs, suspended
impurities settle down in the bottom, but in their beds algae, weeds, vegetable and
organic growth takes place which produce bad smell, taste and colour in water. Therefore

ENVIRONMENTAL ENGINEERING-I
Dept. civil engg. ACE, Bangalore Page 24
INFILTRATION WELLS
In order to obtain large quantity of water, the infiltration wells are sunk in series
in the blanks of river. The wells are closed at top and open at bottom. They are
constructed by brick masonary with open joints as shown in fig
Infiltration Well Jack Well
For the purpose of inspection of well, the manholes are provided in the top cover. The
water filtrates through the bottom of such wells and as it has to pass through sand bed, it
gets purified to some extent. The infiltration well inturn are connected by porouspipes to
collecting sump called jack well and there water is pumped to purification plant for
treatment.
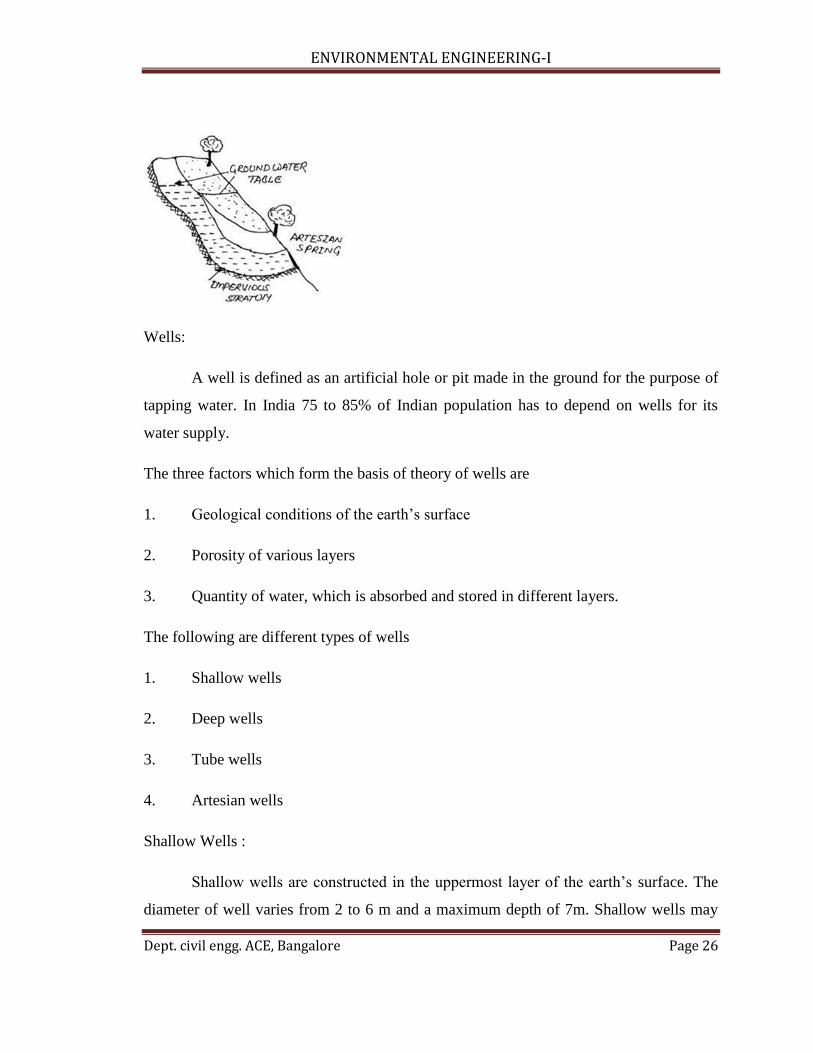
SPRINGS:
Sometimes ground water reappears at the ground surface in the form of springs.
Springs generally supply small springs. Springs generally supply small quantity of water
and hence suitable for the hill towns. Some springs discharge hot water due to presence
of sulphur and useful only for the curve of certain skin disease patients.
Types of springs:

ENVIRONMENTAL ENGINEERING-I
Dept. civil engg. ACE, Bangalore Page 25
1. Gravity Springs: When the surface of the earth drops sharply the water bearing
stratum is exposed to atmosphere and gravity springs are formed as shown in fig
2. Surface Spring: This is formed when an impervious stratum which is supporting
the ground water reservoir becomes out crops as shown in fig
3. Artesian Spring: When the ground water rises through a fissure in the upper
impervious stratum as shown in fig
When the water-bearing stratum has too much hydraulic gradient and is closed between
two imperious stratum, the formation of Artesian spring from deep seated spring
ENVIRONMENTAL ENGINEERING-I
Dept. civil engg. ACE, Bangalore Page 26
Wells:
A well is defined as an artificial hole or pit made in the ground for the purpose of
tapping water. In India 75 to 85% of Indian population has to depend on wells for its
water supply.
The three factors which form the basis of theory of wells are
1. Geological conditions of the earth‟s surface
2. Porosity of various layers
3. Quantity of water, which is absorbed and stored in different layers.
The following are different types of wells
1. Shallow wells
2. Deep wells
3. Tube wells
4. Artesian wells
Shallow Wells :
Shallow wells are constructed in the uppermost layer of the earth‟s surface. The
diameter of well varies from 2 to 6 m and a maximum depth of 7m. Shallow wells may

ENVIRONMENTAL ENGINEERING-I
Dept. civil engg. ACE, Bangalore Page 27
be lined or unlined from inside. Fig. shows a shallow well with lining (steining). These
wells are also called draw wells or gravity wells or open wells or drag wells or
percolation wells.
Quantity of water available from shallow wells is limited as their source of supply is
uppermost layer of earth only and sometimes may even dry up in summer. Hence they are
not suitable for public water supply schemes. The quantity of water obtained from
shallow wells is better than the river water but requires purification. The shallow wells
should be constructed away from septic tanks, soak pits etc because of the contamination
of effluent.The shallow wells are used as the source of water supply for small villages,
undeveloped municipal towns, isolated buildings etc because of limited supply and bad
quality of water.
(b) Deep Wells :
The Deep wells obtain their quota of water from an aquifer below the impervious
layer as shown in fig No. The theory of deep well is based on the travel of water from the
outcrop to the site of deep well. The outcrop is the place where aquifer is exposed to the
atmosphere. The rain water entered at outcrop and gets thoroughly purified when it
reaches to the site of deep well. But it dissolves certain salts and therefore become hard.
In such cases, some treatment would be necessary to remove the hardness of water.

ENVIRONMENTAL ENGINEERING-I
Dept. civil engg. ACE, Bangalore Page 28
The depth of deep well should be decided in such a way that the location of out crop is
not very near to the site of well. The water available at a pressure greater atmospheric
pressure, therefore deep wells are also reffered to as a pressure wells.
Intakes for collecting surface water:
The main function of the intakes works is to collect water from the surface source
and then discharge water so collected, by means of pumps or directly to the treatment
water.
Intakes are structures which essentially consist of opening, grating or strainer through
which the raw water from river, canal or reservoir enters and carried to the sump well by
means of conducts water from the sump well is pumped through the rising mains to the
treatment plant.
The following points should be kept in mind while selecting a site for intake works.
1. Where the best quality of water available so that water is purified economically in less
time.
2.At site there should not be heavy current of water, which may damage the intake
structure.
3.The intake can draw sufficient quantity of water even in the worst condition, when the
discharge of the source is minimum.
4.The site of the work should be easily approachable without any obstruction

ENVIRONMENTAL ENGINEERING-I
Dept. civil engg. ACE, Bangalore Page 29
5.The site should not be located in navigation channels
6.As per as possible the intake should be near the treatment plant so that conveyance cost
is reduced from source to the water works
7.As per as possible the intake should not be located in the vicinity of the point of sewage
disposal for avoiding the pollution of water.
8.At the site sufficient quantity should be available for the future expansion of the water-
works.
Types of Intake structures:
Depending upon the source of water the intake works are classified as following
1.Lake Intake
2.Reservoir Intake
3.River Intake
4.Canal Intake
Lake intake:
For obtaining water from lakes mostly submersible intakes are used. These
intakes are constructed in the bed of the lake below the water level; so as to draw water in
dry season also. These intakes have so many advantages such as no obstruction to the
navigation, no danger from the floating bodies and no trouble due to ice. As these intakes
draw small quantity of water, these are not used in big water supply schemes or on rivers
or reservoirs. The main reason being that they are not easily approachable for
maintenance.

ENVIRONMENTAL ENGINEERING-I
Dept. civil engg. ACE, Bangalore Page 30
River intake
Water from the rivers is always drawn from the upstream side, because it is free from the
contamination caused by the disposal of sewage in it. It is circular masonary tower of 4 to
7 m in diameter constructed along the bank of the river at such place from where required
quantity of water can be obtained even in the dry period. The water enters in the lower
portion of the intake known as sump well from penstocks.
Reservoir intake:
Fig shows the details of reservoir intake. It consists of an intake well, which is placed
near the dam and connected to the top of dam by foot bridge. The intake pipes are located
at different levels with common vertical pipe. The valves of intake pipes are operated
from the top and they are installed in a valve room. Each intake pipe is provided with bell
mouth entry with perforations of fine screen on its surface. The outlet pipe is taken out
through the body of dam. The outlet pipe should be suitably supported. The location of

ENVIRONMENTAL ENGINEERING-I
Dept. civil engg. ACE, Bangalore Page 31
intake pipes at different levels ensures supply of water from a level lower than the surface
level of water.
When the valve of an intake pipe is opened the water is drawn off from the reservoir to
the outlet pipe through the common vertical pipe. To reach upto the bottom of intake
from the floor of valve room, the steps should be provided in Zigzag manner.
Canal intake:
Fig shows the details of canal intake. A intake chamber is constructed in the
canal section. This results in the reduction of water way which increases the velocity of
flow. It therefore becomes necessary to provide pitching on the downstream and
upstream portion of canal intake.

ENVIRONMENTAL ENGINEERING-I
Dept. civil engg. ACE, Bangalore Page 32
Canal Intake
The entry of water in the intake chamber takes through coarse screen and the top
of outlet pipe is provided with fine screen. The inlet to outlet pipe is of bell-mouth shape
with perforations of the fine screen on its surface. The outlet valve is operated from the
top and it controls the entry of water into the outlet pipe from where it is taken to the
treatment plant.
Pumps
The function of pump is to leave the water or any fluid to higher elevation or at
higher pressure. Pumps are driven by electricity, diesiel or steam power. They are helpful
in pumping water from the sources that is from intake to the treatment plant and from
treatment plant to the distribution system or service reservoir. In homes also pumps are
used to pump water to upper floors or to store water in tanks over the buildings.
Types of pumps and their suitability
Based on the mechanical principle of water lifting pumps are classified as the following
Sl.No Type of Pump Examples Suitability
1. Displacement pumps Reciprocating pumps. This type of pumps are suitable Rotary, chain, gear for moderate heads and small
wheel, pump and discharges suitable for fire
wind mills. protection, water supply of
individual houses.
2. Velocity pumps Centrifugal pumps, This type of pumps are used deep well, turbine widely in water supply schemes
pumps, jet pumps containing sand, silt etc.
3. Boyancy pumps Airlifting pumps Airlifting pumps are generally adopted for pumping of water
from deep wells to a lift of
about 60m containing mud, silt,
debries etc.
4. Impulse pumps Hydraulic Ram Used for Small water supply projects to left the water for a
height of about 30m or so.

ENVIRONMENTAL ENGINEERING-I
Dept. civil engg. ACE, Bangalore Page 33
Centrifugal pumps – components
Centrifugal force is made use of in lifting water . Electrical energy is converted to
potential or pressure energy of water
Centrifugal pump consists of the following parts as shown in fig
Centrifugal Pump
1.Casing: The impellor is enclosed in the casing, which is so designed that kinetic energy
of the liquid is converted into pressure energy before it leaves the casing.
2.Delivery pipe
3.Delivery valve
4.Impeller
5.Prime mover
6.Suction pipe
7.Strainer and foot valve
Description
The pump consists of a Impeller is enclosed in a water tight casing. Water at
lower level is sucked into the impellor through a suction pipe. Suction pipe should be air
tight and bends in this pipe should be avoided. A strainer foot valve is connected at the
bottom of the suction pipe to prevent entry of foreign matter and to hold water
duringpumping .Saction pipe is kept larger in diameter than delivery pipe to reduce
cavitations and losses due to friction. An electric motor is coupled to the central shaft to
impart energy.

ENVIRONMENTAL ENGINEERING-I
Dept. civil engg. ACE, Bangalore Page 34
Working principle
When the impellor starts rotating it creates reduction of pressure at the eye of the
impellor, which sucks in water through the suction pipe. Water on entering the eye is
caught between the vanes of the impeller. Rapid rotation of the impellor sets up a
centrifugal force and forces the water at high velocity outwards against the causing
convert the velocity energy into pressure energy which is utilized to overcome the
delivery head
Operation and maintenance
Priming – Priming means filling up of the suction and casing completely with
water. Pressure and suction developed by the impellor is proportional to the density of the
fluid and the speed of rotation. Impellor running in air will produce only negligible
negative pressure on the head. Hence it is required that is the casing and impellor is filled
with water through a funnel and cock. Trapped air is released through pet cock. Initially
the delivery valve is closed and the pump started. The rotation impellor pushes the water
in the casing into the delivery pipe and the water in the casing into the delivery pipe and
the resulting vacuum is filled by water raising through the suction pipe. The pass valve is
opened while closing the bypass valve , while stopping the pump delivery valve is closed
first and the pump switched off.

ENVIRONMENTAL ENGINEERING-I
Dept. civil engg. ACE, Bangalore Page 35
Maintenance may be 1) preventive maintenance 2) Break down maintenance.
Preventive maintenance
Locates the sources of trouble and keep the equipment in good operating
condition. It involves oiling, greasing of stuffing boxes, observing the temperature of the
motor and the pump bearings, checking the valves, strainer, electrical contacts, earthings
etc.
Break down maintenance
Involves replacement of wornout components and testing . Sufficient amount of
spares of impellors, bearings, slip-ring brushes, stater-contacts, gland packing, greases,

ENVIRONMENTAL ENGINEERING-I
Dept. civil engg. ACE, Bangalore Page 36
oils, jointing materials, valves are to be kept instock to attend to the emergencies. It is
usual to have one stand by pump in addition to the required number of pumps.
Selection of pump horse power
Basic data regarding the water availability like diameter, depth of the well, depth of the
water table, seasonal variations of water table, drawdown duration of pumping and safe
yield are to be collected accurately before selecting a pump. There are many varieties of
specifications and choices available in the market and it is a tricky problem facing an
engineer to select the best suited for his requirement.
Point to be observed in selecting a pump
1.Capacity and efficiency - The pump should have the capacity required and optimum
efficiency.
2.Lift - Suction head from the water level to the pump level
3.Head – It is also called delivery head. Generally the total head (suction and delivery
head) should meet all possible situations with respect to the head.
4.Reliability – A reputed manufacture or similar make pump already in use may give the
failure rate and types of troubles.
5.Initial cost: The cost of the pump and its installation cost should be minimum.
6.Power – Power requirements should be less for operation
7.Maintenance – Maintenance cost should be minimum. Availability of spares and cost of
spares are to be ascertained.
Horse-power of pump
The horse-power (H.P.) of a pump can be determined by calculated the work done by a
pump in raising the water upto H height.

ENVIRONMENTAL ENGINEERING-I
Dept. civil engg. ACE, Bangalore Page 37
Let the pump raise „W‟ kg of water to height „H‟ m
Then workdone by pump = W X H Kg m
= WQH mkg/sec
Where W → density of water in kg/m3.
Q → water discharge by pump in m3/sec
Discharge x Total head The water horse power = ------------------------------------
75
W × Q × H
W.H.P. = --------------------------------
75
W. H. P
Break Horse Power = ----------------
Efficiency
W. H. P
= --------------
75 × η
Pipes and requirements
Pipes convey raw water from the source to the treatment plants in the distribution
system. Water is under pressure always and hence the pipe material and the fixture
should withstand stresses due to the internal pressure, vaccum pressure, when the pipes
are empty, water hammer when the values are closed and temperature stresses.
Requirements of pipe material
1. It should be capable of with standing internal and external pressures
2. It should have facility of easy joints
3. It should be available in all sizes, transport and errection should be easy.
4. It should be durable
5. It should not react with water to alter its quality
6. Cost of pipes should be less
7. Frictional head loss should be minimum

ENVIRONMENTAL ENGINEERING-I
Dept. civil engg. ACE, Bangalore Page 38
8. The damaged units should be replaced easily.
Different types of pipes The following are the different types of pipes
1. Cast Iron
2. Steel
3. Prestressed concrete
4. R.C.C
5. A.C. Pipes
6. Galvanised Iron (G.I)
7. P.V.C and plastic pipes
Different types of pipes
Sl.No. Type of Pipe Advantages Disadvantages
1. Cast iron Pipes 1.
Cost is
moderate 1. Breakage of pipes are large
2. The pipes are easy to join 2. The carrying capacity of
3. The pipes are not subjected
these pipes decreases with
the increase in life of pipes.
to corrosion
3. The pipes are not used for
4. The pipes are strong and
pressure greater than 0.7
durable
N/mm2
5. Service connections can be
4. The pipes are heavier
and easily made
uneconomical beyond 1200
6. Usual life is about 100 years
mmdia.
2. steel Pipes 1. No. of Joinings are less 1. Maintenance cost is high
because these are available 2. The pipes are likely to be
in long lengths rusted by acidic or alkaline
2. The pipes are cheap in first water
cost 3. The pipes require more time
3. The pipes are durable and for repairs during breakdown
strong enough to resist high and hence not suitable for
internal water pressure distribution pipes
4. The pipes are flexible to 4. The pipes may deform in

ENVIRONMENTAL ENGINEERING-I
Dept. civil engg. ACE, Bangalore Page 39
some extent and they can shape under combined action
therefore laid on curves of external forces
5. Transportation is easy
because of light weight.
3. Prestressed 1. The inside surface of pipes 1. The pipes are heavy and
concrete pipes can be made smooth difficult to transport
2. Maintenance cost is low 2. Repairs of these pipes are
3. The pipes are durable with difficult
life period 75 years 3. The pipes are likely to
4. No danger of rusting
crack during transport and
handling operations
5. These pipes donot collapse
4. There pipes are affected by
or fail under normal traffic
acids,
alkalie
s
and salty
4. R.C.C Pipes 1. There are pipes are most
1. Transportation is difficult
durable with usual life of
2.
Repair work is
difficult
about 75 years
2. The pipes can cast at site 3. Initial cost is high
work and thus there is
4. These pipes are affected by
reduction in transport
charges acids, alkalies and salty
3. Maintenance cost is less waters.
4. Inside surface of pipe can
made smooth
5. No danger of rusting.
5. A.C. Pipes 1. The inside surface of pipes 1. The pipes are brittle and
are very smooth
therefor
e handling is
2. The joining of pipe is very difficult
good and flexible 2. The pipes are not durable
3. The pipes are anticorrosive 3. The pipes cannot be laid in
and cheap in cost exposed places
4. Light in weight and 4. The pipes can be used only
transport is easy for very low pressures
5. The pipes are suitable for
distribution pipes of small
size.
6. Galvanished Iron 1. The pipes are cheap 1. The pipes are affected by

ENVIRONMENTAL ENGINEERING-I
Dept. civil engg. ACE, Bangalore Page 40
pipes 2. Light in weight and easy to acidic or alkaline waters
handle 2. The useful life of pipes is
3. The pipes are easy to jion short about 7 to 10 years.
7. P.V.C. Pipes 1. Pipes are cheap 1. The co-effcient of
2. The pipes are durable
expansion for plastic is
high
3. The pipes are flexible
2. It is difficult to obtain the
4. The pipes are free from
plastic pipes of uniform
corrosion composition
5. The pipes are good electric 3. The pipes are less
insulators
resistance to
heat
6. The pipes are light in weight 4. Sometypes of plastic
and it can easy to mould any impart taste to the water.
shape
Maintenance of pipes
Hygienic quality and adequate flow in the pipe lines are to be maintained, preventive
maintenance of pipes includes the following
1. Detection of leaks in faulty joints ferrule connections, pipes and fittings inside the
consumer premises,
2. Detection of corrosion in pipes, fractures and replacement of these portions
3. The wastage of water 15 to 25% of leakage through pipe joints should be brought
down to the minimum possible extent by adopting suitable preventive measures
4. Cleaning of pipes by flushing and disinfection of pipes
5. Protection against pollution
6. The records of regarding the lengths of pipe laid, length of pipe repaired or replaced,
expenditure incurred, no. of fire hydrants , no. of service connections and all other

ENVIRONMENTAL ENGINEERING-I
Dept. civil engg. ACE, Bangalore Page 41
relevant data inconnection with the distribution system should maintained for ready
reference.
Pipe corrosion – causes and prevention
The term pipe corrosion is used to indicate the loss of pipe material due to action
of water (Internal pipe corrosion) and action of water logged soil above the pipe surface
(external pipe corrosion) by the results of corrosion, troublesome to both the water
authority and consumers. The various factors contributing to the pipe corrosion are
1. Acidity: The water having low PH value due to the presence of carbonic acid or
other acids may cause corrosion
2. Alkanity: The water possessing sufficient calcium bicarbonate alkanilinity is anti-
corrosive in nature
3. Biological action: The growth of iron-bacteria, and sulphur bacteria may develop
aerobic and anaerobic corrosion respectively.
4. Chlorination: The presence of free chlorine or chloramines makes the water
corrosive
5. Electrical currents: Corrosion canals also be developed by the union of dissimilar
metals or by the earthing of electrical system to water pipes.
6. Mineral and organic constituents: The presence of high total solids in water
accelerates the process of corrosion
7. Oxygen: the presence of oxygen is found in both the corrosive and non-corrosive
waters. The aeration infact is employed in some cases for prevention of corrosion.
Effects of pipe corrosion
1. Pipe corrosion may lead to the tuberculation (formation of small projections on
the inside surface of pipe) which decreases carrying capacity of water
2. The pipe corrosion leads to the disintegration of pipeline and it demands heavy
repairs
3. The pipe corrosion imparts colour, taste and odour to the flowing water
ENVIRONMENTAL ENGINEERING-I
Dept. civil engg. ACE, Bangalore Page 42
4. The pipe connections are seriously affected by pipe corrosion
5. The pipe corrosion may make the water dangerous for drinking and other
purposes.
Prevention of pipe corrosion
Pipe corrosion is not possible to completely eleminate but we can minimise by the
following methods.
1. Cathodic protection: By connecting the pipe line to the negative pole of D.C.
generator or to the anode metals like magnesium so that the entire pipe acts as
cathode. This cathodic treatment is most effective. It is expensive and involves
many practical problems
2. Proper pipe material: The alloys of Iron or steel with cromium, copper or nickel
are found to be more resistance
3. Protective Linings: The pipe surface should be coated with asphalt, bitumen,
cement mortar, paints, resins, tar, zinc etc.
4. Treatment of water: By proper treatment and adjustment of PH value, control of
calcium carbonate, removal dissolved oxygen and carbon dioxide, addition of
sodium silicate etc prevent the pipe corrosion.

ENVIRONMENTAL ENGINEERING-I
Dept. civil engg. ACE, Bangalore Page 43
CHAPTER-3
QUALITY OF WATER
Introduction
Absolutely pure water is never found in nature and contains number of impurities
in varying amounts. The rainwater which is originally pure, also absorbs various gases,
dust and other impurities while falling. This water when moves on the ground further
carries salt, organic and inorganic impurities. So this water before supplying to the public
should be treated and purified for the safety of public health, economy and protection of
various industrial process, it is most essential for the water work engineer to thoroughly
check analyse and do the treatment of the raw water obtained the sources, before its
distribution. The water supplied to the public should be strictly according to the standards
laid down from time to time.
Objectives of water quality management
The primary objective of water treatment and purification is to collect water from
best available sources and subject it to processing which will ensure water of good
physical quality , free from unpleasant taste or odour and containing nothing which might
be detrimental to health.It is not possible to find absolutely pure water in nature.
Chemically pure waater is the one which contains two parts of hydrogen and one part of
oxygen. Wtater drops just emitting out of the clouds may be considered as chemically
pure water, but as the drops falls down they absorb some gases and other matter. It is
however not essential to have chemically pure water. Sometimes presence of some
minerals gives good taste to water. Supplies of water may be obtained y drawing directly
upon rivers, lakes or springs. Depending largely upon the souces from which they are
derived, the various waters so obtained may differ greatly in purity and suitability for the
purposes for which they are required. Underground water may contain much matter
dissolved from state through which it passes. Shallow wells are much more prone to
bacterial pollution than are deep wells. Streams and rivers collect impurities from the

ENVIRONMENTAL ENGINEERING-I
Dept. civil engg. ACE, Bangalore Page 44
earth and through the discharge of sewage aand industrial effluents and these are carried
to ponds, lakes and reservoir. In the past, there have been many cases of recurring
epidemics of enteric fevers traceable to drinking water supplies.
Water borne diseases
World health organization has observes that 80% of communicable diseases that
are transmitted through water. The diseases like cholera, gastroenteritis, typhoid,
amoebia, diarrhoea, polio, hepatitis (Jaundice), Leptospirosis, Dracontiasisare caused by
bacteria.
Excess of fluorides present in water [ above 1.5 mg/litre] cause diseases like dental
flurosis, sketetalflurosis. This is a permanent irresible disease that weakens the bone
structure. The patient becomes immobile and bedridden.
Excess of nitrates in water causes Mathaemoglobinaemia or blue baby symptoms in
infants. It effects the hemoglobin in the blood and reduces its capacity to transport
oxygen to the cells. Nitrates in water are caused by industrial effluents, agricultural
runoff. Toxic ions of chromium, lead, arsenic and pesticides in water cause diseases
affecting the kidney, liver and high blood pressure, paralysis, cancer etc. These toxic
substances are due to industrial effluents reaching the surface and ground water sources.
Characteristics of water
For the purpose of classification, the impurities present in water may be divided into the
following three categories.
Physical characteristics
The following are the physical characteristics
1. Turbidity
2. Colour and temperature

ENVIRONMENTAL ENGINEERING-I
Dept. civil engg. ACE, Bangalore Page 45
3. Taste and odour
Turbidity
Turbidity is caused due to presence of suspended and colloidal matter in the
water. The character and amount of turbidity depends upon the type of soil over which
the water has moved ground waters are less turbed than the surface water.Turbidity is a
measure of resistance of water to the passage of light through it. Turbidity is expressed as
NTU (Nephelometric Turbidity Units) or PPM (parts per million) or Milligrams per litre
(mg/l). Turbidity is measured by
1) Turbidity rod or Tape 2) Jacksons Turbidimeter 3) Bali‟s Turbidimeter
The Sample to be tested is poured into a test tube and placed in the meter and units of
turbidity is read directly on the scale by a needle or by digital display. Drinking water
should not have turbidity more than 10 N.T.U. This test is useful in determining the
detension time in settling for raw water and to dosage of coagulants required to remove
turbidity.
1) Turbidity rod or Tape:
Turbidity rod is used for measuring turbidity of water in the field. It consists of a
graduated aluminium rod, about 20.3 cm in length, at the upper end of which is attached a
graduated non-stretchable tape of about 12.2 cm long. At the lower end of the aluminium
rod, a screw containing a platinum needle and a nickel ring is inserted. The graduated
tape has a mark at its top end specifying the position of eye during the test. In order to
find the turbidity, the lower end of the rod is gradually immersed in water whose turbidity
is to be determined. Eye is kept constantly at the marked position and the platinum needle
is watched. The rod is moved slowly in water till the platinum needle just disappears
from the vision due to turbidity of water. The reading of the graduated tape near the water
surface directly gives turbidity in p.p.m. the rod gives only rough value of the turbidity of
water.
ENVIRONMENTAL ENGINEERING-I
Dept. civil engg. ACE, Bangalore Page 46
2. Jacksons Turbidimeter
This is a laboratory apparatus which is used to measure turbidity when it is more
than 100 p.p.m. it consists of a metal stand holding a metal container and a graduated
glass tube in it. A standard candle is placed below the stand. The water sample is poured
in the sample and the image of the flame of the standard candle is seen through the turbid
water in the glass tube. The level of water in the glass tube is gradually increased till the
image of the flame ceases to be seen. The height of the water column, measured in the
graduated glass tube provides the measure of the turbidity of the water. The longer the
light path of 21.5 cm corresponds to 11 JTU while light path of 10.8 cm corresponds to
200 JTU where 1 JTU= 1 p.p.m.
3. Bali‟s Turbidimeter
This is a very accurate and is preferred when the turbidity of the sample is less than 5
units. It consists of a galvanized iron box in which two glass tubes are kept at one end
and a 250 watt bulb with reflector is placed at the other end. One tube contains standard
solution of known turbidity while in the other tube the water sample is kept. The tube is
held firmly in a platform with beveled holes at its bottom end. The tubes are surrounded
on all its four sides by blue cobalt plates and at its bottom by a white opal glass plate.
Because of blue cobalt plates, blue light is cast in both the tubes, and a comparison is
made. If the light differs, another tube containing standard solution of different turbidity
is introduced in the place of the first one till the color in both the tube matched. The
standard solution at this stage give the turbidity of the given water sample. The turbidity
is expressed either as p.p.m or BTU both being equivalent.
Colour and temperature
Colour in water is usually due to organic matter in colloidal condition but some
times it is also due to mineral and dissolved organic impurities. The colour produced by
one milligram of platinum in a litre of water has been fixed as the unit of colour. The

ENVIRONMENTAL ENGINEERING-I
Dept. civil engg. ACE, Bangalore Page 47
permissible colour for domestic water is 20ppm on platinum cobalt scale. The colour in
water is not harmful but objectionable.
Temperature of water is measured by means of ordinary thermometers. The
temperature of surface water is generally at atmospheric temperature, while that of
ground water may be more or less than atmospheric temperature. The most desirable
temperature for public supply between 4.4°C to 10°C. The temperature above 35°C are
unfit for public supply, because it is not palatable.
Taste and odour
Taste and odour in water may be due to presence of dead or live micro-organisms,
dissolved gases such as hydrogen sulphide, methane, carbon dioxide or oxygen combined
with organic matter, mineral substances such as sodium chloride, iron compounds and
carbonates and sulphates of other substances. The tests of these are done by sense of
smell and taste because these are present in such small proportions that it is difficult to
detect them by chemical analysis. The water having bad smell and odour is objectionable
and should not be supplied to the public.
The intensities of the odours are measured in terms of threshold number. This
number is numerically equal to the amount of sample of water in C.C‟s required to be
added to one litre of fresh odourless water.
Chemical characteristics
In the chemical analysis of water, these tests are done that will reveal the sanitary
quality of the water. Chemical tests involve the determination of
1. total solids
2. PH value
3. Hardness of water
4. Chloride content
5. Metal and other chemical substances

ENVIRONMENTAL ENGINEERING-I
Dept. civil engg. ACE, Bangalore Page 48
6. Nitrogen and its compounds
7. Dissolved gases
pH value of water
PH value denotes the concentration of hydrogen ions in the water and it is a
measure of acidity or alkanity of a substance.
PH = - log 10[H+] or 1 / log 10[H
+]
0 1 2 3 4 5 6 7 8 9 10 11 12 13 14
Acidity ← Neutral→ Alkalinity
Depending upon the nature of dissolved salts and minerals, the PH value ranges from 0 to
14. For pure water, PH value is 7 and 0 to 7 acidic and 7 to 14 alkaline range. For public
water supply PH value may be 6.5 to 8.5. The lower value may cause tuberculation and
corrosion; whereas high value may produce incrustation, sediment deposits and other bad
effects.
pH value of water is generally determined by pH papers or by using pH meter. pH can
read directly on scale or by digital display using pH meter.
Measurement of pH:
pH measurement is important since it provides means of classifying and of
correlating other characteristics or behaviors such as corrosive activity or other inter-
related factors controlling biological function in a body of water. Its knowledge is also
helpful in controlling softening and coagulation processes in water treatment. There are
two methods of determing pH value of water: (i) Colourimetric method, and (ii)
Electrometric method
1. Colourimetric method

ENVIRONMENTAL ENGINEERING-I
Dept. civil engg. ACE, Bangalore Page 49
This is probably the most single method in which some indicator is added to the water
sample, and the colour of the solution of known pH value. These standard colours may be
in the form of coloured liquids in glass tubes, coloured glass discs or coloured charts
supplied by the manufacturers, with each indicator. For acidic range, the common
indicators are thymol blue (acid range) bromophenol blue, methyl red and chlorophenol
red. For alkaline range, the common indicators are thymol blue (alkaline range),
phenolphthalein red and toyl red.
2. Electrometric method
In this method, a pH meter is used. The specimen of water is kept in a beaker and
the two electrodes of the instrument are dipped in water connected to a dry cell. The
current passing through the circuit indicates the pH value which is read directly on the
dial. The electrodes commonly used are made of calomel, glass or quinhydrone. In some
of the latest pH meters, the pH value is displayed electronically on the dial, upto second
decimal place of the value.
Total solids and suspended solids
Total solids includes the solids in suspension colloidal and in dissolved form. The
quantity of suspended solids is determined by filtering the sample of water through fine
filter, drying and weighing. The quantity of dissolved and colloidal solids is determined
by evaporating the filtered water obtained from the suspended solid test and weighing the
residue. The total solids in a water sample can be directly determined by evaporating the
filtered water obtained from the suspended solid test and weighing the residue. The total
solids in a water sample can be directly determined by evaporating the water and
weighing the residue of the residue of total solids is fused in a muffle furnace the organic
solids will decompose where as only inorganic solids will remain. By weighing we can
Hardness of water

ENVIRONMENTAL ENGINEERING-I
Dept. civil engg. ACE, Bangalore Page 50
It is a property of water, which prevents the lathering of the soap. Hardness is of two
types.
1. Temporary hardness: It is caused due to the presence of carbonates and sulphates
of calcium and magnesium. It is removed by boiling.
2. Permanent hardness: It is caused due to the presence of chlorides and nitrates of
calcium and magnesium. It is removed by zeolite method.
Hardness is usually expressed in gm/litre or p.p.m. of calcium carbonate in water.
Hardness of water is determined by EDTA method. For potable water hardness ranges
from 5 to 8 degrees.
There are three methods of determining total hardness of water
a. Clarke‟s method
b. Hehner‟s method
c. Versenate method
Clarke‟s method
This method is based on the premise that hardness-producing substances react
with soap and form insolubale compounds before latter is produced. Hence total hardness
is found by determing the standard soap solution required to obtain a permanent lather
with the water sample of known volume with constant shaking. this method has become
obsolete.
Hehner‟s method
in this method the temporary hardness is determined by titration with a standard
solution of sulphuric acid, using methyl orange indicator. To determine the permanenet
hardness, standard sodium carbonate solution is added to the water sample and
evaporated to dryness. The amount of sodium carbonate in excess over that required to
convert the sulphates and chlorides into carbonates gives the permanent hardness.

ENVIRONMENTAL ENGINEERING-I
Dept. civil engg. ACE, Bangalore Page 51
Versenate method
in this method, hardness is determined by titrating against Di-
Ethlenediaminetetraciticacid solution using Eri chrome black T as indicatot at pH 8.5 to
11. For potable water, hardness is objectionable because (i) great deal of soap is required
for washing clothes etc., (ii) scale is formed in boilers and hot water heating systems and
(iii) corrosion and incrustation of pipe lines and plumbing fixtures is promoted.
Chloride content
The natural waters near the mines and sea dissolve sodium chloride and also
presence of chlorides may be due to mixing of saline water and sewage in the water.
Excess of chlorides is dangerous and unfit for use. The chlorides can be reduced by
diluting the water. Chlorides above 250p.p.m. are not permissible in water. Chlorides are
estimated by titration with standard silver nitrate solution using potassium chromate as
indicator. For this 50 c.c. of water sample is taken by a pipette, in a porcelien dish, and
two or three drops of potassium chromate solution is added to the water in the dish. The
water sample is then titrated with standard solution of silver nitrate.
Nitrogen content
The presence of nitrogen in the water indicates the presence of organic matters in
the water. The nitrogen may be present in the water may be in one or more of the
following forms.
1. Nitrates 2. Nitrites 3. Free ammonia 4. Albuminoidal nitrogen.
Excess presence of nitrogen will cause “MATHEMOGLOBINEMIA” disease to the
children.
Nitrate
Nitrate constitutes the final stage in the oxidation of nitrogen compounds, and
normally reaches important concentrations in the final stages of biological oxidation. The

ENVIRONMENTAL ENGINEERING-I
Dept. civil engg. ACE, Bangalore Page 52
nitrate contained in pure well water derived from an extensive catchment is largely the
result of biological activity in the surface layers of the soil, enhanced by cultivation and
the application of manures. When the nitrate in in the excessive amounts, t contributes to
the illness known as infant methemoglobinemia. Nitrate is measured either by reduction
to ammonia or by matching the colours produced with phenoldisulphonic acid.
Nitrites
Nitrite in water is either due to oxidation of ammonium compounds or due to
reduction of nitrate. As an intermediate stage in the nitrogen cycle, it is unstable. A usual
concentration in natural water is in the range of some tenths of mg/L. Higher
concentrations are present in industrial wastes, sewage and in biologically purified
effluents and in polluted streams. In chlorinated supplies, levels of nitrite are often less
than the limit of detection, i.e. 0.005mg/L NO2-N but high levels may occur in
unchlorinated water. Very high nitrite levels are usually associated with water of
unsatisfactory microbiological activity.
2Kr2Hgl4 + NH3 + 3KOH ® (NH2Hg2IO) + 7Kl + 2H2O
Nitrites can be determined by the following methods
1. Colorimeter or spectro-photometer that can be operated at 543nm.
2. Nessler tubes or 100mL capacity volumetric flask.
Sulphanilamide reagent: dissolve 5g sulphanilamide in a mixture of 50mL conc. HCl and
about 300mL water. Dilute to 500mL with water. This solution is stables for many
months.NED-dihydrochloride solution: dissolve in 500mg N-(1-Naphthyl)-
ethylenediaminedihydrochloride in 500mL water. Store in a dark bottle and replace
monthly or immediately when it develops a strong brown colour.Sodium oxalate (0.05N):
dissolve 3.35g Na2C2O4 in water dilute to 1000mL.Stock nitrite solution: dissolve
1.2320 sodium nitrite (NaNO2) in water and dilute to 1000mL; 1mL = 250μg N.Standard
nitrite solution: Dilute appropriate aliquot of stock nitrite solution to 1000mL with

ENVIRONMENTAL ENGINEERING-I
Dept. civil engg. ACE, Bangalore Page 53
distilled water so that 1mL = 0.5 μg N in the solution. If sample contains suspended
solids, filter through a 0.45 mm pore diameter membrane filter.To 50mL clear sample
neutralized to pH 7 or to a portion diluted to 50mL, add 1mL sulfanilamide solution. Let
reagent react for 2 to 8 min.Add 1.0mL NED dihydrochloride solution and mix
immediately. Measure absorbance after 10 min but before 2 h at 543 nm.Prepare blank in
the same way substituting water for the sample.
Free ammonia
Ammonia is produced by the microbiological degradation of organic nitrogenous
matter. It appears, therefore, in many groundwaters as well as surface waters.
Concentrations of ammonia above a certain level in water polluted either due to sewage
or industrial waste is toxic to fish. The proportions of the two forms of ammonia nitrogen
in surface water depend on pH. For accurate results, it is generally preferable to distill off
ammonia from the sample, and absorb in boric acid. It is then determined either by
titration or colorimetrically using Nessler reagent. Direct nesslerisation of the sample is
quicker depending upon interference. Ammonia produces a yellow coloured compound
when reacts with alkaline Nessler reagent, provided the sample is clarified properly.
Pretreatment with ZnSO4 and NaOH precipitates Ca, Fe, Mg and sulphide and removes
turbidity and apparent colour. Addition of EDTA (Before Nessler reagent) or Rochelle
salt solution prevents precipitation of residual Ca and Mg in the presence of alkaline
Nessler reagent. The chemical reaction of the method is given below:
Zinc sulphate: dissolve 10g ZnSO4.7H2O in distilled water and dilute to 100mL.Sodium
hydroxide, 6N: dissolve 24g NaOH and dilute to 100mL.EDTA reagent: dissolve 50g
EDTA in 60mL water containing 10g NaOH. Cool and dilute to 100mL.Rochelle salt
solution: dissolve 50g potassium sodium tartarate in 100mL. Remove ammonia by
boiling off 30mL solution, cool and dilute to 100mL.Nessler reagent: mix well 100g Hgl2
and 70g Kl. Dissolve in small quantity of water. Add this mixture to a cooled solution of
160g NaOH in 500mL water. Dilute to 1000mL. Keep overnight, store supernatant in
colouredbottle.Standard ammonium solution: dissolve 3.819g NH4Cl dried at 100°C in

ENVIRONMENTAL ENGINEERING-I
Dept. civil engg. ACE, Bangalore Page 54
distilled water and dilute to 1000mL. Dilute 10mL of the solution to 1000mL. 1mL =
10μg NH3. Take 100mL of sample. Add 1 mL ZnSO4 solution and 0.4 or 0.5 mL NaOH
to obtain the pH of 10.5. Allow to settle and filter the supernatant through 42 No.
Whatman filter paper.Take suitable aliquot of sampleAdd 3 drops of Rochelle salt
solution or 1 drop of EDTA mix well.Add 3mL Nessler reagent if EDTA is used or 1mL
if Rochelle salt solution is used. Make up to 100mL.Mix well and read percent
transmission after 10 minutes at 410nm using a blank prepared in the same way by taking
distilled water instead of sample.
Metals and other chemical substances
Water contains various minerals or metal substances such as iron, manganese,
copper, lead, barium, cadmium, selenium, fluoride, arsenic etc.The concentration of iron
and manganese should not allow more than 0.3 ppm . Excess will cause discolouration of
clothes during washing and incrustation in water mains due to deposition of ferric
hydroxide and manganese oxide. Lead and berium are very toxic, low p.p.m of these are
allowed. Arsenic, Selenium are poisonous and may cause totally, therefore they must be
removed totally. Human beings are effected by presence of high quality of copper in the
water. Fewer cavities in the teeth will be formed due to excessive presence of fluoride in
water more than 1 p.p.m. A laxative effect is caused in the human body due to excessive
presence of sulphate in the water.
Dissolved gases
oxygen and carbondi-oxide are the gases mostly found in the natural water. The
surface water contain large amount of dissolved oxygen because they absorb it from the
atmosphere. Algae and other tiny plant life of water also give oxygen to the water. The
presence of oxygen in the water in dissolved form keep it fresh and sparkling. But more
quantity of oxygen causes corrosion to the pipes material.
Water absorbs carbon-dioxide from the atmosphere. If water comes across calcium and
magnesium salts, carbon-dioxide reacts with the salts and converts them into

ENVIRONMENTAL ENGINEERING-I
Dept. civil engg. ACE, Bangalore Page 55
bicarbonates, causes hardness in the water. The presence of carbon-dioxide is easily
determined by adding lime solution to water gives milky white colour.
Bio-chemical oxygen demand
If the water is contaminated with sewage, the demand of oxygen by organic
matter in sewage is known as biochemical oxygen demand. The aerobic action continues
till the oxygen is present in sewege. As the oxygen exhausts the anerobic action begins
due to which foul smell starts coming. Therefore indirectly the decomposable matters
require oxygen, which is used by the organisms. The aerobic decomposition of organic
matters is done in two stages. The carbonaceous matters are first oxidized and the
oxidation of nitrogeneous matters takes place in the latter stage. The Biochemical
Oxygen Demand (BOD) is an empirical standardized laboratory test which measures
oxygen requirement for aerobic oxidation of decomposable organic matter and certain
inorganic materials in water, polluted waters and wastewater under controlled conditions
of temperature and incubation period. The quantity of oxygen required for above
oxidation processes is a measure of the test. The test is applied for fresh water sources
(rivers, lakes), wastewater (domestic, industrial), polluted receiving water bodies, marine
water (estuaries, coastal water) and also for finding out the level of pollution, assimilative
capacity of water body and also performance of waste treatment plants.
This test measures the oxygen utilised for the biochemical degradation of organic
material (carbonaceous demand) and oxidation of inorganic material such as sulphides
and ferrous ions during a specified incubation period. It also measures the oxygen used to
oxidize reduced forms of nitrogen (nitrogenous demand) unless their oxidation is
prevented by an inhibitor. Temperature effects are held constant by performing a test at
fixed temperature. The methodology of BOD test is to compute a difference between
initial and final Do of the samples incubation. Minimum 1.5 L of sample is required for
the test. DO is estimate by iodometric titration.

ENVIRONMENTAL ENGINEERING-I
Dept. civil engg. ACE, Bangalore Page 56
Since the test is mainly a bio-assay procedure, it is necessary to provide standard
conditions of temperature, nutrient supply, pH (6.5-7.5), adequate population of
microorganisms and absence of microbial-growth-inhibiting substances. The low
solubility of oxygen in water necessitates strong wastes to be diluted to ensure that the
demand does not increase the available oxygen. A mixed group of microorganisms
should be present in the sample; otherwise, the sample has to be seeded. Generally,
temperature is controlled at 20ºC and the test is conducted for 5 days, as 70 to 80% of the
carbonaceous wastes are oxidized during this period. The test can be performed at any
other temperature provided the correlation between BOD5 20ºC is established under
same experimental condition (for example BOD5, 27ºC) is equivalent to BOD3, 27ºC)
for Indian conditions. While reporting the results, the incubation period in days and
temperature in ºC is essential to be mentioned
Equipment and apparatus
a.BOD bottles 300mL capacity (clean with a detergent, rinse thoroughly and drain before
use) with a water seal.
b.Incubator or water-bath to be controlled at 20ºC or at any desired temperature 1ºC.
Exclude all light to prevent photosynthetic production of DO.
All reagents listed in DO estimation are used for BOD. In addition following reagents are
required:
.Phosphate buffer: Dissolve 8.5g KH2PO4, 21.75g K2HPO4, 33.5g Na2HPO4.7H2O and
1.7g NH4C; in distilled water and dilute to 1000mL. The pH should be 7.2without further
adjustment. Discard reagent if there is any sign of biological growth.
b.Magnesiumsulphate: Dissolve 22.5g MgSO4.7H2O in about 700mL of distilled water
and dilute to 1 Litre.
c.Calcium chloride: Dissolve 27.5g anhydrous CaCl2 in about 7000mL of distilled water
and dilute to 1 Litre.

ENVIRONMENTAL ENGINEERING-I
Dept. civil engg. ACE, Bangalore Page 57
d.Ferric chloride: Dissolve 0.25g FeCl3.6H2O in about 700mL of distilled water and
dilute to 1 L.
e.Sodiumsulphate solution 0.025N: Dissolve 1.575g Na2SO3 in distilled water and dilute
to 1000mL. Solution should be prepared daily.
f.Acid and Alkali solutions 1N: Prepare 1N H2SO4 and 1N NaOH or neutralization of
caustic or acidic sample
g.Nitrification inhibitor: 2-chloro-6-(trochloromethyl) pyridine [Nitrification inhibitor
2570-24 (2.2% TCMP), Hach Co. equivalent]
h.Glucose-glutamic acid solution: Dry reagent grade glucose and glutamic acid at 103ºC
for 1h. Dissolve 150 mg glucose and 150mg glucose acid in distilled water and dilute to
1000mL. Prepare fresh immediately before use.
Preparation of dilution water:
a.The source of dilution water may be distilled water, tap or receiving-stream water free
of biodegradable organics and bioinhibitory substances such as chlorine or heavy metals.
b.Aerate the required volume of dilution water in a suitable bottle by bubbling clean-
filtered compressed air for sufficient time to attain DO saturation at room temperature or
at 20ºC/27ºC. Before use stabilise the water at 20ºC/27ºC.
c.Add 1mL each of phosphate buffer, magnesium sulphate, calcium chloride and ferric
chloride solutions in that order for each Litre of dilution water. Mix well. Quality of
dilution water may be checked by incubating a BOD bottle full of dilution water for 5
days at 20ºC for 3 days at 27ºC. DO uptake of dilution water should not be more than
0.2mg/L and preferable not more than 0.1mg/L.
d.For wastes which are not expected to have sufficient microbial population, seed is
essential. Preferred seed is effluent from a biological treatment system. Where this is not
available, supernatant from domestic wastewater (domestic sewage) settled at room

ENVIRONMENTAL ENGINEERING-I
Dept. civil engg. ACE, Bangalore Page 58
temperature for at least 1h but not longer than 36hours is considered sufficient in the
proportion 1-2mL/L of dilution water. Adopted microbial population can be obtained
from the receiving water microbial population can be obtained from the receiving water
body preferably 3-8 km below the point of discharge. In the absence of such situation,
develop an adapted seed in the laboratory.
e.Determine BOD of the seeding material. This is seed control. From the value of seed
control determine seed DO uptake. The DO uptake of seeded dilution water should be
between 0.6mg/L and 1mg/L.
Sample preparation:
a.Neutralise the sample to pH 7, if it is highly acidic or alkaline.
b.The sample should be free from residual chlorine. If it contains residual chlorine
remove it by using Na2S2O3 solution as described below.
c.Take 50mL of the sample and acidify with addition of 10mL 1 + 1 acetic acid. Add
about 1g Kl. Titrate with 0.025N Na2S2O3, using starch indicator. Calculate the volume
of Na2S2O3 required per Litre of the sample and accordingly add to the sample to be
tested for BOD.
d.Certain industrial wastes contain toxic metals, e.g. planting wastes. Such samples often
require special study and treatment.
e.Bring samples to 20 ± 1ºC before making dilutions.
f.If nitrification inhibition is desired, add 3mg 2-chloro-6-(trichloromethyl) pyridine
(TCMP) to each 300mL bottle before capping or add sufficient amount to the dilution
water to make a final concentration of 30mg/L. Note the use of nitrogen inhibition in
reporting results.
g.Samples having high DO contents, DO ≥ 9mg/L should be treated to reduce the DO
content to saturation at 20ºC. Agitate or aerate with clean, filtered compressed air.

ENVIRONMENTAL ENGINEERING-I
Dept. civil engg. ACE, Bangalore Page 59
Dilution of sample: Dilutions that result in a residual DO of at least 1mg/L and DO
uptake of at least 2mg/L produce reliable results. Make several dilutions of the pre-
treated sample so as to obtain about 50% depletion of DO or DO uptake of 2mg/L.
Prepare dilutions as follows
Siphon out half the required volume of seeded dilution water in a graduated cylinder or
volumetric flask without entraining air. Add the desired quantity of mixed sample and
dilute to the appropriate volume by siphoning dilution water. Mix well with plunger type
mixing rod to avoid entraining air.
General guidelines for dilution range are as follows:
0.1% to 1% : Strong trade waste
1% to 5% : Raw or settled sewage
5% to 25% : Treated effluent
25% to 100% : River water
Sample processing:
a.Siphon the diluted or undiluted sample in three labeled bottles and stopper immediately.
b.Keep 1 bottle for determination of the initial DO and incubate 2 bottles at 20ºC for
3days. See that the bottles have a water seal.
c.Prepare a blank in triplicate by siphoning plain dilution water (without seed) to measure
the O2 consumption in dilution water.
d.Also prepare a seed blank in triplicate to measures BOD of seed for correction of actual
BOD.
E.Determine DO in a BOD test can in the blank on initial day and end of incubation
period by Winkler method as described for DO measurement.

ENVIRONMENTAL ENGINEERING-I
Dept. civil engg. ACE, Bangalore Page 60
f.DO estimation in a BOD test can also be done by membrane electrodes. A DO probe
with a stirrer is used to determine initial and final DO after incubation in BOD samples.
The semi-permeable membrane provided in the DO probe acts as a diffusion barrier
against impurities between sensing element and sample.
10.6 Calculations
Calculate BOD of the sample as follows:
a. When dilution water is not seeded
BOD as O2 mg/L = (D1 –D2) x 100/% dilution
b.When dilution is seeded
BOD O2 mg/L =(D1 – D2) – (B1 –B2) x 100/% dilution
c.When material is added to sample or to seed control
BOD O2 mg/L = (D1 – D2) – (B'1 x B'2) x F x 100/% dilution
where,
D1 = DO of sample immediately after preparation, mg/L
D2 = DO of sample after incubation period, mg/L
B1 = DO of blank (seeded dilution water) before incubation, mg/L
B2 = DO of blank (seeded dilution water) after incubation, mg/L
F = ration of seed in diluted sample to seed in seed control (Vol. Of seed in diluted
sample / Vol. of seed in seed control)
B'1 = DO of seed control before incubation, mg/L
B'2 = DO of seed control after incubation, mg/L
In calculations, do not make corrections for DO uptake in dilution water
Chemical Oxygen Demand (COD

ENVIRONMENTAL ENGINEERING-I
Dept. civil engg. ACE, Bangalore Page 61
Chemical Oxygen Demand (COD) test determines the oxygen requirement
equivalent of organic matter that is susceptible to oxidation with the help of a strong
chemical oxidant. It is an important, rapidly measured parameters as a means of
measuring organic strength for streams and polluted water bodies. The test can be related
empirically to BOD, organic carbon or organic matter in samples from a specific source
taking into account its limitations. The test is useful in studying performance evaluation
of wastewater treatment plants and monitoring relatively polluted water bodies. COD
determination has advantage over BOD determination. COD results can be obtained in 3-
4 hrs as compared to 3-5days required for BOD test. Further, the test is relatively easy,
precise, and is unaffected by interferences as in the BOD test. The intrinsic limitation of
the test lies in its inability to differentiate between the biologically oxidisable and
biologically inert material and to find out the system rate constant of aerobic biological
stabilization.
Principle
The open reflux method is suitable for a wide range of wastes with a large sample
size. The dichromate reflux method is preferred over procedures using other oxidants
(e.g. potassium permanganate) because of its superior oxidizing ability, applicability to a
wide variety of samples and ease of manipulation. Oxidation of most organic compounds
is up to 95-100% of the theoretical value.
The organic matter gets oxidised completely by potassium dichromate (K2Cr2O7) with
silver sulphate as catalyst in the presence of concentrated H2SO4 to produce CO2 and
H2O. The excess K2Cr2O7 remaining after the reaction is titrated with ferrous ammonium
sulphate [Fe (NH4)2(SO4)2]. The dichromate consumed gives the oxygen (O2) required
for oxidation of the organic matter. The chemical reactions involved in the method are as
under:
a.2K2Cr2O7 + 8 H2SO4 ® 2 K2 SO4 + 2Cr2(SO4)3 + 8 H2O + 3O
b.C6H12O6 + 6O2 ® 6CO2 + 6H2O

ENVIRONMENTAL ENGINEERING-I
Dept. civil engg. ACE, Bangalore Page 62
c.Cr2O7-- + 6Fe++ + 14H+ ® 6Fe+++ + 2Cr3+ + 7H2O
Apparatus and equipment
a.250 or 500mL Erlenmeyer flask with standard (24/40) tapered glass joints
bFriedrich‟s reflux condenser (12 inch) with standard (24/40) tapered glass joints
c.Electric hot plate or six-unit heating shelf
d.Volumetric pipettes (10, 25, and 50mL capacity)
e.Burette, 50mL with 0.1mL accuracy
f.Burette stand and clamp
g.Analytical balance, accuracy 0.001g
h.Spatula
i.Volumetric flasks (1000mL capacity)
j.Boiling beads, glass
k.Magnetic stirrer and stirring bars.
Reagents and standards
a.Standard potassium dichromate solution, 0.25N (0.04167 M): Dissolve 12.259g
K2Cr2O7 dried at 103°C for 24h in distilled water and dilute to 1000mL. Add about
120mg sulphamic acid to take care of 6 mg/L NO2 – N.
b.Sulphuric acid reagent: Add 10g of Ag2SO4 to 1000mL concentrated H2SO4 and let
stand for one to two days for complete dissolution.
ENVIRONMENTAL ENGINEERING-I
Dept. civil engg. ACE, Bangalore Page 63
c.Standard ferrous ammonium sulphate approx. 0.25N (0.25M): Dissolve 98g
Fe(NH4)2(SO4)2.6H2O in about 400mL distilled water. Add 20mL concentrated H2SO4
and dilute to 1000mL.
d.Ferroin indicator: Dissolve 1.485g 1, 10-phenanthroline monohydrate and 695mg
FeSO4.7H2O in distilled water and dilute to 100mL.
e.MercuricSulphates: HgSO4, crystals, analytical grade
f.Potassium hydrogen phthalate (KHP) Standard: Dissolve 425mg lightly crushed dried
potassium hydrogen phthalate (HOOC.C6H4.COOK) in distilled water and dilute to
1000mL. This solution has a theoretical COD of 500μg O2/mL. This solution is stable
when refrigerated, up to 3 months in the absence of visible biological growth.
Procedure
Sample preparation: All samples high in solids should be blended for 2 minutes at
high speed and stirred when an aliquot is taken for analysis. Select the appropriate
volume of sample based on expected COD range, e.g. for COD range of 50-500 mg/L
take 25-50mL of sample. Sample volumeless than 25mL should not be pipetted directly,
but serially diluted and then a portion of the diluted sample taken. Dilution factor should
be incorporated in calculations.
a.500mL of sample diluted to 1000mL = 0.5mL sample/mL of diluent, 50mL = 25mL of
sample.
b.100mL of sample diluted to 1,000mL = 0.1mL sample/mL diluent, 50mL of diluent =
5mL of sample.
Reflux of samples:
a.Place 0.4g HgSO4 in a 250mL reflux sample
ENVIRONMENTAL ENGINEERING-I
Dept. civil engg. ACE, Bangalore Page 64
b.Add 20mL sample or an aliquot of sample diluted to 20mL with distilled water. Mix
well.
c.Add clean pumic stones or glass beads.
d.Add 10mL 0.25N (0.04167M) K2Cr2O7 solution and mix.
e.Add slowly 30mL concentrated H2SO4 containing Ag2SO4 mixing thoroughly. This
slow addition along with swirling prevents fatty acids to escape due to generation of high
temperature. Alternatively attach flask to condenser with water flowing and then add
H2SO4 slowly through condenser to avoid escape of volatile organic substance due to
generation of heat.
f.Mix well. If the colour turns green, either take fresh sample with lesser aliquot or add
more potassium dichromate and acid.
g.Connect the flask to condenser. Mix the contents before heating. Improper mixing will
result in bumping and blow out of flask content.
h.Reflux for a minimum of 2 hours. Cool and then wash down condenser with distilled
water.
i.Disconnect reflux condenser and dilute the mixture to about twice its volume with
distilled water. Cool to room temperature and titrate excess K2Cr2O7 with0.1M FAS
using 2-3 drops of ferroin indicator. The sharp colour change from blue green to reddish
brown indicates end-point or completion of the titration. After a small time gap, the blue-
green colour may reappear. Use the same quantity of ferroin indicator for all titrations.
j.Reflux blank in the same manner using distilled water instead of sample.
Alternate procedure for low COD samples less than 50mg/L: Follow similar procedure
with two exceptions (i) use standard 0.025N (0.004167M) K2Cr2O7 and (ii) titrate with
standardize 0.025M FAS. The sample volume should be 5.mL. Exercise extreme care
with this procedure because even a trace of organic matter on the glassware or from the
ENVIRONMENTAL ENGINEERING-I
Dept. civil engg. ACE, Bangalore Page 65
atmosphere may cause gross errors. Compute amount of HgSO4 to be added based on
chloride concentrations. Carry blank reagent through the same procedure.
Calculations
COD as mg/L = (a –b) x N x 8000 / mL sample
Where, a = mL FAS used for blank
b = mL FAS used for sample
N = normality of FAS
8000 = Milieq. wt. of O2 x 1000
BACTERIAL AND MICROSCOPICAL CHARACTERISTICS
The examination of water for the presence of bacteria is important for the water
supply engineer from the viewpoint of public health. The bacteria may be harmless to
mankind or harmful to mankind. The former category is known as non-pathogenic
bacteria and the later category is known as pathogenic bacteria. Many of the bacteria
found in water are derived from air, soil and vegetation. Some of these are able to
multiply and continue their existence while the remaining die out in due course of time.
The selective medium that promote the growth of particular bacteria and inbuilt the
growth of other organisms is used in the lab to detect the presence of the required
bacteria, usually coliform bacteria. For bacteriological analysis the following tests are
done.
Plate count test
In this method total number of bacteria presents in a millitre of water is counted. 1
ml of sample water is diluted in 99ml of sterilized water and 1ml of dilute water is mixed
with 10ml of agar of gelatine. This mixture is then kept in incubator at 37°C for 24 hours
or 20°C for 48 hours. After the sample will be taken out from the incubator and colonies

ENVIRONMENTAL ENGINEERING-I
Dept. civil engg. ACE, Bangalore Page 66
of bacteria are counted by means of microscope.Drinking water should not have more
than 10 coliforms/100ml
Multiple tube fermentation technique for coliform bacteria (MPN test):
In the multiple-tube method, a series of tubes containing a suitable selective broth
culture medium (lactose-containing broth, such as MacConkey broth) is inoculated with
test portions of a water sample. After a specified incubation time at a given temperature,
each tube showing gas formation is regarded as “presumptive positive” since the gas
indicates the possible presence of coliforms. However, gas may also be produced by
other organisms, and so a subsequent confirmatory test is essential. The two tests are
known respectively as the presumptive test and the confirmatory test.
For the confirmatory test, a more selective culture medium (brilliant green bile broth) is
inoculated with material taken from the positive tubes. After an appropriate incubation
time, the tubes are examined for gas formation as before. The most probable number
(MPN) of bacteria present can then be estimated from the number of tubes inoculated and
the number of positive tubes obtained in the confirmatory test. Using specially devised
statistical tables. This technique is known as the MPN method
Equipment and supplies:
1. Culture tubes containing inverted vials (Durham tubes): each tube should be large
enough for a vial, completely filled with medium, to be submerged in it.
2. Gas burner: a Bunsen or similar burner is adequate
3. Inoculation loop and holder: lengths of 2 or 26 gauge wire (7.5-10 cm) should be
used. Nichrome wire is acceptable, but platinum-iridium is better. The wire is set
in a handle made of metal or glass, of diameter similar to that of a pencil. To
make the inoculation loop, the wire is bent to form a circle 3-4 mm in diameter.
4. Clearing and maintenance equipment: items such as brushes for cleaning tubes,
bottles, etc., a waste bin, and a tool kit are required.

ENVIRONMENTAL ENGINEERING-I
Dept. civil engg. ACE, Bangalore Page 67
5. Safety equipment: there should be an adequate first-aid and a fire extinguisher or
other means of fire control in every laboratory.
The following consumable items are required:
Culture media / Reagents: the following culture media and reagents are required
-MacConkey Broth with neutral red (double strength)
-MacConkey Broth with neutral red (single strength)
-Brilliant Green Blue broth (BGB)
-Tryptone water/Peptone water (for indole test)
-Kovac‟s Reagent
6. Laboratory disinfectant: for cleaning laboratory surfaces and the pipette discard bin.
7.Detergent: for washing glassware, etc
8. Sodium thiosulphate solution: required when chlorinated supplies are
tested. Sodium thiosulphate neutralizes any residual chlorine in samples at
the time of collection, preventing it from acting on any micro-organisms
present in water samples.
9. Autoclave tape
Culture media preparation
Commercially available dehydrated media simplify the preparation of culture broths and
are therefore recommended for laboratory work. Various manufacturers produce these
media as powders, which can then be easily weighed, dissolved in distilled water, and
dispensed into culture tubes before sterilization.
Preparation of media: Media should be prepared in accordance with the manufacturer‟s
instruction, as follows:

ENVIRONMENTAL ENGINEERING-I
Dept. civil engg. ACE, Bangalore Page 68
a.Dissolve the stated amount of the dehydrated medium in distilled water to obtain the
double-strength or single-strength presumptive medium (MacConkey broth). The
confirmatory medium (BGB) is required only in single-strength.
b.Dispense the requisite volume into culture tubes containing an inverted Durham tube,
and cap the culture tubes; simple cotton plugs may be used or more ideally metal slip-on
caps may be used to cap the tubes.
c.Sterilise in an autoclave at 115ºC for 10 minutes (or in accordance with the
manufacturer‟s specifications). It is particularly important that media containing
disaccharides, e.g. lactose, are not autoclave at higher temperatures.
d.The sterilized medium may be stored at room temperature (approximately 25ºC) or,
ideally, at 2-8ºC. Media should in any case be warmed to room temperature before use to
ensure that all components have re-dissolved. In addition, since several dyes are light
sensitive, the solution should be protected form exposure to light.
Procedure for inoculation of samples: The procedure to be used for testing relatively
unpolluted water, such as treated water from waterworks or distribution system or end
user‟s tap.
Note down the details of the sample collected (from the label on the bottle) in the
register.
a.With the stopper in position, shake the bottle vigorously to achieve a homogeneous
dispersion of bacteria. (If the bottle is completely full, remove the stopper and discard
about 20-30 mL of water; then replace the stopper and shake. This ensures thorough
mixing).
b.Add 50 mL of sample to a tube / flask containing 50 mL of presumptive broth (double
strength). With a sterile 10 mL pipette, inoculate 10 mL of the sample into each the five
tubes containing 5 mL presumptive broth (single strength). It is advisable to shake the

ENVIRONMENTAL ENGINEERING-I
Dept. civil engg. ACE, Bangalore Page 69
tubes gently to distribute the sample uniformly throughout the medium. Be careful as to
not shake so hard that air is introduced into the inverted tubes.
c.Incubate the tubes at 35º C ± 5ºC for 24 hours.
d.At the end of the 24-hour incubation period, examine each tube for the presence of gas.
If present, gas can be seen in the Durham tube. If none is visible, gently shake the tube; if
any effervescence (streams of tine bubbles) is observed, the tubes should be considered
positive.
e.Record the number of positive tubes after 24 hours.
f.Re-incubate negative tubes for a further 24-hour period. At the end of this period, check
the tubes again for gas production as in 5 above. Gas production at the end of either 24 or
48 hours‟ incuba-tion is presumed to be due to the presence of coliforms in the sample.
g.Record the number of positive tubes after 48 hours.
h.The confirmatory test should be carried out at the end of both the 24-hour and the 48-
hour incubation. Using a sterile loop, transfer one or two loops-full from each
presumptive positive tube into tow tubes containing respectively confirmatory broth
(BGB) and tryptone water. (Sterilise the inoculation loop before each transfer by flaming
and allow cooling). To confirm the presence of thermotolerant coliforms, incubate the
subculture tubes from each presumptive positive tube for 24 hours at 44.5 ± 0.5ºC.
[Alternatively, transfer a loopful of a positive MacConkey broth tube into BGB medium
and incubate at 35ºC for 24-48 hours. This will be a better confirmation of Total
Coliforms.]
i.At the end of 24 hours‟ incubation, examine each broth tube for growth and the
presence of gas in the Durham tube. Record the results, as done previously.

ENVIRONMENTAL ENGINEERING-I
Dept. civil engg. ACE, Bangalore Page 70
j.To each tube of tryptone water, add approximately 0.1 mL of Kovacs reagent and mix
gently. The presence of indole is indicated by a red colour in the Kovacs reagent, forming
a film over the aqueous phase of the medium.
k.Confirmatory tests positive for indole, growth, and gas production show the presence of
E.
Membrane filtration method for total coliform and thermotolerant (faecal)
coliforms
Principle: The method is based on the filtration of a known volume of water through a
membrane filter consisting of a cellulose compound with a uniform pore diameter of 0.45
or 0.2 μm; the bacteria are retained on the surface of the membrane filter. When the
membrane containing the bacteria is incubated in a sterile container at an appropriate
temperature with a selective differential culture medium, characteristic colonies of
coliforms/ thermotolerant coliforms develop, which can be counted directly. In contrast
to the multiple-tube method, the membrane-filtration method gives as a direct count of
total coliforms and thermotolerant coliforms present in a given sample of water Volume
of water sample for filtration: Since the filtration area is relatively small, it can support
the growth of only a limited number of colonies: the optimum number is between 20 and
80, with a maximum of 200. If this figure is exceeded, very small atypical colonies or
superimposed colonies may develop, or there may be growth inhibition due to
overpopulation. The choice of the volume of sample to be filtered will depend on the type
of water.
Volumes less than 10 mL should be added to the filtration apparatus after addition of at
least 10 mL of sterile diluent to ensure adequate dispersal across the surface of the
membrane filter.
Equipment and glassware: In addition to the basic equipment and glassware used in the
multiple-tube method, the following items are needed for the membrane-filtration
technique.

ENVIRONMENTAL ENGINEERING-I
Dept. civil engg. ACE, Bangalore Page 71
1. Membrane-filtration apparatus: including an electric or hand-powdered vacuum
pump, a vacuum flask (e.g. an Erlenmeyer side-arm flask), and a filter support.
One such commercially available filter assemble is shown below to illustrate the
various components.
2. Residual Petri dishes: made from glass or metal (disposable plastic Petri dishes
may also be used).
3. Blunt-ended forceps: For safe handling of filter membranes handle membrane
filters without damage using highly polished stainless steel forcep blades with
beveled, unserrated tips. Sterilise by autoclaving or by flaming.
4. Reusable (autoclavable) bottles: for culture media (e.g. / 25 mL polypropylene
bottles).
5. A magnifying lens: with 34 or 35 magnification for examining and counting the
colonies on the membrane filters. Alternatively, a colony counter (such as Quebec
Colony Counter) may also be used.
6. A boiling bath / pan: if filtration apparatus is to be disinfected in boiling water
between analyses.
7. Sterile pipettes: 1 mL and 10 mL
8. A graduated cylinder: 100 mL
9. In addition to the consumables needed for the MPN, the following are required:
10. Membrane filters: 47 mm in diameter, with a pore diameter of 0.45 μm. Singly
packed, presterilised membrane filters are very convenient. Unsterilised
membrane filters can also be used, however, and should bee wrapped in paper
packets in convenient numbers (depending on the number of water samples to be
tested). These can then be sterilized in the autoclave and dried by rapid exhaustion
of the steam.
11. Nutrient absorbent pads: These are essentially filter-paper discs about 1 mm thick,
with the same diameter as the membrane filters. They are available with suitable
dispensers which help in rapidly dispensing large numbers of pads without
individual forceps-handling and hence reduce contamination risks.

ENVIRONMENTAL ENGINEERING-I
Dept. civil engg. ACE, Bangalore Page 72
12. Culture media: different types are available
13. Wax pencils: for labeling Petri dishes
14. Polythene bags: for wrapping Petri dishes if a dry incubator is used, to prevent
drying of the sample and media
Culture media and dilution water: Various media can be used for the examination of
coliform organisms by the membrane-filtration method. Of these, lactose Tergitol agar,
lactose TTC Tergitol agar and membrane lauryl sulfate lactose broth may be used for
coliform organisms at 35 or 37ºC and for thermotolerant coliform organisms at 44ºC or
44.5ºC. Membrane faecal coliform (MFC) broth should be used only at 44 or 44.5ºC for
thermotolerant coliform counts. Although the use of all these media for the detection of
presumptive coliform organisms is based on the fermentation of lactose, the characteristic
reaction varies with each medium (Table 3.3: IV and 3.3: V). It is common to confirm
sheen colonies from mENDO by inoculating confirmatory broth media with colonies.
Your might require technician to swab the filter surface with a sterile cotton swab and use
this to inoculate MacConkey, BGB and EC broths.
Procedure:
The procedure generally used is described here, but different types of filtration units and
equipment exist.
a.Connect the Erlenmeyer (side-arm) flask to the vacuum source (turned off) and place
the porous support in position. If an electric pump is used, it is advisable to put a second
flask between the Erlenmeyer flask and the vacuum source; this second flask acts as a
water trap, and thus protects the electric pump.
b.Open a sterile Petri dish and place a sterile absorbent pad in it.
c.Add broth medium to saturate the pad; remove excess broth.

ENVIRONMENTAL ENGINEERING-I
Dept. civil engg. ACE, Bangalore Page 73
d.Place a sterile 47 mm dia. membrane filter on the porous support surface or screen,
using blunt forceps sterilised by flaming. The gridded surface should be if you are using
gridded membrane filter. Assemble the filter unit in the order shown in.
e.Place the upper container in position and secure it. The type of clamp used will depend
on the type of equipment.
f.Pour the volume of sample chosen as optimal for the types of water into the upper
container. If the test sample is less than 10 mL, at least 20 mL of sterile dilution water
should be added to the top container before filtration. Apply the vacuum.
g.Take the filtration unit apart and, using the sterile forceps, place the membrane filter in
the Petri dish on the pad with the grid side up. Make sure that no air bubbles are trapped
between the pad and the filter.
h.Leave the Petri dish at room temperature or at 35 or 37ºC for 2-4 hours, for
resuscitation of stressed microbes.
i.Place the dishes in an incubator at 44 ± 0.5ºC for 18-24 hours with 100% humidity.
Alternatively, tight-fitting or sealed petri dishes may be placed in waterproof plastic bags
for incubation.
j.Place the dishes in an incubator at 44 ± 0.5ºC for 18-24 hours with 100% humidity.
Alternatively, tight-fitting or sealed petri dishes may be placed in waterproof plastic bags
for incubation.
k.Submerge the bags in a water-bath maintained at 44 ± 0.5ºC for 18-24 hours. The
plastic bags must be below the surface of the water throughout the incubation period.
They can be held down by means of a suitable weight, e.g. a metal rack.
The colonies of coliform/thermotolerant coliform bacteria should be identified from their
characteristics on the medium used. The number of coliforms/thermotolerant coliforms
per 100 mL is then given by:

ENVIRONMENTAL ENGINEERING-I
Dept. civil engg. ACE, Bangalore Page 74
Coliform / thermotolerant coliforms per 100 mL
= [(No. of coliforms/thermotolerant coliform colonies counted) / (no. of mL of sample
filtered) x 100
WATER BORNE DISEASES
World health organization has observes that 80% of communicable diseases that
are transmitted through water. The diseases like cholera, gastroenteritis, typhoid,
amoebia, diarrhoea, polio, hepatitis (Jaundice), Leptospirosis, Dracontiasis are caused by
bacteria.Excess of fluorides present in water [ above 1.5 mg/litre] cause diseases like
dental flurosis, sketetalflurosis. This is a permanent irresible disease that weakens the
bone structure. The patient becomes immobile and bedridden.
Excess of nitrates in water causes Mathaemoglobinaemia or blue baby symptoms in
infants. It effects the hemoglobin in the blood and reduces its capacity to transport
oxygen to the cells. Nitrates in water are caused by industrial effluents, agricultural
runoff. Toxic ions of chromium, lead, arsenic and pesticides in water cause diseases
affecting the kidney, liver and high blood pressure, paralysis, cancer etc. These toxic
substances are due to industrial effluents reaching the surface and ground water sources.
Health significance of fluoride
Fluoride ions have dual significant in water supplies. High concentration of F-
causes dental fluorosis (disfiguerment of the teeth). At the same time, a concentration less
than 0.8mg/L results in „dental caries‟. Hence, it is essential to maintain the F-
concentration between 0.8 to 1.0mg/L in drinking water. Among the many methods
suggested for the determination fluoride ion in water, the Colorimetric method
(SPANDS) and the ion selective electrode method are the most satisfactory and
applicable to variety of samples. Because all of the Colorimetric methods are subject to
errors due to presence of interfering ions, it may be necessary to distill the sample before
making the fluoride estimation. When the fluoride electrode is dipped in sample whose

ENVIRONMENTAL ENGINEERING-I
Dept. civil engg. ACE, Bangalore Page 75
concentration is to be measured, a potential is established by the presence of fluoride ions
by any modern pH meter having an expanded millivolt scale.
The fluoride ion selective electrode can be used to measure the activity or concentration
of fluoride in aqueous sample by use of an appropriate calibration curve. However,
fluoride activity depends on the total ionic strength of the sample. The electrode does not
respond to bound or complexed fluoride. Addition of a buffer solution of high total ionic
strength containing a chelate to complex aluminium preferentiality overcomes these
difficulties.
Nitrogen (Nitrate) (NO3-)
Determination of nitrate (NO3-) is difficult because of the relatively complex
procedures required, the high probability that interfering constituents will be present and
the limited concentration ranges of the various techniques. Nitrate is the most highly
oxidised form of nitrogen compounds commonly present in natural waters. Significant
sources of nitrate are chemical fertilizers, decayed vegetable and animal matter, domestic
effluents, sewage sludge disposal to land, industrial discharge, leachates from refuse
dumps and atmospheric washout. Depending on the situation, these sources can
contaminate streams, rivers, lakes and ground water. Unpolluted natural water contains
minute amounts of nitrate. Excessive concentration in drinking water is considered
hazardous for infants because of its reduction to nitrite in intestinal track causing
methemoglobinaemia. In surface water, nitrate is a nutrient taken up by plants and
converted into cell protein. The growth stimulation of plants, especially of algae may
cause objectionable eutrophication.Dissolved organic matter, nitrite, hexavalent
chromium and surfactants are interferences. The latter three substances may be
compensated for by independent analysis of their concentrations and preparation of
individual correction curves. Organic matter can cause a positive but variable
interference. The degree of interference depends on the nature and concentration of the
organic matter in the sample. Clean all glassware thoroughly and rinse to reduce the error
that might result from streaks or particles on the outside of the curves, as well as traces of

ENVIRONMENTAL ENGINEERING-I
Dept. civil engg. ACE, Bangalore Page 76
surfactants or dichromate cleaning solution that might adhere on the interior glass
surfaces..
Arsenic (As)
Severe poisoning can arise from the ingestion of as little as 100mg of Arsenic
trioxide. Chronic effects may result from the accumulation of arsenic compounds in the
body at low intake levels. Carcinogenic properties also have been observed to arsenic
compounds. For the protection of aquatic life, the average concentration of As3+ in water
should not exceed 72μg/L. And maximum should not exceed 140μg/L. FAO-
recommended max level for irrigation water is 100μg/L. USEPA water standard is
0.05mg/L. BIS desirable limit is 0.05mg As/L.
Although certain metals, viz. chromium, cobalt, copper, mercury, molybdenum, nickel,
platinum, silver, and selenium influence the generation of arsine, their concentrations in
water seldom are high enough to interfere. H2S interferes, but the interference is removed
with lead acetate. Antimony is reduced to stibine, which forms a coloured complex with
absorption maximum at 510nm and interferes with the arsenic determination.
Methylarsenic compounds are reduced at pH 1to methylarsines, which form coloured
complexes with the absorber solution. If methylarsenic compounds are present,
measurements of total arsenic and arsenate are unreliable. Methyl arsenic compounds do
not influence the results for arsenite.
Cadmium (Cd)
Cadmium occurs in sulphide minerals that also contain zinc, lead or copper. The
metal is used in electroplating, batteries, paint pigments and in alloys with various other
metals. Cadmium is usually associated with zinc. Cadmium is highly toxic and has been
implicated in some cases of poisoning through food. Minute quantities of cadmium are
suspected of being responsible for adverse changes in arteries of human kidneys.
Cadmium also causes generally cancers in laboratory animals and has been linked
epidemiologically with certain human cancers. A cadmium concentration of 200μg/L is
ENVIRONMENTAL ENGINEERING-I
Dept. civil engg. ACE, Bangalore Page 77
toxic to certain fishes. Cadmium may enter water as a result of industrial discharges or
the deterioration of galvanized pipe. The FAO-recommended maximum level for
cadmium for irrigation water is 10μg/L/ USEPA drinking water standard for cadmium is
0.005mg/L. BIS desirable limit is 1mg/L.
Lead (Pb)
Lead in a water supply may come form industrial, smelter discharges and mine or
from the dissolution of plumbing and plumbing fixture. Tap water that are inherently not
corrosive or not suitably treated may contain lead resulting from an attack on lead service
pipes, lead interior plumbing, brass fixtures and fittings on solder pipe joints chiefly from
galena (PbS). It is used in batteries, ammunition, solder, piping, pigments, insecticides
and alloys. Lead also was used in gasoline for many years as an anti-knock agent in the
form of tetraethyl lead. The Food and drug administration regulates lead content in food
and in house paints. Under the lead-copper rule, the US EPA drinking water standard for
lead is 15μg/L. The BIS desirable limit is 0.05mg/L.

ENVIRONMENTAL ENGINEERING-I
Dept. civil engg. ACE, Bangalore Page 78
DRINKING WATER STANDARDS
S.No. CHARACTERICTICS NORMALLY MAX. ACCEPTABLE PERMISIBLE
VALUE LIMIT
1. Temperature 10°C – 15°C -
2. Turbidity (N.T.U) 2.5 10
3. Colour (platinum cobalt scale) 5.0 25
4. Taste and odour Unobjectionable
5. PH 7.0-8.5 6.5-9.2
6. Total dissolved solids(mg/litre) 500 1500
7. Total hardness mg/l (as caco3) 200 600
8. Chlorides (as Cl) mg/l 200 1000
9. Sulphates (as So4) mg/l 200 400
10. Nitrates ( as No3) mg/l 45 45
11. Fluorides (as F) mg/l 1.0 1.5
12. Calcium (as Ca) mg/l 75 200
13. Magnesium (as mg) mg/l 30-120 150
14. Iron (as Fe) mg/l 0.1 1.0
15. Manganese (As Mn) mg/l 0.05 0.5
16. Phenolic compounds 0.001 0.002
(as phenol) mg/l
17. Arsenic (as mg) mg/l 0.05 0.05
18. Chromium (as cr+6
) mg/l 0.05 0.05
19. Cynamides (as CN) mg/l 0.05 0.05
20. Coliform count per 100ml Zero -
of water sample

ENVIRONMENTAL ENGINEERING-I
Dept. civil engg. ACE, Bangalore Page 79
UNIT-4
WATER TREATMENT
INTRODUCTION
Water available in various sources contains various types of impurities and cannot
be directly used by the public for various purposes, before removing the impurities. For
potability water should be free from unpleasant tastes, odours and must have sparkling
appearance. The water must be free from disease-spreading germs. The amount and type
of treatment process will depend on the quality of raw water and the standards of quality
of raw water and the standards of quality to be required .
The surface sources generally contains large amount of impurities therefore they
requires sedimentation, filtration and chlorination as treatment. If the water contains
algae or other micro organisms, pre chlorination has to be done tastes and odours ,
dissolved gases like CO2, H2S are removed by aeration. During the flood season , the
turbidity of the surface water may be high and flocculation may become necessary to
remove turbidity.
Treatment unit flow diagram
Water treatment includes many operations like Aeration, Flocculation, Sedimentation,
Filtration, Softening, Chlorination and demineralization. Depending upon the quality of
raw water and the quality of water desired. Several combinations of the above processes
may be adopted as shown in the flow diagram.
I. When turbidity of water is less than 10 N.T.U
Raw Water
Treated water for supply
CHLORINATION
GROUND WATER
Raw Water Treated water

ENVIRONMENTAL ENGINEERING-I
Dept. civil engg. ACE, Bangalore Page 80
+
for supply
Sedimentation Filtration Chlorination
SURFACE WATER
The location of tretment plant
One complete water treatment plant requires the following process starting from the
source of water upto the distribution zone in order of sequence
Sl.No. Name of the unit Purpose
1. Intake work including pumping plant Raw water from the source for
treatment
2. Plain sedimentation To remove suspended impurities
such as silt, clay, sand etc.
3. Sedimentation with coagualtion To remove the suspended matter
4. Filtration To remove microorgans and
colloidal matter
5. Water softening plant To remove hardness of water
6. Miscellaneous treatment plants To remove dissolved gases, tastes
andodours.
7. Disinfection To remove pathogenic bacteria
8. Clear water reservoir To store the treated water
9. Pumps for pumping the water in service If town or city is situated at higher
reservoirs elevation then pumping is required.
10. Elevated or underground service For distribution of treated water.
reservoir
The following points should be kept in mind while giving layout of any treatment plant.
ENVIRONMENTAL ENGINEERING-I
Dept. civil engg. ACE, Bangalore Page 81
1. The W.T.P. should be located as near to the town so as to avoid the contamination.
2. All the units of plant should be located in order of sequence and flow from one unit to
other by gravity.
3. All the units are arranged in such a way that minimum area is required so as to reduce
the cost of construction.
4. Sufficient area should be reserved for the future expansion
5. Staff quarters and office should be provided near the treatment plants so that the
operators can watch the plants easily.
6. The site of treatment plant should be very neat and give very good asthetic appearance.
The layout of the treatment plant is as shown in the fig
Aeration
1. Aeration removes odour and tastes due to volatile gases like hydrogen sulphide
and due to algae and related organisms.
2. Aeration also oxidise iron and manganese, increases dissolved oxygen content in
water, removes CO2 and reduces corrosion and removes methane and other
flammable gases.
3. Principle of treatment underlines on the fact that volatile gases in water escape
into atmosphere from the air-water interface and atmospheric oxygen takes their
place in water, provided the water body can expose itself over a vast surface to the
atmosphere. This process continues until an equilibrium is reached depending on
the partial pressure of each specific gas in the atmosphere.
Types of Aerators
1. Gravity aerators
2. Fountain aerators

ENVIRONMENTAL ENGINEERING-I
Dept. civil engg. ACE, Bangalore Page 82
3. Diffused aerators
4. Mechanical aerators.
Gravity Aerators (Cascades): In gravity aerators, water is allowed to fall by gravity
such that a large area of water is exposed to atmosphere, sometimes aided by turbulence.
Fountain Aerators: These are also known as spray aerators with special nozzles to
produce a fine spray. Each nozzle is 2.5 to 4 cm diameter discharging about 18 to 36 l/h.
Nozzle spacing should be such that each m3 of water has aerator area of 0.03 to 0.09 m2
for one hour.
Injection or Diffused Aerators: It consists of a tank with perforated pipes, tubes or
diffuser plates, fixed at the bottom to release fine air bubbles from compressor unit. The
tank depth is kept as 3 to 4 m and tank width is within 1.5 times its depth. If depth is
more, the diffusers must be placed at 3 to 4 m depth below water surface. Time of
aeration is 10 to 30 min and 0.2 to 0.4 litres of air is required for 1 litre of water.
Mechanical Aerators: Mixing paddles as in flocculation are used. Paddles may be either
submerged or at the surface.
Settling
Solid liquid separation process in which a suspension is separated into two phases –
1. Clarified supernatant leaving the top of the sedimentation tank (overflow).
2. Concentrated sludge leaving the bottom of the sedimentation tank (underflow).
Purpose of Settling
To remove coarse dispersed phase.
1. To remove coagulated and flocculated impurities.
2. To remove precipitated impurities after chemical treatment.
3. To settle the sludge (biomass) after activated sludge process / tricking filters.

ENVIRONMENTAL ENGINEERING-I
Dept. civil engg. ACE, Bangalore Page 83
Principle of Settling
1. Suspended solids present in water having specific gravity greater than that of
water tend to settle down by gravity as soon as the turbulence is retarded by
offering storage.
2. Basin in which the flow is retarded is called settling tank.
3. Theoretical average time for which the water is detained in the settling tank is
called the detention period.
Screening
Screens are fixed in the intake works or at the entrance of treatment plant so as to remove
the floating matters as leaves, dead animals etc.
Sedimentation
It is the process in which the suspended solids are made to settle by gravity under still
water conditions is called plain sedimentation.
Plain sedimentation
By plain sedimentation the following are the advantages.
1. Plain sedimentation lightens the load on the subsequent process.
2. The operation of subsequent purification process can be controlled in better way.
3. The cost of cleaning the chemical coagulation basins is reduced.
4. No chemical is lost with sludge discharged from the plain settling basin.
5. Less quantity of chemicals are required in the subsequent treatment processes.
Types of Settling

ENVIRONMENTAL ENGINEERING-I
Dept. civil engg. ACE, Bangalore Page 84
Type I: Discrete particle settling - Particles settle individually without interaction with
neighboring particles.
Type II: Flocculent Particles – Flocculation causes the particles to increase in mass and
settle at a faster rate.
Type III: Hindered or Zone settling –The mass of particles tends to settle as a unit with
individual particles remaining in fixed positions with respect to each other. Type IV:
Compression – The concentration of particles is so high that sedimentation can only
occur through compaction of the structure.
Settling of discrete particles (Type I Settling)
1. Size, shape and specific gravity of the particles do not change with time.
2. Settling velocity remains constant.
3. If a particle is suspended in water, it initially has two forces acting upon it: force
of gravity: Fg=ρpgVp
4. Buoyant force quantified by Archimedes as: Fb=ρgVp
5. If the density of the particle differs from that of the water, a net force is exerted
and the particle is accelaratd in the direction of the force: Fnet=(ρp-ρ)gVp
6. This net force becomes the driving force.
7. Once the motion has been initiated, a third force is created due to viscous friction.
This force, called the drag force, is quantified by: Fd=CDAp ρv2/2
8. CD= drag coefficient.
9. Ap = projected area of the particle
10. Because the drag force acts in the opposite direction to the driving force and
increases as the square of the velocity, accelaration occurs at a decreasing rate
until a steady velocity is reached at a point where the drag force equals the driving
11. force:
12. (ρp- ρ )gVp = CDAp ρv2/2
13. For spherical particles,

ENVIRONMENTAL ENGINEERING-I
Dept. civil engg. ACE, Bangalore Page 85
14. Vp=∏d3/6 and Ap= ∏ d2/4
15. Thus, v2= 4g(ρp - ρ )d/ 3CDρ
16. Expressions for CD change with characteristics of different flow regimes. For
laminar, transition, and turbulent flow, the values of CD are:
17. CD = 24 (laminar) Re
CD= 24 + 3 +0.34 (transition) Re Re
1/2
CD= 0.4 (turbulent)
where Re is the Reynolds number
Re= ρ vd
μ
Reynolds number less than 1.0 indicate laminar flow, while values greater than 10 indicate
turbulent flow. Intermediate values indicate transitional flow.
Stokes Flow
For laminar flow, terminal settling velocity equation becomes:
v= (ρ p-ρ )gd2
18μ
which is known as the stokes equation.
Transition Flow
Need to solve non-linear equations:
v2= 4g(ρp - ρ )d
3CD ρ
CD= 24 + 3 +0.34 Re Re
1/2
Re= ρ vd μ

ENVIRONMENTAL ENGINEERING-I
Dept. civil engg. ACE, Bangalore Page 86
Calculate velocity using Stokes law or turbulent expression.
Calculate and check Reynolds number.
Calculate CD.
Use general formula.
Repeat from step 2 until convergence.
Types of Settling Tanks
1. Sedimentation tanks may function either intermittently or continuously. The
intermittent tanks also called quiescent type tanks are those which store water for
a certain period and keep it in complete rest. In a continuous flow type tank, the
flow velocity is only reduced and the water is not brought to complete rest as is
done in an intermittent type.
2. Settling basins may be either long rectangular or circular in plan. Long narrow
rectangular tanks with horizontal flow are generally preferred to the circular tanks
with radial or spiral flow.
3. Long Rectangular Settling Basin
4. Long rectangular basins are hydraulically more stable, and flow control for large
volumes is easier with this configuration.
5. A typical long rectangular tank have length ranging from 2 to 4 times their width.
The bottom is slightly sloped to facilitate sludge scraping. A slow moving
mechanical sludge scraper continuously pulls the settled material into a sludge
hopper from where it is pumped out periodically drag of sedimentation tank
A long rectangular settling tank can be divided into four different functional zones:
Inlet zone: Region in which the flow is uniformly distributed over the cross section such
that the flow through settling zone follows horizontal path.
Settling zone: Settling occurs under quiescent conditions
Outlet zone: Clarified effluent is collected and discharge through outlet weir. Sludge
zone: For collection of sludge below settling zone.
Inlet and Outlet Arrangement

ENVIRONMENTAL ENGINEERING-I
Dept. civil engg. ACE, Bangalore Page 87
Inlet devices: Inlets shall be designed to distribute the water equally and at uniform
velocities. A baffle should be constructed across the basin close to the inlet and should
project several feet below the water surface to dissipate inlet velocities and provide
uniform flow;
Outlet Devices: Outlet weirs or submerged orifices shall be designed to maintain
velocities suitable for settling in the basin and to minimize short-circuiting. Weirs shall
be adjustable, and at least equivalent in length to the perimeter of the tank. However,
peripheral weirs are not acceptable as they tend to cause excessive short-circuiting.
Weir Overflow Rates
Large weir overflow rates result in excessive velocities at the outlet. These
velocities extend backward into the settling zone, causing particles and flocs to be drawn
into the outlet. Weir loadings are generally used upto 300 m3/d/m. It may be necessary to
provide special inboard weir designs as shown to lower the weir overflow rates.
Circular Basins
1. Circular settling basins have the same functional zones as the long rectangular
basin, but the flow regime is different. When the flow enters at the center and is
baffled to flow radially towards the perimeter, the horizontal velocity of the water
is continuously decreasing as the distance from the center increases. Thus, the
particle path in a circular basin is a parabola as opposed to the straight line path in
the long rectangular tank.
2. Sludge removal mechanisms in circular tanks are simpler and require less
maintenance.
3. Settling Operations
4. Particles falling through the settling basin have two components of velocity:
Vertical component: vt= (ρp- ρ )gd2/18μ
Horizontal component: vh=Q/A
The path of the particle is given by the vector sum of horizontal velocity vh and vertical
settling velocity vt.

ENVIRONMENTAL ENGINEERING-I
Dept. civil engg. ACE, Bangalore Page 88
• Assume that a settling column is suspended in the flow of the settling zone and
that the column travels with the flow across the settling zone. Consider the particle in the
batch analysis for type-1 settling which was initially at the surface and settled through the
depth of the column Z0, in the time t0. If t0 also corresponds to the time required for the
column to be carried horizontally across the settling zone, then the particle will fall into
the sludge zone and be removed from the suspension at the point at which the column
reaches the end of the settling zone.
• All particles with vt>v0 will be removed from suspension at some point along the
settling zone.
• Now consider the particle with settling velocity < v0. If the initial depth of this
particle was such that Zp/vt=t0, this particle will also be removed. Therefore, the removal
of suspended particles passing through the settling zone will be in proportion to the ratio
of the individual settling velocities to the settling velocity v0.
• The time t0 corresponds to the retention time in the settling zone.
t= V = LZ0W
Q Q
Also, t0= Z0
v0
Therefore, Z0 = LZ0W and v0= Q
v0 Q LW
Thus, the depth of the basin is not a factor in determining the size particle that can be
removed completely in the settling zone. The determining factor is the quantity Q/As,
which has the units of velocity and is referred to as the overflow rate q0. This overflow
rate is the design factor for settling basins and corresponds to the terminal setting velocity
of the particle that is 100% removed
Design Details

ENVIRONMENTAL ENGINEERING-I
Dept. civil engg. ACE, Bangalore Page 89
1. Detention period: for plain sedimentation: 3 to 4 h, and for coagulated sedimentation: 2
to 2.5 h.
2. Velocity of flow: Not greater than 30 cm/min (horizontal flow).
3. Tank dimensions: L:B = 3 to 5:1. Generally L= 30 m (common) maximum 100 m.
Breadth= 6 m to 10 m. Circular: Diameter not greater than 60 m. generally 20 to 40 m.
4. Depth 2.5 to 5.0 m (3 m).
5. Surface Overflow Rate: For plain sedimentation 12000 to 18000 L/d/m2 tank area; for
thoroughly flocculated water 24000 to 30000 L/d/m2 tank area.
6. Slopes: Rectangular 1% towards inlet and circular 8%.
Sedimentation Tank Design
Problem: Design a rectangular sedimentation tank to treat 2.4 million litres of raw water
per day. The detention period may be assumed to be 3 hours
Solution:Raw water flow per day is 2.4 x 10⁶l.period is 3h
Detention.Volume of tank = Flow x Detention period = 2.4
x 103 x 3/24 = 300 m
3 Assume depth of tank = 3.0 m.
Surface area = 300/3
= 100 m2 L/B = 3
(assumed). L = 3B.
3B2 = 100 m
2 i.e.
B = 5.8 m L =
3B = 5.8 X 3 =
17.4 m

ENVIRONMENTAL ENGINEERING-I
Dept. civil engg. ACE, Bangalore Page 90
Hence surface loading (Overflow rate) = 2.4 x 106 = 24,000 l/d/m
2< 40,000 l/d/m
2
(OK) 100
The time t0 corresponds to the retention time in the settling zone.
The amount of matter removed by sedimentation tank depends upon the factors.
1. Velocity of flow
2. size and shape of particles
3. Viscosity of water
The particles which do not change in size, shape or mass during settling are known as the
discrete particles. The velocity of descrete particles with dia less than 0.1 mm is given by
V = 418 (S - S1) d2 (3T + 70)
Where V → Velocity of settlement in mm/sec
S → Specific gravity of the particle
S1 → Specific gravity of water
D → dia of the particle in mm
T → Temperature in °C
If the dia of the particle is greater than 0.1mm then the velocity is measured by
V = 418 (S - S1) d (3T + 70)
In practice settling of the particles governed by the resultant of horizontal velocity of
water and the verticle downward velocity of the particle.
Design aspects of sedimentation tanks
The design aspects of sedimentary tanks are
1. Velocity of flow
2. Capacity of tank
3. Inlet and outlet arrangements

ENVIRONMENTAL ENGINEERING-I
Dept. civil engg. ACE, Bangalore Page 91
4. Shapes of tanks
5. Miscellaneous considerations.
(1)Velocity of flow: The velocity of flow of water in sedimentation tanks should be
sufficient enough to cause the hydraulic subsidence of suspended impurities. It should
remain uniform throughout the tank and it is generally not allowed to exceed 150mm to
300mm per minute.
(2)Capacity of tank: capacity of tank is calculated by i) detension period ii) Overflow rate
(i) Detension period: The theoretical time taken by a particle of water to pass
between entry and exit of a settling tank is known as the known as the detention period.
The capacity of tank is calculated by
C = Q x T where C → Capacity of tank
Q → Discharge or rate of flow
T → Detension period in hours
The detention period depends on the quality of suspended impurities present in water. For
plain sedimention tanks, the detension period is found to vary from 4 to 8 hours.
(ii) Overflow Rate: in this method it is assumed that the settlement of a particle at the
bottom of the settlement of a particle at the bottom of the tank doesnot depend on the
depth of tank and depends upon the surface area of the tank.
Distance of descend D
Detension period, T = ------------------------ = ----- -------------(1)
Velocity of descend V
C
But, T = ----------- ---------- (2)
Q

ENVIRONMENTAL ENGINEERING-I
Dept. civil engg. ACE, Bangalore Page 92
From (1) & (2)
CD
------ = ------
QV
D.Q D x Q Q
Surface overflow rate, V = ------ = ----------- = ---------
C L x B x D L x B
WhereL → Length of tank
B → Breadth of tank D → Depth of tank = Side water depth = S.W.D
C → Capacity of tank T → Detention period
U → Discharge or rate of flow V → Velocity of descend of a particle to the bottom
of tank = Surface overflow rate = S.O.R
Inlet and outlet arrangements
The inlet is a device, which is provided to distribute the water inside a tank, and
the outlet is a device, which is meant to collect outgoing water. These
arrangementsshould be properly designed and located in a such a way that they do not
form any obstruction or cause any disturbance to the flowing water.
(4) shapes of tanks
Following are the three shapes of settling tank.
(i) Rectangular tanks with horizontal flow
(ii) Circular tanks with radial or spiral flow
(iii) Hopper bottom tanks with vertical flow
The following are the parameters for satisfactory performance.

ENVIRONMENTAL ENGINEERING-I
Dept. civil engg. ACE, Bangalore Page 93
1. Detention period ….. 3 to 4 hours for plain settling
2 to 21/2 hours for coagulant settling
1 to 11/2 hours for up flow type
2. Overflow rate ……… 30 – 40 m3/m
2/day for horizontal flow
40-50m3/m
2/day for up flow
3. Velocity of flow…….. 0.5 to 1.0 cm/sec
4. Weir loading………... 300m3/m/day
5. L:B ………………….. 1:3 to 1:4
Breadth of tank…….. (10 to 12m) to 30 to 50m
6. Depth of tank………. 21/2 – 4m
7. Dia of circular tank…. upto 60m
The following are the mostly used Coagulants with normal dose and PH values required
for best floc formation as shown in Table
Sl.No. Coagulant PH Range Dosage mg/l
1. Aluminiumsulphate 5.5 – 8.0 5 – 85
Al2(SO4)3, 18 H2O
2. Sodium Aluminate, Na2Al2O4 5.5 – 8.0 3.4 – 34
3. Ferric Chloride (Fecl3) 5.5 – 11.0 8.5 – 51
4. Ferric Sulphate Fe2 (SO4)3 5.5 – 11.0 8.5 – 51
5. Ferric Sulphate FeSO47H2O 5.5 – 11.0 8.5 - 51
Sedimentation aided with coagulation
When water contains fine clay and colloidal impurities which are electrically charged are
continually in motion and never settle down due to gravitational force. Certain chemicals
are added to the water so as to remove such impurities which are not removed by plain
sedimentation. The chemical form insoluble, gelatinous, flocculent precipitate absorbs
and entagle very fine suspended matter and colloidal impurities during its formation and
descent through water. These coagulants further have an advantage of removing colour,
odour and taste from the water. Turbidity of water reduced upto 5-10 ppm and bacteria

ENVIRONMENTAL ENGINEERING-I
Dept. civil engg. ACE, Bangalore Page 94
removes upto 65%.Coagulants are chosen depending upon the PH of water. Alum or
Aluminiumsulphate is normally used in all treatment plants because of the low cost and
ease of storage as solid crystals over long periods. The dosage of coagulants, which
should be added to the water, depends upon kind of coagulant, turbidity of water, colour
of water, PH of water, temperature of water and temperature of water and mixing &
flocculation time. The optimum dose of coagulant required for a water treatment plant is
determined by a Jar test as shown in Fig.
For starting the experiment first of all the sample of water is taken in every jar and added
the coagulant in a jar in varying amounts. The quantity of coagulant added in each jar is
noted. Then with the help of electric motar all the paddles are rotated at a speed of 30-40
R.P.M. for about 10 minutes. After this the speed is reduced and paddles are rotated for
about 20-30 minutes. The rotation of paddles is stopped and the floc formed in each Jar is
noted and is allowed to settle. The dose of coagulant which gives the best floc is the
optimum dose of coagulants.
The coagulants may be fed or allowed to enter either in powder form called dry feeding
or in solution form called wet feeding. The mixing of coagulant with the water to form
the floc by the following methods.
1. Centrifugal pump
2. compressed air
3. hydraulic jump
4. mixing channel
5. mixing basins with buffle walls
6. Mixing basins with mechanical means

ENVIRONMENTAL ENGINEERING-I
Dept. civil engg. ACE, Bangalore Page 95
Now a days some firms manufacture combined unit comprising of feeding, mixing,
flocculator and clarifier device. The Fig shows used for sedimentation with coagulation
Sedimention with Caogulation
Water enters in this tank through central inlet pipe placed inside the deflector box. The
deflector box deflects the water downwards and then it goes out through the holes
provided sides of the deflector box. The water flows radially from the deflector box
towards the circumference of the tank, where outlet is provided on the full periphery as
shown in the Fig. All the suspended particles along with floc settle down on the slopy
floor and clear water goes through outlet. The sludge is removed by scrapper which
continuously moves around the floor with very small velocity.Disinfection and repainting
is to be carried out once in ayear before mansoon. Sludge pipes are to be flushed and kept
clean. Bleaching powder may be used to control the growth of algae on the weirs. Scraper
mechanism should be oiled and greased periodically.
Method of feeding coagulants
There are two methods of feeding coagulants to water
1. Dry feeding
2. Wet feeding
Dry Feeding:
Dry feeding is simple in operation and requires relatively less space for its working. The
feeding machines are also cheeper. However, control of dose is difficult. In this case, the
coagulant, in the powder form, is kept in the tank with hopper bottom. In order to prevent
the arching of chemicals, agitatin plates are placed inside the tank. The feeding is

ENVIRONMENTAL ENGINEERING-I
Dept. civil engg. ACE, Bangalore Page 96
regulated by the speed of the toothed wheel which is connected to the venture device in
the raw water pipe.
The chemicals can be fed into water directly by dry feeding in the powder form. Alum
being fairly fine and uniform in size can be fed easily by dry feeding. However, copperas
and lime can not be fed by dry feeding. Dry feeding devices are generally in the form of a
tank with hopper bottom. Agitating plates are placed inside the tank, so as to prevent
arching of the coagulant. The coagulant in the powder form filled in the tank, and is
allowed to fall in the mixing basin. The dose is regulated by the speed of a toothed wheel
or a helical screw. The speed of the toothed wheel or the helical screw is, in turn
controlled by connecting it to a venture-device installed in the raw water pipes feeding
water to the mixing basin. The quantity of coagulant released is, thus controlled in
proportion to the quantity of the raw water entering the mixing basin. Dry feeding
devices are utilized in smaller plants.
Wet Feeding:
The dosage in the wet feeding equipment can be adjusted more readily and can be easily
controlled by means of automatic devices. However the chemicals which are corrosive in
nature create problem in wet feeding. In the case of wet feeding, the solution of the
coagulant, of the required strength is prepared and stored in tank, from where it is
allowed to fall in the mixing channel. The quantity of the mixture falling in the raw water
channel is regulated in proportion to the quantity of flow.
In wet feeding, the solution of required strength of coagulant is prepared and stored in a
tank, from where it is allowed to trickle down into the mixing tank through an outlet. The
level of coagulant solution in the feed tank is maintained constant by means of a float
controlled valve, in order to ensure a constant rate of discharge for a constant feed rate of
raw water flow into the mixing basin. When inflow of raw water changes, the rate of
coagulant feed is adjusted by a conical type arrangement. The working of a conical plug
type arrangement is very simple. The mixing basin and the float chamber are
interconnected together, so that the water level remains the same in both of them. As the

ENVIRONMENTAL ENGINEERING-I
Dept. civil engg. ACE, Bangalore Page 97
rate inflow of raw water increases the depth of water in the mixing basin as well as float
chamber increases, thereby lifting the float. As the float rises, the pinion and pulley
rotates in the same direction, thereby lifting the conical plug and allowing more quantity
of coagulant solution to release to the mixing basin. When the rate of flow decreases the
conical plug descends down and reduces the feeding rate of coagulant to lower rate.
Larger water treatment plants are generally use wet feeding devices since they are costlier
than dry feeding devices.
Rapid Mixing
Rapid mixing after coagulant dosing is an impor-tant design parameter. The coagulant
must be uniformly mixed with the raw water. In case mixing is poor, local under- and
overdosing occurs, result-ing in poor performance of the process. In the flash mixer,
coagulant chemicals are added to the water and the water is mixed quickly and violently
to evenly distribute the chemicals through the water. Flash mixing typically lasts for 30 to
60 see. If the water is mixed for less than 30 seconds, then the chemicals will not be
properly mixed into the water. However, if the water is mixed for more than 60 seconds,
then the mixer blades will shear the newly forming floc back into small particles. After
flash mixing, coagulation occurs.
Mixing is an important unit operation where one substance must be completely
intermingled with another. In water treatment coagulant is mixed into water by rapid
mixing. The process of dispersing chemical by mixing is known as rapid mix or flash
mix.

ENVIRONMENTAL ENGINEERING-I
Dept. civil engg. ACE, Bangalore Page 98
UNIT-5
FILTRATION
INTRODUCTION
The process of passing the water through beds of sand or other granular materials is
known as filtration. For removing bacteria, colour, taste, odours and producing clear and
sparkling water, filters are used by sand filtration 95 to 98% suspended impurities are
removed.
Theory of filtration
The following are the mechanisms of filtration
1.Mechanical straining – Mechanical straining of suspended particles in the sand pores.
2.Sedimentation – Absorption of colloidal and dissolved inorganic matter in the surface
of sand grains in a thin film
3.Electrolytic action – The electrolytic charges on the surface of the sand particles, which
opposite to that of charges of the impurities are responsible for binding them to sand
particles.
4.Biological Action – Biological action due to the development of a film of
microorganisms layer on the top of filter media, which absorb organic impurities.
Filtration is carries out in three types of filters
1. Slow sand filter
2. Rapid sand filter Gravity filters
3.Pressure filter

ENVIRONMENTAL ENGINEERING-I
Dept. civil engg. ACE, Bangalore Page 99
Filter Materials
Sand: Sand, either fine or coarse, is generally used as filter media. The size of the sand is
measured and expressed by the term called effective size. The effective size, i.e. D10 may
be defined as the size of the sieve in mm through which ten percent of the sample of sand
by weight will pass. The uniformity in size or degree of variations in sizes of particles is
measured and expressed by the term called uniformity coefficient. The uniformity
coefficient, i.e. (D60/D10)may be defined as the ratio of the sieve size in mm through
which 60 percent of the sample of sand will pass, to the effective size of the sand.
Gravel: The layers of sand may be supported on gravel, which permits the filtered water
to move freely to the under drains, and allows the wash water to move uniformly
upwards.
Other materials: Instead of using sand, sometimes, anthrafilt is used as filter media.
Anthrafilt is made from anthracite, which is a type of coal-stone that burns without
smoke or flames. It is cheaper and has been able to give a high rate of filtration.
Slow sand filter
Slow sand filters are best suited for the filtration of water for small towns. The
sand used for the filtration is specified by the effective size and uniformity coefficient
.The effective size, D10, which is the sieve in millimeters that permits 10% sand by
weight to pass. The uniformity coefficient is calculated by the ratio of D60 and D10.
Principles of Slow Sand Filtration
1. In a slow sand filter impurities in the water are removed by a combination of
processes: sedimentation, straining, adsorption, and chemical and bacteriological
action.
2. During the first few days, water is purified mainly by mechanical and physical-
chemical processes. The resulting accumulation of sediment and organic matter

ENVIRONMENTAL ENGINEERING-I
Dept. civil engg. ACE, Bangalore Page 100
forms a thin layer on the sand surface, which remains permeable and retains
particles even smaller than the spaces between the sand grains.
3. As this layer (referred to as “Schmutzdecke”) develops, it becomes living quarters
of vast numbers of micro-organisms which break down organic material retained
from the water, converting it into water, carbon dioxide and other oxides.
4. Most impurities, including bacteria and viruses, are removed from the raw water
as it passes through the filter skin and the layer of filter bed sand just below. The
purification mechanisms extend from the filter skin to approx. 0.3-0.4 m below
the surface of the filter bed, gradually decreasing in activity at lower levels as the
water becomes purified and contains less organic material.
5. When the micro-organisms become well established, the filter will work
efficiently and produce high quality effluent which is virtually free of disease
carrying organisms and biodegradable organic matter.
6. They are suitable for treating waters with low colors, low turbidities and low
bacterial contents.
Construction
Slow sand filter is made up of a top layer of fine sand of effective size 0.2. to
0.3mm and uniformity coefficient 2 to 3 . The thickness of the layer may be 75 to 90 cm.
Below the fine sand layer, a layer of coarse sand of such size whose voids do not permit
the fine sand to pass through it. The thickness of this layer may be 30cm. The lowermost
layer is a graded gravel of size 2 to 45mm and thickness is about 20 to 30cm. The gravel
is laid in layers such that the smallest sizes are at the top. The gravel layer is the retains
for the coarse sand layer and is laid over the network of open jointed clay pipe or
concrete pipes called under drainage. Water collected by the under drainage is passed into
the out chamber

ENVIRONMENTAL ENGINEERING-I
Dept. civil engg. ACE, Bangalore Page 101
Operation
The water from sedimentation tanks enters the slow sand filter through a
submersible inlet as shown in fig 5.3 This water is uniformily spread over a sand bed
without causing any disturbances. The water passes through the filter media at an average
rate of 2.4 to 3.6 m3/m2/day. This rate of filtration is continued until the difference
between the water level on the filter and in the inlet chamber is slightly less than the
depth of water above the sand. The difference of water above the sand bed and in the
outlet chamber is called the loss of head.
During filtration as the filter media gets clogged due to the impurities, which stay
in the pores, the resistance to the passage of water and loss of head also increases. When
the loss of head reaches 60cm, filtration is stopped and about 2 to 3 cms from the top of
bed is scrapped and replaced with clean sand before putting back into service to the filter.
The scrapped sand is washed with the water, dried and stored for return to the filter at the
time of the next washing . The filter can run for 6 to 8 weeks before it becomes necessary
to replace the sand layer.

ENVIRONMENTAL ENGINEERING-I
Dept. civil engg. ACE, Bangalore Page 102
Uses
The slow sand filters are effective in removal of 98 to 99% of bacteria of raw
water and completely all suspended impurities and turbidity is reduced to 1 N.T.U. Slow
sand filters also removes odours, tastes and colours from the water but not pathogenic
bacteria which requires disinfection to safeguard against water-borne diseases. The slow
sand filters requires large area for their construction and high initial cost for
establishment. The rate of filtration is also very slow.
Maintenance
The algae growth on the overflow weir should be stopped. Rate of filtration
should be maintained constant and free from fluctuation. Filter head indicator should be
in good working condition. Trees around the plant should be controlled to avoid bird
droppings on the filter bed, No coagulant should be used before slow sand filtration since
the floc will clog the bed quickly.
Rapid sand filter
Rapid sand filter are replacing the slow sand filters because of high rate of
filtration ranging from 100 to 150m3/m2/day and small area of filter required. The main
features of rapid sand filter are as follows.
Operation
The water from coagulation sedimentation tank enters the filter unit through inlet
pipe and uniformily distributed on the whole sand bed. Water after passing through the
sand bed is collected through the under drainage system in the filtered water well. The
outlet chamber in this filter is also equipped with filter rate controller. In the beginning
the loss of head is very small. But as the bed gets clogged, the loss of head increases and
the rate of filtration becomes very low. Therefore the filter bed requires its washing.

ENVIRONMENTAL ENGINEERING-I
Dept. civil engg. ACE, Bangalore Page 103
Effective size of sand - 0.45 to 0.70mm
Uniformity coefficient of sand - 1.3 to 1
Washing of filter
Washing of filter done by the back flow of water through the sand bed as shown
in Fig First the value „A‟ is closed and the water is drained out from the filter leaving a
few centimeter depth of water on the top of sand bed. Keeping all values closed the
compressed air is passed through the separate pipe system for 2-3 minutes, which agitates
the sand bed and stirrer it well causing the loosening of dirt, clay etc. inside the sand bed.
Now value „C‟ and „B‟ are opened gradually, the wash water tank, rises through the
laterals, the strainers gravel and sand bed. Due to back flow of water the sand expands
and all the impurities are carried away with the wash water to the drains through the
channels, which are kept for this purpose.
Depth of sand - 60 to 75cm
Filter gravel - 2 to 50mm size
(Increase size towards bottom)
Depth of gravel - 45cm
Depth of water over sand
during filtration - 1 to 2m
Overall depth of filter
including 0.5m free board - 2.6m
Area of single filter unit - 100m2 in two parts of each 50m
2
Loss of head - Max 1.8 to 2.0m
Turbidity of filtered water - 1 NTU

ENVIRONMENTAL ENGINEERING-I
Dept. civil engg. ACE, Bangalore Page 104
Construction
Rapid sand filter consists of the following five parts
1. Enclosure tank – A water tight tank is constructed either masony or concrete
2. Under drainage system – may be perforated pipe system or pipe and stracher system
3. Base material – gravel should free from clay, dust, silt and vegetable matter. Should be
durable, hard, round and strong and depth 40cm.
4. Filter media of sand – The depth of sand 60 to 75cm
5. Appartenances – Air compressors useful for washing of filter and wash water troughs
for collection of dirty water after washing of filter.
Washing process is continued till the sand bed appears clearly. The eashing of filter is
done generally after 24 hours and it takes 10 minutes and during back washing the sand
bed expands by about 50%.

ENVIRONMENTAL ENGINEERING-I
Dept. civil engg. ACE, Bangalore Page 105
Rapid sand filter bring down the turbidity of water to 1 N.T.U. This filter needs constant
and skilled supervision to maintain the filter gauge, expansion gauge and rate of flow
controller and periodical backwash.
Backwashing of Rapid Sand Filter
1. For a filter to operate efficiently, it must be cleaned before the next filter run. If
the water applied to a filter is of very good quality, the filter runs can be very
long. Some filters can operate longer than one week before needing to be
Comparision of slow sand filter and rapid sand filter
Sl.No. ITEM S.S.F R.S.F
1. Area Need very large area Needs small area
2. Raw Water Not more than 30 NTU Not more than 10NTU
Turbidity hence needs coagulation
3. Sand Media Effective size 0.2 to 0.3 Effective size 0.45 to 0.7 mm uniformity coefficient mm uniformity coefficient
2 to 3 single layer of 1.3 to 1.7 multiple graded
uniform size layers of sand.
4. Rate of 2.4 to 3.6m3/m
2/day 100-150 m
3/m
2/day
Filtration
5. Loss of Head 0.6m to 0.7 m 1.8m to 2.0m
6. Supervision No skilled supervision is Skilled supervision is
required required
7. Cleaning of Scraping of 21/2cm thick Back wash with clean water Filter layer washing and under pressure to detach the
replacing. Cleaning dirt on the sand.
interval that is replacement Backwashing daily or on
of sand at 1 to 2 months. alternate days.
8. Efficiency Bacterial removal, taste, There is no removal of odour, colour and turbidity bacteria. Removal colour
removal. taste, odour and turbidity is
good.

ENVIRONMENTAL ENGINEERING-I
Dept. civil engg. ACE, Bangalore Page 106
backwashed. However, this is not recommended as long filter runs can cause the
filter media to pack down so that it is difficult to expand the bed during the
backwash
2. Treated water from storage is used for the backwash cycle. This treated water is
generally taken from elevated storage tanks or pumped in from the clear well.
3. The filter backwash rate has to be great enough to expand and agitate the filter
media and suspend the floc in the water for removal. However, if the filter
backwash rate is too high, media will be washed from the filter into the troughs
and out of the filter.
The filter should be backwashed when the following conditions have been met:
The head loss is so high that the filter no longer produces water at the desired rate;
and/or Floc starts to break through the filter and the turbidity in the filter effluent
increases; and/or A filter run reaches a given hour of operation.
Operational Troubles in Rapid Gravity Filters
Air Binding
1. When the filter is newly commissioned, the loss of head of water percolating
through the filter is generally very small. However, the loss of head goes on
increasing as more and more impurities get trapped into it.
2. A stage is finally reached when the frictional resistance offered by the filter media
exceeds the static head of water above the and bed. Most of this resistance is
offered by the top 10 to 15 cm sand layer. The bottom sand acts like a vacuum,
and water is sucked through the filter media rather than getting filtered through it.
3. The negative pressure so developed, tends to release the dissolved air and other
gases present in water. The formation of bubbles takes place which stick to the
sand grains. This phenomenon is known as Air Binding as the air binds the filter
and stops its functioning.

ENVIRONMENTAL ENGINEERING-I
Dept. civil engg. ACE, Bangalore Page 107
4. To avoid such troubles, the filters are cleaned as soon as the head loss exceeds the
optimum allowable value.
Formation of Mud Balls: The mud from the atmosphere usually accumulates on the
sand surface to form a dense mat. During inadequate washing this mud may sink down
into the sand bed and stick to the sand grains and other arrested impurities, thereby
forming mud balls.
Cracking of Filters:
The fine sand contained in the top layers of the filter bed shrinks and causes the
development of shrinkage cracks in the sand bed. With the use of filter, the loss of head
and, therefore, pressure on thesand bed goes on increasing, which further goes on
widening these cracks.
Remedial Measures to Prevent Cracking of Filters and Formation of Mud Balls
Breaking the top fine mud layer with rakes and washing off the particles.
Washing the filter with a solution of caustic soda.
Removing, cleaning and replacing the damaged filter san
Standard design practice of Rapid Sand filter:
Maximum length of lateral = not less than 60 times its diameter. Spacing of holes
= 6 mm holes at 7.5 cm c/c or 13 at 15 c/c. C.S area of lateral = not less than 2 times area
of perforations. C.S area of manifold = 2 times total area of laterals. Maximum loss of
head = 2 to 5 m. Spacing of laterals = 15 to 30 cm c/c. Pressure of wash water at
perforations = not greater than 1.05 kg/cm2. Velocity of flow in lateral = 2 m/s. Velocity
of flow in manifold = 2.25 m/s. Velocity of flow in manifold for washwater= 1.8 to 2.5
m/s. Velocity of rising washwater= 0.5 to 1.0 m/min. Amount of washwater = 0.2 to
0.4% of total filtered water. Time of backwashing = 10 to 15 min. Head of water over the
filter = 1.5 to 2.5 m. Free board = 60 cm. Bottom slope = 1 to 60 towards manifold.

ENVIRONMENTAL ENGINEERING-I
Dept. civil engg. ACE, Bangalore Page 108
Q = (1.71 x b x h3/2
)
where Q is in m3/s, b is in m, h is in m. L:B = 1.25 to 1.33:1
Rapid Sand Filter Design
Problem: Design a rapid sand filter to treat 10 million litres of raw water per day allowing
0.5% of filtered water for backwashing. Half hour per day is used for bakwashing.
Assume necessary data.
Solution:Total filtered water =10.05 x 24 x 106= 0.42766 Ml /
h24 x 23.5
Let the rate of filtration be 5000 l / h / m2
ofbed. Area of filter = 10.05 x 106 x 1 =
85.5 m2
23.5 5000
Provide two units. Each bed area 85.5/2 = 42.77. L/B = 1.3; 1.3B2 =
42.77 B = 5.75 m ; L = 5.75 x 1.3 = 7.5 m
Underdrainage system:
Total area of holes = 0.2 to 0.5% of bed area.
Assume 0.2% of bed area = 0.2 x 42.77 =
0.086100
Area of lateral = 2 (Area of holes of
lateral) Area of manifold = 2 (Area of
laterals)
So, area of manifold = 4 x area of holes = 4 x 0.086 = 0.344 = 0.35 m2 .
Diameter of manifold = (4 x 0.35 / П )1/2
= 66 cm
Assume c/c of lateral = 30 cm. Total numbers = 7.5/ 0.3 = 25 on either side. Length of
lateral = 5.75/2 - 0.66/2 = 2.545 m.
ENVIRONMENTAL ENGINEERING-I
Dept. civil engg. ACE, Bangalore Page 109
C.S. area of lateral = 2 x area of perforations per lateral. Take dia of holes = 13 mm
Assume depth of sand = 50 to 75 cm.
Number of holes: n П (1.3)2 = 0.086 x 10
4 = 860
cm2 4
n = 4 x 860 = 648, say 650
П (1.3)2
Number of holes per lateral = 650/50 = 13
Area of perforations per lateral = 13 x p (1.3)2 /4 = 17.24 cm
2
Spacing of holes = 2.545/13 = 19.5 cm.
C.S. area of lateral = 2 x area of perforations per lateral = 2 x 17.24 = 34.5 cm2.
Diameter of lateral = (4 x 34.5/ П )1/2
= 6.63 cm
Check: Length of lateral < 60 d = 60 x 6.63 = 3.98 m. l = 2.545 m (Hence acceptable).
Rising washwater velocity in bed = 50 cm/min.
Washwater discharge per bed = (0.5/60) x 5.75 x 7.5 = 0.36 m3/s.
Velocity of flow through lateral = 0.36 = 0.36 x 10 4 = 2.08 m/s (ok)
Total lateral area 50 x 34.5
Manifold velocity = 0.36 = 1.04 m/s < 2.25 m/s (ok)
Washwater gutter
Discharge of washwater per bed = 0.36 m3/s. Size of bed = 7.5 x 5.75
m. Assume 3 troughs running lengthwise at 5.75/3 = 1.9 m c/c.
Discharge of each trough = Q/3 = 0.36/3 = 0.12 m3/s. Q
=1.71 x b x h3/2
Assume b =0.3 m
h3/2
= 0.12 =
0.234 1.71
x 0.3
h = 0.378 m = 37.8 cm = 40 cm
= 40 + (free board) 5 cm = 45 cm; slope 1

ENVIRONMENTAL ENGINEERING-I
Dept. civil engg. ACE, Bangalore Page 110
in 40 Clear water reservoir for backwashing
For 4 h filter capacity, Capacity of tank = 4 x 5000 x 7.5 x 5.75 x 2 = 1725
m3 1000
Assume depth d = 5 m. Surface area = 1725/5 = 345
m2 L/B = 2; 2B
2 = 345; B = 13 m & L = 26 m.
Dia of inlet pipe coming from two filter = 50 cm.
Velocity <0.6 m/s. Diameter of washwater pipe to overhead tank = 67.5
cm. Air compressor unit = 1000 l of air/ min/ m2 bed area.
For 5 min, air required = 1000 x 5 x 7.5 x 5.77 x 2 = 4.32 m3 of air.
Pressure filter
Pressure filter is type of rapid sand filter in a closed water tight cylinder through
which the water passes through the sand bed under pressure. All the operations of the
filter is similar to rapid gravity filter, expect that the coagulated water is directly applied
to the filter without mixing and flocculation. These filters are used for industrial plants
but these are not economical on large scale.
Pressure filters may be vertical pressure filter and horizontal pressure filter. The Fig 5.5
shows vertical pressure filter. Backwash is carried by reversing the flow with values. The
rate of flow is 120 to 300m3/m2/day.
Advantages
ENVIRONMENTAL ENGINEERING-I
Dept. civil engg. ACE, Bangalore Page 111
1. It is a compact and automatic operation
2. These are ideal for small estates and small water works
3. These filters requires small area for installation
4. Small number of fittings are required in these filters
5. Fitered water comes out under pressure no further pumping is required.
6. No sedimentation and coagulant tanks are required with these units.
Disadvatages
1. Due to heavy cost on treatment , they cannot be used for treatment large quantity of
water at water works
2. Proper quality control and inspection is not possible because of closed tank
3. The efficiency of removal of bacteria & turbidity is poor.
4.Change of filter media, gravel and repair of drainage system is difficult.
UNIT-6
DISINFECTION

ENVIRONMENTAL ENGINEERING-I
Dept. civil engg. ACE, Bangalore Page 112
Disinfection of water
The process of killing the infective bacteria from the water and making it safe to
the user is called disinfection. The water which comes out from the filter may contain
some disease – causing bacteria in addition to the useful bacteria. Before the water is
supplied to the public it is utmost necessary to kill all the disease causing bacteria. The
chemicals or substances which are used for killing the bacteria are known as
disinfectants.
Requirements of good disinfectants
1. They should destroy all the harmful pathogens and make it safe for use,.
2. They should not take more time in killing bacteria
3. They should be economical and easily available
4. They should not require high skill for their application
5. After treatment the water should not become toxic and objectionable to the user.
6. The concentration should be determined by simply and quickly.
Methods of disinfection
Disinfection of water by different physical and chemical methods
I. Physical methods
1. Boiling: Boil the water for 15 to 20 minutes and kills the disease causing bacteria. This
process is applicable for individual homes.
2. Ultra-violet rays: Water is allowed to pass about 10cm thickness by ultraviolet rays.
This process is very costly and not used at water works. Suitable for institutions.
3. Ultrasonic rays: Suitable for institutions.
II. Chemical methods
1. Chlorination : Using chlorine gas or chlorine compounds.
2. Bromine and iodine : It is expensive and leaves taste and odour.
3.potassium permanganate: This method is used for disinfection of dug well water, pond
water or private source of water.
4. Ozone : Very expensive process, leaves no taste, odour or residual.
5. Excess lime treatment: Needs long detension time for time interval and large lime

ENVIRONMENTAL ENGINEERING-I
Dept. civil engg. ACE, Bangalore Page 113
sludges to be treated.
Chlorination
Chlorination is the addition of chlorine to kill the bacteria Chlorination is very
widely adopted in all developing countries for treatment of water for public supply.
Chlorine is available in gas, liquid or solid form (bleaching powder)
Advantages of chlorine
1. Chlorine is manufactured easily by electrolytes of common salts (NaCl)
2. It is powerful oxidant and can penetrate the cell wall of organism and its contents.
3. Dosage can be controlled precisely
4. can be easily detected by simple orthotolidine test
5. Doesnot form harmful constituents on reaction with organics of inorganics in water
6. leaves required residue in water to neutralise recontamination later.
Precautions in using chlorine
1. Chlorine gas or liquid is highly corrosive and Lithal to Inhale. Hence it is to be stored
carefully in sealed container at a distance.
2. If the water contains phenolic compounds, there is a reaction with chlorine can result
in cancer causing substances.
Residual chlorine and chlorine demand
When chlorine is applied in water some of it is consumed in killing the pathogens, some
react organs & inorganic substances and the balance is detected as “Residual Chlorine”.
The difference between the quantity applied per litre and the residual is called “Chlorine
Demand”. Polluted waters excert more chlorine demand. If water is pre-treated by
sedimentation and aeration, chlorine demand may be reduced. Normally residual chlorine
of 0.2 mg/litre is required.
Behavier of chlorine in water
When chlorine is dissolved in water forms hypo chlorous acid and hydro chloric acid.
Cl2 + H2O →HOCl + HCl ---------- (1)
After some time hydochlorous acid further Ionizes as follows

ENVIRONMENTAL ENGINEERING-I
Dept. civil engg. ACE, Bangalore Page 114
HOCl←→ H+ + OCl
- ------ (2)
The two prevailing species (HOCl) and (OCl -) are called free available chlorine
are responsible for the disinfection of waterClorine reacts with ammonia in water to form
Monochloramine, (NH2Cl), dichloramine (NHCl2) and trichloramine , (NCl3) released
and their distribution depends on the PH-value of water.
Dosage of chlorine
(A) Plain chlorination
Plain chlorination is the process of addition of chlorine only when the surface
water with no other treatment is required. The water of lakes and springs is pure and can
be used after plain chlorination. A rate of 0.8 mg/lit/hour at 15N/cm2 pressure is the
normal dosage so as to maintain in a resided chlorine of 0.2 mg/lit.
(B) Super chlorination
Super chlorination is defined as administration of a dose considerably in excess of
that necessary for the adequate bacterial purification of water. About 10 to 15 mg/lit is
applied with a contact time of 10 to 30 minutes under the circumstances such as during
epidemic breakout water is to be dechlorinated before supply to the distribution system.
(C) Brake point chlorination
When chlorine is applied to water containing organics, micro organisms and
ammonia the residual chlorine levels fluctuate with increase in dosage as shown in
FigUpto the point B it is obsorbed by reducing agents in water (like nitrates, Iron etc)
further increases forms chloramines with ammonia in water. Chloramines are effective as
CL and OCL formed. When the free chlorine content increases it reacts with the
chloramines and reducing the available chlorine. At the point „D‟ all the chloramines are
converted to effective N2, N2O and NCl3. Beyond point „D‟ free residual chlorine appear
again. This point „D‟ is called break point chlorination. Dosage beyond this point is the
same as super chlorination. In super chlorination no such rational measurement is made
and the dosage is taken at random.
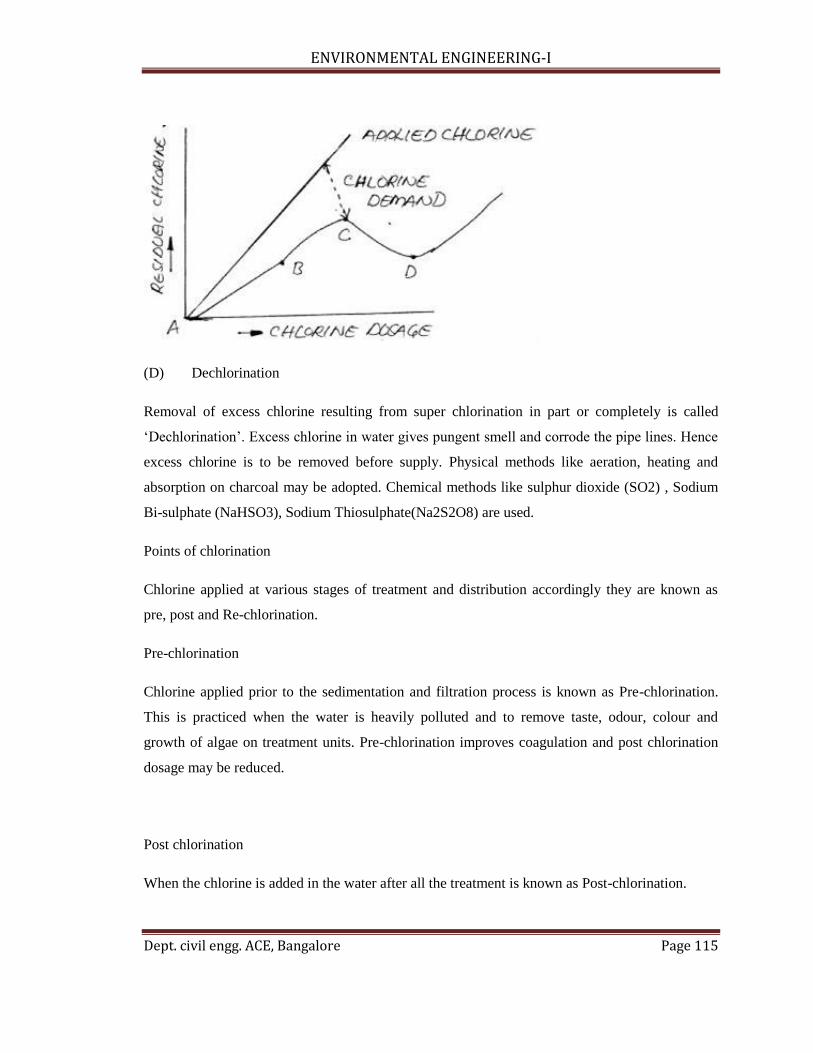
ENVIRONMENTAL ENGINEERING-I
Dept. civil engg. ACE, Bangalore Page 115
(D) Dechlorination
Removal of excess chlorine resulting from super chlorination in part or completely is called
„Dechlorination‟. Excess chlorine in water gives pungent smell and corrode the pipe lines. Hence
excess chlorine is to be removed before supply. Physical methods like aeration, heating and
absorption on charcoal may be adopted. Chemical methods like sulphur dioxide (SO2) , Sodium
Bi-sulphate (NaHSO3), Sodium Thiosulphate(Na2S2O8) are used.
Points of chlorination
Chlorine applied at various stages of treatment and distribution accordingly they are known as
pre, post and Re-chlorination.
Pre-chlorination
Chlorine applied prior to the sedimentation and filtration process is known as Pre-chlorination.
This is practiced when the water is heavily polluted and to remove taste, odour, colour and
growth of algae on treatment units. Pre-chlorination improves coagulation and post chlorination
dosage may be reduced.
Post chlorination
When the chlorine is added in the water after all the treatment is known as Post-chlorination.

ENVIRONMENTAL ENGINEERING-I
Dept. civil engg. ACE, Bangalore Page 116
Re-chlorination
In long distribution systems, chlorine residual may fall tendering the water unsafe. Application of
excess chlorine to compensate for this may lead to unpleasant smell to consumers at the points
nearer to treatment point in such cases chlorine is applied again that is rechlorinated at
intermediate points generally at service reservoirs and booster pumping stations.
WATER SOFTENING
Introduction
Water softening is the process of removing hardness. Hardness is defined as the
water‟s ability to consume soap. Besides making water more pleasing for washing
purposes, softening water can also provide benefits of preventing encrustation and scaling
inside boilers, water heaters, hot-water lines, as well as some industrial processes.
Hardness is usually expressed in terms of “ppm as CaCO3”, or ppm as calcium carbonate.
The home water softener industry usually measures hardness in the form of grains per
gallon, of which 1 gpg equals about 17 ppm hardness. The terms, “hard water” and “soft
water” are used loosely, as there are no accepted standards or “measuring scale” to
determine if water is soft or hard.
The primary constituents in water that cause hardness are calcium (Ca) and
magnesium (Mg), especially calcium. Iron (Fe) and manganese (Mn) can also promote to
water hardness, but typically at a much lesser degree. Hardness caused by calcium and
manganese is typically carbonate hardness, for the calcium and manganese exists in the
water in the form of calcium bicarbonate, Ca(HCO3)2, and magnesium bicarbonate,
Mg(HCO3 )2. This form of hardness is usually referred to as carbonate hardness, or
temporary hardness. On the other hand, the sulfate, chloride and nitrate salts of calcium
are usually referred to as permanent hardness, since they cannot be readily precipitated.
Water heaters suffer from hard water because when water containing calcium bicarbonate
is heated, the insoluble carbonate form of calcium will be precipitated.
Ca(HCO3)2 + heat = CaCO3 + CO2 + H20
where CaCO3 is calcium carbonate, which will form as the identifiable white, crusty

ENVIRONMENTAL ENGINEERING-I
Dept. civil engg. ACE, Bangalore Page 117
matter, which precipitates out of the water. It is this white, crusty matter that builds up in
water heaters, hot water lines, and on the kitchen tap as well as in the sink.
The hardness of water varies with where the source water came from. The
mineral content and hardness of water typically reflects the nature of geological
formations through which the water comes in contact, for example limestone. In general,
ground water sources are much harder than surface waters. It is not uncommon to find
ground water with a hardness of 300 ppm. Finished drinking water need not be
“completely softened”. Usually, a hardness of around 80-90 ppm is quite sufficient.
The science and chemistry of water softening can be a confusing and
frustrating one for water operators, but it is a process that is also quite fascinating and
exemplifies the wonders of science and natural processes.
Lime/soda ash method
The most common method of water softening used in water plants is lime
softening, or lime/soda ash softening. The reason for this is that lime and soda ash are
readily available and cost efficient for softening the large amounts of water processed
through a water plant.
In the simplest sense, hydrated lime is fed at a dosage sufficient to cause the
carbonate hardness to precipitate out, settle, and be removed from the water. Since
carbonate hardness exists in water as calcium bicarbonate, then the chemical reaction as
follows occurs,
Ca(HCO3)2 + Ca(OH)2 = CaCO3
calcium bicarbonate calcium hydroxide calcium carbonate
(in water) (hydrated lime) (white precipitant)
also, in the event of magnesium bicarbonate in the water causing hardness,
Mg(HCO3)2 + Ca(OH)2 = CaCO3 + MgCO3
CO2. + Ca(OH)
2 -> CaCO3 + H
2O Ca(HCO
3)
2 + Ca(OH)
2 ->
2CaCO3 + 2H20 Mg(HCO
3)
2 + Ca(OH)
2 -> CaCO3 +
MgCO3 + 2H
20 MgCO
3 + Ca(OH)
2 -> CaCO3 + Mg(OH)2

ENVIRONMENTAL ENGINEERING-I
Dept. civil engg. ACE, Bangalore Page 118
Therefore, lime softening is sort of like fighting fire with fire. It‟s not uncommon to feed
large doses of hydrated lime, which is why a lime softening plant uses a grain-bin size
lime feeder and not a small dry chemical feeder using 50-pound bags of hydrated lime!
Non-carbonate hardness
Now, if the hardness of the water is contributed by non-carbonate hardness, soda
ash, Na2CO3, may be fed in addition to the hydrated lime to remove non-carbonate
hardness. Sometimes liquid caustic soda, NaOH, can be used instead of soda ash. The
advantages of using caustic soda are,
1.ease of handling and feeding,
2. lack of deterioration in storage,
3. less calcium carbonate sludge is formed,
4. can precipitate both carbonate and non-carbonate hardness, so the caustic soda can
actually replace some of the need hydrated lime.
Whether soda ash or caustic soda is used is based on chemical costs and raw water
characteristics.
Recarbonation
As you may have determined, the process of lime softening can dramatically raise
the pH of the water. Many times, the final process in lime softening is to recarbonate the
water by adding carbon dioxide, CO2. This process will lower the pH to a level desirable
for the finished water.
Ion-exchange method
Ion exchange is not nearly as cost-efficient as lime softening when producing
large amounts of water. Therefore, water plants typically do not use ion exchange to
soften the finished product water. However, some water plants do need to soften smaller
amounts of water used in some treatment process, for example fluoridation, which can be
sufficiently handled with ion-exchange methods. Likewise, most in-home water softeners
are ion-exchange units.
ENVIRONMENTAL ENGINEERING-I
Dept. civil engg. ACE, Bangalore Page 119
Ions can exist with either a positive charge or a negative charge. A positive charge ion is
called a cation. A negative charge ion is called an anion. Calcium (Ca) and magnesium
(Mg), the principle elements causing hardness, are typically positive charged cations.
Therefore, the basic premise of which ion-exchange softening uses is trading one ion for
another.Anion-exchange water softener has three main parts,
1. a resin tank containing small beads of synthetic resin,
2. a brine tank,
3. the control valve.
The resin is treated with sodium (Na) from the brine tank. Sodium is also a positive
charged cation with a charge of plus one, therefore, Na+. As water passes through the
resin tank, the sodium ions are exchanged with calcium and magnesium ions, because the
calcium and magnesium ions are of a higher positive charge than the sodium ions, Ca++
and Mg++. Therefore, the resin is behaving as the negative charge. Since the calcium and
magnesium ions are of a stronger positive charge than the sodium ions, the resin
“exchanges” the sodium for calcium and magnesium because there is more of an
attraction between the resin and the calcium and magnesium than between the resin and
the sodium. This process of ion exchange will continue until all available exchange sites
are filled, at which point the resin is exhausted and must be regenerated by the sodium
(bags of salt) from the brine tank.
As you can see, the main drawback from ion-exchange softeners is that they put sodium
into the water. This can present health problems for people who should not ingest
excessive amounts of sodium. This is why I recommend that home installations of water
softeners be placed on the water line going to the hot water heater. The hot water heater
benefits, the hot water lines benefit, the soap consumption is reduced, but you don‟t have
to drink it from the cold-water tap.

ENVIRONMENTAL ENGINEERING-I
Dept. civil engg. ACE, Bangalore Page 120
A benefit of ion-exchange softeners is that they can remove iron (Fe) to some extent
because iron is also a positive charge cation.
Zeolite softening
The ion-exchange method of water softening has been used extensively in smaller
water systems and individual homes. It is based on the ability of the ion-exchange resin,
zeolite, to exchange one ion from the water being treated for another ion that is in the
resin. Zeolite resin exchanges sodium ions for ions causing hardness in the water, such as
calcium and magnesium. Sodium is one component of softening salt, with chlorine being
the other.
Chemistry ofthe Ion-Exchange Reaction
The following chemical reactions show the exchange process. The X represents the
zeolite, the exchange material.
Removal of carbonate hardness:
Ca(HCO3)2
+ Na2X ------>CaX+ 2NaHCO
3
Mg(HCO3)2
+ Na2X ------>MgX+ 2NaHCO
3
Removal of non-carbonate hardness
CaSO4
+ Na2X ----- >CaX+ Na
2SO
4
CaCl2
+ Na2X ------>CaX+ CaCl
2
MgSO4
+ Na2X ------>MgX+ Na
2SO
4
MgCL2
+ Na2X ------>MgX+ 2NaC1
ENVIRONMENTAL ENGINEERING-I
Dept. civil engg. ACE, Bangalore Page 121
These reactions represent cation exchange, the exchange of positive ions. To replenish
the sodium ions used, the units need to be regenerated with material containing high
amounts of sodium, normally a salt brine. This allows the resin to be reused many times.
The ion-exchange softening process does not alter the water‟s pH or alkalinity. However,
the stability of the water is altered due to the removal of the calcium and magnesium and
an increase in dissolved solids. For each ppm of calcium removed and replaced by
sodium, the total dissolved solids increases by 0.15 ppm. For each ppm of magnesium
removed and replaced by sodium, the total dissolved solids will increase by 0.88 ppm.
The measurements used to express water hardness in the ion-exchange process differ
from the units that are normally used in the lime-soda softening process. Hardness in the
ion-exchange process is expressed as grains per gallon rather than mg/l of calcium
carbonate. The following conversions show the relationship between mg/l and grains per
gallon:
1 grain 17.12 mg/l
1 grain 0.143 lbs per 1000 gallon
7000 grains 1 lb per gal
Advantages of the Ion-Exchange Process
Compared with lime-soda ash softening, ion-exchange softening has certain
advantages, the main ones being its compactness and its low cost. The chemicals used are
safer for the operator to handle and the operation of the zeolite-soflening process is much
easier. It can be almost totally automated. Because the resins have the ability to remove
all of the hardness from the water, the treated water must be blended with water that has
been by-passed around the softener to obtain the hardness level the operator would like to
maintain.

ENVIRONMENTAL ENGINEERING-I
Dept. civil engg. ACE, Bangalore Page 122
Many utilities have found the ion-exchange process to be the most cost effective way of
producing quality water for their customers. If the zeolite units are used to soften surface
water, it has to be preceded by the normal surface-water treatment units of rapid mix,
flocculation, sedimentation, and filtration. This is needed to remove any material that
may otherwise foul the resin. Therefore, the lime-soda process is most likely the more
cost-effective method for surface-water softening than the ion-exchange one.
The ion-exchange process requires the following components
There are a number of materials, including some types of soils, that can act as cation
exchangers for softening. A natural green sand called glauconite has very good exchange
capabilities, and it was once widely used. Synthetic zeolites, known as polystyrene resins,
are the ones most commonly used now. Their cost is reasonable, and it is easy to control
the quality of the resin. They also have much higher ion-exchange capacities than the
natural material.
The ability of the resin to remove hardness from the water is related to the volume
of resin in the tank. The zeolite resin should remove about 50,000 grains of hardness per
cubic foot of resin. The resin holds the hardness ions until they are regenerated with a salt
brine solution. The hardness ions are exchanged for the sodium ions in the salt brine.
Salt storage
The salt is stored as a brine, ready to be used for the regeneration of the resin. The
amount of salt needed ranges from 0.25 to 0.45 pounds for every 1,000 grains of hardness
removed. The tank should be coated with a salt-resistant material to prevent corrosion of
the tank walls.The salt used should meet the AWWA standards for sodium chloride.
Rock or pellet salt is the best for preparing brine. Road salt is not acceptable, due to the
dirt that it containsSalt-storage tanks should be covered to prevent contamination of the
salt. A raised curb should be provided at each access hatch to prevent contamination by
flood water or rain

ENVIRONMENTAL ENGINEERING-I
Dept. civil engg. ACE, Bangalore Page 123
then adding salt is the preferred method for making the brine. The brine is heavier than
water and settles to the bottom of the tank. The brine is usually pumped from the tank to
the ion-exchange units. When making brine, the addition of water must be through an air
gap due to the possibility of back siphonage of the brine to the water system.
Brine-feeding equipment

ENVIRONMENTAL ENGINEERING-I
Dept. civil engg. ACE, Bangalore Page 124
Concentrated brine contains approximately 25 percent salt. The brine should be diluted to
about 10 percent before it is added to the tank during regeneration. It is generally injected
with the use of a venturi or by the use of a metering pump. The solubility of salt
decreases with a rise in temperature, which forces the salt out of solution. The water that
remains after the salt has separated out of the solution is subject to freezing. Therefore,
the brine piping should be protected from cold temperatures.
Devices for blending
A properly operated ion-exchange unit produces a water with zero hardness but with high
corrosivity. Since a total hardness of 85 to 100 mg/l is the most desirable, the effluent
from the ion-exchange unit is generally blended with source water to raise the hardness in
the finished water. Blending is normally accomplished by metering both the effluent from
the softener and the raw water added. Meters are installed in both lines so that the
operator can adjust and monitor the blend.
Operation of units
The basic steps in the operation of an ion-exchange softening unit are the softening cycle,
backwash, regeneration, slow rinse, and fast rinse.
Softening Cycle
The softening cycle involves the feeding of water into the unit until hardness appears in
the effluent from the unit. The cycle ends when 1 to 5 mg/l of hardness is detected in the
effluent. Almost all softening units have an alarm on the water meter to indicate when a
certain amount of water has passed through the exchange unit. Loading rates for synthetic
resins are in the area of 10 to 15 gpm/square foot of media surface area.
Backwash Cycle
Once the hardness breaks through, the softener unit needs to be regenerated. In down-
flow units the resin must first be backwashed to loosen the resin since it becomes

ENVIRONMENTAL ENGINEERING-I
Dept. civil engg. ACE, Bangalore Page 125
compacted by the weight of the water, and to remove any material that has been filtered
out of the water by the resin. The backwash rate is normally 6 to 8 gpm/square foot of
zeolite bed area. The operator needs to apply enough backwash water to expand the resin
bed by about 50 percent. The backwash water is usually discharged to a box containing
orifice plates that establish and measure the flow rate.
Distributors at the top of the unit provide for uniform water distribution and uniform
wash-water collection. Underdrains help the uniform distribution of the backwash water
on the bottom of the resin.
Regeneration
To regenerate an ion-exchange unit, concentrated brine is pumped to the unit from the
storage basin. The brine is diluted through the injector to a solution containing about 10
percent salt before it is passed through the resin. The time required for regeneration is
about 20 to 35 minutes. The flow rate of brine through the resin is measured in gallons
per minute per cubic foot of media.
The brine needs to be in contact with the resin long enough to allow for complete
exchange of the hardness ions in the resin with sodium ions in the brine. It is better to
allow too much time than to not allow enough. If the resin is not totally recharged, the
next softening run will be short.
Rinse Cycle
The regeneration cycle must be followed by a rinse cycle to remove the remaining brine
from the tank. The total amount of rinse water needed is 20 to 35 gallons per cubic foot
of resin. The rinse is started at a slow rate--2 gpm/square foot of surface area--and
continued until the chloride concentration of the effluent, which should be monitored
frequently, is quite low.
Disposal of brine

ENVIRONMENTAL ENGINEERING-I
Dept. civil engg. ACE, Bangalore Page 126
The total volume of the brine that is used during a regeneration cycle, together
with the rinse water that follows, varies from 1.5 to 7 percent of the amount of water
softened by the unit. The chloride concentration in this wastewater could be as high as
35,000 to 45,000 mg/l. This amount of chlorides will upset a wastewater treatment plant,
so the brine usually will have to be disposed of by lagooning. In Minnesota the disposal
methods used have to comply with Minnesota Pollution Control Agency‟s rules.
Operating problems
Problem areas in operation included breakdown of the resin, iron fouling,
presence of suspended material in the source water, and unstable water.
Resin Breakdown
The synthetic resins will normally last 15 to 20 years, but certain conditions can
cause the resin to breakdown sooner. Oxidation by chlorine is probably the most common
cause of resin breakdown. When chlorine is used to oxidize iron in the water, the chlorine
should be removed before the ion exchange unit.
Iron Fouling
Iron in the source water will seriously affect the ability of the resin to remove the
hardness ions.Ferrous iron can be oxidized during the softening and precipitate out as
iron oxide on the resin. No amount of brine will remove the iron fouling. If the iron oxide
is formed before theexchange unit, it can be filtered out by the resin and removed during
the backwashing of the unit. Normally if the iron concentration in the source water is
high, iron removal is provided ahead of the exchange unit to prevent fouling of the unit.
Suspended material
Turbidity, organic chemicals, and bacterial slimes seriously affect the resin by coating it,
resulting in the loss of some of the resin‟s exchange capacity. The best solution to this
ENVIRONMENTAL ENGINEERING-I
Dept. civil engg. ACE, Bangalore Page 127
problem is the removal of the suspended matter by the normal water treatment methods
of coagulation, sedimentation, and filtration before the softening process.
Unstable water
Any water that has been softened by the ion-exchange process will be corrosive and will
have to be stabilized to prevent corrosion from taking place in the distribution system.
The way to accomplish this is by adding phosphates or other chemicals to reduce the
corrosivity of the water.
Operational testing
Testing the quality of the water treated by an ion exchange softener is fairly simple. The
testing should consist of the following:
1. Total Hardness of the raw and treated water.
2. The Langelier Index (pH of stability [pHs] - pH measured). If the Langelier Index is
positive, the water will tend to coat the pipes in the distribution system with a calcium
scale. If the Langelier Index is negative, the water will tend to be corrosive.
3. Chloride concentration in the rinse water
UNIT-7
MISCELLENEOUS TREATMENT
Taste and Odor

ENVIRONMENTAL ENGINEERING-I
Dept. civil engg. ACE, Bangalore Page 128
Most customers judge the quality of drinking water by taste and odor. If the
customer is satisfied with these qualities, it is assumed the water is safe to drink. Many
harmful contaminants in water cannot be detected due to taste or smell and many of the
contaminants found in drinking water that have a detectable taste or odor are not harmful.
Sources of taste and odor problemscan be found in surface water and groundwater.
Source water protection involves the prevention of contaminants from entering the
source. Surface water or groundwater may become contaminated by pollutants such as
gasoline, industrial solvents or a wide variety of volatile organics. The removal of
contaminants from surface water or groundwater is costly and may involve the use
ofaeration, powdered activated carbon, or both. If taste and odor must be controlled at the
treatment plant, oxidation, aeration and adsorption can be effective in reducing taste and
odor, and improved coagulation filtration.
Odor measurements
One of the most common methods for measuring odor in water is the threshold
odor test. It involves a series of flasks presented to an observer, who is told that some of
the samples contain odors and that the series is arranged in order of increasing
concentrations. The observer is also given a known odor-free blank for reference during
the test.
The observer compares the flasks in ascending order with the blank and then notes
whether an odor is detected in any sample flask. Individuals vary in their reactions to
certain types of odors. An odor stimulus that is agreeable to one may be disagreeable to
another. Such differences complicate the attempts to predict the odor intensity of the
mixtures.
Methane and hydrogen sulfide in groundwater

ENVIRONMENTAL ENGINEERING-I
Dept. civil engg. ACE, Bangalore Page 129
Methane gas from the decomposition of organic matter tastes like garlic and the
biggest danger from the presence of methane is its explosiveness. It can be removed by
aeration.
Hydrogen sulfide (H2S) in water is a common problem that is therefore discussed
separately from the other taste and odor problems. The most common method of
removing hydrogen sulfide from water is by aeration. Carbon adsorption is also effective,
but more expensive.
Taste and odor removal
Oxidation
In most cases, oxidation is the best method for controlling taste and odor problems.
Oxidation can be carried out with the following chemicals: Potassium permanganate,
most often used and is a very strong oxidant. According to the California Department of
Health Services Water Treatment Plant Operation, a dosage range of 0.1 to 0.5 mg/l can
control taste and odor problems.
Ozone is also effective oxidizing of taste and odor compounds. Ozone changes
the characteristics of the taste and odor in addition to reducing the level of the odor-
producing compound. Ozone dosages of 2 mg/l to 5 mg/1 have been used. Several pilot
studies have shown that the combination of ozone and hydrogen peroxide may be
superior to the use of ozone alone.Chlorine dioxide or chorine are also effective methods
of taste and odor control, but use as a control chemical must be evaluated carefully due to
the formation of THMs and chlorophenol when organics are present.
Aeration
ENVIRONMENTAL ENGINEERING-I
Dept. civil engg. ACE, Bangalore Page 130
Aeration is a practical solution for taste and odor control when the problem is
caused by volatile compounds, such as hydrogen sulfide. It is generally not the best
method for controlling taste and odors that are caused by algae. (See Aeration Chapter)
Adsorption
Adding powdered activated carbon to water or using of granular activated carbon
(GAC) in the water filter can remove taste and odor. Powdered activated carbon (PAC) is
the preferred method when the taste and odor is moderate and infrequent.Two basic types
of PAC feed systems are dry storage and dry feeding. If the hourly feed rate is less than
150 pounds, the feed system should be use a solution tank. If the hourly feed rate exceeds
150 pounds, a slurry system should be considered. The powdered activated carbon dosage
will vary from 1 to 50 mg/l. A dosage of 25 mg/l is considered by many industry experts
to be the maximum dosage.
Granular activated carbon filters should be considered when moderate-to-severe
taste and odor problems exist frequently. GAC is similar to normal filters; however, the
bed contact time is very important. The contact time should range from 3-to-10 minutes
for purposes of taste and odor control and the filter rate will range from 3 to 6 gpm/ft2.
When the GAC is exhausted, the total volume of the bed must be replaced with new or
regenerated GAC, which can be created by heating and re-burning used GAC to destroy
the material it removed.
Taste and odor removal from distribution
Taste and odors occurring in the distribution system are primarily the result of
corrosion of pipe material and/or growth of iron bacteria, such as crenothrix and leptorix,
the water main. If the water has high sulfates and is allowed to stand in dead ends, taste
and odor problems may be compounded by sulfate-reducing bacteria.These problems can
be rectified only by proper design of the system, such as eliminating dead ends and
providing adequate means of flushing the system. Maintenance crews must keep the
water lines clean by regularly flushing out deposits and the microorganisms that

ENVIRONMENTAL ENGINEERING-I
Dept. civil engg. ACE, Bangalore Page 131
accumulate within these deposits. Water treatment plants can also minimize taste and
odor problems by maintaining an adequate residual of chlorine to combat the growth of
bacteria in the system and by using anti-corrosion measures, either by adjusting the pH of
the water or by adding corrosion inhibitors to the finished water.
Use of Copper Sulphate
Copper Sulphate is used to serve two purposes:
1. Removal oscolour, odour and taste from water
2. Control of growth of algae, bacteria and aquatic weeds in the water reservoir.
Copper sulphate is generally available in powder form or in crystal form. It may be
applied either directly in the distribution pipes or in open reservoirs. In the former
case, solution of copper sulphate of required strength is prepared and fed to the water
just ahead of the distribution system.the dose may vary from 0.3 to 0.6 p.p.m. for its
application to the reservoirs, it is ground into fine powder and sprinkled on the water
surface by means of boat. Alternatively, it may be applied by means of sacks of the
crystals which are dragged through water by means of boats. The killing of algae
mays be troublesome because the taste and odours will be temporarily increased.
Hence smaller amounts are often successful as prophylitic doses to prevent troubles.
Adsorption
Adding powdered activated carbon to water or using of granular activated carbon
(GAC) in the water filter can remove taste and odor. Powdered activated carbon
(PAC) is the preferred method when the taste and odor is moderate and infrequent.
Two basic types of PAC feed systems are dry storage and dry feeding. If the hourly
feed rate is less than 150 pounds, the feed system should be use a solution tank. If the
hourly feed rate exceeds 150 pounds, a slurry system should be considered.

ENVIRONMENTAL ENGINEERING-I
Dept. civil engg. ACE, Bangalore Page 132
The powdered activated carbon dosage will vary from 1 to 50 mg/l. A dosage of 25
mg/l is considered by many industry experts to be the maximum dosage.
Granular activated carbon filters should be considered when moderate-to-severe taste
and odor problems exist frequently. GAC is similar to normal filters; however, the
bed contact time is very important. The contact time should range from 3-to-10
minutes for purposes of taste and odor control and the filter rate will range from 3 to
6 gpm/ft2. When the GAC is exhausted, the total volume of the bed must be replaced
with new or regenerated GAC, which can be created by heating and re-burning used
GAC to destroy the material it removed
Adsorption phenomenon
Adsorption is a surface phenomenon with common mechanism for organic and
inorganic pollutants removal. When a solution containing absorbable solute comes
into contact with a solid with a highly porous surface structure, liquid–solid
intermolecular forces of attraction cause some of the solute molecules from the
solution to be concentrated or deposited at the solid surface. The solute retained (on
the solid surface) in adsorption processes is called adsorbate, whereas, the solid on
which it is retained is called as an adsorbent. This surface accumulation of adsorbate
on adsorbent is called adsorption. This creation of an adsorbed phase having a
composition different from that of the bulk fluid phase forms the basis of separation
by adsorption technology.
In a bulk material, all the bonding requirements (be they ionic, covalent, or metallic)
of the constituent atoms of the material are filled by other atoms in the material.
However, atoms on the surface of the adsorbent are not wholly surrounded by other
adsorbent atoms and therefore can attract adsorbates. The exact nature of the bonding
depends on the details of the species involved, but the adsorption process is generally
classified as physicsorption (characteristic of weak Van Der Waals forces) or
chemisorption (characteristic of covalent bonding). It may also occur due to

ENVIRONMENTAL ENGINEERING-I
Dept. civil engg. ACE, Bangalore Page 133
electrostatic attraction. As the adsorption progress, an equilibrium of adsorption of
the solute between the solution and adsorbent is attained (where the adsorption of
solute is from the bulk onto the adsorbent is minimum). The adsorption amount (qe,
mmol g−1) of the molecules at the equilibrium step was determined according to the
following equation:
Types of adsorbents
Different types of adsorbents are classified into natural adsorbents and synthetic
adsorbents. Natural adsorbents include charcoal, clays, clay minerals, zeolites, and
ores. These natural materials, in many instances are relatively cheap, abundant in
supply and have significant potential for modification and ultimately enhancement of
their adsorption capabilities. Synthetic adsorbents are adsorbents prepared from
Agricultural products and wastes, house hold wastes, Industrial wastes, sewage
sludge and polymeric adsorbents. Each adsorbent has its own characteristics such as
porosity, pore structure and nature of its adsorbing surfaces. Many waste materials
used include fruit wastes, coconut shell, scrap tyres, bark and other tannin-rich
materials, sawdust, rice husk, petroleum wastes, fertilizer wastes, fly ash, sugar
industry wastes blast furnace slag, chitosan and seafood processing wastes, seaweed
and algae, peat moss, clays, red mud, zeolites, sediment and soil, ore minerals etc.
Activated carbons as adsorbent for organic pollutants consists in their adsorption a
complex process and there still exists considerable difficulty. The main cause of this
difficulty results from the large number of variables involved. These include, for
example, electrostatic, dispersive and chemical interactions, intrinsic properties of the
solute (for example solubility and ionization constant), intrinsic properties of the
adsorbent (such pore size distribution), solution properties (in particular, pH) and the
temperature of the system [12].
Activated carbons (AC) (both granular activated carbon (GAC) and powdered activated
carbons (PAC)) are common adsorbents used for the removal of undesirable odor, color,

ENVIRONMENTAL ENGINEERING-I
Dept. civil engg. ACE, Bangalore Page 134
taste, and other organic and inorganic impurities from domestic and industrial waste
water owing to their large surface area, micro porous structure nonpolar character and
due to its economic viability.The major constituent of activated carbon is the carbon that
accounts up to 95% of the mass weight In addition, active carbons contain other hetero
atoms such as hydrogen, nitrogen, sulfur, and oxygen. These are derived from the source
raw material or become associated with the carbon during activation and other
preparation procedures [13-14]. Putra et al. [15] investigated the removal of Amoxicillin
(antibiotic) from pharmaceutical effluents using bentonite and activated carbon as
adsorbents. The study was carried out at several pH values. Langmuir and Freundlich
models were then employed to correlate the equilibria data on which both models fitted
the data equally well. While chemisorption is the dominant adsorption mechanism on the
bentonite, both physicosorption and chemisorption played an important role for
adsorption onto activated carbon.
Adsorption of methane on granular activated carbon (GAC) was studied. The results
showed that with decreasing temperature or increasing methane uptake by GAC the
adsorption efficacy decreased. Interactions between the methane molecules and the
surface of carbon increase the density of adsorbed methane in respect to the density of
compressed gas. The effect that the porosity and the surface chemistry of the activated
carbons have on the adsorption of two VOC (benzene and toluene) at low concentration
(200 ppm) was also studied. The results show that the volume of narrow micropores (size
<0.7 nm) seems to govern the adsorption of VOC at low concentration, specially for
benzene adsorption. AC with low content in oxygen surface groups has the best
adsorption capacities. Among the AC tested, those prepared by chemical activation with
hydroxides exhibit the higher adsorption capacities for VOC. The adsorption capacities
achieved are higher than those previously shown in the literature for these conditions,
especially for toluene. Adsorption capacities as high as 34 g benzene/100 g AC or 64 g
toluene/100 g AC have been achieved [16].
Adsorption of dyes

ENVIRONMENTAL ENGINEERING-I
Dept. civil engg. ACE, Bangalore Page 135
Adsorption techniques are used as high quality treatment processes for the removal of
dissolved organic pollutants, such as dyes, from industrial wastewater. Dyes consider as
type of organic pollutants. The textile, pulp and paper industries are reported to utilize
large quantities of a number of dyes, these pollutant may be found in wastewaters of
many industries generating considerable amounts of colored wastewaters, toxic and even
carcinogenic, posing serious hazard to aquatic living organisms. Dyes represent one of
the problematic groups; they are emitted into wastewater from various industrial
branches, mainly from the dye manufacturing and textile finishing and also from food
coloring, cosmetics, paper and carpet industries. It is well known that the dye effluents
from dyestuff manufacturing and textile industries, may exhibit toxic effects on microbial
populations and can be toxic and/or carcinogenic to mammalian animal. Most dyes used
in textile industries are stable to light and are not biologically degradable. Furthermore,
they are resistant to aerobic digestion. [17].
On searching for economical and available starting materials; different low cost
adsorbents were used for the removal of dyes. Activated rice husk was used as cheap
adsorbent for color removal from wastewater [18]. Hamdaoui [19] reported that the
maximum adsorption of basic dye, methylene blue, onto cedar sawdust and crushed brick
was 60 and 40 mg L-1, respectively. Wood-shaving bottom ash (WBA) was used for the
removal of Red Reactive 141 (RR141), and azo reactive dyes. WBA/H2O and
WBA/H2SO4 adsorbents were made by treating WBA with water and 0.1 M H2SO4,
respectively; to increase adsorption capacity. The effects of different parameters on
adsorption ( effect of contact time, initial pH of solution, dissolved metals and elution )
were studied.The maximum dye adsorption capacities of WBA/H2O and WBA/H2SO4
obtained from a Langmuir model at 30 oC were 24.3, 29.9, and 41.5 mg l-1, respectively.
In addition, WBA/H2O and WBA/H2SO4 could reduce colour and high chemical oxygen
demand (COD) of real textile wastewater [20]. Beer brewery waste has been shown to be
a low-cost adsorbent for the removal of methylene blue dye from the aqueous solution.
The results of preliminary adsorption kinetics showed that the diatomite waste could be

ENVIRONMENTAL ENGINEERING-I
Dept. civil engg. ACE, Bangalore Page 136
directly used as a potential adsorbent for removal of methylene blue on the basis of its
adsorption–biosorptionmechanisms .
Sewage sludge was applied for the preparation of activated carbon adsorbent.
Activated carbon adsorbent prepared from sewage sludge has being identified as a
potentially attractive material for wastewater. Research studies has been conducted to
demonstrate the uses of] produced activated carbon by chemically activation and
pyrolysis of sewage sludge. The properties of this type of material was studied by liquid-
phase adsorption using crystal violet, indigo carmine and phenol as adsorbates. Three
prepared activated carbon,of different particle sizes, were used ASS-g1 (particle
diameter<0.12 mm), ASS-g2 (0.12<particle diameter<0.5 mm) and PSS-g2(0.12<particle
diameter<0.5 mm). Crystal violet dye adsorption has been higher (Qmax 263.2 mg/g
using AAS, 270 mg/g using ASS and 184 mg/g using PPS) than indigo carmine (Qmax
60.04 mg/g using AAS, 54.8 mg/g using ASS and 30.8 mg/g using PPS). They proposed
that activated carbons made from sewage sludge show promise for the removal of organic
pollutants from aqueous streams.
Defluoridation – by nalgonda technique
Defluoridation is process of removal of excess fluoride present in the water. The excess
fluoride in the water causes dental abnormalities, hypertension, peptic ulcer, Skin
infections, defective vision, coronary thrombosis etc. The permissible level of fluoride in
the water is 1mg/litre.
Methods of removal
1. Activated carbons prepared from various materials can be used.
2. Lime – soda process of water softening removes fluorides also along with magnesium

ENVIRONMENTAL ENGINEERING-I
Dept. civil engg. ACE, Bangalore Page 137
3. The materials like calcium phosphate, bone charcoal, synthetic tricalcium phosphate a
may remove excess fluoride.
4. The water may be allowed to pass through filter beds containing floride retaining
materials.
In this technique, sodium aluminate or lime, bleaching powder and filter alum are
added to fluoride water in sequence. The water is stored for ten minutes and settled for
one hour and the water is then withdrawn without disturbing the sediments. The sodium
aluminate or lime accelerates the settlement of precipitate and bleaching powder ensures
disinfection. The alum dose required will depend upon the concentration of fluorides,
alkanity and total dissolved solids in the raw water. It is found that this technique is
simple in operation and economical. It can be used with advantage in villages either on an
individual scale or on a mass scale.
Distribution system
Introduction:After treatment, water is to be stored temporarily and supplied to the
consumers through the network of pipelines called distribution system. The distribution
system also includes pumps, reservoirs, pipe fittings, instruments for measurement of
pressures, flow leak detectors etc. The cost of distribution is about 40 to 70% of the total
cost of the entire scheme. The efficiency of the system depends upon proper planning,
execution and maintenance. Ultimate air is to supply potable water to all the consumers
whenever required in sufficient quantity with required pressure with least lost and
without any leakage.
Requirement of a distribution system:
1. The should convey the treated water upto consumers with the same degree of
purity
2. The system should be economical and easy to maintain and operate

ENVIRONMENTAL ENGINEERING-I
Dept. civil engg. ACE, Bangalore Page 138
3. The diameter of pipes should be designed to meet the fire demand
4. It should safe against any future pollution. As per as possible should not be laid
below sewer lines.
5. Water should be supplied without interruption even when repairs are undertaken
6. The system should be so designed that the supply should meet maximum hourly
demand. A peak factor 2.5 is recommended for the towns of population 0.5. to 2
lakhs. For larger population a factor of 2.0 will be adequate.
System of distribution:
For efficient distribution it is required that the water should reach to every
consumer with required rate of flow. Therefore, some pressure in pipeline is necessary,
which should force the water to reach at every place. Depending upon the methods of
distribution, the distribution system is classified as the follows:
1. Gravity system
2. Pumping system
3. Dual system or combined gravity and pumping system
Gravity system:When some ground sufficiently high above the city area is available , this
can be best utilized for distribution system in maintaining pressure in water mains . This
method is also much suitable when the source of supply such as lake, river or impounding
reservoir is at sufficiently higher than city. The water flows in the mains due to
gravitational forces. As no pumping is required therefore it is the most reliable system for
the distribution of water as shown in fig

ENVIRONMENTAL ENGINEERING-I
Dept. civil engg. ACE, Bangalore Page 139
Pumping system:
Constant pressure can be maintained in the system by direct pumping into mains.
Rate of flow cannot be varied easily according to demand unless number of pumps are
operated in addition to stand by ones. Supply can be effected during power failure and
breakdown of pumps. Hence diesel pumps also in addition to electrical pumps as stand by
to be maintained. During fires, the water can be pumped in required quantity by the stand
by units.
Combined pumping and gravity system:
This is also known as dual system. The pump is connected to the mains as well as
elevated reservoir. In the begining when demand is small the water is stored in the
elevated reservoir, but when demand increases the rate of pumping , the flow in the
distribution system comes from the both the pumping station as well as elevated
reservoir. As in this system water comes from two sources one from reservoir and second
from pumping station, it is called dual system. This system is more reliable and
economical, because it requires uniform rate of pumping but meets low as well as
maximum demand. The water stored in the elevated reservoir meets the requirements of
demand during breakdown of pumps and for fire fighting
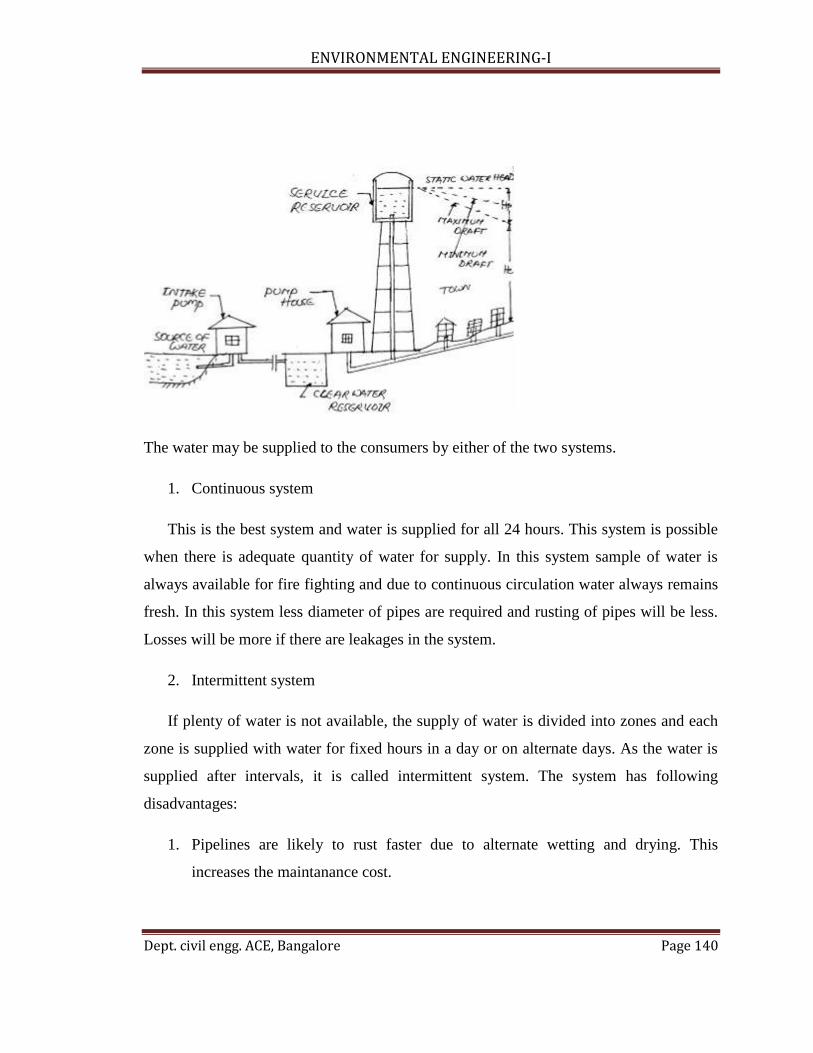
ENVIRONMENTAL ENGINEERING-I
Dept. civil engg. ACE, Bangalore Page 140
The water may be supplied to the consumers by either of the two systems.
1. Continuous system
This is the best system and water is supplied for all 24 hours. This system is possible
when there is adequate quantity of water for supply. In this system sample of water is
always available for fire fighting and due to continuous circulation water always remains
fresh. In this system less diameter of pipes are required and rusting of pipes will be less.
Losses will be more if there are leakages in the system.
2. Intermittent system
If plenty of water is not available, the supply of water is divided into zones and each
zone is supplied with water for fixed hours in a day or on alternate days. As the water is
supplied after intervals, it is called intermittent system. The system has following
disadvantages:
1. Pipelines are likely to rust faster due to alternate wetting and drying. This
increases the maintanance cost.

ENVIRONMENTAL ENGINEERING-I
Dept. civil engg. ACE, Bangalore Page 141
2. There is also pollution of water by ingress of polluted water through leaks during
non-flow periods.
3. More wastage of water due to the tendency of the people to store more water than
required quantity and to waste the excess to collect fresh water each time.
Inspite of number of disadvantages, this system is usually adopted in most of the
cities and towns of India. In this system water can be supplied in the high level localities
with adequate pressure by dividing the city in zones. The repair work can be easily done
in the non-supply hours.
Layouts of distribution system:
Generally in practice there are four different systems of distribution which are used. They
are:
1. Dead End or Tree system
2. Grid Iron system
3. Circular or Ring system
4. Radial system
Dead end or tree system:
This system is suitable for irregular developed towns or cities. In this system
water flows in one direction only into submains and branches. The diameter of pipe
decreases at every tree branch.

ENVIRONMENTAL ENGINEERING-I
Dept. civil engg. ACE, Bangalore Page 142
Advantages
1. Discharge and pressure at any point in the distribution system is calculated easily
2. The valves required in this system of layout are comparatively less in number.
3. The diameter of pipes used are smaller and hence the system is cheap and
economical
4. The laying of water pipes is used are simple.
Disadvantages
1. There is stagment water at dead ends of pipes causing contamination.
2. During repairs of pipes or valves at any point the entire down stream end are
deprived of supply
3. The water available for fire fighting will be limited in quantity
Grid iron system
From the mains water enters the branches at all Junctions in either directions into
submains of equal diameters. At any point in the line the pressure is balanced from two
directions because of interconnected network of pipes.

ENVIRONMENTAL ENGINEERING-I
Dept. civil engg. ACE, Bangalore Page 143
Advantages
1. In the case of repairs a very small portion of distribution are a will be affected
2. Every point receives supply from two directions and with higher pressure
3. Additional water from the other branches are available for fire fighting
4. There is free circulation of water and hence it is not liable for pollution due to
stagnation.
Disadvantages
1. More length of pipes and number of valves are needed and hence there is
increased cost of construction
2. Calculation of sizes of pipes and working out pressures at various points in the
distribution system is laborious , complicated and difficult.
Circular or ring system
Supply to the inner pipes is from the mains around the boundary. It has the same
advantages as the grid-Iron system. Smaller diameter pipes are needed. The advantages
and disadvantages are same as that of grid-Iron system.

ENVIRONMENTAL ENGINEERING-I
Dept. civil engg. ACE, Bangalore Page 144
Radial system:
This is a zoned system. Water is pumped to the distribution reservoirs and from
the reservoirs it flows by gravity to the tree system of pipes. The pressure calculations are
easy in this system. Layout of roads need to be radial to eliminate loss of head in bends.
This is most economical system also if combined pumping and gravity flow is adopted.
Distribution reservoirs provide storage for:
i. Operating storage: to meet demands in excess of the max daily flow, required by the
distribution systems at peak periods. Since water treatment plant, water intake structures
ENVIRONMENTAL ENGINEERING-I
Dept. civil engg. ACE, Bangalore Page 145
and pumping stations are designed for max daily flow, demands on the system in excess
of this rate must be met by storage.
ii. Fire storage: storage should provide fire flows:
-12 hrs in large communities
- > 2hrs in small communities
iii. Emergency storage: calculated by multiplying the max daily demand by a factor, K:
K = 0.50 for Turkey
K = 1.0 for Germany
K = 2.0 for Germany long transmission line
K = 3.0 for USA
To provide operating pressure. The service reservoir should be located such that it should
provide the required pressure at every point in the distribution system.
Types of Reservoirs:
i. Surface reservoirs (underground type)
ii. Elevated reservoirs (water tower)
According to plan:
In general, service reservoirs can be:
- rectangular or square
- circular
Water towers can be made of concrete or steel. The most suitable form for concrete
towers is a cylinder with an intze shaped bottom or with a flat bottom. Steel tanks may
have a spherical or dome shaped bottom

ENVIRONMENTAL ENGINEERING-I
Dept. civil engg. ACE, Bangalore Page 146
1. The lowest water level in the tank is determined according to the pressure
requirement in the distribution system, which may vary from 15m to 50m of
water, depending on the type of community and the pressure requirement in the
different areas of a city.
2. In order to keep pumping cost minimum, the depth of water in the tank is
generally kept small.
3. Due to structural considerations, the depth is kept equal to the diameter. For
circular tanks, the following formulae for the diameter can be used:
Water tower volume (m3) Diameter of the water tower (m)
100 – 500 5 + Volume/100
500 - 1000 8 + Volume/250
Design of reservoirs
The capacity of reservoirs is governed by a number of factors which are covered in IS:
5477 (Parts 1 to 4). From the point of view of sediment deposition, the following points
may be given due consideration:
a) The sediment yield which depends on the topographical, geological and geo-
morphological set up, meteorological factors, land use/land cover, intercepting tanks, etc;
b) Sediment delivery characteristics of the channel system;
c) The efficiency of the reservoir as sediment trap;
d) The ratio of capacity of reservoir to the inflow;
e) Configuration of reservoir;
f) Method of operation of reservoir;
g) Provisions for silt exclusion.
ENVIRONMENTAL ENGINEERING-I
Dept. civil engg. ACE, Bangalore Page 147
The rate of sediment delivery increases with the volume of discharge. The percentage of
sediment trapped by a reservoir with a given drainage area increases with the capacity. In
some cases an increased capacity will however, result in greater loss of water due to
evaporation. However, with the progress of sedimentation, there is decrease of storage
capacity which in turn lowers the trap efficiency of the reservoir.
The capacity of the reservoir and the size and characteristics of the reservoir and its
drainage area are the most important factors governing the annual rate of accumulation of
sediment. Periodical reservoir sedimentation surveys provide guidance on the rate of
sedimentation. In the absence of observed data for the reservoir concerned, data from
other reservoirs of similar capacity and catchment characteristics may be adopted.
Silting takes place not only in the dead storage but also in the live storage space in the
reservoir. The practice for design of reservoir is to use the observed suspended sediment
data available from key hydroIogica1 networks and also the data available from
hydrographic surveys of other reservoirs in the same region.

ENVIRONMENTAL ENGINEERING-I
Dept. civil engg. ACE, Bangalore Page 148
UNIT-8
MISCELLANEOUS
Water main appurtenances
Setting of valve and fittings – Valves and fittings installed in trenches shall belocated
where indicated by the drawings and as directed by the Engineer. Valves, fittings, plugs,
and caps shall be set and joined to pipe in the manner specified for cleaning, laying and
joining pipe. Fittings will be blocked using only cast-in-place concrete blocks unless
otherwise approved by the Engineer. No wood blocking shall be allowed. The valve box
shall not transmit shock or stress to the valve and shall be centered and plumb over the
operating nut of the valve, with the box cover flush with the
surface of the finished pavement or such other level as may be directed by the Engineer.
Setting of fire hydrants
Fire hydrants shall be in accordance with the City of Kearney‟s Standard Fire Hydrant
Setting Detail. Hydrants are to be set at suchcover. All hydrants shall stand plumb and
shall have their steamer nozzle facing the curb or street. Around the base of the hydrant
10 cubic feet (0.28 Cu. M.) of crushedrock or gravel shall be placed so that the hydrant
will completely drain when closed. Backfill around the hydrant shall be firmly tamped to
the surface of the finished grade and to a distance of 5 feet (1.52 m) around the hydrant.
Before placing any hydrant, care shall be taken to see that all foreign material is removed
from within the body or barrel. The stuffing boxes shall be tightened and the hydrant or
valve opened and closed to see that all parts are in working condition. Hydrants shall be
painted two coats
of approved paint, and colors as selected by the Owner, to the ground line and black
below the ground line.

ENVIRONMENTAL ENGINEERING-I
Dept. civil engg. ACE, Bangalore Page 149
Installation of bracing, supporting and anchoring –
Blocking, bracing, anchoring, or other acceptable means for the prevention of movement,
shall be installed. All blocking, bracing, supporting and anchoring shall be in accordance
with the City of Kearney‟s Standard Blocking Detail and the City of Kearney‟s Standard
Fire Hydrant Detail with the use of concrete as specified in section #12 Portland Cement
Concrete Paving of this standard specification.
A. Anchorage for fire hydrants – The bowl of each hydrant shall be well braced against
the undisturbed natural earth at the end of the trench with a concrete anchor placed
behind and a precast block beneath the bowl. The fire hydrant valve shall be tied to the
fire hydrant tee with anchor pipe or with two (2) ¾ inch (1.91 cm) or larger all-thread
rods as shown on the City of Kearney‟s Standard Fire Hydrant Detail, Mega Lugs /
retaining glands will be allowed. Whenever a fire hydrant is the means of terminating a
water main (such as in a cul-desac); the tie rods and concrete reverse anchors will be
required for both the fire hydrant valve (which in this case is also a line valve on the
main) and the fire hydrant lateral ofthe branch feeder pipe connected directly to the fire
hydrant. Additional concrete anchors shall be as directed by the Engineer.
B. Anchorage for plugs, caps, tees, taps and bends – Plugs, caps, tees and bends shall be
provided with reaction backing in accordance with the City of Kearney‟s Standard
Blocking Detail. Reverse concrete anchor and tie backs are acceptable. Blocking shall be
placed between solid ground and the fitting to be anchored; the area of bearing on the
pipe and on the ground, in each instance, shall be shown or directed by the Engineer. No
wood or precast blocks shall used as a permanent blocking. Temporary blocking may be
used as directed by the Engineer. Blocking will be required regardless of whether a
tapping tee or tapping saddle is used. Such blocking will in all cases be sized and placed
in a manner that will adequately transfer thrust reaction to solid undisturbed ground or the
equivalent thereof.

ENVIRONMENTAL ENGINEERING-I
Dept. civil engg. ACE, Bangalore Page 150
C. Forming for concrete thrust blocks and anchors – All forming for concrete thrust
blocks and anchors will be done by bulk heading around the shape ofthrust block or
anchor with burlap or reinforced paper sacks which have been filled with sand or earth, or
other Engineer approved forming method. Filled sacks used to form concrete blocks will
be left in place in the trench and backfill will be placed around and over them in the usual
manner. Any bolt head or fitting must be left accessible whenpouring concrete about
them. If the fitting is to be covered completely upon direction of the Engineer, then the
joint must be wrapped with suitable polyethylene. Minimum curing time for concrete
anchors regardless of additives shall be thirty-six (36) hours for anchors containing 2
cubic yards (1.53 cu. M) or less, fort-eight (48) hours for anchors containing more than 2
cubic yards (1.53 cu. M) but less than 6 cubic yards (4.59 cu. M) and seventy-two (72)
hours for anchors containing more than 6 cubic yards (4.59 cu. M) but less than 12 cubic
yards (9.17 cu. M). Anchors containing more than 12 cubic yards (9.17 cu. M) will be
cured as directed by the Engineer. Curing time for anchors having flanged rods or other
accessories embedded in them for the purpose of tying pipe and/or fittings directly to the
anchor will require approximately 25% additional curing time
Understand the various appurtenances in a distribution system
The various devices fixed along the water distribution system are known as appurtences.
The necessity of the various appurtenances in distribution system are as follows
1. To control the rate of flow of water
2. To release or admit air into pipeline according to the situation
3. To prevent or detect leakages
4. To meet the demand during emergency and
5. Ultimately to improve the efficiency of the distribution
The following are the some of the fixtures used in the distribution system.

ENVIRONMENTAL ENGINEERING-I
Dept. civil engg. ACE, Bangalore Page 151
(i) Valves
(ii) Fire hydrants and
(iii)Water meter
Types of valves
In water works practice, to control the flow of water, to regulate pressure, to release or to
admit air, prevent flow of water in opposite direction valves are required.
The following are the various types of valves named to suit their function
1. Sluice valves
2. Check valves or reflex valves
3. Air valves
4. drain valves or Blow off valves
5. Scour valve
Sluice valves
These are also known as gate-valves or stop valves. These valve control the flow
of water through pipes. These valves are cheaper, offers less resistance to the flow of
water than other valves. The entire distribution system is decided into blocks by
providing these valves at appropriate places. They are provided in straight pipeline at
150-200m intervals. When two pipes lines interest, valves are fixed in both sides of
intersection. When sluice valve is closed, it shuts off water in a pipeline to enable to
undertake repairs in that particular block. The flow of water can be controlled by raising
or lowering the handle or wheel.

ENVIRONMENTAL ENGINEERING-I
Dept. civil engg. ACE, Bangalore Page 152
Check valve or Reflux valve
These valves are also known as non-return valves. A reflux valve is an automatic device
which allows water to go in one direction only. The swing type of reflux valve as shown
in fig is widely used in practice.When the water moves in the direction of arrow, the
valve swings or rotates around the pivot and it is kept in open position due to the pressure
of water. When the flow of water in this direction ceases, the water tries to flow in a
backward direction. But this valve prevents passage of water in the reverse
direction.Reflux valve is invariably placed in water pipe, which obtain water directly
from pump. When pump fails or stops, the water will not run back to the pump and thus
pumping equipments will be saved from damage

ENVIRONMENTAL ENGINEERING-I
Dept. civil engg. ACE, Bangalore Page 153
Air valves :These are automatic valves and are of two types namely
1. Air inlet valves
2. Air relief valves
Air inlet valves
These valves open automatically and allow air to enter into the pipeline so that the
development of negative pressure can be avoided in the pipelines. The vacuum pressure
created in the down streamside in pipelines due to sudden closure of sluice valves. This
situation can be avoided by using the air inlet valves.
Air relief valves
Sometimes air is accumulated at the summit of pipelines and blocks the flow of
water due to air lock. In such cases the accumulated air has to be removed from the pipe
lines. This is done automatically by means of air relief valves.This valve consists of a
chamber in which one or two floats are placed and is connected to the pipe line. When
there is flow under pressure in the pipeline water occupies the float chamber and makes
the float to close the outlet. But where there is accumulation of air in the pipeline, air
enters the chamber, makes the float to come down, thus opening the outlet. The
accumulated air is driven out through the outlet.
Drain valves or blow off valves

ENVIRONMENTAL ENGINEERING-I
Dept. civil engg. ACE, Bangalore Page 154
These are also called wash out valves they are provided at all dead ends and
depression of pipelines to drain out the waste water. These are ordinary valves operated
by hand.
Scour valves
These are similar to blow off valves. They are ordinary valves operated by hand.
They are located at the depressions and dead ends to remove the accumulated silt and
sand. After the complete removal of silt; the value is to be closed.
Water meter
These are the devices which are installed on the pipes to measure the quantity of
water flowing at a particular point along the pipe. The readings obtained from the meters
help in working out the quantity of water supplied and thus the consumers can be charged
accordingly. The water meters are usually installed to supply water to industries, hotels,
big institutions etc. metering prevents the wastage of purified water.
Fire hydrants
A hydrant is an outlet provided in water pipe for tapping water mainly in case of fire.
They are located at 100 to 150 m a part along the roads and also at junction roads. They
are of two types namely.
1. Flush Hydrants. 2. Post Hydrants
1. Flush Hydrants
The flush hydrants is kept in under ground chamber flush with footpath covered by C.I.
cover carrying a sign board “F-H”.
3. Post Hydrants

ENVIRONMENTAL ENGINEERING-I
Dept. civil engg. ACE, Bangalore Page 155
The post hydrant remain projected 60 to 90cm above ground level as shown in fig 7.4
They have long stem with screw and nut to regulate the flow. In case of fire accident , the
fire fighting squad connect their hose to the hydrant and draw the water and spray it on
fire.
A good fire hydrant
1. Should be cheap
2. Easy to connect with hose
3. Easily detachable and reliable
4. Should draw large quantity of water
Pipe fittings
In addition to the pipes, valves, tapes, various types of pipe fittings such as
unions, caps, plugs, flanges, nipples, crosses, tees, elbows, bends etc are used during
laying of distribution pipes The common pipe fittings are shown in

ENVIRONMENTAL ENGINEERING-I
Dept. civil engg. ACE, Bangalore Page 156

ENVIRONMENTAL ENGINEERING-I
Dept. civil engg. ACE, Bangalore Page 157

ENVIRONMENTAL ENGINEERING-I
Dept. civil engg. ACE, Bangalore Page 158