veterinary immunology and immunopathology - umass.edu · veterinary immunology and immunopathology...
TRANSCRIPT

R
Sc
MAa
b
c
a
ARR1A
KFTIIIC
1
lm
0d
Veterinary Immunology and Immunopathology 140 (2011) 90–101
Contents lists available at ScienceDirect
Veterinary Immunology and Immunopathology
journa l homepage: www.e lsev ier .com/ locate /vet imm
esearch paper
ubpopulations of equine blood lymphocytes expressing regulatory Tell markers
elissa G. Robbina, Bettina Wagnerb, Leela E. Noronhac, Douglas F. Antczakc,manda M. de Mestrea,∗
The Royal Veterinary College, Department Veterinary Basic Sciences, Royal College Street, London, NW1 0TU, United KingdomDepartment of Population Medicine and Diagnostic Sciences, College of Veterinary Medicine, Cornell University, Ithaca, NY, USABaker Institute for Animal Health, College of Veterinary Medicine, Cornell University, Ithaca, NY, USA
r t i c l e i n f o
rticle history:eceived 17 September 2010eceived in revised form8 November 2010ccepted 23 November 2010
eywords:OXP3regsL-10FN�mmunosuppressionD4+ cells
a b s t r a c t
Several distinct T lymphocyte subpopulations with immunoregulatory activity have beendescribed in a number of mammalian species. This study performed a phenotypic analysisof cells expressing regulatory T cell (Treg) markers in the peripheral blood of a cohort of18 horses aged 6 months to 23 years, using antibodies to both intracellular and cell surfacemarkers, including Forkhead box P3 (FOXP3), CD4, CD8, CD25, interferon gamma (IFN�)and interleukin 10 (IL-10). In peripheral blood, a mean of 2.2 ± 0.2% CD4+ and 0.5 ± 0.1%CD8+ lymphocytes expressed FOXP3. The mean percentage of CD4+FOXP3+ cells was foundto be significantly decreased in horses 15 years and older (1.5%) as compared to horses 6years and younger (2.7%), but did not differ between females and males and ponies andhorses. Activation of peripheral blood mononuclear cells by pokeweed mitogen resulted ininduction of CD25 and FOXP3 expression by CD4+ cells, with peak expression noted after48 and 72 h in culture respectively. Activated CD4+FOXP3+ cells expressed IFN� (35% ofFOXP3+ cells) or IL-10 (9% FOXP3+ cells). Cell sorting was performed to determine FOXP3expression by CD4+CD25−, CD4+CD25dim and CD4+CD25high subpopulations. Immediatelyfollowing sorting, the percentage of CD4+FOXP3+ cells was higher within the CD4+CD25high
population (22.7–26.3%) compared with the CD4+CD25dim (17% cells) but was similar within
the CD4+CD25dim and CD4+CD25high cells after resting in IL-2 (9–14%). Fewer than 2% of cellsin the CD4+CD25− population expressed FOXP3. These results demonstrate heterogeneityin equine lymphocyte subsets that express molecules associated with regulatory T cells.CD4+FOXP3+ cells are likely to represent natural Tregs, with CD4+FOXP3+IL-10+ cells rep-resenting either activated natural Tregs or inducible Tregs, and CD4+FOXP3+IFN�+ cellslikely to represent activated Th1 cells.. Introduction
T regulatory cells (Tregs) are a subpopulation of Tymphocytes that contribute to control and balance of
any types of immune responses. Studies in mice and
∗ Corresponding author. Tel.: +44 207 121 1906; fax: +44 207 388 2342.E-mail address: [email protected] (A.M. de Mestre).
165-2427/$ – see front matter © 2010 Elsevier B.V. All rights reserved.oi:10.1016/j.vetimm.2010.11.020
© 2010 Elsevier B.V. All rights reserved.
humans have demonstrated a role for these cells in awide range of conditions, including allergies, clearanceof chronic infections, autoimmunity, cancer, transplanta-tion, and pregnancy (Aluvihare et al., 2004; Askenasy et
al., 2008; Ozdemir et al., 2009). Tregs exert their effectsthrough a number of distinct mechanisms that includesecretion of inhibitory cytokines such as IL-10 and TGF�,direct cell–cell contact and cytolysis, metabolic disruptionof effector T cells, and modulation of dendritic cell function
logy and
M.G. Robbin et al. / Veterinary Immuno(Miyara and Sakaguchi, 2007; Shevach, 2009; Takahashiet al., 1998).
Tregs can be subdivided into lineages, namely natu-ral Tregs (nTregs) that are derived in the thymus, andinducible Tregs (iTregs) that are generated in the periph-ery from conventional CD4+ T cells. The latter populationof cells includes Forkhead box P3 (FOXP3)+ iTregs (Curottode Lafaille and Lafaille, 2009), as well as FOXP3-iTregs,such as Tr1 cells that express IL-10 and IFN� (Roncaroloet al., 2006) and TH3 cells induced by TGF� and foundpredominantly in the gastrointestinal tract (Saurer andMueller, 2009). Much effort has been directed towardsidentifying suitable markers to distinguish the varioustypes of Tregs from conventional CD4 cells. At presenta combination of cell surface and intracellular moleculesare utilized to define Tregs in humans and mice, includ-ing FOXP3, CD4, CD25, cytotoxic T-lymphocyte antigen4 (CTLA4), glucocorticoid-induced TNFR-related protein(GITR), lymphocyte-activation gene 3 (LAG-3) and inter-leukin 7 receptor (CD127) (Sakaguchi et al., 2009; Sansomand Walker, 2006). With the exception of CD4, most ofthese markers are classically up-regulated upon cell acti-vation, making the differentiation of activated CD4 cellsand Tregs challenging. The transcription factor FOXP3has been widely accepted as a specific marker of nonactivated Tregs (Sakaguchi et al., 2009) although it can-not be used for selection of viable cells for functionalassays because intracellular labeling requires killing thecells. Furthermore, human studies have shown that FOXP3expression is transiently and non-specifically inducedin vitro in CD4+ cells (Allan et al., 2007; Gavin et al.,2006) in a manner not related to Tregs or their func-tion.
Extensive phenotypic and functional characterizationof Tregs has been performed in mice and humans, andmore recently these cells have also been described in cats(Lankford et al., 2008; Vahlenkamp et al., 2004), dogs(Biller et al., 2007; Keppel et al., 2008), swine (Kaseret al., 2008) and cattle (de Almeida et al., 2008). In con-trast, very little is known about the characteristics ofequine Tregs. CD4+IFN�+IL10+ cells have been identi-fied, and we proposed they represent Tr1 cells in thehorse (Wagner et al., 2008). We recently identified aFOXP3 antibody (PCH101) that labeled approximately 2%of CD4+ cells in the peripheral blood of pregnant mares(de Mestre et al., 2010). In addition, we showed theseCD4+FOXP3+ cells were expanded in the tissues, notablyat the equine fetal–maternal interface. In addition to preg-nancy, Tregs are likely to influence the outcome of anumber of equine conditions, for example clearance ofchronic viral infections such as Equine Herpes Virus (EHV),in allergic lung disease, and in recovery from endotox-emia, a common complication in horses suffering fromcolic (Driscoll et al., 2008). Consequently, it is impor-tant to define the characteristics of Tregs in the horse.The aim of this study was to perform phenotypic char-
acterisation of Tregs ex vivo and following in vitro cellactivation in a cohort of healthy horses. Using a panelof cell surface and intracellular markers, this researchdefines a number of subpopulations of equine FOXP3+lymphocytes.Immunopathology 140 (2011) 90–101 91
2. Materials and methods
2.1. Horses
These studies used healthy geldings, mares and stallionsof several breeds (primarily Thoroughbreds, Standard-breds, Welsh and New Forrest ponies) aged 6 months to23 years. Horses were maintained either at The Royal Vet-erinary College, United Kingdom, or the Baker Institute forAnimal Health, Cornell University, USA. Animal care wasperformed in accordance with the guidelines set forth byProject Licences granted by the Home Office, United King-dom and the Institutional Animal Care and Use Committeeof Cornell University.
2.2. RNA isolation and cDNA synthesis
Total RNA was isolated from PBMC, following homog-enization by QIAshredder (Qiagen, Valencia, CA), using aRNeasy kit (Qiagen) as directed by the manufacturer. Fivehundred nanograms of total RNA was treated with DNase I(Invitrogen, Carlsbad, CA), then first strand cDNA synthesiswas carried out using M-MLV Reverse transcriptase (USB,Cleveland, OH) as previously described (de Mestre et al.,2009).
2.3. Reverse transcriptase-PCR (RT-PCR) amplificationand sequencing
Primers were designed using Primer3(http://fokker.wi.mit.edu/primer3/input.htm). Primersequences for cloning of full length FOXP3 were cFOXP3F145′-ccggaagcttatgcccaactccaggccagcc-3′ and cFOXP3R145′-gcgcggatccctggggccaggtgtggggttgga-3′. Amplificationof 20 ng PBMC cDNA was performed in a 25 �l reactionusing standard PCR conditions and Cloned pfu DNA poly-merase (Agilent, Santa Clara, CA) as per the manufacturer’sinstructions. Products were separated by electrophoresison 1% agarose gels, stained with ethidium bromide, andvisualized under a Spectroline UV Transilluminator (Spec-tronic, Westbury, NY). PCR products were purified andcloned, and sequenced to confirm the sequence of FOXP3(GenBank Accession number HQ596523).
2.4. 5′ RACE RT-PCR
5′ rapid amplification of cDNA Ends (RACE) PCRwas carried out on RNA isolated from PBMC usinga Marathon cDNA Amplification system (Clontech,Palo Alto, CA) according to the manufacturers instruc-tions with the equine FOXP3 specific oligonucleotidesFOXP3GSP1 5′-ggaaggctgatcatag-3′ and FOXP3GSP25′-ctggaggagtgcctgcaagt-3′. The amplified product waspurified, cloned, and sequenced as previously described(de Mestre et al., 2009).
2.5. CD25-IgG1 expression vector and expression in CHOcells
The extracellular region of the equine CD25 gene(Genbank Accession number HQ596524) was cloned into

9 ogy and
tevroHhcDc
2
iabeM2eCs(eciuDccupmf(Hlewto
2c
wCDowA(oM2Hpic
2 M.G. Robbin et al. / Veterinary Immunol
he expression vector IGHG1/pcDNA and CD25/IgG1 wasxpressed in Chinese Hamster Ovary (CHO) cells as pre-iously described (Wagner et al., 2005). The extracellularegion of the CD25 cDNA corresponded to bases 211–939f the Genbank sequence (Genbank Accession numberQ596524). Transfected cells were fixed with 2% formalde-yde and used for intracellular staining with Alexa647onjugated anti-equine IgG1 (CVS45, kindly provided byr. D.P. Lunn) and anti-human CD25 (see below) and flowytometric analysis.
.6. Isolation and culture of equine PBMC and CD4+ cells
Equine peripheral blood was collected by venipuncturento tubes or collection bags supplemented with 15 iu hep-rin/ml blood (Sigma–Aldrich, UK). PBMC were isolatedy Ficoll (Ficoll-Paque TM, GE Healthcare) density gradi-nt centrifugation and cultured as previously described (deestre et al., 2010). PBMC were cultured with or without
.5 �g/ml pokeweed mitogen (PWM) (Sigma) and 1 ng/mlquine rIL-2 (Kingfisher Biotech, St. Paul, MN) for up to 72 h.ells used for the analysis of cytokine expression were re-timulated with 25 ng/ml phorbol 12-myristate 13-acetatePMA) and 1 �M ionomycin (IO) (both Sigma) in the pres-nce of 10 ug/ml Brefeldin A (Sigma) for the final 4 h ofulture (Wagner et al., 2008). Ex vivo PBMC were pos-tively selected on CD4 (VMRD, Pullman, Clone HB61A)sing magnetic selection with the ‘Any Species EasySepo-It-Yourself kit’ (Stem Cell Technologies), and Dulbec-os PBS 2% FCS (Stem Cell Technologies) and the purityonfirmed to be greater than 97%. CD4+ cells were stim-lated for 48 h with 2.5 �g/ml PWM, then labeled with aolyclonal cross-reactive anti-human Ab to the cell surfacearker CD25 (AF223-NA) (R&D Systems, Minneapolis, MN)
or FACS-sorting based on the intensity of CD25 expressionMoFlo XDP (Beckman Coulter, USA) at Institute of Childealth, London). Three populations of CD4+ cells were iso-
ated, CD25−, CD25dim and CD25high. FOXP3 expression byach subpopulation of cells (CD25−, CD25dim and CD25high)as determined by flow cytometric analysis (see below) at
wo different time points: immediately following sortingr following resting for 48 h in 1 ng/ml equine rIL-2.
.7. Cell surface and intracellular staining and flowytometric analysis
PBMC, CD4 positively selected, or CD4 negative cellsere labeled with mAb to equine cell surface markersD4 (HB61A, VMRD), or CD8 (CVS8, kindly provided byr. D.P. Lunn) directly conjugated to Alexa-647 as previ-usly described (de Mestre et al., 2010). Alternatively cellsere labeled with a polyclonal human anti-CD25, CloneF223NA (R&D Systems) or a Goat IgG isotype control
AB-108-C, R&D Systems). Cytokine staining was carriedut using anti-bovine IFN� (Clone CC302, AbD Serotec,orphoSys, Oxford, UK), anti-equine IL-10 (Wagner et al.,
008) and mouse IgG1/kappa isotype control (eBioscience,atfield, United Kingdom) all conjugated to Alexa 488 asreviously described (de Mestre et al., 2010). Detection of
ntracellular expression of FOXP3 was carried out usingross-reactive antibodies against human FOXP3 (PCH101,
Immunopathology 140 (2011) 90–101
eBioscience) conjugated to either PE or APC and mousefoxp3 (FJK-16s, eBioscience) conjugated to PE, or isotypecontrol (PE or APC) (Rat IgG2a, eBioscience) as previouslydescribed (de Mestre et al., 2010). Flow cytometry was per-formed using a BD Canto II (BD Biosciences, Franklin Lakes,NJ). Lymphocytes were gated using forward and side scat-ter characteristics and data analysis was performed usingFlowjo software (FlowJo, Tree Star, Ashland).
2.8. SDS-PAGE and Western blotting
Protein cell lysates were prepared from snap frozenequine spleen or 40 × 106 equine PBMC by resuspension oftissue or cells in lysis buffer as previously described (Hulettet al., 2000). Western blot analysis was used to detectequine FOXP3 protein expression in cell lysates using puri-fied anti-human FOXP3 (PCH101) following the protocolpreviously described (de Mestre et al., 2007). Chemilumi-nesence was detected using ECL Western blot detectionreagents as described by the manufacturer (Amersham,United Kingdom).
2.9. Statistical analysis
Statistical analysis was performed using Graphpad Soft-ware, Prism 5 for Mac OS X Version 5.0c (Graphpad Inc.,La Jolla, CA, USA). Data was first assessed for Normalityusing D’Agostino and Pearson omnibus tests and found tobe normally distributed. A comparison of protein expres-sion between non-stimulated and stimulated cells and alsowithin different subpopulations of lymphocytes was anal-ysed using One way ANOVA with post hoc Bonferroni’smultiple comparison test of selected columns. A p valueof <0.05 was considered significant.
3. Results
3.1. Cloning and sequencing of FOXP3 mRNA andWestern blot analysis of equine FOXP3 protein expression
Full length FOXP3 mRNA was cloned and sequencedusing primers designed in the 5′UTR and 3′UTR (Accessionno. HQ596523). To determine the transcription start sitefor horse FOXP3 mRNA, 5′ RACE-PCR using the primers,GSP2FOXP3 and AAP was performed on Tdt labeled cDNAgenerated from PBMC (Fig. 1A). Sequencing of the productof approximately 400 bp resulted in identification of a tran-scription start site 70 bp upstream of the translation startcodon. Alignment of the equine FOXP3 mRNA sequencegenerated above and the predicted amino acid sequencerevealed a high level of homology with human (Fig. 1Band C), mouse, dog, cat and cow sequences at both thenucleic acid and amino acid level (Fig. 1B). Next, Westernblot analysis was used to determine the cross reactivity ofan anti-human FOXP3 Ab (PCH101) against equine FOXP3.PCH101 was selected as it was directed against a regionin the protein well conserved between horse and human
(Fig. 1C), and it detected multiple FOXP3 splice variantsdescribed for human protein that could potentially existin the horse. A strong band consistent with the predictedsize of equine FOXP3 (47 kDa) was detected in both spleenand PBMC cell lysates (Fig. 1D).
M.G. Robbin et al. / Veterinary Immunology and Immunopathology 140 (2011) 90–101 93
Fig. 1. Cloning of equine FOXP3 mRNA and conserved identity with other species. (A) Identification of the transcription start site for equine FOXP3 using 5′
RACE-PCR. TdT Tailed cDNA (+Tdt) and control cDNA (−Tdt) generated from PBMC was used as the template for RT-PCR using oligonucleotides FOXP3 GSP2ercenta
e and huin underdy (PCH
and an abridged anchor primer. NTC indicates no template control. (B) Pwith human, mouse, dog, cat and cow sequences. (C) Alignment of hors(PCH101, eBiosceince) is directed against the region of the human proteequine spleen and PBMC using an anti-human FOXP3 monoclonal antibo
3.2. FOXP3 expression by equine PBMC
Flow cytometric analysis of FOXP3 expression by ex vivoPBL was performed using the antibody clone PCH101 (deMestre et al., 2010) (Fig. 2A) or a cross-reactive anti-mousefoxp3 antibody (FJK-16s) (Fig. 2B), together with antibodiesdirected against equine CD4 or CD8. These results indi-cate that of the small FOXP3+ population, 80–90% alsoexpressed CD4 and 6–15% also expressed CD8. The label-ing of cells with either anti-human FOXP3 or anti-mouse
foxp3 revealed similar FOXP3 expression patterns. Con-sequently, all further analysis of FOXP3 expression wasperformed using PCH101 as it had been additionally val-idated using Western blotting (Fig. 1D). The percentageof PBL that express FOXP3 was then assessed in a cohortge identity of the nucleic acid and amino acid sequence of horse FOXP3man FOXP3 amino acid sequences. The cross reactive anti-human mAblined in bold. (D) Western blot analysis of FOXP3 protein expression by
101).
of 18 horses of mixed gender, breed and age. We demon-strated that FOXP3 was expressed in a mean of 1.7 ± 0.13%of lymphocytes (n = 18, Mean ± SEM%) (Fig. 2C), 2.2 ± 0.2%CD4+ lymphocytes (n = 18) and 0.5 ± 0.1% CD8+ lympho-cytes (n = 13) (Fig. 2C).
3.3. The percentage of FOXP3+CD4+ lymphocytesdecreases with age
To determine the effect of gender, horse type and age
on the percentage CD4+ cells that express FOXP3, we per-formed additional analysis of the data obtained in Fig. 2C.The mean percentage of CD4+ cells that express FOXP3did not differ between males and females, or betweenhorses and ponies (Fig. 3A and B). We observed a decrease
94 M.G. Robbin et al. / Veterinary Immunology and Immunopathology 140 (2011) 90–101
Fig. 2. FOXP3 expression by equine peripheral blood lymphocytes. Flow cytometric analysis of FOXP3 expression in equine lymphocyte populations witht e dots po n FOXP3( dy (FJKo and CD8
ian((
3e
uocFPFlvseh
wo cross-reactive antibodies against FOXP3. Images show representativf cells in each quadrant. (A) Double labeling of PBMC with an anti-humaB) Double labeling of PBMC with an anti-mouse foxp3 monoclonal antibof FOXP3 expression by lymphocytes (n = 18 horses) and (D) CD4 (n = 18)
n the percentage of CD4+FOXP3+ lymphocytes as horsesged (Fig. 3C). Horses aged six and under had a sig-ificantly higher mean percentage of CD4+FOXP3+ cells2.7%) compared to those aged fifteen and over (1.5%)p = 0.0295).
.4. FOXP3 expression increases upon stimulation ofquine PBMC
Human T cells transiently and non-specifically upreg-late FOXP3 expression following cell activation, anutcome not observed following activation of mouse Tells. To determine the effect of cell activation on equineOXP3 expression, we treated PBMC with the T cell agonistWM and then labeled the cells with antibodies againstOXP3 and CD4 (n = 4 horses). The percentage of CD4+
ymphocytes expressing FOXP3, increased upon cell acti-ation from 2.6% (T0) to 16.4% (T72 h) (Fig. 4A and B). Aignificant increase in the percentage of CD4+ cells thatxpress FOXP3 was detected as early as 24 h (6.8%), withighest levels of 4-fold over non-stimulated cells observedlots of cells gated on lymphocytes with numbers indicating percentagesmonoclonal antibody (PCH101) and anti-equine CD4 or CD8 antibodies.
-16s) and anti-equine CD4 or CD8 antibodies. (C) Graphic representation(n = 13) cells.
at 72 h post-activation (p = 0.0090) (Fig. 4A and B). Thelevel of FOXP3 expression also increased following cellactivation, as reflected by the increase in mean fluores-cence intensity (MFI): 0 h (MFI = 1152), 24 h (MFI = 2489),48 h (MFI = 3067) and 72 h (MFI = 5163). The percentageof FOXP3+cells within the CD4− population was alsoincreased at 72 h, although the percentages remainedsignificantly lower at all time points when comparedwith CD4+ lymphocytes (2–9.8% vs 6.8–16.4%) (p < 0.05)(Fig. 4C). There was no significant difference in percentageof CD4+ and CD4− lymphocytes expressing FOXP3 culturedfor up to 72 h in the absence of stimuli suggesting in vitroculture alone has no effect on FOXP3 expression (Fig. 4Band C).
3.5. CD25 expression increases upon stimulation of
equine PBMCCD25 (IL2 receptor alpha) is both constitutivelyexpressed by Tregs and induced in lymphocytes upon cellactivation. In addition to the marker CD4, the cell surface

M.G. Robbin et al. / Veterinary Immunology and Immunopathology 140 (2011) 90–101 95
P3+ celd (C) ho
Fig. 3. Effect of gender, type of horse and age on percentage of CD4+FOXcompared between (A) male and female horses, (B) horses and ponies anindicates p-value < 0.05.
marker CD25 has been utilized in other species to iden-tify and isolate Tregs for functional assays. Currently thereare no equine specific CD25 antibodies available, and dueto the relatively low homology of the equine CD25 gene, ithas also been challenging to identify suitable cross-reactiveCD25 antibodies. Recently, an anti-human CD25 polyclonalantibody (AF223NA) was described to cross react withequine CD25 (Steinbach et al., 2009). To confirm the speci-ficity and affinity of this antibody, we labeled CHO cellstransfected with an expression vector encoding a chimericequine CD25/IgG1 molecule with anti-human CD25, and/oranti-IgG1 (as a control) (Fig. 5A). Double staining of tran-sient transfectants showed that IgG1 expressing cells werealso detected by the anti-CD25 antibody (Fig. 5A). The MFIof cells labeled with anti-CD25 was lower than that of cellslabeled with anti-IgG1, suggesting that the anti-CD25 anti-body bound with low affinity. Next, in order to establishCD25 expression by equine lymphocytes as detected bythis antibody, we examined CD25 expression on both non-stimulated and PWM activated CD4+ lymphocytes (n = 3horses). CD25 expression was detected at levels compara-ble to those of the isotype control in non-stimulated CD4+
lymphocytes suggesting CD25 expression on resting lym-phocytes was undetectable with this antibody (Fig. 5B).CD25 protein was reproducibly detected after cell activa-tion, with mean percentage of CD4+CD25+ lymphocytes(17.5%) peaking at 48 h (p = 0.0163) (Fig. 5C and D).ls. The percentage of CD4+ lymphocytes that express FOXP3 (n = 18) wasrses and ponies of different ages. Bars represent mean value of results. a
3.6. CD4+CD25dim and CD4+CD25high cells express FOXP3
Next we determined whether CD4+CD25+ cells in Fig. 5also expressed FOXP3. CD4+ selected cells were stimu-lated for 48 h with PWM, and sorted into CD4+CD25−,CD4+CD25dim and CD4+CD25high cells (n = 3) (Fig. 6A). Wethen assessed the percentage of FOXP3+ cells in the threesubpopulations immediately following sorting (Fig. 6B, toptwo panels) or following resting for an additional 48 h inmedia supplemented with equine IL-2 (Fig. 6B, lower twopanels). CD4+CD25− cells expressed low levels of FOXP3(1.4–1.6%). In contrast, 22.7–26.3% of CD4+CD25high and16.7–17.8% of CD25dim cells expressed FOXP3 (Fig. 6B,top two panels). The percentage of FOXP3+ cells withinthe CD25dim and CD25high populations decreased afterresting in media supplemented with equine IL-2 for48 h (Fig. 6B, bottom two panels). Furthermore, the per-centage of FOXP3+ cells was similar in CD4+CD25dim
(10.9–14.1%) and CD4+CD25high (9.2–14.1%) cells after rest-ing in IL-2. The percentage of CD4+CD25− cells that expressFOXP3+ after resting in IL-2 varied between horses. Inone horse, there was a small increase in the percentage
of FOXP3+ cells (4.5%) when compared with immedi-ately following cell sorting. In two horses, there waslittle change in the percentage of FOXP3+ cells (1.7%) fol-lowing cell sorting and additionally following resting inIL-2.
96 M.G. Robbin et al. / Veterinary Immunology and Immunopathology 140 (2011) 90–101
Fig. 4. FOXP3 expression is induced upon stimulation with PWM. Flow cytometric analysis of PBMC cultured with (S = stimulated) or without 2.5 �g/mlP t plotsc ltured w4 3 (middt sults. a,
3a
ClaI(wviosehmMoa
4
ittmIcm
WM (NS = non-stimulated) (n = 4 horses). Images show representative doells in each quadrant. (A) Images of representative dot plots of PBMC cu8 h following labeling with CD4 and isotype control (left panel), or FOXPhat express FOXP3 at 0, 24, 48 and 72 h. Bars represent mean value of re
.7. Activated equine FOXP3+ lymphocytes express IL-10nd IFN�
To determine the cytokine profile of PWM activatedD4+FOXP3+ lymphocytes, we performed double intracel-
ular labeling of positively selected CD4+ lymphocytes withntibodies against FOXP3 combined with either IL-10 orFN�. Prior to analysis, CD4+ cells, and CD4− lymphocytesas a control), were activated with PWM for 48 h combinedith PMA/IO/BrefeldinA for the final 4 h of culture. As pre-
iously shown, FOXP3 expression was primarily detectedn CD4 positively selected lymphocytes, with less than 1.7%f CD4 negative lymphocytes expressing FOXP3 (data nothown). Within the CD4+FOXP3+ lymphocytes, 35% alsoxpressed IFN� and 9% also expressed IL-10 (Fig. 7) (n = 4orses). CD4 negative lymphocytes expressed IFN� butinimal IL-10, consistent with our previous studies (deestre et al., 2010). We also observed the same patterns
f FOXP3, IFN� and IL-10 expression in non-selected PBMCctivated for 48 h with PWM (data not shown).
. Discussion
Knowledge of regulatory T cells subsets in the horses limited. Identification of phenotypic markers specifico Tregs is constantly evolving, but the transcription fac-
or, FOXP3, remains the most reliable and well-describedarker of one of the main subtypes: non-activated nTregs.n early 2010, we defined a population of CD4+FOXP3+ells in the peripheral blood and endometrium of pregnantares using an antibody directed against human FOXP3
following gating of lymphocytes with numbers indicating percentages ofithout (left and middle panel) or with (right panel) 2.5 �g/ml PWM forle and right panels). (B) Percentage of CD4+ and (C) CD4− lymphocytes
b and c indicates p-values of <0.05, <0.01 and <0.001 respectively.
(de Mestre et al., 2010). Recently, descriptions of singlelabeled equine FOXP3+ cells in equine lymph nodes iden-tified using immunohistochemistry have been described(Banham et al., 2009; Steinbach et al., 2009). In the cur-rent study, we cloned and sequenced full length FOXP3and CD25 mRNA and confirmed the cross reactivity of anti-human FOXP3 and CD25 antibodies and for the detectionof equine FOXP3 and CD25. Using the markers, FOXP3, CD4,CD8, CD25, IFN� and IL-10, we identified a number of sub-populations of equine FOXP3+ cells that each displayeddistinct phenotypes.
FOXP3 expression by equine lymphocytes was foundto reside largely within the CD4+ population, consistentwith findings other mammalian species (Biller et al., 2007;Fontenot et al., 2005; Kaser et al., 2008; Kmieciak et al.,2009; Lankford et al., 2008; Mizuno et al., 2009). Wedemonstrated that a mean of 2.2% of CD4+ lymphocytes inthe peripheral blood expressed FOXP3, a frequency similarto observations in cats (Lankford et al., 2008) but lower thanthat reported for dogs (4.3% of CD4+ lymphocytes) (Billeret al., 2007). Due to the lower affinity of the anti-humanCD25 antibody used for these studies, we were not able todetect CD4+CD25+ cells in the peripheral blood of horsesor ponies studied. We propose that CD4+FOXP3+ lympho-cytes in equine peripheral blood described in this studyrepresent natural Tregs (nTregs).
Although there was no difference in the mean per-centage of CD4+FOXP3+ cells across genders and poniesand horses, we did observe a decrease in the percent-age of CD4+FOXP3+ cells correlating with an increase inage. Our findings in the horse differ to previous studies

M.G. Robbin et al. / Veterinary Immunology and Immunopathology 140 (2011) 90–101 97
Fig. 5. Equine CD25 expression is induced on CD4+ lymphocytes following stimulation with PWM. (A) CHO cells were transfected with equine CD25/IgG1cells sin
esentatianti-CD425 at 0,
expression vector. Representative flow cytometric plots show transfectedor cells double labeled with both antibodies (right panel). Images of reprwith (S = stimulated) (C) 2.5 �g/ml PWM for 48 h following labeling withCD25 (right panels). (D) Percentage of CD4+ lymphocytes that express CDc indicates p-values of <0.01 and <0.001 respectively.
reported in mice where the percentage of cells expressingFOXP3 in the peripheral blood, spleen and lymph nodes
increases with age (Lages et al., 2008; Nishioka et al., 2006;Sharma et al., 2006; Zhao et al., 2007). Studies in humansare less conclusive, with one study reporting an increasein percentage of peripheral CD4+FOXP3+ lymphocytes inaged individuals (Lages et al., 2008), whilst another studygle labeled with anti-IgG1 (left panel), anti-human CD25 (middle panel),ve dot plots of PBMC cells cultured without (NS = non-stimulated) (B) orand isotype control antibodies (left panel), or anti-CD4 and anti-human
24, 48 and 72 h (n = 3 horses). Bars represent mean value of results. b and
found a comparable frequency of Tregs between the youngand elderly (Hwang et al., 2009). The functional relevance
of a decrease in equine CD4+FOXP3+ cells requires fur-ther investigation. Based upon Treg function described inother species, one could speculate that a decrease in per-centage of equine nTregs with aging may contribute toelevated pro-inflammatory cytokines and inflammageing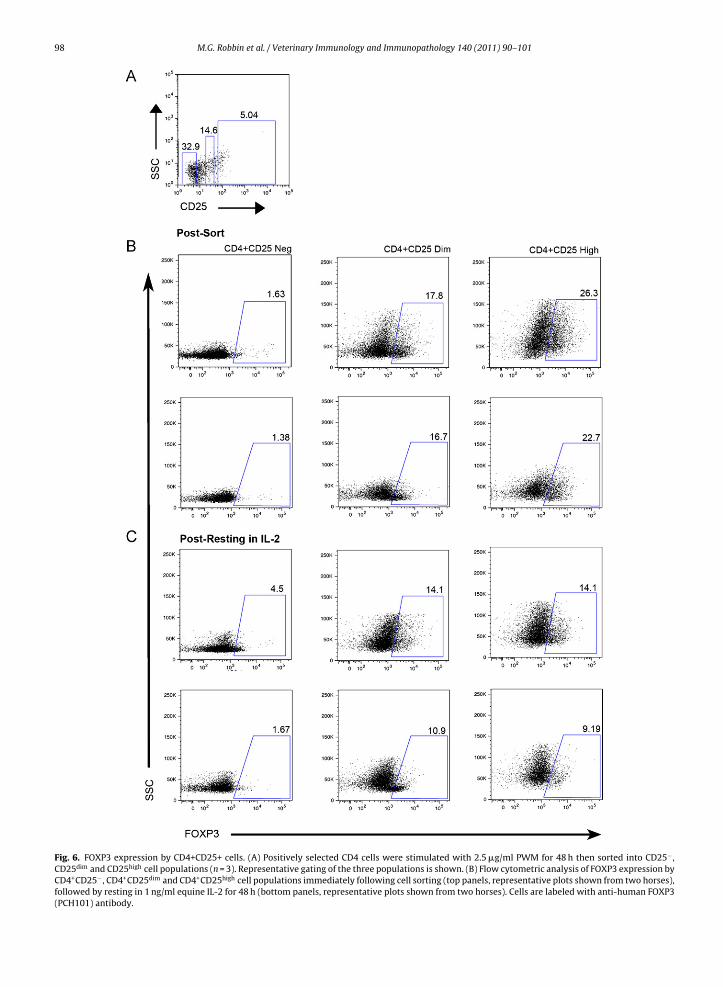
98 M.G. Robbin et al. / Veterinary Immunology and Immunopathology 140 (2011) 90–101
Fig. 6. FOXP3 expression by CD4+CD25+ cells. (A) Positively selected CD4 cells were stimulated with 2.5 �g/ml PWM for 48 h then sorted into CD25− ,CD25dim and CD25high cell populations (n = 3). Representative gating of the three populations is shown. (B) Flow cytometric analysis of FOXP3 expression byCD4+CD25− , CD4+CD25dim and CD4+CD25high cell populations immediately following cell sorting (top panels, representative plots shown from two horses),followed by resting in 1 ng/ml equine IL-2 for 48 h (bottom panels, representative plots shown from two horses). Cells are labeled with anti-human FOXP3(PCH101) antibody.

M.G. Robbin et al. / Veterinary Immunology and Immunopathology 140 (2011) 90–101 99
cytomecytome(left pa
Fig. 7. Cytokine production by activated CD4+FOXP3+ lymphocytes. FlowNumbers indicate percentages of cells in each plot. Representative flowwith antibodies against FOXP3 (PCH101) or an isotype control, and IL-101 �M IO and 10 �g/ml Brefeldin A for the final 4 h of culture.
in older horses (Horohov et al., 2010). Irrespective of thefunctional relevance, our findings indicate that the age ofthe horse should be carefully considered when designingfuture experiments that assess phenotypic and functionalcharacteristics of Tregs in equine inflammatory conditions.
Previously, FOXP3 expression by murine and humanlymphocytes was directly correlated with suppressivefunction (Fontenot et al., 2003; Hori et al., 2003; Khattriet al., 2003; Walker et al., 2003). Whilst this continues tobe the case for murine cells, more recent work indicatesactivated human CD4+CD25− and CD8+ cells can tran-siently upregulate FOXP3 in vitro, a state that is not alwaysassociated with suppressive function or inhibition of pro-inflammatory cytokine expression (Allan et al., 2007; Gavinet al., 2006). We observed a rapid increase in the percent-age of CD4+ lymphocytes that express FOXP3 followingin vitro activation, suggesting equine FOXP3 expressionis regulated in a similar manner to the human protein.Approximately 35% of the activated equine CD4+FOXP3+cells also expressed IFN�, indicating the induction of FOXP3did not necessarily suppress IFN� synthesis. Whilst thereis growing evidence that IFN� can be expressed and playsan important role in the development of regulatory Tcells in the periphery (Chen and Liu, 2009; Wang et al.,2006; Wood and Sawitzki, 2006), there is scant evidenceto support a regulatory function for CD4+FOXP3+IFN�+cells (Knoechel et al., 2005). We propose the majority ofequine FOXP3+IFN�+ cells are likely to represent activatedcells transiently expressing FOXP3, as opposed to function-ally suppressive cells. We also noted approximately 10% ofthe activated CD4+FOXP3+ cells expressed the immuno-suppressive cytokine IL-10. IL-10 is secreted by murineand human Tregs and is one of the mechanisms by which
nTregs mediate local immunosuppression (Joetham et al.,2007). CD4+FOXP3+IL-10+ cells are likely to representeither activated nTregs or FOXP3+iTregs (Horwitz et al.,2008), phenotypically denoting a subpopulation of cellsdistinct from CD4+IL-10+IFN�+ equine Tr1 cells (Wagnertric analysis of IFN� and IL-10 production by FOXP3+ lymphocytes (n = 4).tric plots of CD4+ cells activated with PWM for 48 h and double labelednel) or IFN� (right panel). Cells were re-stimulated with 25 ng/ml PMA,
et al., 2008). We surmise, FOXP3 alone may not be the mostspecific marker for activated equine Tregs. Future func-tional studies will be instrumental in further defining thesesubpopulations of T lymphocytes.
In order to assess the functional properties of theFOXP3+ lymphocytes, we also sought to identify a suitableantibody to detect equine CD25, a well-established markerused to distinguish and isolate Tregs in other species (Lanet al., 2005). CD25 is expressed on Tregs but is also tran-siently expressed on activated cells (Brusko et al., 2009).An anti-human CD25 antibody was recently described todetect a 55 kDa protein band in equine PBMC suggesting itcross-reacts with equine CD25 (Steinbach et al., 2009). Incontrast to the study that first described the use of this anti-body to label equine PBMC (Steinbach et al., 2009), we werenot able to detect CD25 on the surface of non-stimulatedPBMC. In stimulated equine PBMC, however, we could eas-ily detect CD25. The percentage of activated PBMC thatlabeled with the antibody were lower than that reportedpreviously (Steinbach et al., 2009). We also observed higherthan expected non-specific staining by the matched poly-clonal goat IgG isotype control within the CD4− populationof cells, so further studies were performed to confirmthe specificity and affinity of the anti-human CD25 anti-body for equine CD25 using CHO cells co-expressing aequine CD25/IgG1 fusion protein. Although we confirmedthe antibody did detect CD25 expressing cells, the stainingpatterns suggested that it bound with low affinity. This mayexplain our inability to detect CD25+ cells when PBMC wereassessed immediately following isolation from peripheralblood. We concluded that this antibody was not suitable tolabel CD25 in non-stimulated lymphocytes and thus char-acterize non-activated nTregs. We are currently producing
an equine anti-CD25 antibody to better define this popula-tion of lymphocytes in the horse.However, our investigations demonstrated that theanti-human CD25 antibody could have an applicationfor sorting and analysis of different subpopulations of

1 ogy and
asciasl2a2vci
(rnobncCpFpc
rCvastCclqtab
A
SFlmAD
R
A
A
A
B
00 M.G. Robbin et al. / Veterinary Immunol
ctivated CD4 cells. We found FOXP3 expression wasignificantly enriched within both the CD4+CD25dim/high
ells compared with CD4+CD25− cells. It would benteresting to determine whether these CD4+CD25dim
nd/or CD4+CD25high lymphocytes also possess enricheduppressive activity when compared with CD4+CD25−
ymphocytes, as demonstrated in the dog (Pinheiro et al.,011). Human iTregs are generated from CD4+CD25− cellsctivated in the presence of TGF� and IL-2 (Walker et al.,003). Thus sorted equine CD4+CD25− cells that expressery low levels of FOXP3 expression may also have an appli-ation in the generation and characterization of equineTregs.
We also detected a small population of FOXP3+ cells0.5%) within the CD8+ lymphocyte subpopulation thatepresented less that 15% of FOXP3+ cells. Due to the smallumber of CD8+FOXP3+ cells, no further characterizationf this population was performed. CD8+FOXP3+ cells haveeen described in other species (Lankford et al., 2008). Phe-otypic analysis of murine CD8+Foxp3+ cells indicate theseells also express other Treg-associated markers such asD25, CTLA-4 and GITR, suggesting these CD8+Foxp3+ lym-hocytes may also be suppressive (Fontenot et al., 2005).urther research is therefore merited in order to assess thehenotype and function of equine CD8+FOXP3+ lympho-ytes.
To conclude, this study describes the expression andegulation of equine FOXP3 expression by CD4+ andD8+ lymphocytes ex vivo and following in vitro acti-ation. Several subpopulations of equine FOXP3+ cellsre defined, including CD4+FOXP3+ cells likely to repre-ent nTregs, CD8+FOXP3+ cells, CD4+FOXP3+IL-10+ cellshat may represent activated nTregs or FOXP3+iTregs andD4+FOXP3+IFN�+ cells likely to represent activated Th1ells. This work highlights the heterogeneity of FOXP3+ymphocytes in the horse and the variations in the fre-uency of Tregs in horses of different ages. Furthermore,his work underpins future studies that assess the function-lity of these different subpopulations of regulatory cells inoth healthy horses and in equine inflammatory diseases.
cknowledgements
This work was funded by Royal College of Veterinaryurgeons Trust, University of London Central Researchund and a BBSRC PhD studentship (MG Robbin). We wouldike to thank Prof. Fiona Cunningham for providing ani-
al resources, and Dr. Andrew Brooks, Emily Silvela andbbe Martyn for assistance with animal work. We thankon Miller and Shanta Cariese for technical support.
eferences
llan, S.E., Crome, S.Q., Crellin, N.K., Passerini, L., Steiner, T.S., Bacchetta,R., Roncarolo, M.G., Levings, M.K., 2007. Activation-induced FOXP3 inhuman T effector cells does not suppress proliferation or cytokineproduction. Int. Immunol. 19, 345–354.
luvihare, V.R., Kallikourdis, M., Betz, A.G., 2004. Regulatory T cells medi-ate maternal tolerance to the fetus. Nat. Immunol. 5, 266–271.
skenasy, N., Kaminitz, A., Yarkoni, S., 2008. Mechanisms of T regulatorycell function. Autoimmun. Rev. 7, 370–375.
anham, A.H., Lyne, L., Scase, T.J., Blacklaws, B.A., 2009. Monoclonal anti-bodies raised to the human FOXP3 protein can be used effectively for
Immunopathology 140 (2011) 90–101
detecting Foxp3(+) T cells in other mammalian species. Vet. Immunol.Immunopathol. 127, 376–381.
Biller, B.J., Elmslie, R.E., Burnett, R.C., Avery, A.C., Dow, S.W., 2007. Use ofFoxP3 expression to identify regulatory T cells in healthy dogs anddogs with cancer. Vet. Immunol. Immunopathol. 116, 69–78.
Brusko, T.M., Wasserfall, C.H., Hulme, M.A., Cabrera, R., Schatz, D.,Atkinson, M.A., 2009. Influence of membrane CD25 stability on Tlymphocyte activity: implications for immunoregulation. PLoS One4, e7980.
Chen, J., Liu, X., 2009. The role of interferon gamma in regulation of CD4+T-cells and its clinical implications. Cell. Immunol. 254, 85–90.
Curotto de Lafaille, M.A., Lafaille, J.J., 2009. Natural and adaptive foxp3+regulatory T cells: more of the same or a division of labor? Immunity30, 626–635.
de Almeida, D.E., Colvin, C.J., Coussens, P.M., 2008. Antigen-specific regula-tory T cells in bovine paratuberculosis. Vet. Immunol. Immunopathol.125, 234–245.
de Mestre, A.M., Miller, D., Roberson, M.S., Liford, J., Chizmar, L.C.,McLaughlin, K.E., Antczak, D.F., 2009. Glial cells missing homologue 1is induced in differentiating equine chorionic girdle trophoblast cells.Biol. Reprod. 80, 227–234.
de Mestre, A.M., Noronha, L.E., Wagner, B., Antczak, D.F., 2010. Splitimmunological tolerance to trophoblast. Int. J. Dev. Biol. 54, 445–455.
de Mestre, A.M., Staykova, M.A., Hornby, J.R., Willenborg, D.O., Hulett,M.D., 2007. Expression of the heparan sulfate-degrading enzymeheparanase is induced in infiltrating CD4+ T cells in experimentalautoimmune encephalomyelitis and regulated at the level of tran-scription by early growth response gene 1. J. Leukocyte Biol. 82,1289–1300.
Driscoll, N., Baia, P., Fischer, A.T., Brauer, T., Klohnen, A., 2008. Large colonresection and anastomosis in horses: 52 cases (1996–2006). EquineVet. J. 40, 342–347.
Fontenot, J.D., Gavin, M.A., Rudensky, A.Y., 2003. Foxp3 programs thedevelopment and function of CD4+CD25+ regulatory T cells. Nat.Immunol. 4, 330–336.
Fontenot, J.D., Rasmussen, J.P., Williams, L.M., Dooley, J.L., Farr, A.G.,Rudensky, A.Y., 2005. Regulatory T cell lineage specification by theforkhead transcription factor foxp3. Immunity 22, 329–341.
Gavin, M.A., Torgerson, T.R., Houston, E., DeRoos, P., Ho, W.Y., Stray-Pedersen, A., Ocheltree, E.L., Greenberg, P.D., Ochs, H.D., Rudensky,A.Y., 2006. Single-cell analysis of normal and FOXP3-mutant human Tcells: FOXP3 expression without regulatory T cell development. Proc.Natl. Acad. Sci. U.S.A. 103, 6659–6664.
Hori, S., Nomura, T., Sakaguchi, S., 2003. Control of regulatory T celldevelopment by the transcription factor Foxp3. Science 299, 1057–1061.
Horohov, D.W., Adams, A.A., Chambers, T.M., 2010. Immunosenescence ofthe equine immune system. J. Comp. Pathol. 142 (Suppl. 1), S78–84.
Horwitz, D.A., Zheng, S.G., Gray, J.D., 2008. Natural and TGF-beta-inducedFoxp3(+)CD4(+) CD25(+) regulatory T cells are not mirror images ofeach other. Trends Immunol. 29, 429–435.
Hulett, M.D., Hornby, J.R., Ohms, S.J., Zuegg, J., Freeman, C., Gready,J.E., Parish, C.R., 2000. Identification of active-site residues ofthe pro-metastatic endoglycosidase heparanase. Biochemistry 39,15659–15667.
Hwang, K.A., Kim, H.R., Kang, I., 2009. Aging and human CD4(+) regulatoryT cells. Mech. Ageing Dev. 130, 509–517.
Joetham, A., Takeda, K., Taube, C., Miyahara, N., Matsubara, S., Koya, T.,Rha, Y.H., Dakhama, A., Gelfand, E.W., 2007. Naturally occurring lungCD4(+)CD25(+) T cell regulation of airway allergic responses dependson IL-10 induction of TGF-beta. J. Immunol. 178, 1433–1442.
Kaser, T., Gerner, W., Hammer, S.E., Patzl, M., Saalmuller, A., 2008. Detec-tion of Foxp3 protein expression in porcine T lymphocytes. Vet.Immunol. Immunopathol. 125, 92–101.
Keppel, K.E., Campbell, K.L., Zuckermann, F.A., Greeley, E.A., Schaeffer, D.J.,Husmann, R.J., 2008. Quantitation of canine regulatory T cell popula-tions, serum interleukin-10 and allergen-specific IgE concentrationsin healthy control dogs and canine atopic dermatitis patients receiv-ing allergen-specific immunotherapy. Vet. Immunol. Immunopathol.123, 337–344.
Khattri, R., Cox, T., Yasayko, S.A., Ramsdell, F., 2003. An essential rolefor scurfin in CD4+CD25+ T regulatory cells. Nat. Immunol. 4, 337–342.
Kmieciak, M., Gowda, M., Graham, L., Godder, K., Bear, H.D., Marincola,F.M., Manjili, M.H., 2009. Human T cells express CD25 and FoxP3 uponactivation and exhibit effector/memory phenotypes without any reg-ulatory/suppressor function. J. Transl. Med. 7, 89.
Knoechel, B., Lohr, J., Kahn, E., Bluestone, J.A., Abbas, A.K., 2005. Sequen-tial development of interleukin 2-dependent effector and regulatory

logy and
M.G. Robbin et al. / Veterinary ImmunoT cells in response to endogenous systemic antigen. J. Exp. Med. 202,1375–1386.
Lages, C.S., Suffia, I., Velilla, P.A., Huang, B., Warshaw, G., Hildeman, D.A.,Belkaid, Y., Chougnet, C., 2008. Functional regulatory T cells accumu-late in aged hosts and promote chronic infectious disease reactivation.J. Immunol. 181, 1835–1848.
Lan, R.Y., Ansari, A.A., Lian, Z.X., Gershwin, M.E., 2005. Regulatory T cells:development, function and role in autoimmunity. Autoimmun. Rev. 4,351–363.
Lankford, S., Petty, C., LaVoy, A., Reckling, S., Tompkins, W., Dean,G.A., 2008. Cloning of feline FOXP3 and detection of expression inCD4+CD25+regulatory T cells. Vet. Immunol. Immunopathol. 122,159–166.
Miyara, M., Sakaguchi, S., 2007. Natural regulatory T cells: mechanisms ofsuppression. Trends Mol. Med. 13, 108–116.
Mizuno, T., Suzuki, R., Umeki, S., Okuda, M., 2009. Crossreactivity ofantibodies to canine CD25 and Foxp3 and identification of canineCD4+CD25+Foxp3+ cells in canine peripheral blood. J. Vet. Med. Sci.71, 1561–1568.
Nishioka, T., Shimizu, J., Iida, R., Yamazaki, S., Sakaguchi, S., 2006.CD4+CD25+Foxp3+ T cells and CD4+CD25−Foxp3+ T cells in agedmice. J. Immunol. 176, 6586–6593.
Ozdemir, C., Akdis, M., Akdis, C.A., 2009. T regulatory cells and theircounterparts: masters of immune regulation. Clin. Exp. Allergy 39,626–639.
Pinheiro, D., Singh, Y., Grant, C.R., Appleton, R.C., Sacchini, F., Walker,K.R., Chadbourne, A.H., Palmer, C.A., Armitage-Chan, E., Thompson,I., Williamson, L., Cunningham, F., Garden, O.A., 2011. Phenotypic andfunctional characterization of a CD4(+) CD25(high) FOXP3(high) reg-ulatory T-cell population in the dog. Immunology. 132, 111–122.
Roncarolo, M.G., Gregori, S., Battaglia, M., Bacchetta, R., Fleischhauer, K.,Levings, M.K., 2006. Interleukin-10-secreting type 1 regulatory T cellsin rodents and humans. Immunol. Rev. 212, 28–50.
Sakaguchi, S., Wing, K., Onishi, Y., Prieto-Martin, P., Yamaguchi, T., 2009.Regulatory T cells: how do they suppress immune responses? Int.
Immunol. 21, 1105–1111.Sansom, D.M., Walker, L.S., 2006. The role of CD28 and cytotoxic T-lymphocyte antigen-4 (CTLA-4) in regulatory T-cell biology. Immunol.Rev. 212, 131–148.
Saurer, L., Mueller, C., 2009. T cell-mediated immunoregulation in thegastrointestinal tract. Allergy 64, 505–519.
Immunopathology 140 (2011) 90–101 101
Sharma, S., Dominguez, A.L., Lustgarten, J., 2006. High accumulation of Tregulatory cells prevents the activation of immune responses in agedanimals. J. Immunol. 177, 8348–8355.
Shevach, E.M., 2009. Mechanisms of foxp3+ T regulatory cell-mediatedsuppression. Immunity 30, 636–645.
Steinbach, F., Bischoff, S., Freund, H., Metzner-Flemisch, S., Ibrahim, S.,Walter, J., Wilke, I., Mauel, S., 2009. Clinical application of dendriticcells and interleukin-2 and tools to study activated T cells in horses– first results and implications for quality control. Vet. Immunol.Immunopathol. 128, 16–23.
Takahashi, T., Kuniyasu, Y., Toda, M., Sakaguchi, N., Itoh, M., Iwata,M., Shimizu, J., Sakaguchi, S., 1998. Immunologic self-tolerancemaintained by CD25+CD4+ naturally anergic and suppressive Tcells: induction of autoimmune disease by breaking their aner-gic/suppressive state. Int. Immunol. 10, 1969–1980.
Vahlenkamp, T.W., Tompkins, M.B., Tompkins, W.A., 2004. Feline immun-odeficiency virus infection phenotypically and functionally activatesimmunosuppressive CD4+CD25+ T regulatory cells. J. Immunol. 172,4752–4761.
Wagner, B., Hillegas, J.M., Brinker, D.R., Horohov, D.W., Antczak, D.F., 2008.Characterization of monoclonal antibodies to equine interleukin-10 and detection of T regulatory 1 cells in horses. Vet. Immunol.Immunopathol. 122, 57–64.
Wagner, B., Robeson, J., McCracken, M., Wattrang, E., Antczak, D.F., 2005.Horse cytokine/IgG fusion proteins – mammalian expression of bio-logically active cytokines and a system to verify antibody specificityto equine cytokines. Vet. Immunol. Immunopathol. 105, 1–14.
Walker, M.R., Kasprowicz, D.J., Gersuk, V.H., Benard, A., Van Landeghen, M.,Buckner, J.H., Ziegler, S.F., 2003. Induction of FoxP3 and acquisition ofT regulatory activity by stimulated human CD4+CD25− T cells. J. Clin.Invest. 112, 1437–1443.
Wang, Z., Hong, J., Sun, W., Xu, G., Li, N., Chen, X., Liu, A., Xu, L., Sun,B., Zhang, J.Z., 2006. Role of IFN-gamma in induction of Foxp3 andconversion of CD4+CD25− T cells to CD4+ Tregs. J. Clin. Invest. 116,2434–2441.
Wood, K.J., Sawitzki, B., 2006. Interferon gamma: a crucial role in thefunction of induced regulatory T cells in vivo. Trends Immunol. 27,183–187.
Zhao, L., Sun, L., Wang, H., Ma, H., Liu, G., Zhao, Y., 2007. Changes ofCD4+CD25+Foxp3+ regulatory T cells in aged Balb/c mice. J. LeukocyteBiol. 81, 1386–1394.