very-low-frequency radiation spectra of lightning … · evident that the lightning discharge was...
TRANSCRIPT

Journal of Research of the National Bureau of Sta ndards-D. Radio Propaga tion Vol. 63D, No.2, September- October 1959
Very-Low-Frequency Radiation Spectra of Lightning Discharges
w. L. Taylor and A. G. Jean (A pril 9, 1959)
Spectral a nalyses are given of t he groundwa ve por t ion of 33 sferi c waveform s recorded from cloud-t o-ground ligh t ning discharges which occu rred at distances ra nging between about 150 and 600 kilom eters from Boulder, Colo. Freq uencies of peak energy lie betwee n 5 and 20 kilocycles p er second , which ag ree fa vorably wi t h other pub lished results. The average value of e nergy calculated from the groundwave pulses was found to be 26,600 joules, whi ch is lower than va lu es derived from ot he r experim ents. Va rious pa ra m eters, such as the peak a mpli tud e and du ratio n of t he first ha lf-cy cle, a re related to the radiated energy of the stroke.
1. Introduction
Appleton et al. (1 926) were probably the first workers to u tilize the ca thode-ray oscilloscope in studying the electromagnetic energy emi tted from lightning discharges . Following the developmen t of radio communication techniques, it became eviden t that the lightning discharge was the source of in terference to radio communication circuits .
In recen t ~Tears, the radio signals emi tted from ligh tning disc ha rges, called atmospherics, or sferics, have been utilized as a source of signals in propagation studies at very-low radiofrequ encies .
Various workers in England h ave been pa rt icularly active in the u t ili za t ion of sferics in propagation studies, and it would be difFi ('.ul t and exhaust ive to properly credi t all of tht lr accomplishmen ts . However, as the work con t inued, i t was learn ed tha t some atmospheric waveforms could be in terpreted in te rms of the recep tion of a seri es of pulse due to success ive refl ections between the ea r th and th.e ionosphere. I t became eviden t that the charaeter of the atmospheric waveform observed at great distances was materially altered by the propaga tion effec ts, while at shorter ranges, the waveform was more represen ta tive of the source fun ction.
At the present time the use of atmospherics in propagation studies at the very-low radiofrequencies is common. NBS Boulder Laboratories havc established a network: of stations [1]1 for this purpose, and the material presented in this paper resulted from t he simultaneous observ ation of atmospherics at the Bureau recording sites .
The obj ective of this paper is to presen t data on Fourier spectra of the electric field strength of signals radiated from return -stroke lightning di scharges. The radi ation spectra of lightning discharges were determin ed from observations of the groundwave portion of the atmospheric. The precautions taken in identifying and ut ilizing groundwave pulses for this purpose arc described in this paper.
1 Figures in braCkets indicate the literature references at the end o[ this paper.
2. Equipment and Collection of Data
Sta tions at Boulder , Colo .; Sal t La ke City, U tah ; and P alo Al to, Calif. ; were eq uippecl to record the direct ions of arrival of atmospheric pulses, the pulse waveforms, and timing m arks from which the t imes of arrival of individual pulses could be determined. Atmospheric waveforms used in the spectral analyses were recorded from ver tical antenn as. The overall amplitude response of the ver tical an tenna channel was constan t within ± 1 db over the band pass and slop ed to 3-db cutoff points at frequencies of 1 and 100 kc. The phase response of this channel closely approximated a linear function of frequ ency wi thin t he bandpass.
A pair of ver tical elect rostatically shiclded loop an tennas, arranged at righ t angles to each other, were used in a direction-finding system a t each station. The overall bandpass of each loop-an tenna channel extended from 1 to 100 kc, and closely approximated t hat of the ve rtical-an tenna chann el. Th e direction-Ending indications were ob tained using the en tire bandwidth of the loop-an tenna channels. It was determined in earlier experimen ts [2] with wideb and direc tion finders, that in many cases the groundwave componen t of the a tmospheric could be discern ed from the Sky wclve components by vir tue of differences in polarization and tim es of arrival of the groundwave and skywave pulses.2 A time resolution of approximately 10 Msec is afforded by the wideband direction-finder , which is adequate to resolve the groundwave and skywave pulses. The direction of arrival of the atmospheric, as indicated by the ver t ically polan zed groundwave componen t, should be virtually f ree from error due to the presence of horizon tally polarized componen ts in the atmospheric.
Timing marks derived f rom a secondary frequency standard, synchronized with the standard timing emissions from station WvVV, were recorded on the atmosp heric waveform records. Using these timing
2 E xcellent discussions regarding the locati on of sforic sources throu gh tho usc o[ radio direetion.flllding have appeared in the literature: I lorner [31. in particular, has discussed the probable sources of error in dircction.(jnding, including that resu lting from the reception of hori ~ontall y polarized components of ionospheriC waves.
199
----'
marks, the timc of arrival of atmospherics could be determined at each station to an accuracy of about ± 1 msec. Atmospheric waveforms resulting from a particular lightning discharge were locat.ed on the photographic records made at each station by virtue of their times of reception and directions of arrival.
The sweep of the oscilloscopes used in recording the atmospherics was activated by signals having amplitudes of about 50 mv/m or greater. Signals of smaller amplitude did not activate the sweep and therefore were not recorded. This feature provided some discrimination against atmospherics of relatively low amplitude; such as those of distant origin as well as some local cloud-to-cloud and precursory discharges. To minimize loss of early detail in the waveform, a 24··l"sec delay line was used to delay recording the signal un til after the sweep was initiated. The dynamic range of the recording equipment, in terms of the strength of a vertically polarized wave incident at the monopole antenna, extended from 0.2 to 6 vim. Most of the analyzed atmospherics had peak field amplitudes approaching 1 v im.
The locations of lightning discharges were determined by triangulation, using the direction of arrival indicated at each station. Due to the geometric arrangement of the 3-station network, the locations of lightning discharges which occurred near a recording station are relatively inaccurate; however, for distances greater than about 150 km, the error is estimated to be equal or less than 10 percent of the range.
It was desired to identify waveforms on the photographic records that resulted from vertical lightning discharges. Two tests that were used in an attempt to achieve this selection are described below. The relative amplitude of the vertical component of the electric field which would be registered at the appropriate ranges from a vertical discharge was calculated using range information available from the directionfinding "fixes," and from groundwave propagation curves in the literature [15]. The source was considered to be vertically polarized if the relative values of the observed and calculated pulse amplitudes agreed within about 20 percent.
If a vertically polarized wave arrives at grazing incidence, the direction-finder response will approximate a straight line inclined at an angle proportional to the azimuthal direction of arrival of the wave. An incident wave consisting of both horizontal and vertical components of the electric field will cause an elliptical direction-finding pattern to be produced. The direction-finder responses to the atmospheric pulses which were selected for analyses indicated that the groundwave pulses were vertically polarized, and the first-hop skywave pulses were essentially, but not entirely, vertically polarized. Atmospheric waveforms which satisfied both the "amplitude" and "ellip ticity" criteria outlined above were assumed to result from vertical lightning discharges.
No sferics were analyzed which originated at distances less than 150 kill from Boulder, due, in part, to limitations in the accuracy of "fixes" at short ranges, and also to minimize contributions by
the induction field at frequencies near 1 kc. It was desirable to limit the maximum observation range in order to minimize the distortion of the gro undwave pulse by propagation and to reduce the interference caused in the groundwave by the first-hop skywave pulse.
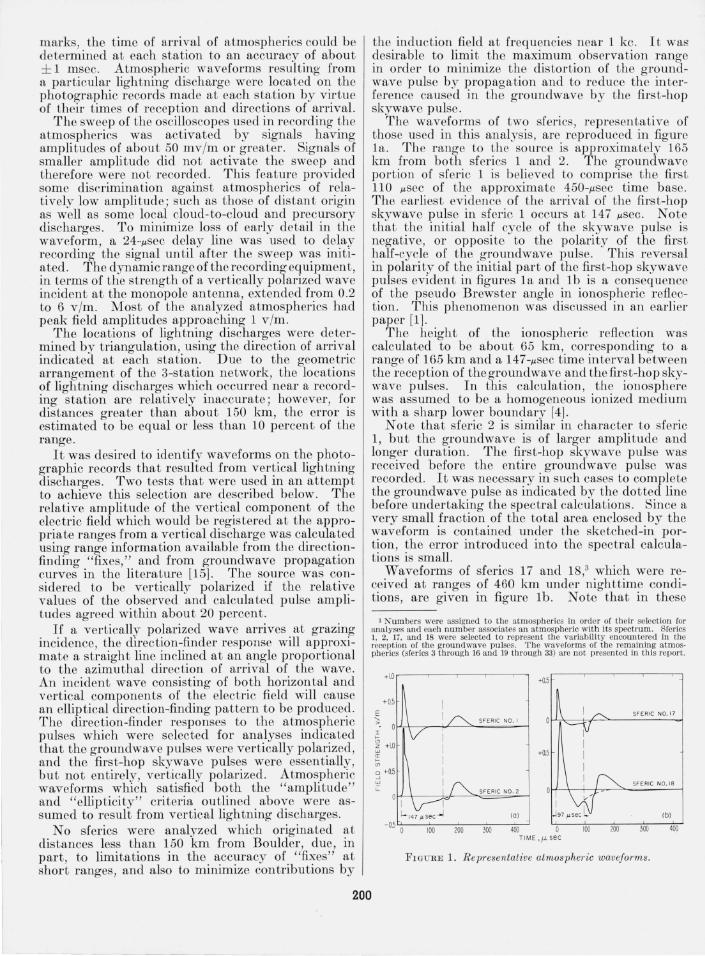
The waveforms of two sferics, representative of those used in this analysis , are reproduced in figure la. The range to the source is approximately 165 km from both sferics 1 and 2. The groundwave portion of sf eric 1 is believed to comprise the first 110 I"sec of the approximate 450-.usec time base. The earliest evidence of the arrival of the first-hop skywave pulse in sferic 1 occurs at 147 I"sec. Note that the initial half cycle of the skywave pulse is negative, or opposite to the polarity of the first half-cycle of the groundwave pulse. This reversal in polarity of the ini tial part of the first-hop skywave pulses evident in figures la and Ib is a consequence of the pseudo Brewster angle in ionospheric reflection. This phenomenon was discussed in an earlier paper [1].
The height of the ionospheric reflection was calculated to be about 65 km, corresponding to a range of 165 km and a 147-l"sec time interval between the reception of the groundwave and the first-hop skywave pulses. In this calculation, the ionosphere was assumed to be a homogeneous ionized medium with a sharp lower boundary [4].
Note that sferic 2 is similar in character to sferic 1, but the groundwave is of larger amplitude and longer duration. The first-hop skywave pulse was received before the entire groundwave pulse was recorded. It was necessary in such cases to complete the groundwave pulse as indicated by the dotted line before undertaking the spectral calcula tions. Since a very small fraction of the total area enclosed by the waveform is contained under the sketched-in portion, the error introduced into the spectral calculations is small.
Waveforms of sferics 17 and 18/ which were received at ranges of 460 km under nighttime conditions, are given in figure lb. Note that in these
3 Numbers were assigned to the atmospherics in order of their selection for analyses and each number associates an atmospheric with its spectrum. Sferics 1, 2, 17, and 18 were selected to represent the variability encountered in the reception of the gronndwave pulses. The waveforms of the remaining atmos· pheries (sferies 3 through 16 and 19 through 33) are not presented in this report.
+I .O~-~-~-~-~ +0.5
SF ERl e NO.17 SFERle NO. I
SFERle NO. IS SF ERie NO. 2
(a ) (b )
100 200 3011 400 0 100 100 300 400 TI ME,fL sec
FIGU R E L Representative atmospheric wavefo rms.
200
{!a e Lhe Lime in terval between reception of the groundwave and Lhe first-hop skywave pulses is about 97 /l ec compared to an interval of 147 /lsec in figure 1a. As a conseq uence of the shorter time inLerval between the reception of the groundwave and first-hop skywave pulses, a larger portion of the groundwave pulses are concealed by the skywave pul es than for the sferics 1 and 2. Prior to performing the spectral analyses of the groundwave pulses for sferics 17 and 18, the trailing edges of the groundwave pulses were sketched in as indicated. A larger error r esulted in such cases; e.g., the area under the sketched-in portion in sferic 18 is approximately 13 percent of the total area enclosed by the waveform of the groundwave pulse; however, this error is not considered to be serious in the present analyses .
The ionospheric reflection height for these nigh ttime observations was calculated to be abo uL 80 km, using a range of 460 km and a time interval between reception of groundwave and first-hop skywave pulses of 97 /lsec.
3. Data Analyses
Let OCt) represen t the instantaneous value of the verLical component of the electric field in uni Ls of volts per mete r. Also le t the waveform start aL time £= 0, so that
0(£) = 0, for t ~ O ,
and the end of the pulse occurs aL t= T so Lhat
0 (£) = 0, for t ? T.
The complex spectrum of Lhe pu lse can be represenLed by the Fourier in Legral
F (J)= J~T e- i27r /l 0 (t )clt, (1)
where.f represenLs the freq ueney in cycles pel' second and £ is the time in seconds after the beginning of the pulse .
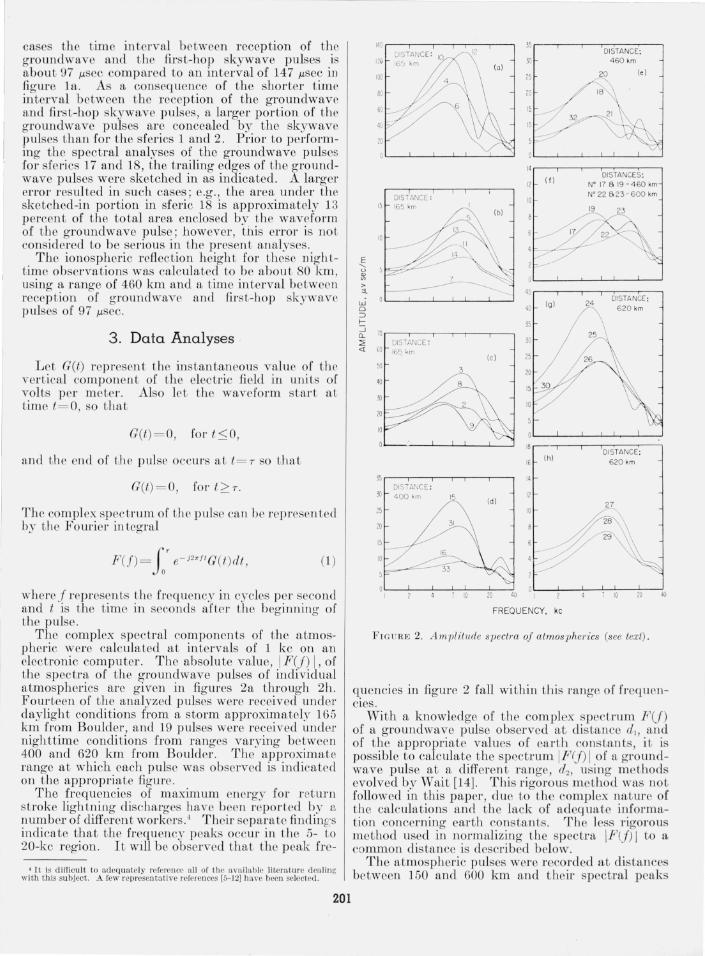
The complex spectral components of the atmospheric were calculated at intervals of 1 kc on an elec tronic compu tel'. The absolute value, I FU) I, of the spectra of the groundwave pulses of individual atmospherics are given in figures 2a through 2h. Fourteen of the analyzed pulses were received under daylight condi tions from a storm approximately 165 km from Boulder, and 19 pulses were received under nighttime conditions from ranges varying betwee n 400 and 620 km from Boulder . The approximate range at which each pulse was observed is indieatE'd on the appropria te figure.
The frequencies of maximum energy for I"E'turn stroke lightning discharges have been reported by a number of different workers 4 Their separate finding;s indicate that the frequency peaks occur in t he 5- to 20-kc region. It will be observed that the p eak fre-
• It is difficult to adequ ately rererenee all or the a va ilable litera ture dealiJlg with th is subject. A relV representat ive rererences l5-12] have been selected .
201
E " u ~
DISTANCE ;
35
;0
25
20
15
10
12 If)
10 -
DISTANCE: 460 km
20 Ie)
DISTANCES: W 17 8 19 - 4 60 km N' 22 823- 6 00 km
19 23
> :t ~5 .---r--.,.---,,--,--..,----,
DISTANCE : w o => ~
~ 70 ..----,--,---r-r---,---, ::;: DISTANCE : <l 60 16~ km
Ie )
35 ..---,--,---,--,--.,.----,
JII 400km
25
20
15
10
Id)
18
16 Ih)
I~
12
10
FREQUENCY. kc
24
DISTANCE : 620 km
27
7 10 20 41)
FIGURE 2. Amplitude spectl·a oj atmospherics (see text) .
q.uenci es in figure 2 fall within this range of frequenCleS .
With a knowledge of the complex spectrum FU) of a groundwave pulse observed at distance d1, and of the appropriate values of earth constants, it is possible to calculate the spectrum JF(j) I of a groundwave pulse at a differen t range, d2, usi ng methods evolved by Wait [14] . This rigorous method was not followed in t his paper , due to t he complex nature of the calculations and the lack of adeq uate information concerning earth co nstants. The less r igorous method used in normalizing the spectra jF'(j) I to a common distance is described below.
The atmospheric pulses were recorded at distances between 150 and 600 km and t heir spectral peaks
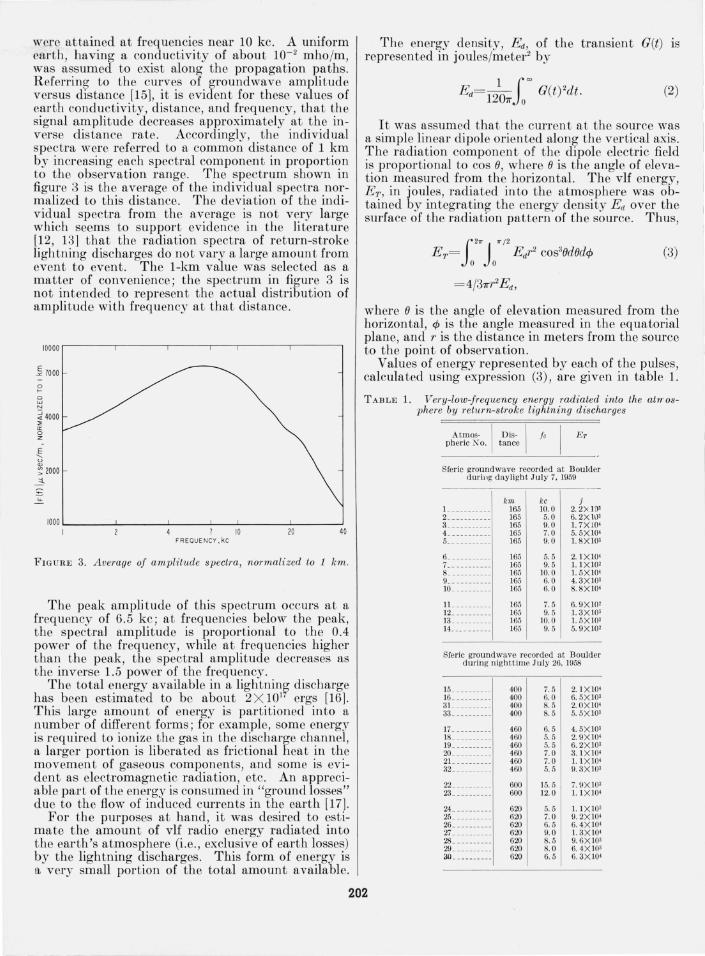
were a ttained at frequencies near 10 kc. A uniform earth , having a conductivity of about 10- 2 mho/m , was assumed to exist along the propagation paths. R eferring to the curves of groundwave amplitude versus distance [15], it is evident for these values of earth conductivity, distance, and frequency, that the signal amplitude decreases approximately at the inverse distan ce rate. Accordingly, the individual spectra were referred to a common distance of 1 km by increasing each spectral component in proportion to the observation range. The spectrum shown in figure 3 is the average of the individual spectra normalized to this distance. The deviation of the individual spectra from the average is not very large which seems to support evidence in the literature [12 , 13] that the radiation spectra of return-stroke lightning discharges do not vary a large amount from event to event. The l-km value was selected as a matter of convenience; the spectrum in figure 3 is not intended to represent the actual distribution of amplitude with frequency at that distance .
10000 ,----,-----------,,---,----,------,--------,
lj 1000
o t-
~ ~ 4000
" a: o z
~ ~ 1000
..3-
1000 L-___ L-__ ----l ___ L-_L-__ ----:L-__ -; I 1 10 10 40
FREQUENCY, kc
FIG U RE 3. Average of amplitude spectra, normalized to 1 km.
The peak amplitude of this spectrum occurs at a frequency of 6.5 kc; at frequencies below the peak, the spectral amplitude is proportional to the 0.4 power of the frequency, while at frequencies higher than the peak , the spectral amplitude decreases as the inverse 1.5 power of the frequ ency.
The total energy available in a lightning discharge has been estimated to be about 2X 10¹⁷ ergs [16]. This large amount of energy is partitioned into a number of different forms; for example, some energy is req uired to ionize the gas in the discharge channel, a larger portion is liberated as frictional heat ~n t~e movement of gaseous components, and some IS eVI
dent as electromagnetic radiation, etc. An appreciable part of the energy is consumed in "ground losses" due to the flow of induced currents in the earth [17].
For the purposes at hand, it was desired to estimate the amount of vlf radio energy radiated into the earth's atmosphere (i.e., exclusive of earth losse~) by the lightning discharges. This form of energy IS
a very small portion of the total amount available.
The energy density, Ed, of the transient G(t) IS
represented in joules/meter 2 by
(2)
It was assumed t hat the curren t at the source was a simple linear dipole oriented along the vertical axis. The radiation component of the dipole electric field is proportional to cos (J , where (J is the angle of elevation measured from the horizontal. The vlf energy, E T , in joules, radiated into the atmosphere was obtained by integrating the energy density Ed over the surface of the radiation pattern of the source. Thus,
( 211' 11' /2
E7'= Jo Jo Edr2 cos3(Jd(Jdc/> (3)
= 4/37rr2E d ,
wh ere (J is t he angle of elevation measured from the horizontal, c/> is the angle measured in the equatorial plane, and r is the distance in meters from the source to the point of observation.
Values of energy represented by each of the pulses, calculated using expression (3), are given in table 1.
T ABLE l. Very-low-frequency energy radiated into the al1rosphere by return-stroke lightning discharges
ET
Sferie groundwave recorded at B oulder durillg daylight July 7, 1959
km kc j L __________ 165 10.0 2.2)<.10' 2 ___________ 165 5.0 6.2XlO' 3 ___________ 165 9.0 l. 7XlO' L ___ _______ 165 7.0 5.5XlO' 5 ___________ 165 9.0 1.8X lO' 6 _____ __ ____ 165 5.5 2.1 X lO' 7 __ _________ 165 9.5 1.1 X 1O' 8 ___________ 165 10.0 1. 5X 1O' 9 ___________ 165 6.0 4.3 X lO' 10 _ _________ 165 6.0 8.8X lO'
lL _________ 165 7.5 6.9XlO' 12 __________ 165 9.5 1.3X IO; 13 __________ 165 10.0 1. 5X lO' 14 __________ 165 9.5 5. 9X 10'
Sferic groundwave record ed at Boulder during nigh ttime July 26, 1958
15 ___ ___ ____ 400 7.5 2.1XI0' 16 __________ 400 6.0 6.5 X IO' 3L ________ _ 400 8.5 2.0XlO' 33 __________ 400 8.5 5.5XI0'
17 __________ 460 6.5 4.5 X lO' 18 __________ 460 5.5 2.9XlO' 19 __________ 460 5.5 6.2X lO' 20 __________ 460 7.0 3.1XlO' 2L _________ 460 7.0 1. .1 X 10' 32 __ ________ 460 5.5 9.3XlO'
22 __________ 600 15.5 i.9X lO' 23 __________ 600 12.0 1.1X lO'
24 ______ ____ 620 5. 5 1.1 XlO' 25 ______ ____ 620 7. 0 9.2X lO' 26 __________ 620 6.5 6.4XIO' 27 __________ 620 9.0 1. 3X IO' 28 __________ 620 8.5 9.6XlO' 29 __________ 620 8. 0 6.4 X lO' 30 __ ______ __ 620 6.5 6. 3XlO'
202
The average of these values of energy is 26,600 j . On another occa ion l1O], sferics were r eceived from th understorms in a fron tal r egion extending through T exas, Louis iana, and Oldahoma. The average of the total radiated energy values calculated from seven of these sferics was about 250,000 j ; the individual values range from 130,000 to 500,000 j. Laby, et al. [ll], r eported the average value of energy radiated from 35 sferics observed in Australia was 200,000 j . It appears that the sferics used in the present work: res ulted from less energetic discharges than those reported by Taylor and by Laby. It is not at all certain that the energy value reported here is representative of return-stroke discharges from thunderstorms occurring in the Rocky Mountain area. However, part of the differences between the energy values quoted might have r esulted from differences in thunderstorm characteristics, differences in topography, earth conductivity, etc.
Th e importance of land elevation in determining thunderstorm characteristics was pointed out by Loeb [18]. In general, the lightning discharges used in this analysis occurred over land of higher elevation than those previously reported by Taylor. It is not known in what area of Australia the lightning fiashes OCCUlTed that were used in Laby's analysis.
It is interesting to note that the ratio of the total energy available in a lighting discharge to the values of electromagnetic en ergy radiated in to the atmosphere is as large as 105 or 106 .
A wide variation was noted in the detail of the individual groundwave pulses; however, most of them consisted of two half-cycles. The first half-cycles were larger in amplitude and shorter in d UJoation than the corresponding values in the second halfcycle. These two characteristics of the first halfcycle would be expected to control the total radiated en ergy to a cer tain extent. After normalizing the observations to a l-km range, the relationships existing b etween various parameters mentioned above were examin ed. Some of these comparisons are described below.
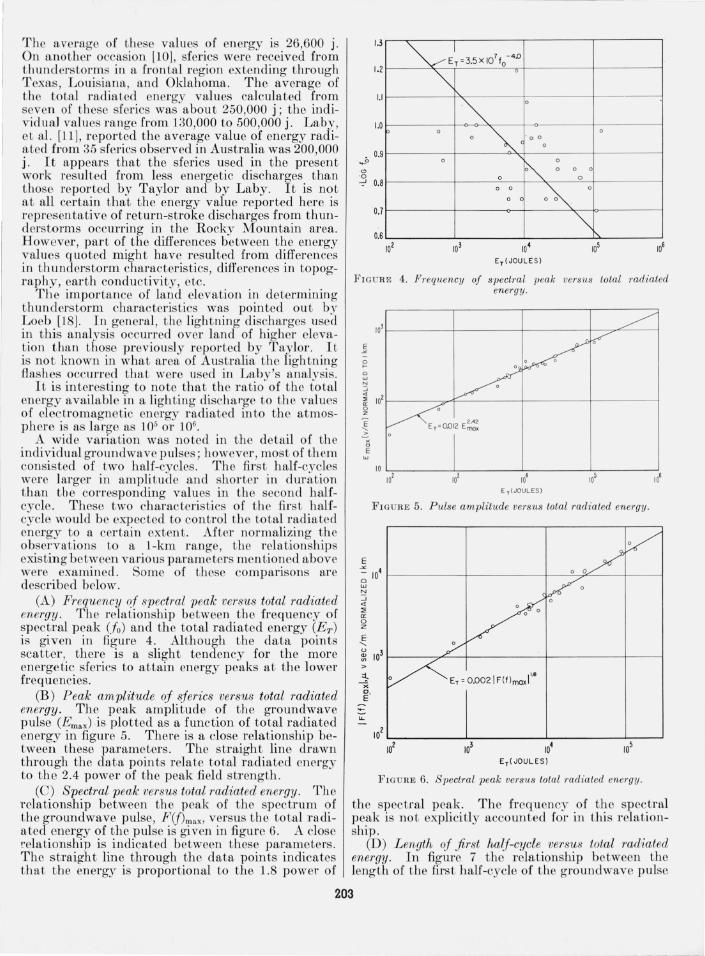
(A) Frequency of spectral peak versus total radiated energy. The relationship between the frequency of spectral peak (fo) and the total radiated energy (ET )
is given in figure 4. Although the data points scatter, there is a slight tendency for the more energetic sferics to attain energy peaks at the lower frequencies.
(B) Peak amplitude oj sjerics versus total radiated energy . The peak amplitude of the groundwave pulse (Emax) is plotted as a function of total radiated energy in figure 5. There is a close relationship between these parameters . The straight line drawn through the data points relate total radiated energy to the 2.4 power of the peak f"i eld str ength.
(C) Spectral peak versus total radiated energy. The relationship between the peak of the spectrum of the groundwave pulse, F(j)max, versus tbe total radia ted energy of the pulse is given in figu re 6. A close ~'elationship is indicated between these parameters. The straight line through the data poin ts indicates that the energy is proportional to the l.8 power of
1.3
~EIT=3.5X I07fO- 4D
"'" 1.2
I
~ 0
1.0 0 0
0 o 0
0 ~ 0
~ 0 _" 0.9
<.!> ·0
0 0 0
0 0
o~ -1 0.8
0.1
o 0
o c
104 ET(JOULE S)
0
"'" FIGU RE 4. Frequency of spectTal peak veTS us total radiated
energy.
g o W N ~
103 f-----j------+-----+---:7""""----I
~ 1011----",...-4::.......-----+-----1------j o z
1 x o E
w
E
Er =O.o12 E~!
1 0 ~---~~---~~---~---~ 101 103 1 0~ 105 106
E T(JOULES)
FIGU RE 5. Pulse amplit1ide verS1iS toiall'adiated en ergy.
~ 104~-----+-----~-~~--~-~ o w ~ -' <{ ::;; a: o z E "-u ~ >
"!:-x o . E
103
ET = 0.0021 F( f)maxi'"8
102 ~----""""':-------'-:------'-:--~ ~ ~ ~ ~
ET( JOULES)
FIGURE 6. Spectral peak verS1LS to/cll radiated energy .
the spectral peak. The frequency of th e spectral peak is not explicitly accoun ted for in this relationship.
(D) L ength oj first half-cycle versus total radiated energy . In figure 7 the relationship between the length of the first half-cycle of the groundwave pulse
203
I
f-------
1.8 -------'-- 0
<)
:x 1.7 :t x
'" 1.6 S
1.5
1.4
- 1- -----rP o 0 V ~ 0
o 6' ~ o
~
~ 0 0 ~T'1I2 x 10- 13 lX '0.8 5
0
Y
I 104
ET (JOU L ES)
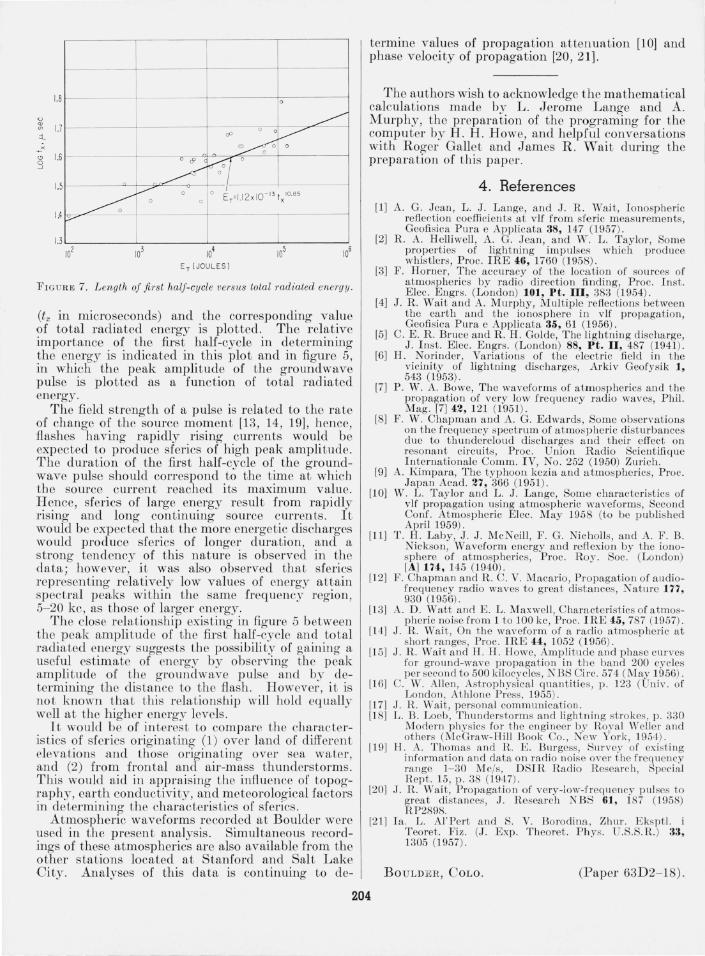
FIG URE 7. L ength of first half-cycle vel·sus total radiated energy.
(tx in microseconds) and the corresponding value of total radiated energy is plotted . The r ela tive importance of the first half-cycle in determining the energy is indicated in this plo t and in figure 5, in which the peak amplitude of the groundwave pulse is plo tted as a function of total radiated energy.
The field strength of a pulse is related to the rate of change of the source moment [1 3, 14, 19], h ence, flashes having rapidly rising curren ts would b e expected to produce sferics of high peak amplitude. The duration of the first half-cycle of the groundwave pulse should correspond to the time at which the source current r eached its maximum value. H ence, sferics of large energy result from rapidly Tising and long continuing source currents. It would be expec ted that the more energe tic discharges would produce sferics of longer duration, and a trong tendency of this nature is observed in the
clata; however , it was also observed that sferics representing l-ela tively low values of energy attain spectral peaks within the same frequency region, 5- 20 kc, as those of larger en ergy .
The close relationship existing in figure 5 b etween the peak ampli t ude of th e first half-cycle and total radiated energy suggests the possibility of gaining a useful estimate of energy by observing the peak ampli tude of th e gro undwave pulse and by determining the distance to the fl ash. However, i t is not known that this relationship will hold equally well at the higher en ergy levels.
It would be of interest to compare the characteristics of sferics originating (1) over land of different elevations and those originating over sea water, and (2) from frontal and air-mass thunderstorms. This would aid in appraising the influence of topography, earth condu ctivity, and meteorological factors in determining th e characteristics of sferics .
Atmospheric waveforms recorded at Boulder were used in the presen t analysis. Simultaneous recordings of these atmospherics are also available from the other sta tions located at Stanford and Salt Lake C ity. Analyses of this data is continuing to de-
termine values of propagation attenuation [10] and phase velocity of propagation [20, 21].
The authors wish to acknowledge the mathematical calculations made by L. J erome Lange and A. Murphy, the preparation of the programing for the computer by H . H. Howe, and helpful conversations with Roger Gallet and J ames R. Wait during the preparation of this paper.
4. References [1) A. G. J ean, L . J. Lange, and J . R . Wait, I onospheric
refl ection coefficients at vlf from sferic measurements, Geofisica Pura e Applicata 38, 147 (1957) .
(2) R. A. H elliwell , A. G. Jean, a nd W. L. Taylor , Some properties of lightning impulses which produce whistlers, Proc. IRE 46, 1760 (1958) .
(3) F. Horner , The accuracy of t he location of sources of atmosphe rics by radio direction finding, Proc. Inst. E lec. E ngrs . (London) 101, Pt. III, 383 (1954) .
(4) J. R. Wait and A. Murphy, Multiple reflections between the eart h a nd t he ionosphere in vlf propagation, Geofis ica Pura e Appl icata 35, 61 (1956).
[5) C. E. R. Bruce a nd R. H . Golde, The light ning discharge, J . Inst. Elec. Engrs. (Londo n) 88, Pt. II, 487 (1941) .
(6) H . Norinder, Variations of the electri c field in t he vicini ty of lightn ing discharges, Arki v Geofysik 1, 543 (1953) .
(7) P. W. A. Bowe, Thc waveforms of atm os pherics and t he propagation of very low freq uency radio waves, Phil. Mag. r7] 42, 121 (1951) .
(8) F. W. Chapman and A. G . Edwards , Some observations on t he freq uency spectrum of atmospheri c dist urbances due to t hundercloud discha rges a nd their effect on resonant circuits, Proc. Union Rad io Scientifi que Intern ational e Comm. IV, No . 252 (1950) Zuri ch.
(9) A. K impara, The typ hoo n kez ia a nd atmospherics, Proc. J apan Acad. 27, 366 (1951) .
[10] W . L. Taylor a nd L . J. La nge, Some characteristics of vlf propagation using atmospheric waveforms, Second Co nf. Atmospheric E lec. May 1958 (to be published April 1959) .
(11) T. H . Laby , J . J . M cNeill , F . G. Nicholls, and A. F. B. Nickson, Waveform energy a nd reflex ion by the ion osphere of atmosphcrics, Proc . Roy. Soc. (Lo ndon) [A)lH, l45 (1940) .
(12) F. Chapman a nd R. C. V. Macario , P ropagation of aud iofrcquency radio waves to great distances, Nature 177, 930 (1956) .
[13] A. D. Watt and E. L. Maxwell , Characteristics of atmospheri c no ise from 1 to 100 kc, Proc. IRE 45, 787 (1957) .
(14) J . R . Wa it , On the waveform of a radio atmosp heric at short ranges, Proc. IRE 44,1052 (1956) .
(15) J. R. Wa it and H . H. Howe, Amplitude an d phase curves for grou nd-wave propagation ill the band 200 cycles per second to 500 kilocycles, NBS Ci rc. 574 (May 1956) .
(16) C. W. Allen, Astrophysical quant ities, p. 123 (Univ. of London, Ath lone Press , 1955) .
r17) J . R. Wait, personal commu nicat ion. (18) L. B . Loeb, Thunderstorms a nd lightning strokes, p. 330
Modern physics for the engineer by Royal Weller and others (McGraw-Hill Book Co., Ncw York, 1954) .
[19] H. A. Thomas an d R. E. Burgess, Survcy of ex i ~ ting information and data on rad io noise over the frequency ra nge 1- 30 Mc/s , D SIR Radio Research, Spccial Rept. 15, p. 38 (1947) .
[20) J. R. Wa it, Propagation of vcry-Iow-freq \lency pulses to great distances, J . Rescarch NBS 61, 187 (1958) RP2898.
(2 1) I a . L . AI'Pert and S. V. Borodina, Zhur . Ekspt l. i TeOl·et. Fiz. (J. Exp . Theoret. Phys. U.S.S.R.) 33, 1305 (1957) .
BOULDER, COLO. (Paper 63D2- 1S).
204