very low birth weight infants in the republic of ireland · pdf file · 2017-11-234...
TRANSCRIPT
ANNUAL REPORT 2014
Very Low Birth Weight Infants in the Republic of Ireland
Very Low Birth Weight Infants in the Republic of Ireland

ANNUAL REPORT 2014
Very Low Birth Weight Infants in the Republic of Ireland

Citation for this report: Twomey A, Murphy BP, Drummond L, Corcoran P, O’Farrell I, Greene RA, on behalf of NICORE Republic of Ireland. Very Low Birth Weight Infants in the Republic of Ireland Annual Report 2014. Cork: National Perinatal Epidemiology Centre, 2016.
Copyright © National Perinatal Epidemiology Centre, 2016
Funded by the Irish Health Service Executive
Printed by Hackett Reprographics, 5 Copley St., Cork
ISSN 2009-8979 (Online) ISSN 2009-8960 (Print)
Contact: National Perinatal Epidemiology Centre, Department of Obstetrics and Gynaecology, UCC, 5th Floor, Cork University Maternity Hospital, Wilton, Cork, Ireland+353 21 4205017, [email protected], www.ucc.ie/en/npec/
Desi
gn/A
rtw
ork
by D
ugga
n 08
3 00
7100
0

Commentary
This report has been reviewed by the following bodies: Neonatal Advisory Group RCPI, Obstetric Working Group HSE and the Faculty of Paediatrics RCPI. Following on from these discussions a combined Obstetric-Neonatology meeting was convened to discuss the 2014 report on 29/06/2016. This group suggested a commentary be added to the report and that a viability group be convened to look at several of the issues raised.
“We welcome the publication of the Very Low Birth Weight Infants in the Republic of Ireland Annual Report 2014 which represents the first year of data collection for all infants born less than 32 weeks gestation from all 19 delivery and neonatal units in the Republic of Ireland. This is a great achievement and the authors are to be complimented on the report. We do however wish to make the following comments: This is a single year’s data and the above group believe a dataset comprising at least 3 but preferably 5 years complete Irish data would be more insightful looking at outcomes for this group of babies. Indeed the Vermont Oxford network itself issues data for each unit comparing these outcomes over several years. We also wish to highlight the small numbers delivered in many units during a single year and that this may give a falsely positive or negative impression for certain outcomes including morbidity and mortality at borderline viability limits (such as 23 weeks gestation) for the 12 month period of 2014. We would caution therefore with regard to judging individual unit performance at borderline viability on the basis of this report alone. Key to comparing outcomes are certain factors, lack of availability of early dating scans in many centres so that exact dating was not available to the perinatal team at the time of assessment /delivery, timing of the maternal presentation to the individual centres, available time frames to administer antenatal steroids/magnesium sulphate/optimise maternal care/ transfer in-utero if appropriate. We look forward to receiving further reports which will encompass a 3 to 5 year period.”
August 2016
Martin J White Chair, Neonatal Advisory Group, RCPI
John F A Murphy National Clinical Lead, Neonatology Programme, HSE
Michael Turner National Clinical Lead, Obstetric and Gynaecology Programme, HSE

3
Contents
Acknowledgements ............................................................................................................................................................. 6
Executive Summary ............................................................................................................................................................ 7
1. Background...................................................................................................................................................................... 8
2. Methods ......................................................................................................................................................................... 11
3. Main findings ................................................................................................................................................................. 14
Appendix A: Endorsement by the National Office of Clinical Audit (NOCA) ....................................................................43
Appendix B: NICORE Group Members ................................................................................................................................44
Appendix C: Vermont Oxford Network Data Collection Forms ..........................................................................................45

4 VERY LOW BIRTH WEIGHT INFANTS IN THE REPUBLIC OF IRELAND ANNUAL REPORT 2014
List of figures
Figure 1.1: Member countries of the Vermont Oxford Network .........................................................................................8
Figure 1.2: Neonatal centres in the Republic of Ireland and Northern Ireland participating in the Vermont Oxford Network.........................................................................................................................................10
Figure 2.1: Flow of information in the VON data collection process ...............................................................................11
Figure 3.1: Distribution of mortality amongst ROI and VON infants, 2014 ................................................................... 20
Figure 3.2: Distribution of death or morbidity amongst infants by gestational age, 2014 ..........................................21
Figure 3.3: Distribution of death or Morbidity amongst infants by birth weight, 2014 ............................................... 22
Figure 3.4: Distribution of chronic lung disease amongst infants by gestational age, 2014 ......................................23
Figure 3.5: Distribution of chronic lung disease amongst infants by birth weight, 2014 ...........................................23
Figure 3.6: Distribution of chronic lung disease < 33 weeks amongst infants by gestational age, 2014 ..................24
Figure 3.7: Distribution of chronic lung disease < 33 weeks amongst infants by birth weight, 2014 ........................24
Figure 3.8: Distribution of pneumothorax amongst infants by gestational age, 2014 ................................................25
Figure 3.9: Distribution of pneumothorax amongst infants by birth weight, 2014 ..................................................... 26
Figure 3.10: Distribution of infections in ROI and VON infants, 2014 .............................................................................27
Figure 3.11: Distribution of late bacterial infection amongst infants by gestational age, 2014 ................................ 28
Figure 3.12: Distribution of late bacterial infection amongst infants by birth weight, 2014 ...................................... 28
Figure 3.13: Distribution of coagulase negative infection amongst infants by gestational age, 2014 .......................29
Figure 3.14: Distribution of coagulase negative infection amongst infants by birth weight, 2014 ............................ 30
Figure 3.15: Distribution of nosocomial infection amongst infants by gestational age, 2014 ....................................31
Figure 3.16: Distribution of nosocomial infection amongst infants by birth weight, 2014 ..........................................31
Figure 3.17: Distribution of any late infection amongst infants by gestational age, 2014 ..........................................33
Figure 3.18: Distribution of any late Infection amongst infants by birth weight, 2014 ...............................................33
Figure 3.19: Distribution of any IVH amongst infants by gestational age, 2014 ......................................................... 34
Figure 3.20: Distribution of any IVH amongst infants by birth weight, 2014 ................................................................35
Figure 3.21: Distribution of severe IVH amongst infants by gestational age, 2014 .....................................................35
Figure 3.22: Distribution of severe IVH amongst infants by birth weight, 2014 .......................................................... 36
Figure 3.23: Distribution of ROP amongst infants by gestational age, 2014 ................................................................37
Figure 3.24: Distribution of ROP amongst infants by birth weight, 2014 ......................................................................37
Figure 3.25: Distribution of severe ROP amongst infants by gestational age, 2014 ................................................... 38
Figure 3.26: Distribution of severe ROP amongst infants by birth weight, 2014 ......................................................... 38
Figure 3.27: Distribution of necrotising enterocolitis amongst infants by gestational age, 2014 ............................. 40
Figure 3.28: Distribution of necrotising enterocolitis amongst infants by birth weight, 2014 ................................... 40
Figure 3.29: Distribution of extreme length of stay amongst surviving infants by gestational age, 2014 ................41
Figure 3.30: Distribution of extreme length of stay amongst surviving infants by birth weight, 2014 ..................... 42
5
List of tables
Table 3.1: Number of cases reported to VON in 2014, according to gestational age ..................................................... 14
Table 3.2: Number of cases reported to VON in 2014, according to birth weight ........................................................... 14
Table 3.3: Infant characteristics in the Republic of Ireland and VON, 2014 ................................................................... 15
Table 3.4: Survival of ROI and Network infants reported to VON, including those with congenital anomalies, 2014 ........... 16
Table 3.5: Gestational age breakdown and survival to discharge of ROI infants reported to VON, including those with congenital anomalies, 2014 .......................................................................................................... 16
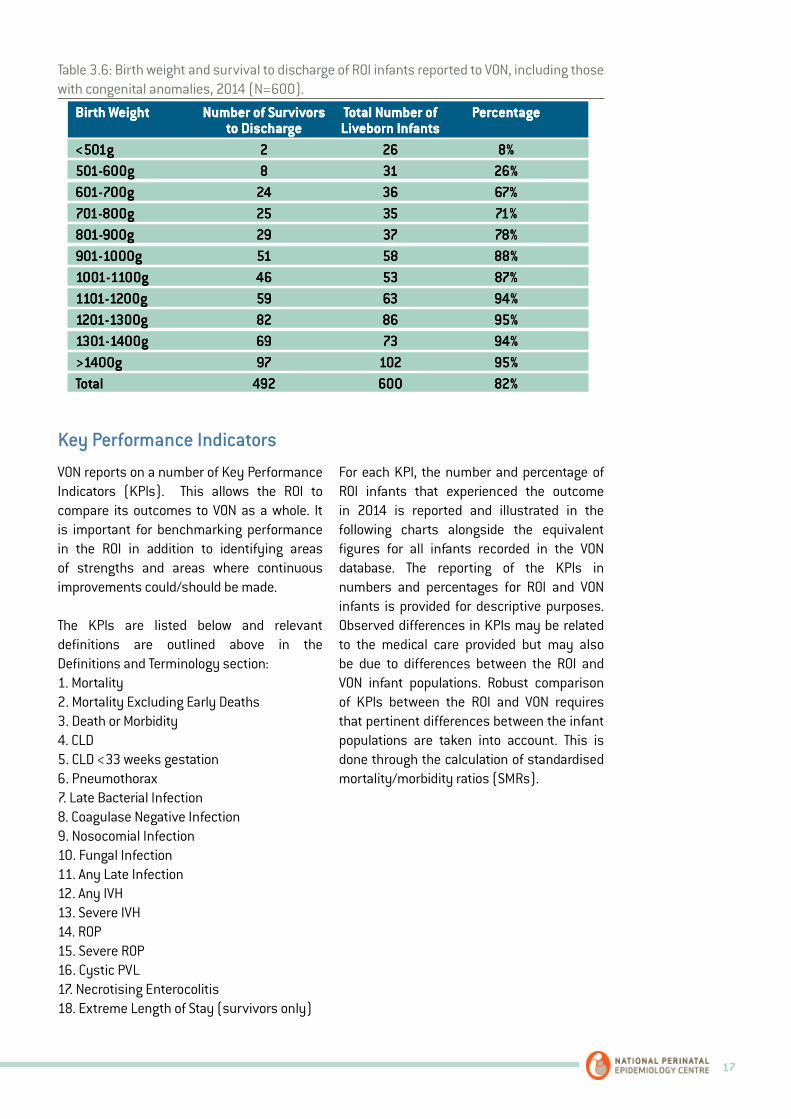
Table 3.6: Birth weight and survival to discharge of ROI infants reported to VON, including those with congenital anomalies, 2014 .......................................................................................................... 17
Table 3.7: Risk Adjusted Standardised Mortality/Morbidity Ratios for Key Performance Indicators, Republic of Ireland, 2014 .................................................................................................................................................. 19
Table 3.8: Risk Adjusted Standardised Mortality Ratios for Key Performance Indicators - KPI 1: mortality and KPI 2: mortality excluding early death, ROI, 2014 ........................................................................20
Table 3.9: Risk Adjusted Standardised Mortality Ratios for Key Performance Indicators - KPI 3: death or morbidity, ROI, 2014 ................................................................................................................................22
Table 3.10: Risk Adjusted Standardised Morbidity Ratios for Key Performance Indicators - KPI 4: chronic lung disease, ROI, 2014 .............................................................................................................................25
Table 3.11: Risk Adjusted Standardised Morbidity Ratios for Key Performance Indicators - KPI 6: pneumothorax, ROI, 2014 .......................................................................................................................................26
Table 3.12: Risk Adjusted Standardised Morbidity Ratios for Key Performance Indicators - KPI 7: late bacterial infection, ROI, 2014 ..........................................................................................................................29
Table 3.13: Risk Adjusted Standardised Morbidity Ratios for Key Performance Indicators - KPI 8: coagulase negative infection, ROI, 2014 ...............................................................................................................30
Table 3.14: Risk Adjusted Standardised Morbidity Ratios for Key Performance Indicators - KPI 9: nosocomial infection, ROI, 2014 ............................................................................................................................32
Table 3.15: Risk Adjusted Standardised Morbidity Ratios for Key Performance Indicators - KPI 10: fungal infection, ROI, 2014 ...................................................................................................................................32
Table 3.16: Risk Adjusted Standardised Morbidity Ratios for Key Performance Indicators - KPI 11: any late infection, ROI, 2014 ................................................................................................................................34
Table 3.17: Risk Adjusted Standardised Morbidity Ratios for Key Performance Indicators - KPI 12: intraventricular haemorrhage and KPI 13: severe intraventricular haemorrhage, ROI, 2014 ..........................36
Table 3.18: Risk Adjusted Standardised Morbidity Ratios for Key Performance Indicators - KPI 14: retinopathy of prematurity and KPI 15: severe retinopathy of prematurity, ROI, 2014 ...................................39
Table 3.19: Risk Adjusted Standardised Morbidity Ratios for Key Performance Indicators - KPI 16: cystic periventricular leukomalacia, ROI, 2014 ..................................................................................................39
Table 3.20: Risk Adjusted Standardised Morbidity Ratios for Key Performance Indicators - KPI 17: necrotising enterocolitis, ROI, 2014 ..................................................................................................................... 41
6 VERY LOW BIRTH WEIGHT INFANTS IN THE REPUBLIC OF IRELAND ANNUAL REPORT 2014
Acknowledgements
Welcome to the first Very Low Birth Weight Infants in the Republic of Ireland (ROI) Annual Report, produced by the Neonatal Intensive Care Outcomes Research and Evaluation (NICORE) ROI group and facilitated by the National Perinatal Epidemiology Centre (NPEC). This report is the first national report on all babies born ≤1500g and/or ≤29 wks gestation in the Republic of Ireland for a calendar year. Since 2003, nine neonatal centres in the ROI have participated in the Vermont Oxford Network (VON), the international network of health care professionals dedicated to improving the medical care of newborn infants and which is the entity which underpins this report. The remaining 10 ROI neonatal centres joined VON in 2013. Now, every neonatal centre in the country has signed up to VON and is submitting data on their very low birth weight (VLBW) infants. It is a credit to everybody involved and it is truly a great achievement.
Of note, this report is endorsed by the National Office of Clinical Audit (NOCA). Participation in NOCA ensures a process by which we can close the audit loop. This begins with bench marking clinical care with identified standards, such as those set by the National Clinical Programme in Neonatalogy and the Faculty of Paediatrics, and ends with implementing change for the improvement of patient safety and quality of care. The NOCA Governance Board endorsement of this report is included as Appendix A.
We wish to extend our sincere thanks to the NPEC, led by Professor Richard Greene, for its continued support of the ROI’s participation in VON, specifically by financing the annual membership fee to the Network for all 19 centres, and also for providing the logistical support for this project. Similarly, we thank the team at VON which has whole-heartedly supported this initiative by processing and analyzing data and working closely with the team at the NPEC.
Measurement of the outcome of care is central to the development of safe and high quality health care services. Support from all Irish neonatal centres is instrumental in the success of this important national programme. On behalf of NICORE and the NPEC, we extend sincere thanks and appreciation to the many neonatal nurses, paediatricians and administration staff who have supported and contributed data to VON. In particular, we gratefully acknowledge the commitment of those who co-ordinate the collection of VON data at unit level.
Lastly, we would like to thank the NICORE ROI group (Appendix B) for their participation and support of this project from the onset, for their continuing intellectual input and for their vision of using national clinical audit data to improve neonatal services in the Republic of Ireland.
Dr. Anne TwomeyConsultant NeonatologistNational Maternity HospitalHolles Street, Dublin 2, IrelandEmail: [email protected]
Dr. Brendan Paul MurphyConsultant NeonatologistCork University Maternity HospitalWilton, Cork, IrelandEmail: [email protected]
7
Executive summary
1. A total of 608 very low birth weight infants (VLBW) were born in the Republic of Ireland (ROI) in 2014, of which two infants were <401g but ≥22 wks gestation and 16 infants were >1500g but ≤29 wks gestation.
2. In all, 228 infants were born with a birth weight ≤1000g and 158 infants were born with a gestational age ≤26 wks.
3. National survival figures for VLBW infants according to birth weight and gestational age categories are reported.
4. The Standardised Mortality Rate (SMR) for VLBW infants born in the ROI was 1.27 (95% CI: 1.03, 1.51). The number of observed cases of death was 1.27 times the expected number: this finding was statistically significant.
5. Excluding early deaths (deaths in the Delivery Room or deaths within 12 hours of admission to the NICU), the standardised mortality rate was 1.23 (95% CI: 0.92, 1.54). The number of cases observed did not exceed the number of cases expected.
6. More VLBW infants in the ROI are born with a major congenital malformation than in the Vermont Oxford Network (VON) (9% vs 5%): this finding was statistically significant (p<0.001).
7. Survival for infants born at 23 weeks gestation in 2014 was 19%. More VLBW infants born at less than 24 weeks gestation in the ROI die in the Delivery Room than in VON (88% in the ROI vs 39% in VON): this finding was statistically significant (p<0.001). The availability of these data will be an invaluable resource to healthcare providers who counsel families that are about to deliver an infant at the “limits of viability”. They help guide clinicians and
families on decisions regarding transfer to a tertiary neonatal centre in anticipation of an imminent delivery.
8. Standardised Morbidity Rates for Key Performance Indicators in Neonatal Care of VLBW infants suggest that:
• VLBW infants born in the ROI have significantly higher rates of pneumothorax. SMR for pneumothorax: 1.67 (95% CI: 1.25, 2.10).
• VLBW infants born in the ROI have significantly higher rates of coagulase negative staphylococcus infection. SMR for coagulase negative infection: 1.84 (95% CI: 1.45, 2.23)
• VLBW infants born in the ROI have significantly lower rates of retinopathy of prematurity. SMR for ROP: 0.51 (95% CI: 0.33, 0.70).
• VLBW infants born in the ROI have significantly lower rates of cystic periventricular leukomalacia (PVL). SMR for PVL: 0.24 (95% CI: -0.31, 0.79).
9. Access to the raw anonymised data will allow a more in-depth analysis of this important national dataset year on year. Important questions that can now be addressed include but are not limited to an assessment of the best configuration of neonatal services in Ireland based on neonatal transfer data and outcomes of VLBW infants according to place of birth.

8 VERY LOW BIRTH WEIGHT INFANTS IN THE REPUBLIC OF IRELAND ANNUAL REPORT 2014
1. Background
The Vermont Oxford Network (VON) is a non-profit voluntary collaboration of health care professionals dedicated to improving the quality and safety of medical care for newborn infants and their families. Established in 1988, the Network is today comprised of nearly 1000 Neonatal Intensive Care Units around the world (Figure 1.1).
The Network maintains a database of information regarding the care and outcomes of high-risk newborn infants. The database provides unique, reliable and confidential
data to participating units for use in quality management, process improvement, internal audit and peer review.
In the ROI, nine tertiary and regional neonatal centres joined VON in 2003, followed by the remaining 10 centres in 2013. This was on foot of a joint initiative between the NICORE group and the NPEC. In 2014, all 19 neonatal centres in the ROI submitted data to VON, signifying the first year for which a National dataset is available.
Figure 1.1: Member countries of the Vermont Oxford Network
9
Governance
For the ROI, data submitted to VON are controlled by NICORE (Neonatal Intensive Care Outcomes Research and Evaluation) ROI, a group of consultant neonatologists and paediatricians with formal representation from all 19 tertiary, regional and peripheral neonatal centres in the Republic. NICORE ROI is formally affiliated through a Memorandum of Understanding to the Faculty of Paediatrics, Royal College of Physicians of Ireland (RCPI). NICORE ROI is also formally affiliated to and functions in partnership with the National Perinatal Epidemiology Centre (NPEC) for the promotion and management of VON in the ROI.
NICORE ROI, incorporating all neonatal centres in the Republic, collaborates with the five neonatal centres in Northern Ireland (NI). This cross-border collaboration has been in existence since 2003 when only nine centres in the ROI were contributing data to VON. The collaborative group at that time was identified as NICORE Ireland. When all 19 centres in the ROI began submitting data to VON, the NICORE ROI group was created. Effectively, NICORE ROI is a subgroup of the parent group, NICORE Ireland. Figure 1.2 illustrates all units participating in VON in the island of Ireland.

10 VERY LOW BIRTH WEIGHT INFANTS IN THE REPUBLIC OF IRELAND ANNUAL REPORT 2014
Figure 1.2: Neonatal centres in the Republic of Ireland and Northern Ireland participating in the Vermont Oxford Network. ROI centres are classified according to average annual number of births (in the associated obstetric centres).

11
Data recording
In 2014, 19 neonatal centres participated in the Vermont Oxford Network (VON)’s Very Low Birth Weight (VLBW) database. The definition of eligibility for the VLBW database is:
Anonymised data on VLBW infants born between 1st January and 31st December 2014 were submitted to VON’s on-line database or alternatively by paper format to the NPEC (see Appendix C for data collection forms). Figure 2.1 illustrates the flow of information involved.
On completion of all ROI submissions for 2014, VON forwarded a copy of the complete ROI dataset to the NPEC. The data presented in
this report are based on both the ROI dataset and data from “Nightingale”, VON’s on-line data reporting system. Throughout the report, ROI data is compared to VON data, comprising data from all centres across the Network.
Definitions and terminologyBirth weight: Weight from the Labour and Delivery record. If this is unavailable, weight on admission to the neonatal unit or lastly, the weight obtained on autopsy (if the infant expired within 24 hours of birth).
Gestational age: The best estimate of gestational age in weeks and days using the following hierarchy:
• obstetric measures based on last menstrual period, obstetrical parameters, and prenatal ultrasound as recorded in the maternal chart.• neonatologist’s estimate based on physical criteria, neurologic examination, combined physical and gestational ages exam (Ballard or Dubowitz), or examination of the lens.
Inborn: Infant delivered at your hospital.
2. Methods
Figure 2.1: Flow of information in the VON data collection process.
VLBWinfantborn
NeonatalunitcompletesVONdata
forms
VONonlinedatabase
VONpaper
forms
Formsreturnedto
NPEC
FormsforwardedtoVONfordata
entry
VONreturnsROIrawdatato
NPECandprovidesdataanalysisonNighCngale
NICORE/NPECAnnualReport
2014
ReviewofdatabyVON:data
queriesreturnedto
unit
Any infant who is born alive at your hospital and whose birth weight is between 401 and 1500 grams OR whose gestational age is between 22 weeks 0 days and 29 weeks 6 days (inclusive), regardless of where in your hospital the infant receives care
12 VERY LOW BIRTH WEIGHT INFANTS IN THE REPUBLIC OF IRELAND ANNUAL REPORT 2014
Outborn: Infant delivered outside your hospital. Any infant requiring ambulance transfer is considered outborn.Died in the delivery room: Death of a live born baby who was never admitted to the NICU, and died in the delivery room or at any other location in your hospital within 12 hours after birth.
Mortality: Indicates whether the infant died.
Mortality excluding early deaths: Death excluding those who died in the Delivery Room or within 12 hours of admission to the NICU.Death or morbidity: Indicates if an infant died or was known to have one or more of the following key morbidities: severe IVH, CLD in infants <33 wks, NEC, pneumothorax, any late infection or PVL.
Chronic Lung Disease (CLD): Based on an algorithm that was tested with hospital data and is more accurate than just oxygen dependency at 36 wks gestational age. CLD is coded ‘yes’ if the infant is in your centre at 36 weeks postmenstrual age and ‘oxygen at 36 weeks’ is answered ‘yes’. Infants are considered to ‘be in your centre at 36 weeks’ if they have not been discharged home on that date or if they have been transferred from your centre to another centre prior to the date of week 36 but have been readmitted to your centre before discharge home, death or first birthday or are not transferred a second time before 36 weeks.
If the infant is discharged home on or after 34 weeks postmenstrual age but before 36 weeks, then CLD is equal to the ‘value of oxygen at discharge’. The latter is recorded as ‘yes’ for infants who went home and were on oxygen at the time of discharge. If the infant was transferred to another hospital on or after 34 weeks postmenstrual age but before the date of week 36, then CLD is equal to the ‘value of oxygen at the time of discharge’ from your institution. Again, the latter is recorded as ‘yes’ for infants who were transferred and were on oxygen at the time of discharge from your centre.
If the infant is discharged home before 34 weeks postmenstrual and is not on oxygen at the time of discharge, then CLD is coded as ‘no’. If the infant is transferred before 34 weeks postmenstrual age and the infant is not on oxygen at discharge, then CLD is coded as ‘no’. However, if the infant is discharged home or transferred to another hospital before 34 weeks postmenstrual age, and the infant is on oxygen at the time of discharge from our centre, then CLD is coded as ‘unknown’.
Chronic Lung Disease (CLD) < 33 weeks gestation: Same algorithm applied as above but only includes infants < 33 weeks gestation.
Pneumothorax: Extra-pleural air diagnosed by chest radiograph or needle aspiration (thoracentesis).
Late Bacterial Infection: Bacterial pathogen recovered from blood and/or cerebrospinal fluid culture obtained after day 3 of life.
Coagulase Negative Infection: Coagulase negative staphylococcus recovered from a blood culture obtained from either a central line or a peripheral blood sample, and/or recovered from cerebrospinal fluid obtained by lumbar puncture, ventricular tap or ventricular drain after day 3 of life AND one or more signs of generalized infection AND treatment with 5 or more days of intravenous antibiotics.
Nosocomial Infection: Indicates whether the infant has either late bacterial infection and/or coagulase negative staphylococcal infection diagnosed after day 3 of life.
Fungal Infection: Fungus recovered from a blood culture obtained from either a central line or a peripheral blood sample after day 3 of life.
Any Late Infection: Indicates whether the infant has either any late bacterial infection, coagulase negative infection and/or fungal infection after day 3 of life.
13
Any Intraventricular Haemorrhage (IVH): Indicates whether the infant has a grade 1, 2, 3 or 4 periventricular-intraventricular hemorrhage (PIH) on or before day 28.
Severe Intraventricular Haemorrhage (IVH): Indicates whether the infant has a grade 3 or 4 periventricular-intraventricular hemorrhage (PIH) on or before day 28.
Retinopathy of Prematurity (ROP): Indicates whether the infant has stage 1, 2, 3, 4 or 5 ROP.
Severe Retinopathy of Prematurity (ROP): Indicates whether the infant has stage 3, 4 or 5 ROP.
Cystic Periventricular Leukomalacia (PVL): Evidence of cystic periventricular leukomalacia on a cranial ultrasound, CT, or MRI scan obtained at any time prior to discharge.
Necrotising Enterocolitis (NEC): NEC diagnosed at surgery, at post-mortem examination or “clinically and radiographically”. To be diagnosed “clinically and radiographically”, there has to be at least one of the following clinical signs present: bilious gastric aspirate or emesis; abdominal distension; occult or gross blood in stool AND at least one of the following radiographic findings present: pneumatosis intestinalis, hepato-biliary air, pneumoperitoneum.
Extreme Length of Stay (survivors only): Indicates whether the infant’s total hospital stay is greater than the 90th percentile for the predicted value, based on a multivariable risk adjustment model.
14 VERY LOW BIRTH WEIGHT INFANTS IN THE REPUBLIC OF IRELAND ANNUAL REPORT 2014
3. Main findings
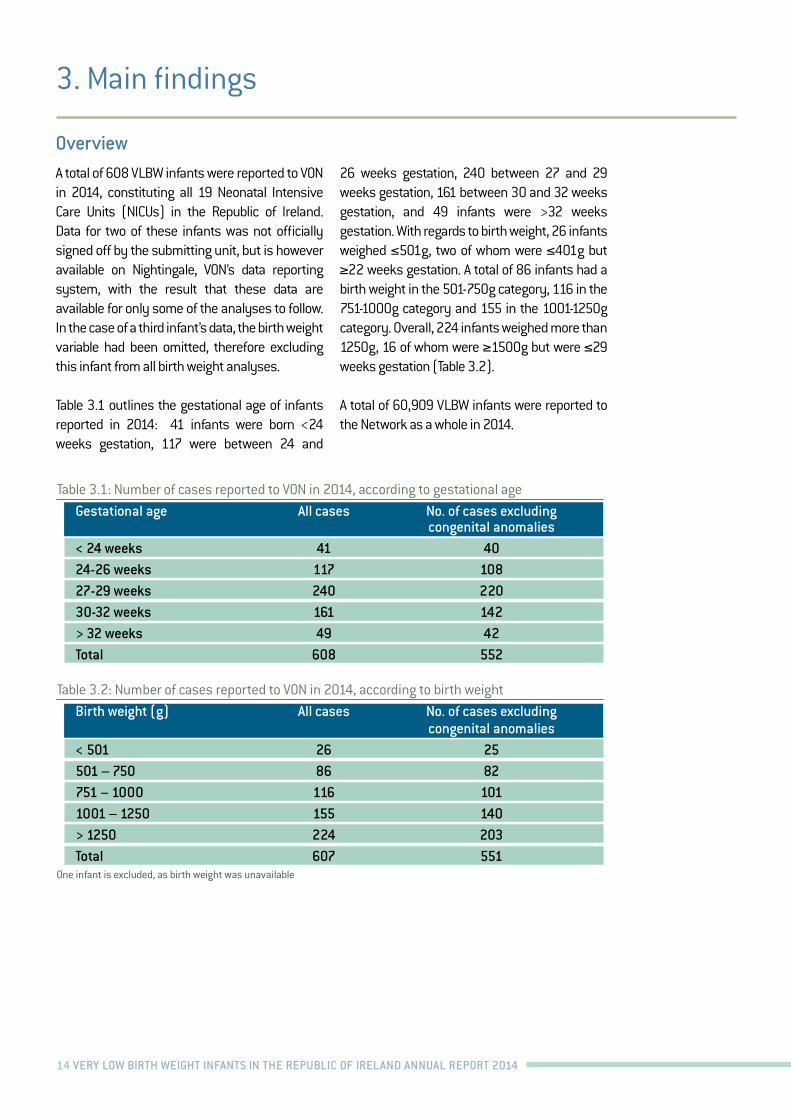
A total of 608 VLBW infants were reported to VON in 2014, constituting all 19 Neonatal Intensive Care Units (NICUs) in the Republic of Ireland. Data for two of these infants was not officially signed off by the submitting unit, but is however available on Nightingale, VON’s data reporting system, with the result that these data are available for only some of the analyses to follow. In the case of a third infant’s data, the birth weight variable had been omitted, therefore excluding this infant from all birth weight analyses.
Table 3.1 outlines the gestational age of infants reported in 2014: 41 infants were born <24 weeks gestation, 117 were between 24 and
26 weeks gestation, 240 between 27 and 29 weeks gestation, 161 between 30 and 32 weeks gestation, and 49 infants were >32 weeks gestation. With regards to birth weight, 26 infants weighed ≤501g, two of whom were ≤401g but ≥22 weeks gestation. A total of 86 infants had a birth weight in the 501-750g category, 116 in the 751-1000g category and 155 in the 1001-1250g category. Overall, 224 infants weighed more than 1250g, 16 of whom were ≥1500g but were ≤29 weeks gestation (Table 3.2).
A total of 60,909 VLBW infants were reported to the Network as a whole in 2014.
Overview
Gestational age All cases No. of cases excluding congenital anomalies< 24 weeks 41 4024-26 weeks 117 10827-29 weeks 240 22030-32 weeks 161 142> 32 weeks 49 42Total 608 552
Birth weight (g) All cases No. of cases excluding congenital anomalies< 501 26 25501 – 750 86 82751 – 1000 116 1011001 – 1250 155 140> 1250 224 203Total 607 551
Table 3.1: Number of cases reported to VON in 2014, according to gestational age
Table 3.2: Number of cases reported to VON in 2014, according to birth weight
One infant is excluded, as birth weight was unavailable
15
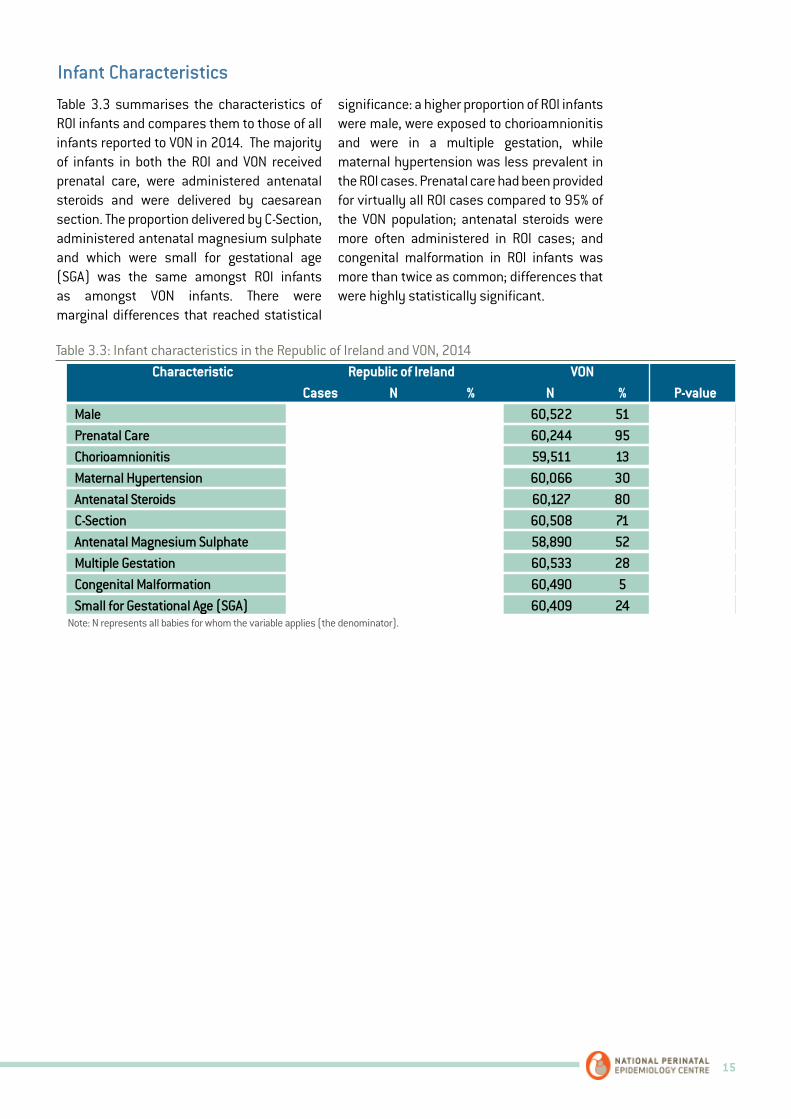
Table 3.3 summarises the characteristics of ROI infants and compares them to those of all infants reported to VON in 2014. The majority of infants in both the ROI and VON received prenatal care, were administered antenatal steroids and were delivered by caesarean section. The proportion delivered by C-Section, administered antenatal magnesium sulphate and which were small for gestational age (SGA) was the same amongst ROI infants as amongst VON infants. There were marginal differences that reached statistical
significance: a higher proportion of ROI infants were male, were exposed to chorioamnionitis and were in a multiple gestation, while maternal hypertension was less prevalent in the ROI cases. Prenatal care had been provided for virtually all ROI cases compared to 95% of the VON population; antenatal steroids were more often administered in ROI cases; and congenital malformation in ROI infants was more than twice as common; differences that were highly statistically significant.
Infant Characteristics
Table 3.3: Infant characteristics in the Republic of Ireland and VON, 2014 Characteristic Republic of Ireland VON Cases N % N % P-value
Male 335 607 55 60,522 51 0.040Prenatal Care 590 598 99 60,244 95 <0.001Chorioamnionitis 96 591 16 59,511 13 0.020Maternal Hypertension 152 599 25 60,066 30 0.014Antenatal Steroids 516 596 87 60,127 80 <0.001C-Section 418 605 70 60,508 71 0.303Antenatal Magnesium Sulphate 304 593 51 58,890 52 0.720Multiple Gestation 199 606 33 60,533 28 0.008Congenital Malformation 54 605 9 60,490 5 <0.001Small for Gestational Age (SGA) 152 607 25 60,409 24 0.551
Note: N represents all babies for whom the variable applies (the denominator).
16 VERY LOW BIRTH WEIGHT INFANTS IN THE REPUBLIC OF IRELAND ANNUAL REPORT 2014
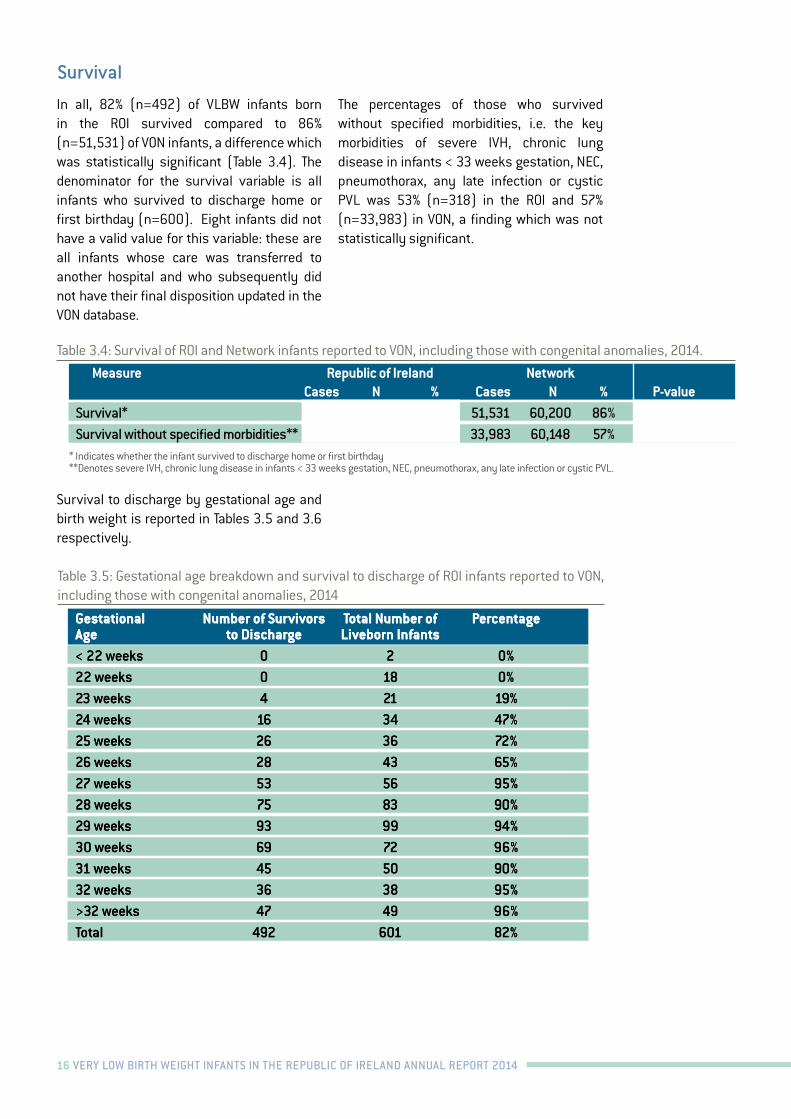
In all, 82% (n=492) of VLBW infants born in the ROI survived compared to 86% (n=51,531) of VON infants, a difference which was statistically significant (Table 3.4). The denominator for the survival variable is all infants who survived to discharge home or first birthday (n=600). Eight infants did not have a valid value for this variable: these are all infants whose care was transferred to another hospital and who subsequently did not have their final disposition updated in the VON database.
The percentages of those who survived without specified morbidities, i.e. the key morbidities of severe IVH, chronic lung disease in infants < 33 weeks gestation, NEC, pneumothorax, any late infection or cystic PVL was 53% (n=318) in the ROI and 57% (n=33,983) in VON, a finding which was not statistically significant.
Survival to discharge by gestational age and birth weight is reported in Tables 3.5 and 3.6 respectively.
Survival
Table 3.4: Survival of ROI and Network infants reported to VON, including those with congenital anomalies, 2014.
Measure Republic of Ireland Network Cases N % Cases N % P-value
Survival* 492 600 82% 51,531 60,200 86% 0.01Survival without specified morbidities** 318 600 53% 33,983 60,148 57% 0.08
* Indicates whether the infant survived to discharge home or first birthday**Denotes severe IVH, chronic lung disease in infants < 33 weeks gestation, NEC, pneumothorax, any late infection or cystic PVL.
Table 3.5: Gestational age breakdown and survival to discharge of ROI infants reported to VON, including those with congenital anomalies, 2014
Gestational Number of Survivors Total Number of PercentageAge to Discharge Liveborn Infants< 22 weeks 0 2 0%22 weeks 0 18 0%23 weeks 4 21 19%24 weeks 16 34 47%25 weeks 26 36 72%26 weeks 28 43 65%27 weeks 53 56 95%28 weeks 75 83 90%29 weeks 93 99 94%30 weeks 69 72 96%31 weeks 45 50 90%32 weeks 36 38 95%>32 weeks 47 49 96%Total 492 601 82%
Gestational Number of Survivors Total Number of PercentageAge to Discharge Liveborn Infants< 22 weeks 0 2 0%22 weeks 0 18 0%23 weeks 4 21 19%24 weeks 16 34 47%25 weeks 26 36 72%26 weeks 28 43 65%27 weeks 53 56 95%28 weeks 75 83 90%29 weeks 93 99 94%30 weeks 69 72 96%31 weeks 45 50 90%32 weeks 36 38 95%>32 weeks 47 49 96%Total 492 601 82%
17
VON reports on a number of Key Performance Indicators (KPIs). This allows the ROI to compare its outcomes to VON as a whole. It is important for benchmarking performance in the ROI in addition to identifying areas of strengths and areas where continuous improvements could/should be made.
The KPIs are listed below and relevant definitions are outlined above in the Definitions and Terminology section:1. Mortality2. Mortality Excluding Early Deaths 3. Death or Morbidity 4. CLD5. CLD <33 weeks gestation6. Pneumothorax7. Late Bacterial Infection8. Coagulase Negative Infection9. Nosocomial Infection10. Fungal Infection11. Any Late Infection 12. Any IVH13. Severe IVH14. ROP15. Severe ROP16. Cystic PVL17. Necrotising Enterocolitis18. Extreme Length of Stay (survivors only)
For each KPI, the number and percentage of ROI infants that experienced the outcome in 2014 is reported and illustrated in the following charts alongside the equivalent figures for all infants recorded in the VON database. The reporting of the KPIs in numbers and percentages for ROI and VON infants is provided for descriptive purposes. Observed differences in KPIs may be related to the medical care provided but may also be due to differences between the ROI and VON infant populations. Robust comparison of KPIs between the ROI and VON requires that pertinent differences between the infant populations are taken into account. This is done through the calculation of standardised mortality/morbidity ratios (SMRs).
Key Performance Indicators
Table 3.6: Birth weight and survival to discharge of ROI infants reported to VON, including those with congenital anomalies, 2014 (N=600).
Birth Weight Number of Survivors Total Number of Percentage to Discharge Liveborn Infants<501g 2 26 8%501-600g 8 31 26%601-700g 24 36 67%701-800g 25 35 71%801-900g 29 37 78%901-1000g 51 58 88%1001-1100g 46 53 87%1101-1200g 59 63 94%1201-1300g 82 86 95%1301-1400g 69 73 94%>1400g 97 102 95%Total 492 600 82%
Birth Weight Number of Survivors Total Number of Percentage to Discharge Liveborn Infants<501g 2 26 8%501-600g 8 31 26%601-700g 24 36 67%701-800g 25 35 71%801-900g 29 37 78%901-1000g 51 58 88%1001-1100g 46 53 87%1101-1200g 59 63 94%1201-1300g 82 86 95%1301-1400g 69 73 94%>1400g 97 102 95%Total 492 600 82%
18 VERY LOW BIRTH WEIGHT INFANTS IN THE REPUBLIC OF IRELAND ANNUAL REPORT 2014
Based on all VON data for infants with birth weights 501-1500g, our VON colleagues use multivariable logistic regression models for each KPI to quantify the risk of the outcome associated with each of the following infant characteristics: gestational age, SGA, multiple gestation, Apgar score at 1 min, gender, vaginal birth, location (inborn or outborn) and birth defect severity. Coefficients from these regression models were provided to the NPEC for use in the calculation of SMRs for each KPI.
SMRs were calculated for ROI babies with birth weights 501-1500g and with complete data for the KPI in question and the infant characteristics used in the regression models.For each KPI, the coefficients were applied to the data of these eligible ROI infants to estimate the risk of the outcome for each infant. Summing these individual risk estimates gives the total number of infants that would be expected to experience the outcome, i.e. the expected number taking into account the risk profile of the ROI infants.
To obtain the SMR for each KPI, the number of eligible ROI infants that actually experienced the outcome, i.e. the observed number of cases, was divided by the expected number of cases (SMR = Observed/Expected).
SMR values equal or close to one indicate that there is little or no difference between the observed and expected number of infants that experienced the outcome, i.e. the number observed was to be expected given the risk
profile of the ROI infant population. SMRs greater than one indicate that more infants experienced the outcome than expected given the risk profile of the ROI infants. SMRs less than one indicate that fewer cases were observed among ROI infants than expected.
A 95% confidence interval was calculated for each SMR in order to facilitate making inferences about whether the SMRs reported indicated if the difference between observed and expected was statistically significant. If the 95% confidence interval did not include the value one, it may be inferred that the difference between the numbers of observed and expected cases was statistically significant, i.e. there were more or fewer cases among the ROI infants than expected given their risk profile.
For each KPI, the absolute difference between the observed and expected number of cases is reported and the 95% confidence interval for this difference is also reported in order to provide statements in terms of the actual number of infants affected.
Table 3.7 displays Standardised Mortality/Morbidity Ratios (SMR = Observed/Expected), the lower and upper bounds of its 95% confidence interval, the difference between the Observed and Expected number of cases and the lower and upper bound of the 95% confidence interval for this difference.
Standard Mortality/Morbidity Ratios (SMRs)

19
Table 3.7: Risk Adjusted Standardised Mortality/Morbidity Ratios for Key Performance Indicators, Republic of Ireland, 2014
Outcome O E SMR (95% CI) O-E (95% CI) Mortality 86 68 1.27 (1.03, 1.51) 18 (2, 35)Mortality excluding early death 50 41 1.23 (0.92, 1.54) 9 (-3, 22)Death or Morbidity 260 228 1.14 (1.01, 1.27) 32 (3, 62)Chronic Lung Disease* 104 96 1.08 (0.88, 1.28) 8 (-12, 27)Pneumothorax 35 21 1.67 (1.25, 2.10) 14 (5, 23)Late Bacterial Infection 34 49 0.69 (0.41, 0.97) -15 (-29, -1)Coagulase Negative Infection 46 25 1.84 (1.45, 2.23) 21 (11, 31)Nosocomial Infection 71 55 1.30 (1.04, 1.57) 16 (2, 31)Fungal Infection 2 4 0.55 (-0.48, 1.57) -2 (-5, 2)Any Late Infection 71 56 1.26 (1.00, 1.52) 15 (0, 29)Intraventricular Haemorrhage 113 106 1.07 (0.88, 1.26) 7 (-13, 27)Severe Intraventricular Haemorrhage 35 29 1.22 (0.85, 1.58) 6 (-4, 17)Retinopathy of Prematurity 57 112 0.51 (0.33, 0.70) -55 (-75, -34)Severe Retinopathy of Prematurity 15 18 0.83 (0.37, 1.29) -3 (-11, 5)Cystic Periventricular Leukomalacia 3 13 0.24 (-0.31, 0.79) -10 (-17, -3)Necrotising Enterocolitis 33 27 1.21 (0.84, 1.59) 6 (-4, 16)
O is the number of observed cases with the outcome and E is the expected number with the outcome of ROI infants with birth weights 501-1500g. 95% confidence intervals (CIs) are provided for the SMR and the difference in observed and expected cases.*The SMR for chronic lung disease (CLD) is provided: the SMR for CLD < 33 weeks is not provided.
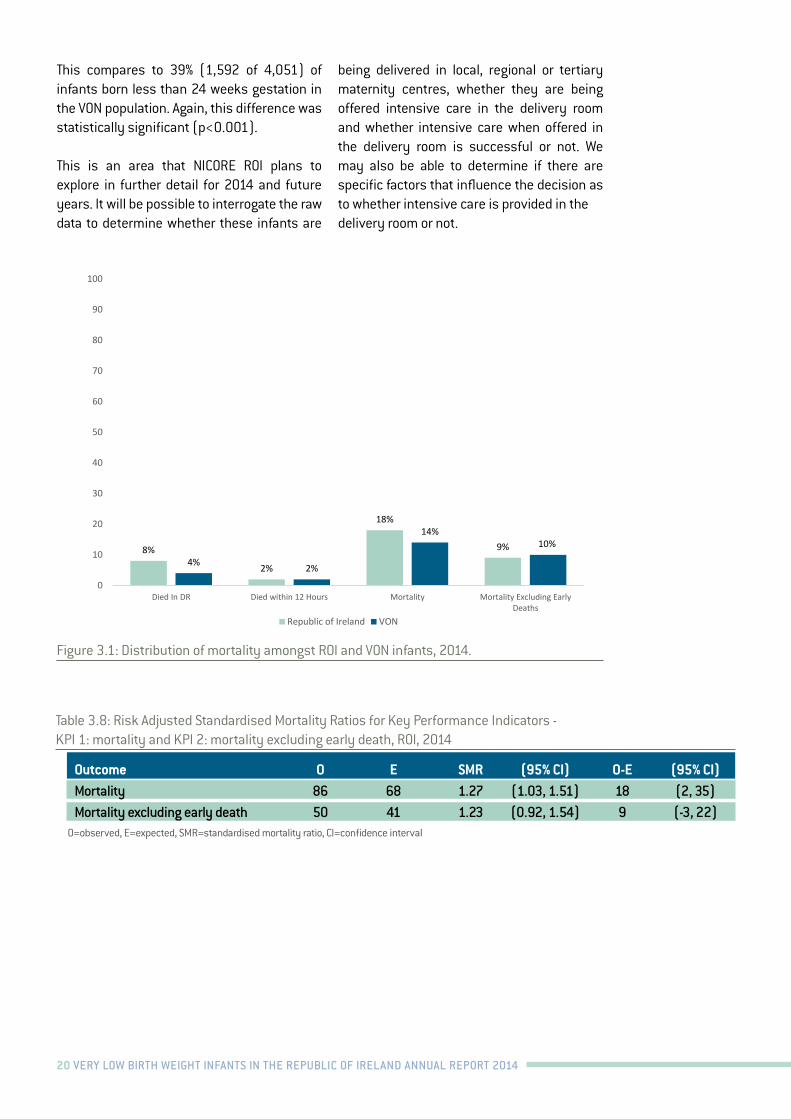
In 2014, 18% of VLBW babies in the ROI infants died (n=109). This compares to 14% for all infants recorded in the VON database (n=8,649). Half of the ROI infants who died did so within the first 12 hours of life. After excluding such early deaths, the percentage who died was 9% for ROI infants (n=50) and 10% (n=5,653) for VON infants (Figure 3.1).
There were 86 deaths observed amongst ROI infants with birth weights 501-1500g whereas the expected number based on the risk profile of the infants in the Irish population was 68 (Table 3.8). The SMR was 1.27 (95% CI: 1.03, 1.51), indicating that the number of observed cases was 1.27 times the expected number. In absolute numbers there were 18 more deaths than expected. This was a statistically significant excess in mortality (95% CI: 2, 35).
Excluding early deaths, there were 50 observed deaths compared to an expected
number of 41 (Table 3.8). Thus, the observed number equated to 1.23 times the expected number (SMR=1.23, 95% CI: 0.92, 1.54). In absolute numbers there were nine more cases of mortality excluding early death than expected but this difference was not statistically significant (95% CI:-3, 22).
A higher proportion of ROI infants died in the delivery room (8%, n=50) compared to VON (4%, n=2,193) (p<0.001). Seven of the 50 (14%) ROI infants who died in the delivery room had a major congenital malformation and a further 36 were born at less than 24 weeks gestation. In total, 43 of 50 infants who died in the delivery room in the ROI either had a major congenital malformation or were less than 24 weeks gestation.
Overall, there were 41 infants born less than 24 weeks gestation in the ROI, the majority of whom died in the delivery room (n=36, 88%).
KPI 1: Mortality and KPI 2: Mortality Excluding Early Death
20 VERY LOW BIRTH WEIGHT INFANTS IN THE REPUBLIC OF IRELAND ANNUAL REPORT 2014
23
Figure 3.1: Distribution of mortality amongst ROI and VON infants, 2014.
Table 3.8: Risk Adjusted Standardised Mortality Ratios for Key Performance Indicators - KPI 1: mortality and KPI 2: mortality excluding early death, ROI, 2014
Outcome O E SMR (95% CI) O-E (95% CI)
Mortality 86 68 1.27 (1.03, 1.51) 18 (2, 35)
Mortality excluding early death
50 41 1.23 (0.92, 1.54) 9 (-3, 22)
O=observed, E=expected, SMR=standardised mortality ratio, CI=confidence interval
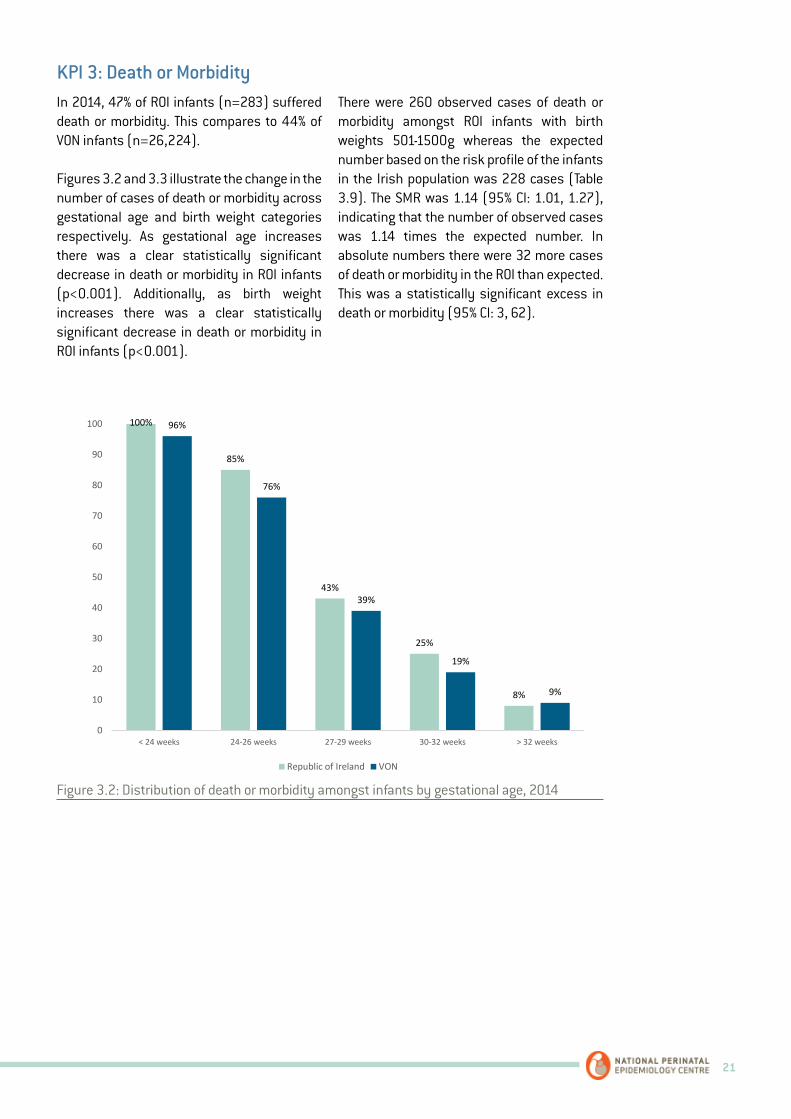
KPI 3: Death or Morbidity In 2014, 47% of ROI infants (n=283) suffered death or morbidity. This compares to 44% of VON infants (n=26,224).
Figures 3.2 and 3.3 illustrate the change in the number of cases of death or morbidity across gestational age and birth weight categories respectively. As gestational age increases there was a clear statistically significant decrease in death or morbidity in ROI infants (p<0.001). Additionally, as birth weight increases there was a clear statistically significant decrease in death or morbidity in ROI infants (p<0.001).
8%
2%
18%
9%4% 2%
14%10%
0
10
20
30
40
50
60
70
80
90
100
Died In DR Died within 12 Hours Mortality Mortality Excluding EarlyDeaths
Republic of Ireland VON
This compares to 39% (1,592 of 4,051) of infants born less than 24 weeks gestation in the VON population. Again, this difference was statistically significant (p<0.001).
This is an area that NICORE ROI plans to explore in further detail for 2014 and future years. It will be possible to interrogate the raw data to determine whether these infants are
being delivered in local, regional or tertiary maternity centres, whether they are being offered intensive care in the delivery room and whether intensive care when offered in the delivery room is successful or not. We may also be able to determine if there are specific factors that influence the decision as to whether intensive care is provided in the delivery room or not.
Figure 3.1: Distribution of mortality amongst ROI and VON infants, 2014.
Table 3.8: Risk Adjusted Standardised Mortality Ratios for Key Performance Indicators - KPI 1: mortality and KPI 2: mortality excluding early death, ROI, 2014
Outcome O E SMR (95% CI) O-E (95% CI) Mortality 86 68 1.27 (1.03, 1.51) 18 (2, 35)Mortality excluding early death 50 41 1.23 (0.92, 1.54) 9 (-3, 22)
O=observed, E=expected, SMR=standardised mortality ratio, CI=confidence interval
21
In 2014, 47% of ROI infants (n=283) suffered death or morbidity. This compares to 44% of VON infants (n=26,224).
Figures 3.2 and 3.3 illustrate the change in the number of cases of death or morbidity across gestational age and birth weight categories respectively. As gestational age increases there was a clear statistically significant decrease in death or morbidity in ROI infants (p<0.001). Additionally, as birth weight increases there was a clear statistically significant decrease in death or morbidity in ROI infants (p<0.001).
There were 260 observed cases of death or morbidity amongst ROI infants with birth weights 501-1500g whereas the expected number based on the risk profile of the infants in the Irish population was 228 cases (Table 3.9). The SMR was 1.14 (95% CI: 1.01, 1.27), indicating that the number of observed cases was 1.14 times the expected number. In absolute numbers there were 32 more cases of death or morbidity in the ROI than expected. This was a statistically significant excess in death or morbidity (95% CI: 3, 62).
KPI 3: Death or Morbidity
24
There were 260 observed cases of death or morbidity amongst ROI infants with birth weights 501-1500g whereas the expected number based on the risk profile of the infants in the Irish population was 228 cases (Table 3.9). The SMR was 1.14 (95% CI: 1.01, 1.27), indicating that the number of observed cases was 1.14 times the expected number. In absolute numbers there were 32 more cases of death or morbidity in the ROI than expected. This was a statistically significant excess in death or morbidity (95% CI: 3, 62).
Figure 3.2: Distribution of death or morbidity amongst infants by gestational age, 2014
100%
85%
43%
25%
8%
96%
76%
39%
19%
9%
0
10
20
30
40
50
60
70
80
90
100
< 24 weeks 24-26 weeks 27-29 weeks 30-32 weeks > 32 weeks
Republic of Ireland VON
Figure 3.2: Distribution of death or morbidity amongst infants by gestational age, 2014

22 VERY LOW BIRTH WEIGHT INFANTS IN THE REPUBLIC OF IRELAND ANNUAL REPORT 2014
25
Figure 3.3: Distribution of death or morbidity amongst infants by birth weight, 2014
Table 3.9: Risk Adjusted Standardised Mortality Ratios for Key Performance Indicators - KPI 3: death or morbidity, ROI, 2014
Outcome O E SMR (95% CI) O-E (95% CI)
Death or Morbidity 260 228 1.14 (1.01, 1.27) 32 (3, 62)
O=observed, E=expected, SMR=standardised mortality ratio, CI=confidence interval
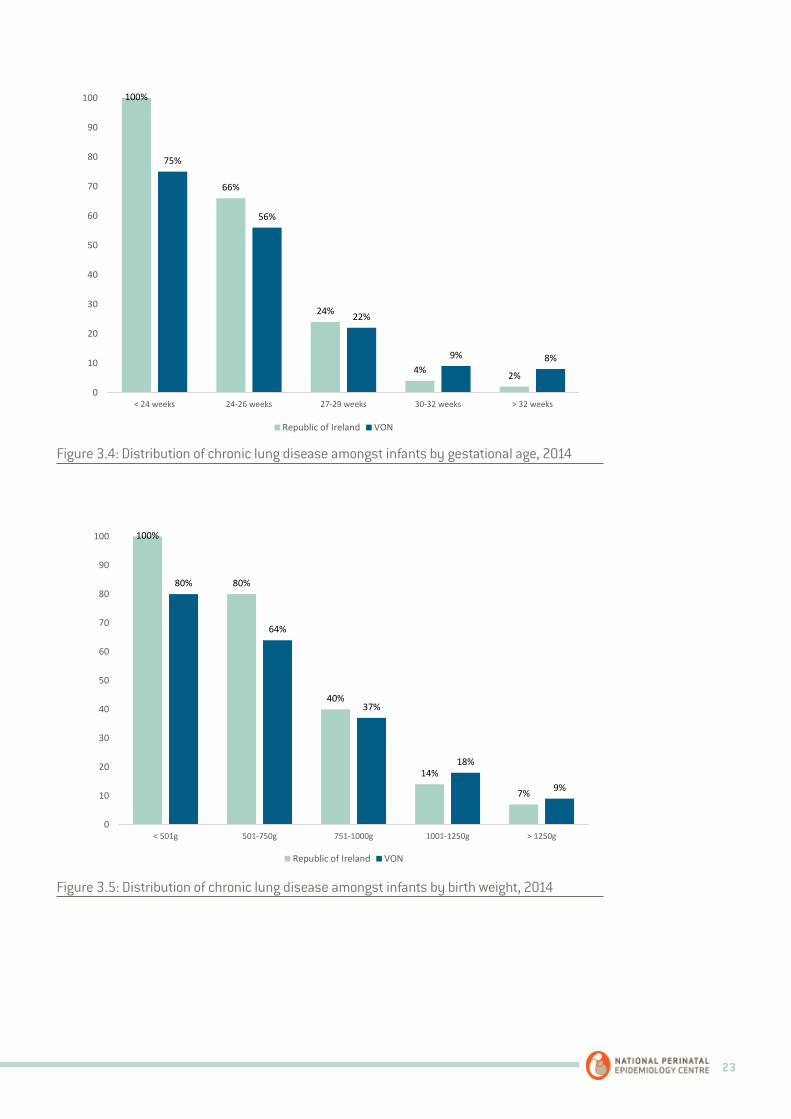
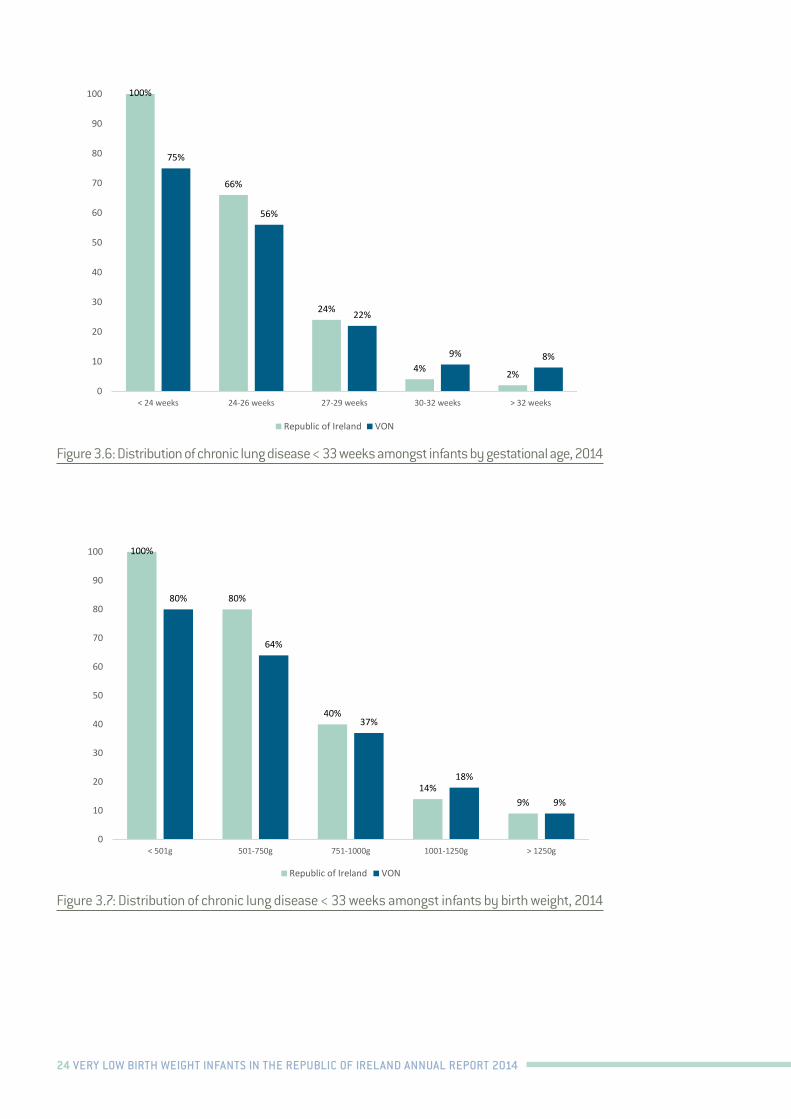
KPI 4: CLD and KPI 5: CLD < 33 weeks In 2014, 22% of ROI infants (n=108) were classified as having CLD. This compares to 25% of VON infants (n=12,836). The proportion of CLD in infants <33 gestational weeks was 24% (n=107) in ROI infants and 27% (n=12,532) in VON infants.
Figures 3.4 and 3.5 illustrate the change in CLD cases across all gestational age and birth weight categories respectively. As gestational age increases there was a significant decrease in CLD cases in ROI infants (p<0.001). Likewise, as birth weight increases there was a significant decrease in CLD cases in ROI infants (p<0.001).
There were 104 observed cases of CLD amongst ROI infants with birth weights 501-1500g whereas the expected number based on the risk profile of the infants in the Irish population
100% 95%
63%
35%
23%
96%
83%
56%
32%
18%
0
10
20
30
40
50
60
70
80
90
100
< 501g 501-750g 751-1000g 1001-1250g > 1250g
Republic of Ireland VON
Figure 3.3: Distribution of death or morbidity amongst infants by birth weight, 2014
Table 3.9: Risk Adjusted Standardised Mortality Ratios for Key Performance Indicators - KPI 3: death or morbidity, ROI, 2014
Outcome O E SMR (95% CI) O-E (95% CI) Death or Morbidity 260 228 1.14 (1.01, 1.27) 32 (3, 62)
O=observed, E=expected, SMR=standardised mortality ratio, CI=confidence interval
In 2014, 22% of ROI infants (n=108) were classified as having CLD. This compares to 25% of VON infants (n=12,836). The proportion of CLD in infants <33 gestational weeks was 24% (n=107) in ROI infants and 27% (n=12,532) in VON infants.
Figures 3.4 and 3.5 illustrate the change in CLD cases across all gestational age and birth weight categories respectively. As gestational age increases there was a significant decrease in CLD cases in ROI infants (p<0.001). Likewise, as birth weight increases there was a significant decrease in CLD cases in ROI infants (p<0.001).
There were 104 observed cases of CLD amongst ROI infants with birth weights 501-1500g whereas the expected number based on the risk profile of the infants in the Irish population was 96 (Table 3.10). The SMR was 1.08 (95% CI: 0.88, 1.28), indicating that the number of observed cases was 1.08 times the expected number. In absolute numbers there were eight more cases of CLD than expected which was not statistically significant (95% CI:-12, 27).
SMR data for CLD < 33 weeks are not available.
KPI 4: CLD and KPI 5: CLD < 33 weeks
23
26
was 96 (Table 3.10). The SMR was 1.08 (95% CI: 0.88, 1.28), indicating that the number of observed cases was 1.08 times the expected number. In absolute numbers there were eight more cases of CLD than expected which was not statistically significant (95% CI:-12, 27).
SMR data for CLD < 33 weeks are not available.
Figure 3.4: Distribution of chronic lung disease amongst infants by gestational age, 2014
100%
66%
24%
4% 2%
75%
56%
22%
9% 8%
0
10
20
30
40
50
60
70
80
90
100
< 24 weeks 24-26 weeks 27-29 weeks 30-32 weeks > 32 weeks
Republic of Ireland VON
27
Figure 3.5: Distribution of chronic lung disease amongst infants by birth weight, 2014
Figure 3.6: Distribution of chronic lung disease < 33 weeks amongst infants by gestational age, 2014
100%
80%
40%
14%
7%
80%
64%
37%
18%
9%
0
10
20
30
40
50
60
70
80
90
100
< 501g 501-750g 751-1000g 1001-1250g > 1250g
Republic of Ireland VON
100%
66%
24%
4% 2%
75%
56%
22%
9% 8%
0
10
20
30
40
50
60
70
80
90
100
< 24 weeks 24-26 weeks 27-29 weeks 30-32 weeks > 32 weeks
Republic of Ireland VON
Figure 3.4: Distribution of chronic lung disease amongst infants by gestational age, 2014
Figure 3.5: Distribution of chronic lung disease amongst infants by birth weight, 2014
24 VERY LOW BIRTH WEIGHT INFANTS IN THE REPUBLIC OF IRELAND ANNUAL REPORT 2014
27
Figure 3.5: Distribution of chronic lung disease amongst infants by birth weight, 2014
Figure 3.6: Distribution of chronic lung disease < 33 weeks amongst infants by gestational age, 2014
100%
80%
40%
14%
7%
80%
64%
37%
18%
9%
0
10
20
30
40
50
60
70
80
90
100
< 501g 501-750g 751-1000g 1001-1250g > 1250g
Republic of Ireland VON
100%
66%
24%
4% 2%
75%
56%
22%
9% 8%
0
10
20
30
40
50
60
70
80
90
100
< 24 weeks 24-26 weeks 27-29 weeks 30-32 weeks > 32 weeks
Republic of Ireland VON
28
Figure 3.7: Distribution of chronic lung disease < 33 weeks amongst infants by birth weight, 2014
Table 3.10: Risk Adjusted Standardised Morbidity Ratios for Key Performance Indicators - KPI 4: chronic lung disease, ROI, 2014
Outcome O E SMR (95% CI) O-E (95% CI)
Chronic Lung Disease 104 96 1.08 (0.88, 1.28) 8 (-12, 27)
O=observed, E=expected, SMR=standardised morbidity ratio, CI=confidence interval
KPI 6: Pneumothorax In 2014, 6% of ROI infants (n=34) were classified as having pneumothorax. This compares to 4% of VON infants (n=2,565).
Figures 3.8 and 3.9 outline the proportion of pneumothorax in ROI and VON infants according to gestational age and birth weight categories respectively. In ROI infants, increasing gestational age was associated with a slight decrease in pneumothorax but this decrease was not statistically significant (p=0.492). Similarly, increasing birth weight was associated with a slight decrease in pneumothorax but this decrease was also not statistically significant (p=0.910). It must be noted that overall the number of pneumothorax cases seen across the gestational age and birth weight categories in ROI infants are quite small.
100%
80%
40%
14%9%
80%
64%
37%
18%
9%
0
10
20
30
40
50
60
70
80
90
100
< 501g 501-750g 751-1000g 1001-1250g > 1250g
Republic of Ireland VON
Figure 3.6: Distribution of chronic lung disease < 33 weeks amongst infants by gestational age, 2014
Figure 3.7: Distribution of chronic lung disease < 33 weeks amongst infants by birth weight, 2014

25
In 2014, 6% of ROI infants (n=35) were classified as having pneumothorax. This compares to 4% of VON infants (n=2,565). Figures 3.8 and 3.9 outline the proportion of pneumothorax in ROI and VON infants according to gestational age and birth weight categories respectively. In ROI infants, increasing gestational age was associated with a slight decrease in pneumothorax but this decrease was not statistically significant (p=0.492). Similarly, increasing birth weight was associated with a slight decrease in pneumothorax but this decrease was also not statistically significant (p=0.910). It
must be noted that overall the number of pneumothorax cases seen across the gestational age and birth weight categories in ROI infants are quite small.
There were 35 observed cases of pneumothorax amongst ROI infants with birth weights 501-1500g whereas the expected number based on the risk profile of the infants in the Irish population was 21 (Table 3.11). The SMR was 1.67 (95% CI: 1.25, 2.1), indicating that the number of observed cases was 1.67 times the expected number. This was a statistically significant excess of 14 cases of pneumothorax (95% CI: 5, 23).
KPI 6: Pneumothorax
29
There were 35 observed cases of pneumothorax amongst ROI infants with birth weights 501-1500g whereas the expected number based on the risk profile of the infants in the Irish population was 21 (Table 3.11). The SMR was 1.67 (95% CI: 1.25, 2.1), indicating that the number of observed cases was 1.67 times the expected number. This was a statistically significant excess of 14 cases of pneumothorax (95% CI: 5, 23).
Figure 3.8: Distribution of pneumothorax amongst infants by gestational age, 2014
0
7% 8%4% 2%
13%8%
4% 2% 1%0
10
20
30
40
50
60
70
80
90
100
< 24 weeks 24-26 weeks 27-29 weeks 30-32 weeks > 32 weeks
Republic of Ireland VON
Figure 3.8: Distribution of pneumothorax amongst infants by gestational age, 2014
Table 3.10: Risk Adjusted Standardised Morbidity Ratios for Key Performance Indicators - KPI 4: chronic lung disease, ROI, 2014
Outcome O E SMR (95% CI) O-E (95% CI) Chronic Lung Disease 104 96 1.08 (0.88, 1.28) 8 (-12, 27)
O=observed, E=expected, SMR=standardised morbidity ratio, CI=confidence interval

26 VERY LOW BIRTH WEIGHT INFANTS IN THE REPUBLIC OF IRELAND ANNUAL REPORT 2014
30
Figure 3.9: Distribution of pneumothorax amongst infants by birth weight, 2014
Table 3.11: Risk Adjusted Standardised Morbidity Ratios for Key Performance Indicators - KPI 6: pneumothorax, ROI, 2014
Outcome O E SMR (95% CI) O-E (95% CI)
Pneumothorax 35 21 1.67 (1.25, 2.10) 14 (5, 23)
O=observed, E=expected, SMR=standardised morbidity ratio, CI=confidence interval
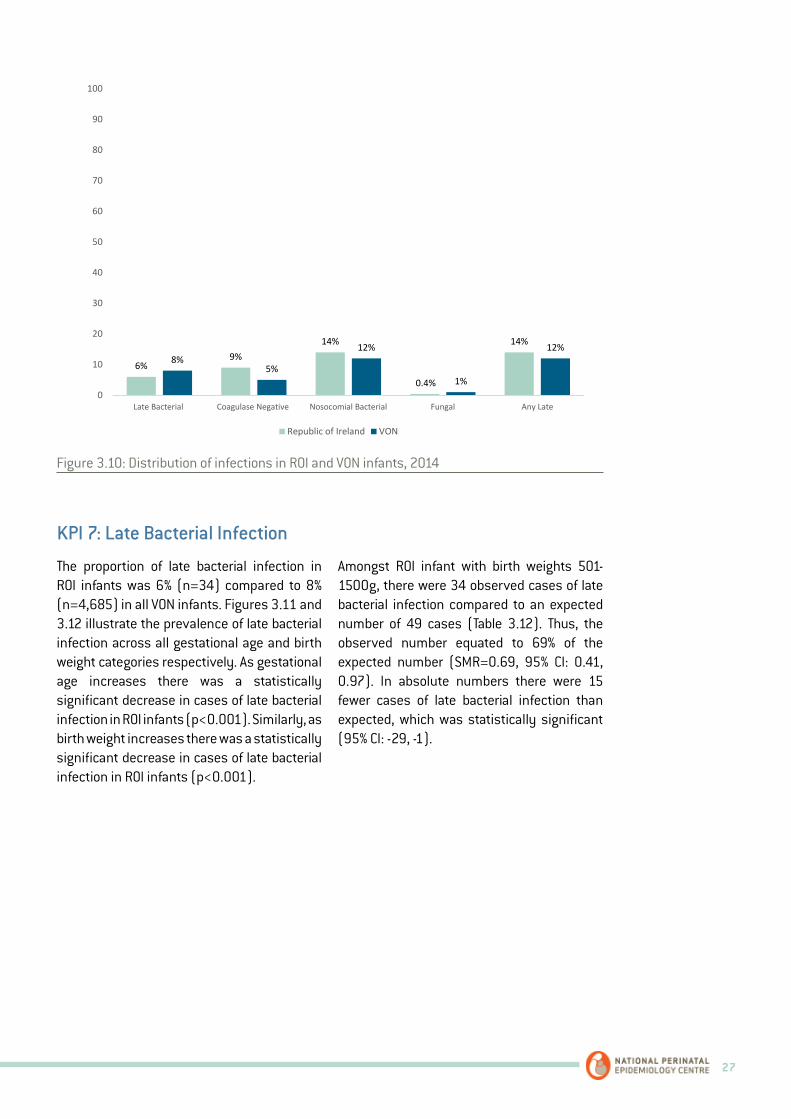
KPIs 7 – 11: Infections: late bacterial infection, coagulase negative infection, nosocomial infection, fungal infection and any late infection. Figure 3.10 compares the proportion of infections in ROI and VON infants. For ROI infants, percentages of late bacterial infection compared favourably to the VON as a whole, but ROI infants had higher percentages of coagulase negative infection. Due to the higher proportion of coagulase negative infection in ROI infants, the percentages of nosocomial infection and any late infection were also higher in ROI infants.
0
6% 7% 5% 6%9% 9%
5% 3% 3%
0
10
20
30
40
50
60
70
80
90
100
< 501g 501-750g 751-1000g 1001-1250g > 1250g
Republic of Ireland VON
Figure 3.9: Distribution of pneumothorax amongst infants by birth weight, 2014
Table 3.11: Risk Adjusted Standardised Morbidity Ratios for Key Performance Indicators - KPI 6: pneumothorax, ROI, 2014
Outcome O E SMR (95% CI) O-E (95% CI) Pneumothorax 35 21 1.67 (1.25, 2.10) 14 (5, 23)
O=observed, E=expected, SMR=standardised morbidity ratio, CI=confidence interval
Figure 3.10 compares the proportion of infections in ROI and VON infants. For ROI infants, percentages of late bacterial infection compared favourably to the VON as a whole, but ROI infants had higher percentages of
coagulase negative infection. Due to the higher proportion of coagulase negative infection in ROI infants, the percentages of nosocomial infection and any late infection were also higher in ROI infants.
KPIs 7 – 11: Infections: late bacterial infection, coagulase negative infection, nosocomial infection, fungal infection and any late infection.
27
31
Figure 3.10: Distribution of infections in ROI and VON infants, 2014
KPI 7: Late Bacterial Infection The proportion of late bacterial infection in ROI infants was 6% (n=34) compared to 8% (n=4,685) in all VON infants. Figures 3.11 and 3.12 illustrate the prevalence of late bacterial infection across all gestational age and birth weight categories respectively. As gestational age increases there was a statistically significant decrease in cases of late bacterial infection in ROI infants (p<0.001). Similarly, as birth weight increases there was a statistically significant decrease in cases of late bacterial infection in ROI infants (p<0.001).
Amongst ROI infant with birth weights 501-1500g, there were 34 observed cases of late bacterial infection compared to an expected number of 49 cases (Table 3.12). Thus, the observed number equated to 69% of the expected number (SMR=0.69, 95% CI: 0.41, 0.97). In absolute numbers there were 15 fewer cases of late bacterial infection than expected, which was statistically significant (95% CI: -29, -1).
6%9%
14%
0.4%
14%
8%5%
12%
1%
12%
0
10
20
30
40
50
60
70
80
90
100
Late Bacterial Coagulase Negative Nosocomial Bacterial Fungal Any Late
Republic of Ireland VON
Figure 3.10: Distribution of infections in ROI and VON infants, 2014
The proportion of late bacterial infection in ROI infants was 6% (n=34) compared to 8% (n=4,685) in all VON infants. Figures 3.11 and 3.12 illustrate the prevalence of late bacterial infection across all gestational age and birth weight categories respectively. As gestational age increases there was a statistically significant decrease in cases of late bacterial infection in ROI infants (p<0.001). Similarly, as birth weight increases there was a statistically significant decrease in cases of late bacterial infection in ROI infants (p<0.001).
Amongst ROI infant with birth weights 501-1500g, there were 34 observed cases of late bacterial infection compared to an expected number of 49 cases (Table 3.12). Thus, the observed number equated to 69% of the expected number (SMR=0.69, 95% CI: 0.41, 0.97). In absolute numbers there were 15 fewer cases of late bacterial infection than expected, which was statistically significant (95% CI: -29, -1).
KPI 7: Late Bacterial Infection

28 VERY LOW BIRTH WEIGHT INFANTS IN THE REPUBLIC OF IRELAND ANNUAL REPORT 2014
32
Figure 3.11: Distribution of late bacterial infection amongst infants by gestational age, 2014
Figure 3.12: Distribution of late bacterial infection amongst infants by birth weight, 2014
40%
16%
4% 3% 4%
25%
17%
7%3% 2%
0
10
20
30
40
50
60
70
80
90
100
< 24 weeks 24-26 weeks 27-29 weeks 30-32 weeks > 32 weeks
Republic of Ireland VON
0
27%
6% 6%2%
19% 20%
11%6%
3%
0
10
20
30
40
50
60
70
80
90
100
< 501g 501-750g 751-1000g 1001-1250g > 1250g
Republic of Ireland VON
Figure 3.11: Distribution of late bacterial infection amongst infants by gestational age, 2014
Figure 3.12: Distribution of late bacterial infection amongst infants by birth weight, 2014
29
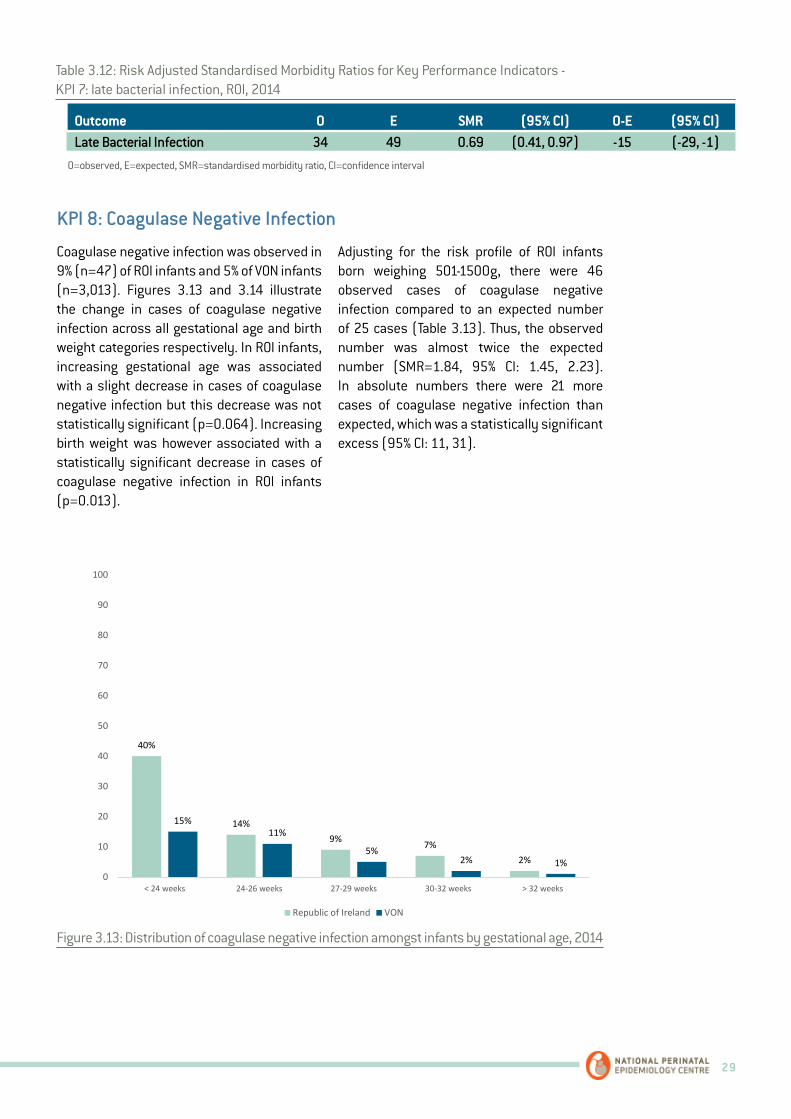
Coagulase negative infection was observed in 9% (n=47) of ROI infants and 5% of VON infants (n=3,013). Figures 3.13 and 3.14 illustrate the change in cases of coagulase negative infection across all gestational age and birth weight categories respectively. In ROI infants, increasing gestational age was associated with a slight decrease in cases of coagulase negative infection but this decrease was not statistically significant (p=0.064). Increasing birth weight was however associated with a statistically significant decrease in cases of coagulase negative infection in ROI infants (p=0.013).
Adjusting for the risk profile of ROI infants born weighing 501-1500g, there were 46 observed cases of coagulase negative infection compared to an expected number of 25 cases (Table 3.13). Thus, the observed number was almost twice the expected number (SMR=1.84, 95% CI: 1.45, 2.23). In absolute numbers there were 21 more cases of coagulase negative infection than expected, which was a statistically significant excess (95% CI: 11, 31).
KPI 8: Coagulase Negative Infection
34
Figure 3.13: Distribution of coagulase negative infection amongst infants by gestational age, 2014
Figure 3.14: Distribution of coagulase negative infection amongst infants by birth weight, 2014
40%
14%9% 7%
2%
15%11%
5%2% 1%
0
10
20
30
40
50
60
70
80
90
100
< 24 weeks 24-26 weeks 27-29 weeks 30-32 weeks > 32 weeks
Republic of Ireland VON
0
15% 13%10%
5%
13% 12%8%
4% 2%
0
10
20
30
40
50
60
70
80
90
100
< 501g 501-750g 751-1000g 1001-1250g > 1250g
Republic of Ireland VON
Figure 3.13: Distribution of coagulase negative infection amongst infants by gestational age, 2014
Table 3.12: Risk Adjusted Standardised Morbidity Ratios for Key Performance Indicators - KPI 7: late bacterial infection, ROI, 2014
Outcome O E SMR (95% CI) O-E (95% CI) Late Bacterial Infection 34 49 0.69 (0.41, 0.97) -15 (-29, -1)
O=observed, E=expected, SMR=standardised morbidity ratio, CI=confidence interval

30 VERY LOW BIRTH WEIGHT INFANTS IN THE REPUBLIC OF IRELAND ANNUAL REPORT 2014
34
Figure 3.13: Distribution of coagulase negative infection amongst infants by gestational age, 2014
Figure 3.14: Distribution of coagulase negative infection amongst infants by birth weight, 2014
40%
14%9% 7%
2%
15%11%
5%2% 1%
0
10
20
30
40
50
60
70
80
90
100
< 24 weeks 24-26 weeks 27-29 weeks 30-32 weeks > 32 weeks
Republic of Ireland VON
0
15% 13%10%
5%
13% 12%8%
4% 2%
0
10
20
30
40
50
60
70
80
90
100
< 501g 501-750g 751-1000g 1001-1250g > 1250g
Republic of Ireland VON
Figure 3.14: Distribution of coagulase negative infection amongst infants by birth weight, 2014
Table 3.13: Risk Adjusted Standardised Morbidity Ratios for Key Performance Indicators - KPI 8: coagulase negative infection, ROI, 2014
Outcome O E SMR (95% CI) O-E (95% CI) Coagulase Negative Infection 46 25 1.84 (1.45, 2.23) 21 (11, 31)
O=observed, E=expected, SMR=standardised morbidity ratio, CI=confidence interval
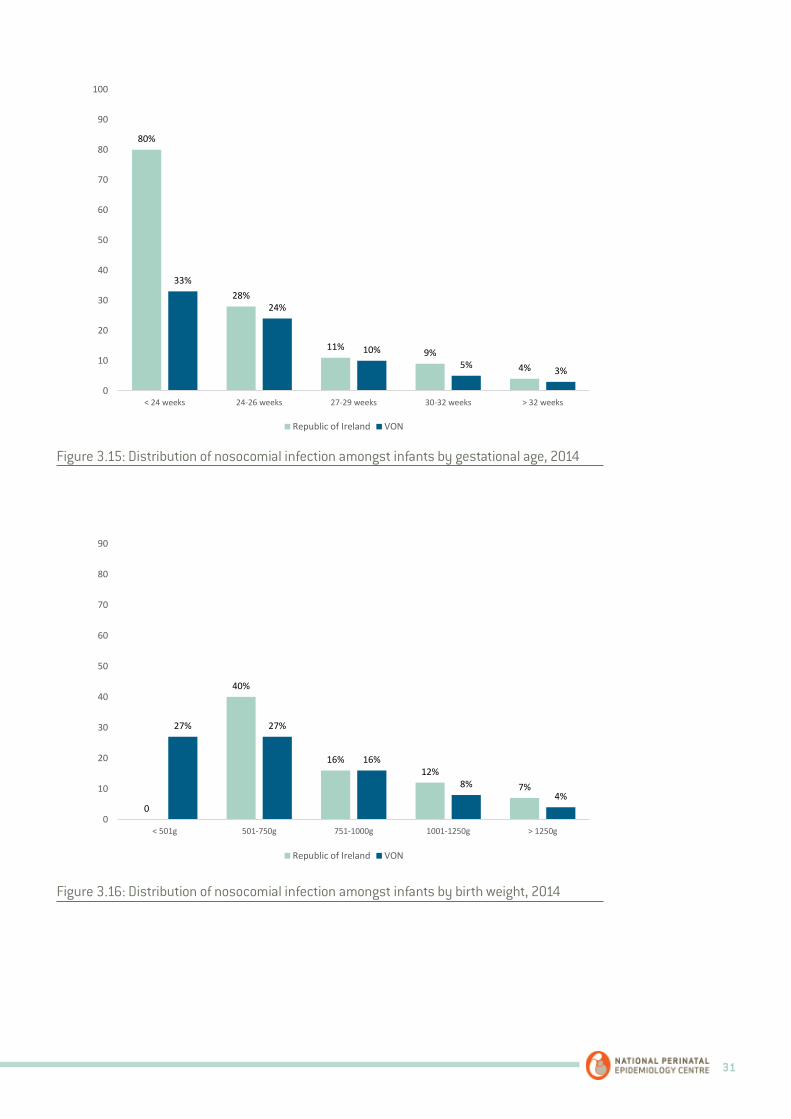
Nosocomial infection was reported in 14% (n=72) of the ROI infant population and 12% (n=6,636) of the VON population. Figures 3.15 and 3.16 illustrate the change in cases of nosocomial infection across all gestational age and birth weight categories respectively. As gestational age increases there was a statistically significant decrease in cases of nosocomial infection in ROI infants (p<0.001). Likewise, as birth weight increases there was a statistically significant decrease in cases of nosocomial infection in ROI infants (p<0.001).
There were 71 observed cases of nosocomial infection amongst ROI infants with birth weights 501-1500g whereas the expected number based on the risk profile of the infants was 55 cases (Table 3.14). Thus, there were 30% more cases observed than expected (SMR=1.30, 95% CI: 1.04, 1.57). In absolute numbers this equated to an excess of 16 cases, a statistically significant difference (95% CI: 2, 31).
KPI 9: Nosocomial Infection
31
36
Figure 3.15: Distribution of nosocomial infection amongst infants by gestational age, 2014
Figure 3.16: Distribution of nosocomial infection amongst infants by birth weight, 2014
80%
28%
11% 9%4%
33%
24%
10%5% 3%
0
10
20
30
40
50
60
70
80
90
100
< 24 weeks 24-26 weeks 27-29 weeks 30-32 weeks > 32 weeks
Republic of Ireland VON
0
40%
16%12%
7%
27% 27%
16%
8%4%
0
10
20
30
40
50
60
70
80
90
100
< 501g 501-750g 751-1000g 1001-1250g > 1250g
Republic of Ireland VON
Figure 3.15: Distribution of nosocomial infection amongst infants by gestational age, 2014
Figure 3.16: Distribution of nosocomial infection amongst infants by birth weight, 2014
32 VERY LOW BIRTH WEIGHT INFANTS IN THE REPUBLIC OF IRELAND ANNUAL REPORT 2014
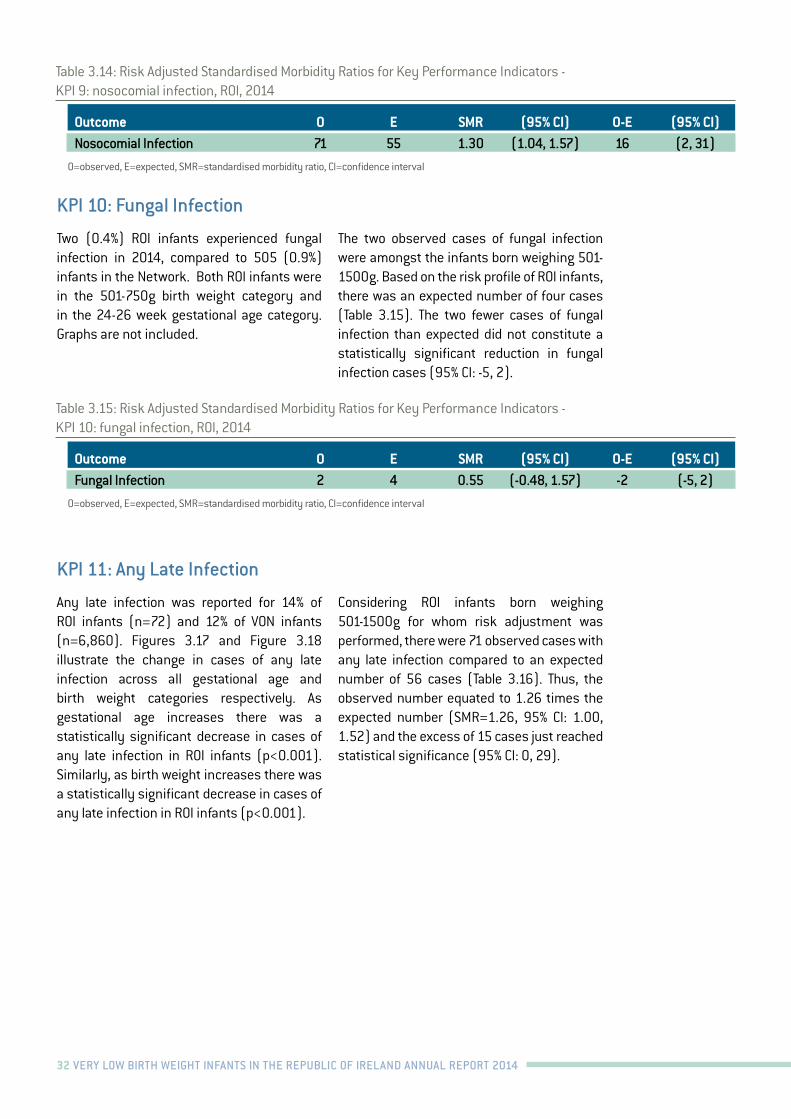
Two (0.4%) ROI infants experienced fungal infection in 2014, compared to 505 (0.9%) infants in the Network. Both ROI infants were in the 501-750g birth weight category and in the 24-26 week gestational age category. Graphs are not included.
The two observed cases of fungal infection were amongst the infants born weighing 501-1500g. Based on the risk profile of ROI infants, there was an expected number of four cases (Table 3.15). The two fewer cases of fungal infection than expected did not constitute a statistically significant reduction in fungal infection cases (95% CI: -5, 2).
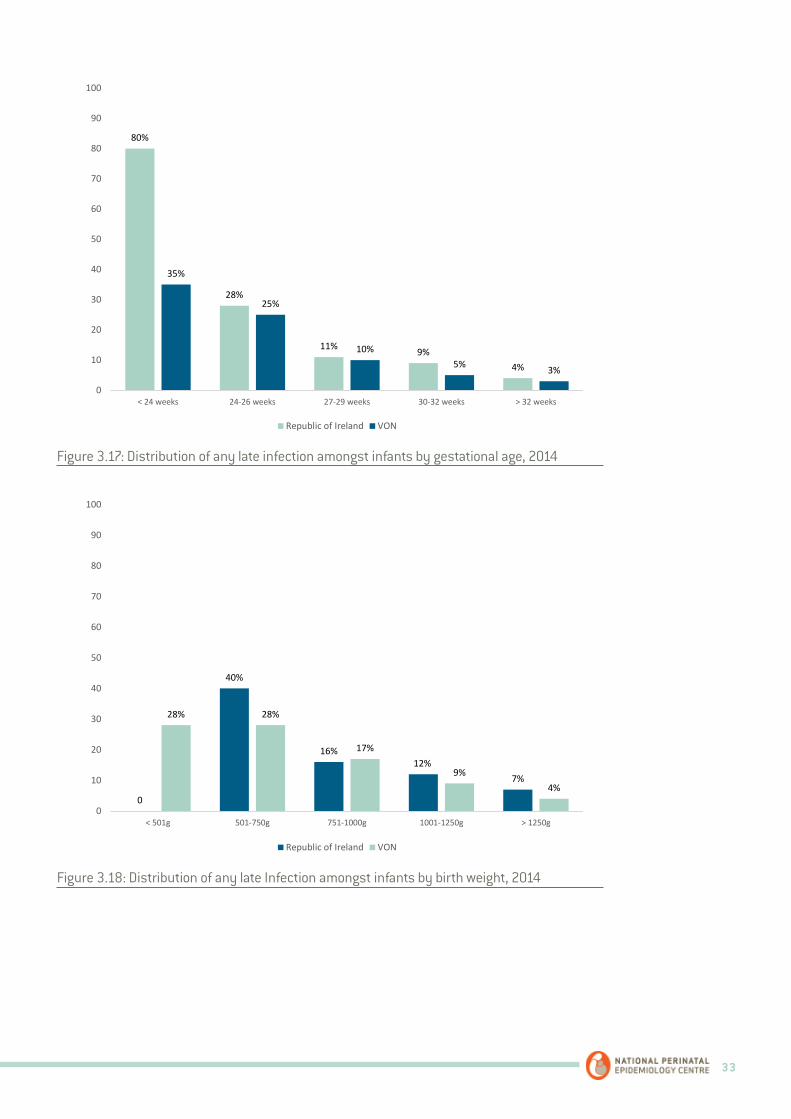
Any late infection was reported for 14% of ROI infants (n=72) and 12% of VON infants (n=6,860). Figures 3.17 and Figure 3.18 illustrate the change in cases of any late infection across all gestational age and birth weight categories respectively. As gestational age increases there was a statistically significant decrease in cases of any late infection in ROI infants (p<0.001). Similarly, as birth weight increases there was a statistically significant decrease in cases of any late infection in ROI infants (p<0.001).
Considering ROI infants born weighing 501-1500g for whom risk adjustment was performed, there were 71 observed cases with any late infection compared to an expected number of 56 cases (Table 3.16). Thus, the observed number equated to 1.26 times the expected number (SMR=1.26, 95% CI: 1.00, 1.52) and the excess of 15 cases just reached statistical significance (95% CI: 0, 29).
KPI 10: Fungal Infection
KPI 11: Any Late Infection
Table 3.15: Risk Adjusted Standardised Morbidity Ratios for Key Performance Indicators - KPI 10: fungal infection, ROI, 2014
Outcome O E SMR (95% CI) O-E (95% CI) Fungal Infection 2 4 0.55 (-0.48, 1.57) -2 (-5, 2)
O=observed, E=expected, SMR=standardised morbidity ratio, CI=confidence interval
Table 3.14: Risk Adjusted Standardised Morbidity Ratios for Key Performance Indicators - KPI 9: nosocomial infection, ROI, 2014
Outcome O E SMR (95% CI) O-E (95% CI) Nosocomial Infection 71 55 1.30 (1.04, 1.57) 16 (2, 31)
O=observed, E=expected, SMR=standardised morbidity ratio, CI=confidence interval
33
38
Figure 3.17: Distribution of any late infection amongst infants by gestational age, 2014
Figure 3.18: Distribution of any late Infection amongst infants by birth weight, 2014
80%
28%
11% 9%4%
35%
25%
10%5% 3%
0
10
20
30
40
50
60
70
80
90
100
< 24 weeks 24-26 weeks 27-29 weeks 30-32 weeks > 32 weeks
Republic of Ireland VON
0
40%
16%12%
7%
28% 28%
17%
9%4%
0
10
20
30
40
50
60
70
80
90
100
< 501g 501-750g 751-1000g 1001-1250g > 1250g
Republic of Ireland VON
Figure 3.17: Distribution of any late infection amongst infants by gestational age, 2014
Figure 3.18: Distribution of any late Infection amongst infants by birth weight, 2014

34 VERY LOW BIRTH WEIGHT INFANTS IN THE REPUBLIC OF IRELAND ANNUAL REPORT 2014
Overall, 23% (n=116) of ROI infants experienced IVH compared to 25% (n=13,040) of VON infants. Severe IVH was observed in 7% (n=35) and 8% (n=4,244) of ROI and VON infants respectively. Figures 3.19 and 3.20 illustrate the change in cases of IVH across all gestational age and birth weight categories respectively. As gestational age increases there was a statistically significant decrease in cases of IVH in ROI infants (p<0.001). Likewise, as birth weight increases there was a statistically significant decrease in cases of IVH in ROI infants (p<0.001).
Figures 3.21 and 3.22 illustrate the change in cases of severe IVH across all gestational age and birth weight categories respectively. As gestational age increases there was a statistically significant decrease in cases of severe IVH in ROI infants (p<0.001).
Similarly, as birth weight increases there was a statistically significant decrease in cases of severe IVH (p<0.001).
IVH was observed in 113 ROI infants weighing 501-1500g at birth whereas the number of cases expected based on the infants’ risk profile was 106 (Table 3.17). Thus, the observed number was only marginally higher than expected (SMR=1.07, 95% CI: 0.88, 1.26), by seven cases in absolute numbers, which was not a statistically significant difference (95% CI: -13, 27).
Similarly with severe IVH, there were 35 observed cases compared to an expected number of 29 cases, an excess of six cases which was not statistically significant (95% CI: -4, 17).
KPI 12: Any IVH and KPI 13: Severe IVH
40
Figure 3.19: Distribution of any IVH amongst infants by gestational age, 2014
Figure 3.20: Distribution of any IVH amongst infants by birth weight, 2014
0
49%
24%
8%3%
61%
40%
21%
14%9%
0
10
20
30
40
50
60
70
80
90
100
< 24 weeks 24-26 weeks 27-29 weeks 30-32 weeks > 32 weeks
Republic of Ireland VON
0
37% 38%
19%
13%
41% 42%
29%
21%
15%
0
10
20
30
40
50
60
70
80
90
100
< 501g 501-750g 751-1000g 1001-1250g > 1250g
Republic of Ireland VON
Figure 3.19: Distribution of any IVH amongst infants by gestational age, 2014
Table 3.16: Risk Adjusted Standardised Morbidity Ratios for Key Performance Indicators - KPI 11: any late infection, ROI, 2014
Outcome O E SMR (95% CI) O-E (95% CI) Any Late Infection 71 56 1.26 (1.00, 1.52) 15 (0, 29)
O=observed, E=expected, SMR=standardised morbidity ratio, CI=confidence interval

35
40
Figure 3.19: Distribution of any IVH amongst infants by gestational age, 2014
Figure 3.20: Distribution of any IVH amongst infants by birth weight, 2014
0
49%
24%
8%3%
61%
40%
21%
14%9%
0
10
20
30
40
50
60
70
80
90
100
< 24 weeks 24-26 weeks 27-29 weeks 30-32 weeks > 32 weeks
Republic of Ireland VON
0
37% 38%
19%
13%
41% 42%
29%
21%
15%
0
10
20
30
40
50
60
70
80
90
100
< 501g 501-750g 751-1000g 1001-1250g > 1250g
Republic of Ireland VON
Figure 3.20: Distribution of any IVH amongst infants by birth weight, 2014
Figure 3.21: Distribution of severe IVH amongst infants by gestational age, 2014
41
Figure 3.21: Distribution of severe IVH amongst infants by gestational age, 2014
Figure 3.22: Distribution of severe IVH amongst infants by birth weight, 2014
0
21%
12%
2% 3%
19% 20%
10%5%
2%
0
10
20
30
40
50
60
70
80
90
100
< 501g 501-750g 751-1000g 1001-1250g > 1250g
Republic of Ireland VON
0
24%
3% 2% 0
35%
18%
5%2% 1%
0
10
20
30
40
50
60
70
80
90
100
< 24 weeks 24-26 weeks 27-29 weeks 30-32 weeks > 32 weeks
Republic of Ireland VON
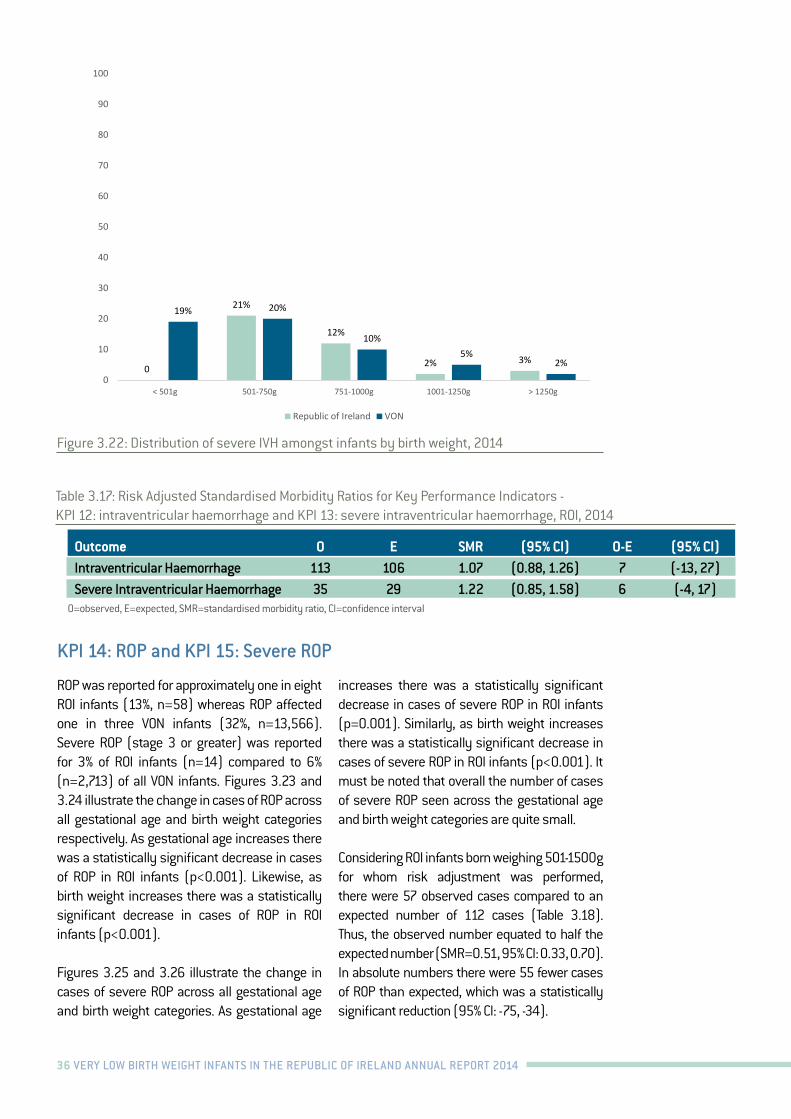
36 VERY LOW BIRTH WEIGHT INFANTS IN THE REPUBLIC OF IRELAND ANNUAL REPORT 2014
41
Figure 3.21: Distribution of severe IVH amongst infants by gestational age, 2014
Figure 3.22: Distribution of severe IVH amongst infants by birth weight, 2014
0
21%
12%
2% 3%
19% 20%
10%5%
2%
0
10
20
30
40
50
60
70
80
90
100
< 501g 501-750g 751-1000g 1001-1250g > 1250g
Republic of Ireland VON
0
24%
3% 2% 0
35%
18%
5%2% 1%
0
10
20
30
40
50
60
70
80
90
100
< 24 weeks 24-26 weeks 27-29 weeks 30-32 weeks > 32 weeks
Republic of Ireland VON
Figure 3.22: Distribution of severe IVH amongst infants by birth weight, 2014
Table 3.17: Risk Adjusted Standardised Morbidity Ratios for Key Performance Indicators - KPI 12: intraventricular haemorrhage and KPI 13: severe intraventricular haemorrhage, ROI, 2014
Outcome O E SMR (95% CI) O-E (95% CI) Intraventricular Haemorrhage 113 106 1.07 (0.88, 1.26) 7 (-13, 27)Severe Intraventricular Haemorrhage 35 29 1.22 (0.85, 1.58) 6 (-4, 17)
O=observed, E=expected, SMR=standardised morbidity ratio, CI=confidence interval
ROP was reported for approximately one in eight ROI infants (13%, n=58) whereas ROP affected one in three VON infants (32%, n=13,566). Severe ROP (stage 3 or greater) was reported for 3% of ROI infants (n=14) compared to 6% (n=2,713) of all VON infants. Figures 3.23 and 3.24 illustrate the change in cases of ROP across all gestational age and birth weight categories respectively. As gestational age increases there was a statistically significant decrease in cases of ROP in ROI infants (p<0.001). Likewise, as birth weight increases there was a statistically significant decrease in cases of ROP in ROI infants (p<0.001).
Figures 3.25 and 3.26 illustrate the change in cases of severe ROP across all gestational age and birth weight categories. As gestational age
increases there was a statistically significant decrease in cases of severe ROP in ROI infants (p=0.001). Similarly, as birth weight increases there was a statistically significant decrease in cases of severe ROP in ROI infants (p<0.001). It must be noted that overall the number of cases of severe ROP seen across the gestational age and birth weight categories are quite small.
Considering ROI infants born weighing 501-1500g for whom risk adjustment was performed, there were 57 observed cases compared to an expected number of 112 cases (Table 3.18). Thus, the observed number equated to half the expected number (SMR=0.51, 95% CI: 0.33, 0.70). In absolute numbers there were 55 fewer cases of ROP than expected, which was a statistically significant reduction (95% CI: -75, -34).
KPI 14: ROP and KPI 15: Severe ROP
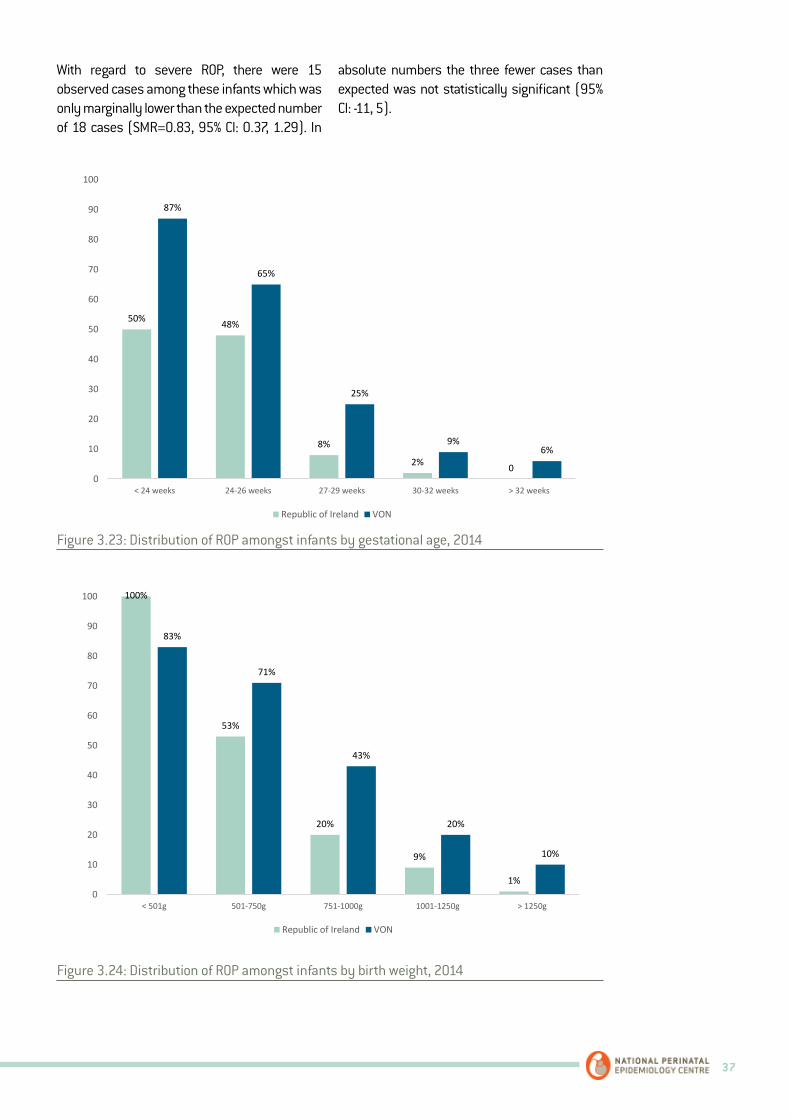
37
With regard to severe ROP, there were 15 observed cases among these infants which was only marginally lower than the expected number of 18 cases (SMR=0.83, 95% CI: 0.37, 1.29). In
absolute numbers the three fewer cases than expected was not statistically significant (95% CI: -11, 5).
43
Figure 3.23: Distribution of ROP amongst infants by gestational age, 2014
Figure 3.24: Distribution of ROP amongst infants by birth weight, 2014
50% 48%
8%
2% 0
87%
65%
25%
9%6%
0
10
20
30
40
50
60
70
80
90
100
< 24 weeks 24-26 weeks 27-29 weeks 30-32 weeks > 32 weeks
Republic of Ireland VON
100%
53%
20%
9%
1%
83%
71%
43%
20%
10%
0
10
20
30
40
50
60
70
80
90
100
< 501g 501-750g 751-1000g 1001-1250g > 1250g
Republic of Ireland VON
Figure 3.23: Distribution of ROP amongst infants by gestational age, 2014
Figure 3.24: Distribution of ROP amongst infants by birth weight, 2014
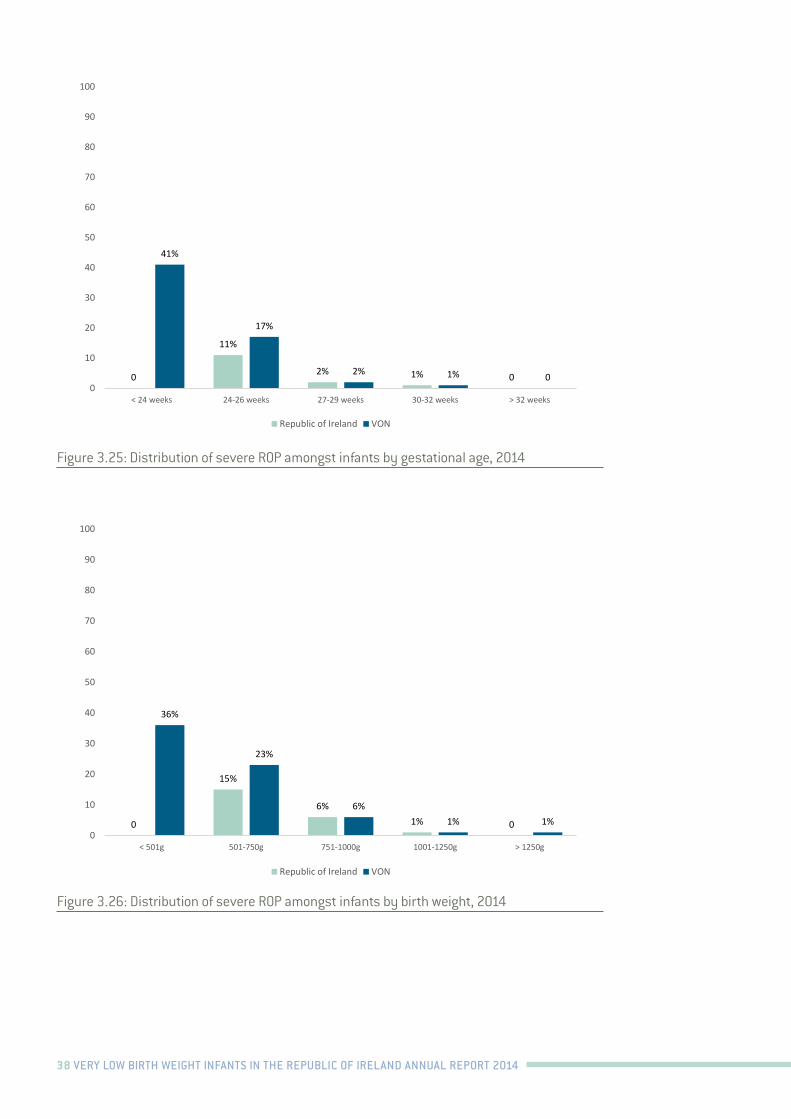
38 VERY LOW BIRTH WEIGHT INFANTS IN THE REPUBLIC OF IRELAND ANNUAL REPORT 2014
44
Figure 3.25: Distribution of severe ROP amongst infants by gestational age, 2014
Figure 3.26: Distribution of severe ROP amongst infants by birth weight, 2014
0
11%
2% 1% 0
41%
17%
2% 1% 00
10
20
30
40
50
60
70
80
90
100
< 24 weeks 24-26 weeks 27-29 weeks 30-32 weeks > 32 weeks
Republic of Ireland VON
0
15%
6%1% 0
36%
23%
6%1% 1%
0
10
20
30
40
50
60
70
80
90
100
< 501g 501-750g 751-1000g 1001-1250g > 1250g
Republic of Ireland VON
Figure 3.25: Distribution of severe ROP amongst infants by gestational age, 2014
Figure 3.26: Distribution of severe ROP amongst infants by birth weight, 2014
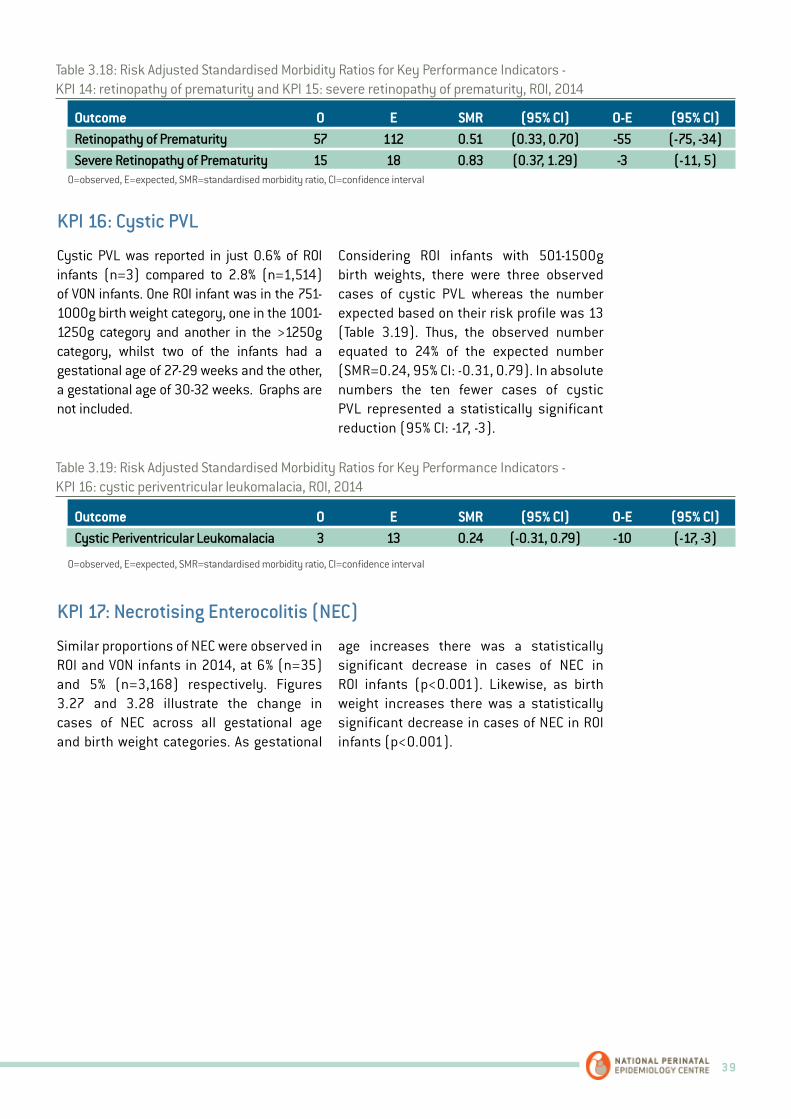
39
Table 3.18: Risk Adjusted Standardised Morbidity Ratios for Key Performance Indicators - KPI 14: retinopathy of prematurity and KPI 15: severe retinopathy of prematurity, ROI, 2014
Table 3.19: Risk Adjusted Standardised Morbidity Ratios for Key Performance Indicators - KPI 16: cystic periventricular leukomalacia, ROI, 2014
Outcome O E SMR (95% CI) O-E (95% CI) Retinopathy of Prematurity 57 112 0.51 (0.33, 0.70) -55 (-75, -34)Severe Retinopathy of Prematurity 15 18 0.83 (0.37, 1.29) -3 (-11, 5)
Outcome O E SMR (95% CI) O-E (95% CI) Cystic Periventricular Leukomalacia 3 13 0.24 (-0.31, 0.79) -10 (-17, -3)
O=observed, E=expected, SMR=standardised morbidity ratio, CI=confidence interval
O=observed, E=expected, SMR=standardised morbidity ratio, CI=confidence interval
Cystic PVL was reported in just 0.6% of ROI infants (n=3) compared to 2.8% (n=1,514) of VON infants. One ROI infant was in the 751-1000g birth weight category, one in the 1001-1250g category and another in the >1250g category, whilst two of the infants had a gestational age of 27-29 weeks and the other, a gestational age of 30-32 weeks. Graphs are not included.
Considering ROI infants with 501-1500g birth weights, there were three observed cases of cystic PVL whereas the number expected based on their risk profile was 13 (Table 3.19). Thus, the observed number equated to 24% of the expected number (SMR=0.24, 95% CI: -0.31, 0.79). In absolute numbers the ten fewer cases of cystic PVL represented a statistically significant reduction (95% CI: -17, -3).
Similar proportions of NEC were observed in ROI and VON infants in 2014, at 6% (n=35) and 5% (n=3,168) respectively. Figures 3.27 and 3.28 illustrate the change in cases of NEC across all gestational age and birth weight categories. As gestational
age increases there was a statistically significant decrease in cases of NEC in ROI infants (p<0.001). Likewise, as birth weight increases there was a statistically significant decrease in cases of NEC in ROI infants (p<0.001).
KPI 16: Cystic PVL
KPI 17: Necrotising Enterocolitis (NEC)
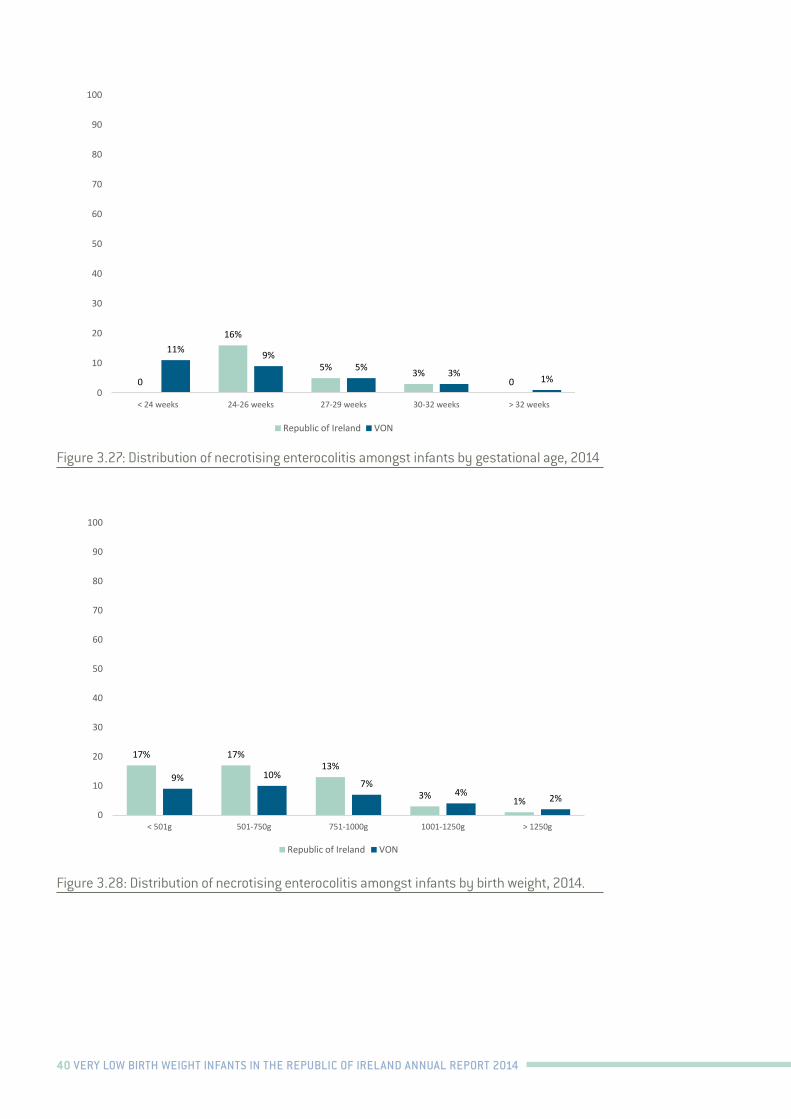
40 VERY LOW BIRTH WEIGHT INFANTS IN THE REPUBLIC OF IRELAND ANNUAL REPORT 2014
46
Amongst the ROI infants born weighing 501-1500g there were 33 observed cases of NEC which was marginally higher than the expected number of 27 cases (SMR=1.21, 95% CI: 0.84, 1.59) (Table 3.20). The excess of six cases was not statistically significant (95% CI: -4, 16).
Figure 3.27: Distribution of necrotising enterocolitis amongst infants by gestational age, 2014.
0
16%
5% 3%0
11% 9%5% 3% 1%
0
10
20
30
40
50
60
70
80
90
100
< 24 weeks 24-26 weeks 27-29 weeks 30-32 weeks > 32 weeks
Republic of Ireland VON
47
Figure 3.28: Distribution of necrotising enterocolitis amongst infants by birth weight, 2014.
Table 3.20: Risk Adjusted Standardised Morbidity Ratios for Key Performance Indicators - KPI 17: necrotising enterocolitis, ROI, 2014
Outcome O E SMR (95% CI) O-E (95% CI)
Necrotising Enterocolitis
33 27 1.21 (0.84, 1.59) 6 (-4, 16)
O=observed, E=expected, SMR=standardised morbidity ratio, CI=confidence interval
KPI 18: Extreme Length of Stay (Survivors only) Similar levels of extreme LOS i.e. LOS greater than the 90th centile for the predicted value based on a multivariable risk adjustment model, were reported for ROI infants at 4% (n= 15) and for VON infants at 4% (n=2,254) in 2014. Figures 3.29 and 3.30 outline the percentages of extreme LOS according to gestational age and birth weight categories respectively.
SMR data for extreme LOS are not available.
17% 17%13%
3% 1%
9% 10%7%
4% 2%
0
10
20
30
40
50
60
70
80
90
100
< 501g 501-750g 751-1000g 1001-1250g > 1250g
Republic of Ireland VON
Figure 3.27: Distribution of necrotising enterocolitis amongst infants by gestational age, 2014
Figure 3.28: Distribution of necrotising enterocolitis amongst infants by birth weight, 2014.
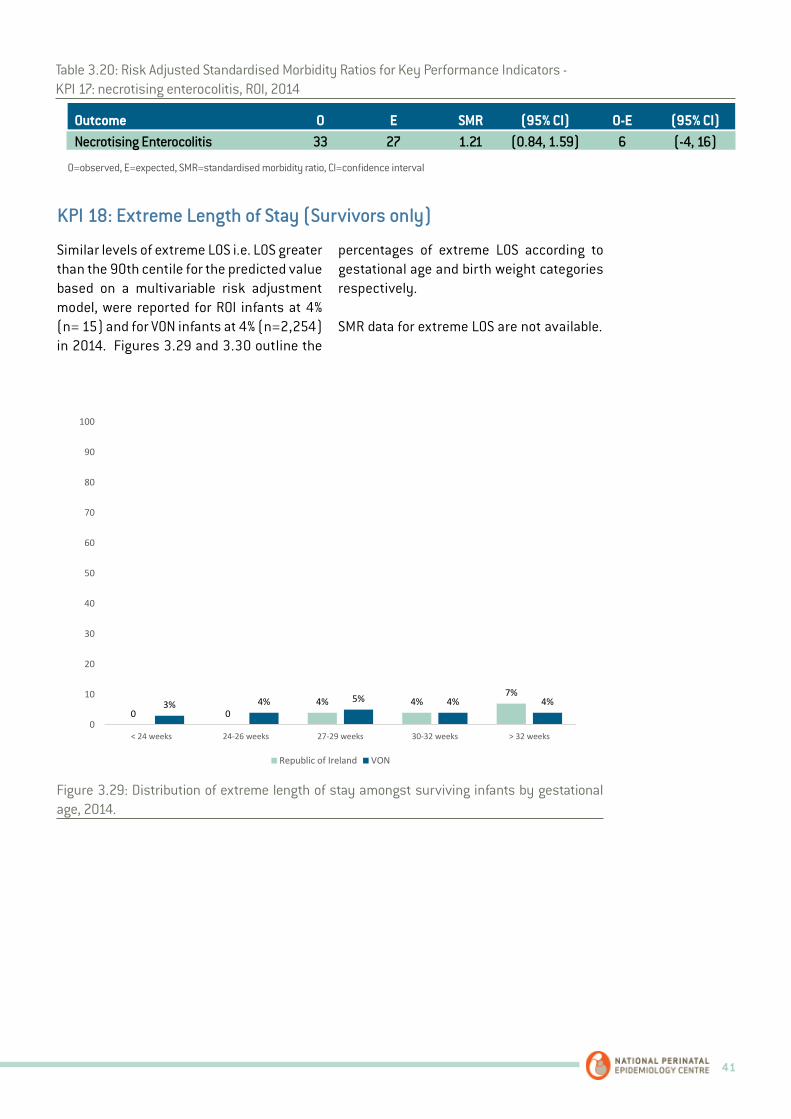
41
Table 3.20: Risk Adjusted Standardised Morbidity Ratios for Key Performance Indicators - KPI 17: necrotising enterocolitis, ROI, 2014
Outcome O E SMR (95% CI) O-E (95% CI) Necrotising Enterocolitis 33 27 1.21 (0.84, 1.59) 6 (-4, 16)
O=observed, E=expected, SMR=standardised morbidity ratio, CI=confidence interval
Similar levels of extreme LOS i.e. LOS greater than the 90th centile for the predicted value based on a multivariable risk adjustment model, were reported for ROI infants at 4% (n= 15) and for VON infants at 4% (n=2,254) in 2014. Figures 3.29 and 3.30 outline the
percentages of extreme LOS according to gestational age and birth weight categories respectively.
SMR data for extreme LOS are not available.
KPI 18: Extreme Length of Stay (Survivors only)
48
Figure 3.29: Distribution of extreme length of stay amongst surviving infants by gestational age, 2014.
Figure 3.30: Distribution of extreme length of stay amongst surviving infants by birth weight, 2014.
0 04% 4%
7%3% 4% 5% 4% 4%
0
10
20
30
40
50
60
70
80
90
100
< 24 weeks 24-26 weeks 27-29 weeks 30-32 weeks > 32 weeks
Republic of Ireland VON
03% 1% 3% 5%
8%4% 3% 4% 5%
0
10
20
30
40
50
60
70
80
90
100
< 501g 501-750g 751-1000g 1001-1250g > 1250g
Republic of Ireland VON
Figure 3.29: Distribution of extreme length of stay amongst surviving infants by gestational age, 2014.
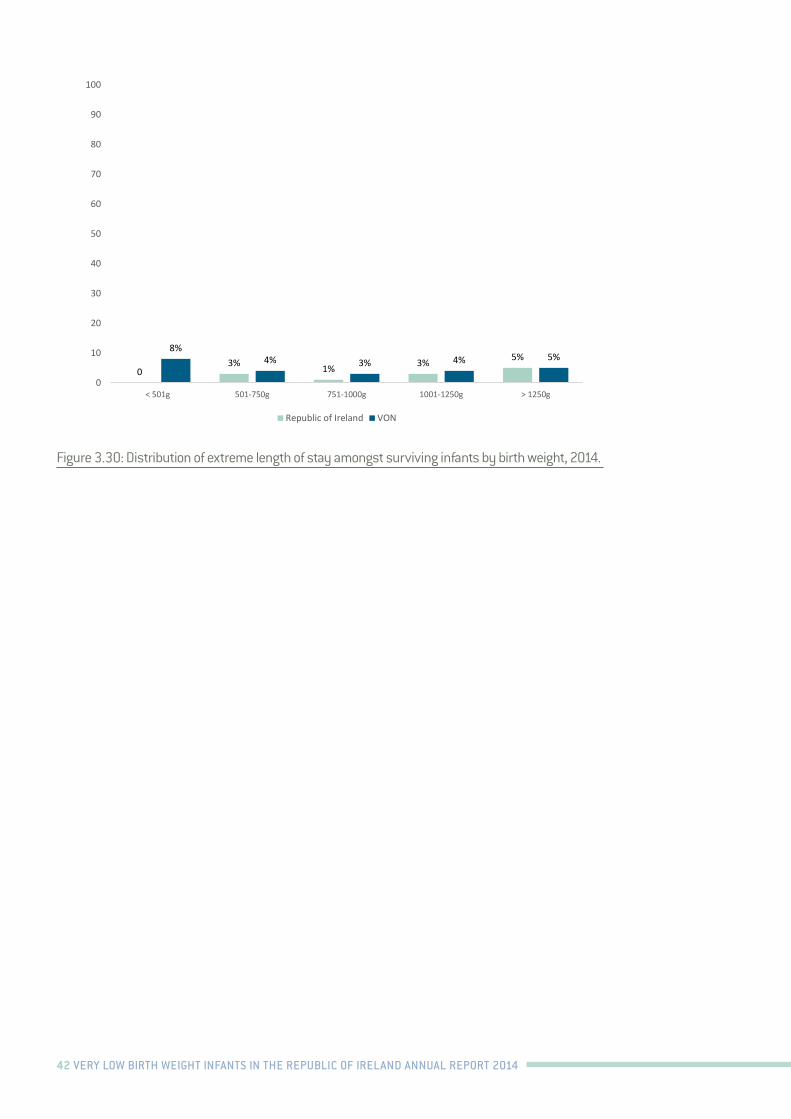
42 VERY LOW BIRTH WEIGHT INFANTS IN THE REPUBLIC OF IRELAND ANNUAL REPORT 2014
48
Figure 3.29: Distribution of extreme length of stay amongst surviving infants by gestational age, 2014.
Figure 3.30: Distribution of extreme length of stay amongst surviving infants by birth weight, 2014.
0 04% 4%
7%3% 4% 5% 4% 4%
0
10
20
30
40
50
60
70
80
90
100
< 24 weeks 24-26 weeks 27-29 weeks 30-32 weeks > 32 weeks
Republic of Ireland VON
03% 1% 3% 5%
8%4% 3% 4% 5%
0
10
20
30
40
50
60
70
80
90
100
< 501g 501-750g 751-1000g 1001-1250g > 1250g
Republic of Ireland VON
Figure 3.30: Distribution of extreme length of stay amongst surviving infants by birth weight, 2014.

43
Appendix A: Endorsement by the National Office of Clinical Audit (NOCA)
National Office of Clinical Audit, 2nd Flr, Ardilaun House, 111 St Stephen’s Green, Dublin 2 Tel: 4028577
29th February 2016 Dr. Brendan Paul Murphy Consultant Neonatologist Cork University Maternity Hospital Wilton Cork Very Low Birth Weight Infants in the Republic of Ireland - Annual Report 2014 Dear Dr Murphy, On behalf of the NOCA Governance Board and our Executive Team, I wish to congratulate you, Dr Anne Twomey, the Neonatal Intensive Care Outcomes Research and Evaluation (NICORE) group and the National Perinatal Epidemiology Centre (NPEC) and all participating neonatal units for your combined efforts in initiating and supporting this valuable quality improvement initiative. As you are aware, NOCA’s core objective is to support the use of clinical audit to drive improvement for patients in Ireland. Improvement in care and outcomes can only be achieved by information gathered and monitored on how we deliver services. We certainly encourage your approach to follow up and provide feedback to individual hospitals on their own data. From this first national report you are in a position to inform future service delivery and support the bench marking of clinical care with identified standards, such as those set by the National Clinical Programme in Neonatology and the Faculty of Paediatrics. Over time this will allow real change through monitoring, education and the implementation of change to the betterment of future care for mothers and babies in Ireland. Please accept this letter as formal endorsement of the first Very Low Birth Weight Infants in the Republic of Ireland - Annual Report 2014. Yours sincerely,
Professor Sean Tierney Chair National Office of Clinical Audit
c.c. Dr. Anne Twomey, National Maternity Hospital, Holles Street, Dublin 2, Ireland Prof Richard Greene, National Perinatal Epidemiology Centre, CUMH, Cork
44 VERY LOW BIRTH WEIGHT INFANTS IN THE REPUBLIC OF IRELAND ANNUAL REPORT 2014
Appendix B: NICORE Group Members, 2014
Dr Muhammad Azam, Consultant Paediatrician, Wexford General Hospital
Dr Paula Cahill, Consultant Paediatrician, Portiuncula Hospital
Dr David Corcoran, Consultant Neonatologist, Rotunda Hospital
Dr Animitra Das, Consultant Neonatologist, University Hospital Waterford
Dr Alan Finan, Consultant Paediatrician, Cavan General Hospital
Dr Emma Gordon, Consultant Neonatologist, Our Lady of Lourdes Hospital
Dr Rizwan Gul, Consultant Paediatrician, Midland Regional Hospital Portlaoise
Dr Rizwan Khan, Consultant Paediatrician, Kerry General Hospital
Dr Imelda Lambert, Consultant Paediatrician, Midland Regional Hospital, Mullingar
Dr Jan Miletin, Consultant Neonatologist, Coombe Women & Infants University Hospital
Dr Brendan Paul Murphy, Consultant Neonatologist, Cork University Maternity Hospital
Dr Donough O’Donovan, Consultant Neonatologist, University Hospital Galway
Dr Justin Roche, Consultant Paediatrician, South Tipperary General Hospital
Dr Con Sreenan, Consultant Paediatrician, Limerick Regional Maternity Hospital
Dr Gay Fox, Consultant Paediatrician, Mayo General Hospital
Dr Mathew Thomas, Consultant Paediatrician, Letterkenny General Hospital
Dr Rohininath Tummaluru, Consultant Paediatrician, Sligo General Hospital
Dr Anne Twomey, Consultant Neonatologist, National Maternity Hospital
Dr David Waldron, Consultant Paediatrician, St. Luke’s General Hospital
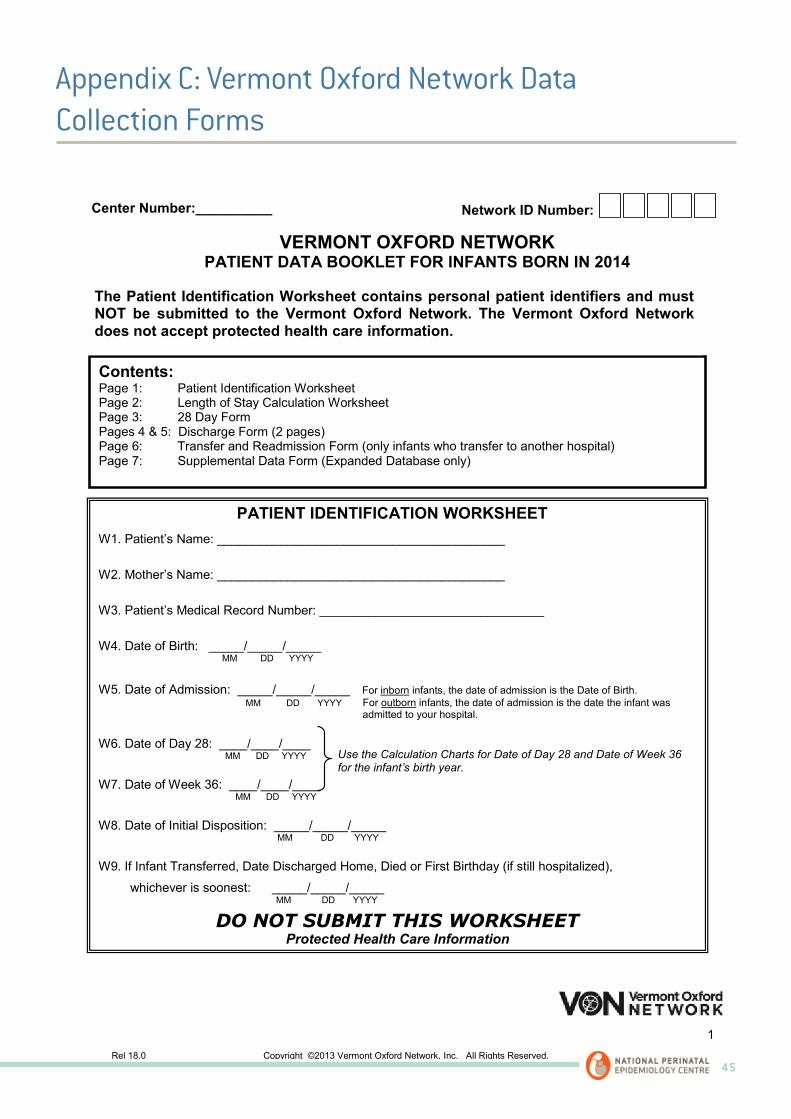
45
Appendix C: Vermont Oxford Network Data Collection Forms
Rel 18.0 Copyright ©2013 Vermont Oxford Network, Inc. All Rights Reserved.
VERMONT OXFORD NETWORK
PATIENT DATA BOOKLET FOR INFANTS BORN IN 2014
Contents:
Page 1: Patient Identification Worksheet Page 2: Length of Stay Calculation Worksheet Page 3: 28 Day Form Pages 4 & 5: Discharge Form (2 pages) Page 6: Transfer and Readmission Form (only infants who transfer to another hospital) Page 7: Supplemental Data Form (Expanded Database only)
W1. Patient’s Name: _________________________________________ W2. Mother’s Name: _________________________________________ W3. Patient’s Medical Record Number: ________________________________ W4. Date of Birth: _____/_____/_____
MM DD YYYY
W5. Date of Admission: _____/_____/_____ For inborn infants, the date of admission is the Date of Birth.
MM DD YYYY For outborn infants, the date of admission is the date the infant was admitted to your hospital.
W6. Date of Day 28: ____/____/____
MM DD YYYY W7. Date of Week 36: ____/____/____
MM DD YYYY
W8. Date of Initial Disposition: _____/_____/_____ MM DD YYYY W9. If Infant Transferred, Date Discharged Home, Died or First Birthday (if still hospitalized),
whichever is soonest: _____/_____/_____ MM DD YYYY
DO NOT SUBMIT THIS WORKSHEET Protected Health Care Information
PATIENT IDENTIFICATION WORKSHEET
The Patient Identification Worksheet contains personal patient identifiers and must NOT be submitted to the Vermont Oxford Network. The Vermont Oxford Network does not accept protected health care information.
Network ID Number:
1
Center Number:__________
Use the Calculation Charts for Date of Day 28 and Date of Week 36 for the infant’s birth year.

46 VERY LOW BIRTH WEIGHT INFANTS IN THE REPUBLIC OF IRELAND ANNUAL REPORT 2014
Rel 18.0 Copyright ©2013 Vermont Oxford Network, Inc. All Rights Reserved. 2
LENGTH OF STAY CALCULATION WORKSHEET
FOR INFANTS BORN IN 2014
Protected Health Care Information. DO NOT SUBMIT this Worksheet to Vermont Oxford Network. Use items W5, W8 and W9 from the Patient Identification Worksheet when completing this form. Find the day numbers corresponding to dates using the Day Number Chart for 2014-2015 (www.vtoxford.org).
PLEASE DO NOT SUBMIT THIS WORKSHEET Protected Health Care Information
Part A. Initial Length Of Stay
Enter Date of Initial Discharge, Transfer or Death (W8): ____/____/____ Day #
Subtract Date of Admission to Your Hospital (W5): ____/____/____ ▬ Day #
Add 1: + 1
L1. INITIAL LENGTH OF STAY = Days Note: the maximum value of Initial Length of Stay is 366 (or 367 if leap day must be added), because tracking ends on the infant’s first birthday.
Part B. Total Length Of Stay Only For Infants Transferred From Your Hospital to Another Hospital.
Enter Date of Final Discharge or Death (W9): ____/____/____ Day #
Subtract Date of Admission (W5): ____/____/____ ▬ Day #
Add 1: + 1
L2. TOTAL LENGTH OF STAY = Days Note: the maximum value of Total Length of Stay is 366 (or 367 if leap day must be added), because tracking ends on the infant’s first birthday.
SAMPLE CALCULATION OF INITIAL LENGTH OF STAY
Enter Date of Initial Discharge, Transfer or Death: 02 / 26 / 2014 Subtract Date of Admission: 01 / 13 / 2014 ▬
Add 1: + L1. INITIAL LENGTH OF STAY = Days Explanation: Date of 02/26/2014 is Day Number 57. Date of 01/13/2014 is Day Number 13. The day numbers for each date are found in the 2014-2015 Day Number Chart on the Network web site, www.vtoxford.org.
5 7 Day #
1 3 Day #
4 4 1
4 5
Network ID Number: Center Number:________
For inborn infants, the date of admission is the Date of Birth. For outborn infants, the date of admission is the date the infant was admitted to your hospital.
For inborn infants, the date of admission is the Date of Birth. For outborn infants, the date of admission is the date the infant was admitted to your hospital.

47
Rel 18.0 © 2013 Vermont Oxford Network, Inc. All Rights Reserved. 07/02/2013
28 DAY FORM - For Infants Born in 2014
Center Number: ________ Network ID Number: Year of Birth: ______
1. Birth Weight: ________ grams
2. Gestational Age: a) Weeks _______ b) Days (0-6) _______
3. Died in Delivery Room: Yes No (If Yes, Use Delivery Room Death Form.)
4. a) Location of Birth: Inborn Outborn
b) If Outborn, Day of Admission to Your Center (Range: 1 to 28. Date of Birth is Day 1): _______
c) If Outborn, Transfer Code of Center from which Infant Transferred: __________ (List available at http://www.vtoxford.org/transfers)
5. Head Circumference at Birth (in cm to nearest 10th):
6. Maternal Ethnicity/Race (Answer both a and b): a) Ethnicity of Mother: Hispanic Not Hispanic
b) Race of Mother: Black or African American White Asian American Indian or Alaska Native Native Hawaiian or Other Pacific Islander Other 7. Prenatal Care: Yes No
8. Antenatal Steroids: Yes No
9. Antenatal Magnesium Sulfate: Yes No
10. Chorioamnionitis: Yes No
11. Maternal Hypertension, Chronic or Pregnancy-Induced: Yes No 12. Mode of Delivery: VaginaI Cesarean Section
13. Sex of Infant: Male Female
14. a) Multiple Gestation: Yes No b) If Yes, Number of Infants Delivered: _____
15. APGAR Scores: a) 1 minute _______ b) 5 minutes _______
16. Initial Resuscitation: a) Oxygen: Yes No b) Face Mask Vent: Yes No c) Endotracheal Tube Vent: Yes No d) Epinephrine: Yes No e) Cardiac Compression: Yes No
f) Nasal CPAP Yes No 17. a) Temperature Measured within the First Hour after Admission to Your NICU: Yes No N/A b) If Yes, Temperature Within the First Hour after Admission to Your NICU
(in degrees centigrade to nearest 10th):
18. Bacterial Sepsis on or before Day 3: Yes No
19. Oxygen on Day 28: Yes No N/A (See Manual for N/A criteria)
20. Periventricular-lntraventricular Hemorrhage (PIH):
a) Cranial Imaging (US/CT/MRI) on or before Day 28: Yes No
b) If Yes, Worst Grade of PIH (0-4): _______
c) If PIH Grade 1-4, Where PIH First Occurred: Your Hospital Other Hospital N/A
21. Died Within 12 Hours of Admission to Your NICU: Yes No
3
▪
▪
48 VERY LOW BIRTH WEIGHT INFANTS IN THE REPUBLIC OF IRELAND ANNUAL REPORT 2014
Rel 18.0 © 2013 Vermont Oxford Network, Inc. All Rights Reserved. 09/10/2013
INTE
RVE
NTI
ON
S
22. Respiratory Support (at any time after leaving the delivery room/initial resuscitation area): a) Oxygen after Initial Resuscitation: Yes No b) Conventional Ventilation after Initial Resuscitation: Yes No
c) High Frequency Ventilation after Initial Resuscitation: Yes No d) High Flow Nasal Cannula after Initial Resuscitation: Yes No
e) Nasal IMV or Nasal SIMV after Initial Resuscitation: Yes No
23. a ) Nasal CPAP after Initial Resuscitation: Yes No b) NCPAP before or without ever having received ETT Vent: Yes No N/A 24. a) Surfactant during Initial Resuscitation: Yes No b) Surfactant at Any Time: Yes No (Item 24.b must be Yes if Item 24.a is Yes)
If Yes, Age at First Dose: c) Hours _____ d) Minutes (0-59) _____ 25. a) Inhaled Nitric Oxide: Yes No b) If Yes, where given: Your Hospital Other Hospital Both
26. Respiratory Support at 36 Weeks (See Manual for N/A criteria): a) Oxygen at 36 Weeks: Yes No N/A
b) Conventional Ventilation at 36 Weeks: Yes No N/A c) High Frequency Ventilation at 36 Weeks: Yes No N/A
d) High Flow Nasal Cannula at 36 Weeks: Yes No N/A
e) Nasal IMV or SIMV at 36 Weeks: Yes No N/A
f) Nasal CPAP at 36 Weeks: Yes No N/A
27. a) Steroids for CLD: Yes No b) If Yes, Where Given: Your Hospital Other Hospital Both
28. Indomethacin for Any Reason: Yes No
29. Ibuprofen for PDA: Yes No 30. Probiotics: Yes No 31. Treatment of ROP with Anti-VEGF Drug: Yes No 32. a) ROP Surgery: Yes No
b) If Yes, Where Done: Your Hospital Other Hospital Both
33. a) PDA Ligation: Yes No b) If Yes, Where Done: Your Hospital Other Hospital Both
34. Surgery for NEC, Suspected NEC, or Yes No (If Yes, a Surgery Code is Required in item 36a) Bowel Perforation: 35. Other Surgery: Yes No (If Yes, a Surgery Code is Required in item 36a)
36a. If Yes to NEC Surgery or Other Surgery, Surgical Codes (See Appendix D): If NEC Surgery, one or more of the following codes is required: S302, S303, S307, S308, S309, S333. Indicate location of surgery for each surgery code.
Surgery Code 1: ____________ Your Hospital Other Hospital Both Surgery Code 2: ____________ Your Hospital Other Hospital Both Surgery Code 3: ____________ Your Hospital Other Hospital Both Surgery Code 4: ____________ Your Hospital Other Hospital Both Surgery Code 5: ____________ Your Hospital Other Hospital Both Surgery Code 6: ____________ Your Hospital Other Hospital Both Surgery Code 7: ____________ Your Hospital Other Hospital Both Surgery Code 8: ____________ Your Hospital Other Hospital Both Surgery Code 9: ____________ Your Hospital Other Hospital Both Surgery Code 10: ___________ Your Hospital Other Hospital Both
36b. Include description for codes S100, S200, S300, S400, S500, S600, S700, S800, S900, S1000 & S1001:
DISCHARGE FORM - For Infants Born in 2014 - PAGE 1
Center Number: ________ Network ID Number: Year of Birth: _______
4

49
Rel 18.0 © 2013 Vermont Oxford Network, Inc. All Rights Reserved. 09/10/2013
DIA
GN
OSE
S
37. Respiratory Distress Syndrome: Yes No
38. a) Pneumothorax: Yes No b) If Yes, Where Occurred: Your Hospital Other Hospital Both
39. Patent Ductus Arteriosus: Yes No
40. a) Necrotizing Enterocolitis: Yes No b) If Yes, Where Occurred: Your Hospital Other Hospital Both
41. a) Focal Intestinal Perforation: Yes No b) If Yes, Where Occurred: Your Hospital Other Hospital Both
Sepsis and/or Meningitis, Late (after day 3 of life): (See Manual for N/A criteria)
42. a) Bacterial Pathogen: Yes No N/A b) If Yes, Where Occurred: Your Hospital Other Hospital Both
43. a) Coagulase Negative Staph: Yes No N/A b) If Yes, Where Occurred: Your Hospital Other Hospital Both
44. a) Fungal Infection: Yes No N/A
b) If Yes, Where Occurred: Your Hospital Other Hospital Both
45. Cystic Periventricular Leukomalacia: Yes No N/A (see Manual for N/A criteria)
46. ROP: a) Retinal Exam Done: Yes No b) If Yes, Worst Stage of ROP (0-5): _____
47. Major Birth Defect: Yes No If Yes, enter codes: _____ _____ _____ _____ ____
Include description for Codes 100, 504, 601, 605, 901, 902, 903, 904 & 907:
48. Enteral Feeding at Discharge: None Human Milk Only Formula Only Human milk in combination with either fortifier or formula
49. Oxygen and Monitor at Discharge:
a) Oxygen at Discharge: Yes No
b) Monitor at Discharge: Yes No
50. Initial Disposition (check only one): Home
Died
Transferred to another Hospital ( Complete Transfer and Readmission Form)
Still Hospitalized as of First Birthday
51. Weight at Initial Disposition: _________ grams
52. Head Circumference at Initial Disposition (in cm to the nearest10th):
53. Initial Length of Stay: ________ day(s) (Item L1 on Length of Stay Calculation Worksheet) D
ISC
HA
RG
E
.
DISCHARGE FORM - For Infants Born in 2014 - PAGE 2
Center Number: ______ Network ID Number: Year of Birth: _______
5

50 VERY LOW BIRTH WEIGHT INFANTS IN THE REPUBLIC OF IRELAND ANNUAL REPORT 2014
Rel 18.0 © 2013 Vermont Oxford Network, Inc. All Rights Reserved. 09/10/2013
TRANSFER & READMISSION FORM - For Infants Born in 2014
Center Number: ________ Network ID Number: Year of Birth: _____
Part A. Complete for ALL Transferred Infants If an infant is transferred to another hospital, complete Items 54 - 56. Post Transfer Disposition (Item 56) refers to the infant's disposition upon leaving the "transferred to" hospital. 54. Reason for Transfer: Growth/Discharge Planning Medical/Diagnostic Services
Surgery ECMO Chronic Care Other
55. Transfer Code of Center to which Infant Transferred: __________ (List available at http://www.vtoxford.org/transfers)
56. Post Transfer Disposition (check only one): Home Skip Parts B and C. Complete Part D.
Transferred Again to Another Hospital (2nd Transfer) Skip Part B. Complete Parts C and D when data are available.
Died Skip Parts B and C. Complete Part D.
Readmitted to Any Location in Your Hospital Complete Parts B and D (and C if applicable) when data are available.
Still Hospitalized as of First Birthday Skip Parts B and C. Complete Part D.
Part B. Complete ONLY for Readmitted Infants If a patient is readmitted to your center after transferring once to another hospital without having been home, answer Items 57 - 58. When infants are readmitted to your center, continue to update Items 18 - 20 on the 28 Day Form, and Items 22 – 49 on the Discharge Form based on all events at both hospitals until the date of Disposition after Readmission. If your hospital participates in the Expanded Database and definition criteria are met, update Items S1.B, S1.C.1, S1.C.2, S2.A.1, S2.A.2 and S2.C based on events that occur following transfer and readmission.
57. Disposition after Readmission (check only one): Home Skip Part C. Complete Part D.
Died Skip Part C. Complete Part D.
Transferred Again to Another Hospital Complete Parts C and D when data are available.
Still Hospitalized as of First Birthday Skip Part C. Complete Part D.
58. Weight at Disposition after Readmission: _________ grams
Part C. Complete ONLY for Infants Who Transferred More Than Once
Answer Item 59 if an infant transferred from your center to another hospital and was then either (1) transferred again to another hospital, or (2) readmitted to your center and then transferred again to another hospital.
59. Ultimate Disposition (check only one):
Home Complete Part D.
Died Complete Part D.
Still Hospitalized as of First Birthday Complete Part D.
Part D. Complete for ALL Transferred Infants
Complete Item 60 when the infant has been discharged Home, Died or is Still Hospitalized as of First Birthday, whichever comes first.
60. Total Length of Stay: ________day(s) (Item L2 on Length of Stay Calculation Worksheet)
(Check Only One)
6

51
Rel 18.0 © 2013 Vermont Oxford Network, Inc. All Rights Reserved 07/02/2013
SUPPLEMENTAL DATA FORM - For Infants Born in 2014 (For Expanded Database Centers)
Center Number: _______ Network ID Number: Year of Birth: _______
S1. Treatments:
A. 1. Duration of Assisted Ventilation:
None <4 hours 4-24 hours > 24 hours N/A
2. If > 24 hours, Total Days of Assisted Ventilation: _______
B. ECMO at your Hospital: Yes No N/A
C. Hypothermic Therapy at Your Hospital:
1. Was Hypothermic Therapy Performed at Your Hospital: Yes No
2. If Yes, Cooling Method: Selective Head Whole Body Both
S2. Diagnoses:
A. 1. Hypoxic-lschemic Encephalopathy: Yes No N/A
2. HIE Severity (check one): Mild Moderate Severe N/A
B. 1. Meconium Aspiration: Yes No
2. Tracheal Suction for Meconium Attempted in the DR: Yes No N/A
C. Seizures: Yes No N/A
7
52 VERY LOW BIRTH WEIGHT INFANTS IN THE REPUBLIC OF IRELAND ANNUAL REPORT 2014
Rel 18.0 Copyright © 2013 Vermont Oxford Network, Inc. All Rights Reserved.
VERMONT OXFORD NETWORK DELIVERY ROOM DEATH BOOKLET FOR INFANTS BORN IN 2014
Contents:
Page 1: Patient Identification Worksheet Page 2: Delivery Room Death Form
W1. Patient’s Name: ________________________________________ W2. Mother’s Name: _________________________________________ W3. Patient’s Medical Record Number: ________________________________ W4. Date of Birth: _____/_____/_____ MM DD YYYY
PLEASE DO NOT SUBMIT THIS WORKSHEET Protected Health Care Information
DELIVERY ROOM DEATH PATIENT IDENTIFICATION WORKSHEET
Use the Delivery Room Death Booklet for eligible inborn infants who die in the delivery room or at any other location in your hospital within 12 hours of birth and prior to admission to the NICU. The Delivery Room Death Patient Identification Worksheet contains personal patient identifiers and must NOT be submitted to the Vermont Oxford Network. The Vermont Oxford Network does not accept protected health care information.
Network ID Number: Center Number: _______
1
Delivery Room Death Booklet

53
Rel 18.0 © 2013 Vermont Oxford Network, Inc. All Rights Reserved. 09/10/2013
DELIVERY ROOM DEATH FORM – For Infants Born in 2014
Center Number: ________ Network ID Number: Year of Birth: _______
1. Birth Weight: ________ grams
2. Gestational Age: a) Weeks _____ b) Days (0-6) _____
3. Died in Delivery Room: Yes No (If NO, do not use this Form)
4. a) Location of Birth: Inborn Outborn (If OUTBORN, do not use this Form) b and c: Not Applicable
5. Head Circumference at Birth (in cm to the nearest 10th):
6. Maternal Ethnicity/Race: (answer both a and b)
a) Ethnicity of Mother: Hispanic Not Hispanic
b) Race of Mother: Black or African American White Asian American Indian or Alaska Native Native Hawaiian or Other Pacific Islander Other
7. Prenatal Care: Yes No
8. Antenatal Steroids: Yes No
9. Antenatal Magnesium Sulfate: Yes No
10. Chorioamnionitis: Yes No
11. Maternal Hypertension, Chronic or Pregnancy-Induced: Yes No
12. Mode of Delivery: Vaginal Cesarean Section
13. Sex of Infant: Male Female
14. a) Multiple Gestation: Yes No b) If Yes, Number of Infants Delivered: ______
15. APGAR Scores: a) 1 minute _____ b) 5 minutes _____
16. Initial Resuscitation: a) Oxygen: Yes No b) Facial Mask Vent: Yes No
c) Endotracheal Tube Vent: Yes No d) Epinephrine: Yes No
e) Cardiac Compression: Yes No f) Nasal CPAP: Yes No
17 – 23: Not Applicable 24. Surfactant Treatment:
a) Surfactant during Initial Resuscitation: Yes No
b) Surfactant at Any Time: Yes No (Part b must be answered “Yes” if Part a is “Yes”) If Yes, Age at First Dose: c) hours ______ d) minutes (0-59) ______
25 – 46: Not Applicable 47. Major Birth Defect: Yes No If Yes, enter codes ______ ______ ______ ______ _______
Include description for Codes 100, 504, 601, 605, 901, 902, 903, 904 & 907: _________________________
____________________________________________________________________________________________
▪
48 – 60: Not Applicable
If your center participates in the Expanded Database, answer Items S2. B.1 and S2. B.2 from the Supplemental Data Form. Items S1.A. to S1.C. and Items S2.A and S2.C are not applicable.
S2. B. 1. Meconium Aspiration: Yes No B. 2. Tracheal Suction for Meconium Attempted in the DR: Yes No N/A
2


National Perinatal Epidemiology Centre, Department of Obstetrics and Gynaecology, UCC, 5th Floor, Cork University Maternity Hospital, Wilton, Cork, IrelandT: +353 21 4205017 E: [email protected] W: www.ucc.ie/en/npec/