vertical distribution of macrocystis pyrifera nutrient exposure in southern california
TRANSCRIPT

at SciVerse ScienceDirect
Estuarine, Coastal and Shelf Science 106 (2012) 85e92
Contents lists available
Estuarine, Coastal and Shelf Science
journal homepage: www.elsevier .com/locate/ecss
Vertical distribution of Macrocystis pyrifera nutrient exposure in southernCalifornia
T. Konotchick a,*, P.E. Parnell b, P.K. Dayton b, J.J. Leichter b
a J. Craig Venter Institute, 10355 Science Center Drive, San Diego, CA 92121, USAb Integrative Oceanography Division, Scripps Institution of Oceanography, 9500 Gilman Drive, m/c 0227, La Jolla, CA 92093-0227, United States
a r t i c l e i n f o
Article history:Received 7 January 2012Accepted 25 April 2012Available online 30 April 2012
Keywords:Macrocystis pyrifera (giant kelp)nitrogen cycleprimary productionthermistor chainswater columnUSA, California, La Jolla
* Corresponding author.E-mail addresses: [email protected] (T. Kono
(P.E. Parnell), [email protected] (P.K. Dayton), jleicht
0272-7714/$ e see front matter � 2012 Elsevier Ltd.doi:10.1016/j.ecss.2012.04.026
a b s t r a c t
We examined water column temperature time series profiles for several years at two locations in a singlekelp (Macrocystis pyrifera) forest to characterize the alongshore variability of the nutrient climate thatgiant kelp is exposed to and compare it to the response of giant kelp. The differences in nutrient climateare due to differential alongshore vertical variations in temperature, a well-established proxy of nitrate,due to the topographically induced internal wave dynamics within the kelp forest. We observed thegreatest temperature variability during summer and most of this variability occurred near the surface.The 14.5 �C isotherm, indicating the presence of nitrate, ranged the entire vertical extent of the watercolumn, and was shallowest during the winter and in the southern portion of the kelp forest. Predictedwater column integrated nitrate varies from 0 mmol NO3
�/m2 to 431 mmol NO3�/m2 yielding a time series
daily average of 0.12 gN/m2day (North La Jolla) and 0.18 gN/m2day (South La Jolla). Redfield conversion ofthese values puts the time series daily average for carbon production (upper limit) between 0.8 and1.2 gC/m2day for the north and south parts of the bed respectively, and shows considerable variation atseveral time scales. Giant kelp in the southern portion of the forest exhibited greater stipe densities (aproxy for kelp production) than individuals in the northern portion, corresponding with the alongshorenutrient climate variability. The depth of the nutricline varied by up to 10 m over time scales as short ashours. Variability was greatest at diurnal and semi-diurnal frequencies, with shallower water columndepths showing greatest variability. These depth-specific variations in temperature and nutrient expo-sure may have biologically important consequences for M. pyrifera especially during low nutrientseasons.
� 2012 Elsevier Ltd. All rights reserved.
1. Introduction
Giant kelp, Macrocystis pyrifera, is the largest algal species onearth and has a broad geographic range. Individuals span the watercolumn, often bridging gradients in temperature and nutrientsneeded for growth. A significant input of nutrients is required tosupport the large and rapid biological production of these forests.Macrocystis pyrifera productivity in California ranges from 0.95 to6.8 gC/m2day (Towle and Pearse, 1973; Mann, 2000). Using theempirical stoichiometric Redfield ratio 106:16:1 (C:N:P), this leadsto estimates that 0.14e1.03 gN/m2day and 0.01e0.06 gP/m2day arerequired to support such growth. Low nutrient conditions limitgrowth and survivorship as well as negatively affect adult repro-ductive output and juvenile recruitment (Gerard, 1982b; Stenecket al., 2002). Nutrients are typically stratified in the water column
tchick), [email protected]@ucsd.edu (J.J. Leichter).
All rights reserved.
and linked with temperature and density (Kamykowski andZentara, 1986), with greater nutrient concentrations below thethermocline. Thus, there is variation across the alga in the oppor-tunities for nutrient acquisition. Geographically, the stratification ofnutrients increases toward the southern range of M. pyrifera (inNorth America). Temperature and nitrate concentrations can varyon multiple temporal and spatial scales with profound conse-quences for kelp biology.
Giant kelp production decreases with warming temperatures(Jackson, 1977; North and Zimmerman, 1984). El Niño e SouthernOscillation (ENSO), an inter-annual and Pacific wide climate patternthat involves a warming of the surface waters in the eastern Pacificand extending to higher latitudes in the eastern boundary currents,presents alternating periods of high and low nutrient conditions. Insouthern California, storm and wave activity increases during ElNiño years, which increases the incidence of Macrocystis pyriferabeing detached from their substrate (Seymour et al., 1989). Loss ofcanopy can in turn affect the light reaching the bottom and theability of competitors to monopolize substrate. One of the largest El
T. Konotchick et al. / Estuarine, Coastal and Shelf Science 106 (2012) 85e9286
Niño events in recent history (1982e1984) greatly reducedM. pyrifera stands with dramatic follow-on effects for understoryalgal species (Tegner and Dayton, 1991; Tegner et al., 1997; Daytonet al., 1998).
The San Diego region supports two of the largest kelp beds inCalifornia, Point Loma and La Jolla, yet unlike nutrient-repleteregions to the north, the San Diego area experiences seasons (i.e.summer)when nutrients are limiting (Jackson,1977). Internalwavesare critical in “nutritionallymarginal”habitats of southernCalifornia,especially during warm water events (Zimmerman and Robertson,1985). The offshore nitracline in addition to internal waves canaffect the availability of nitrate to the inner shelf (Lucas et al., 2011).Sub-mesoscale coastal eddies represent another potential means ofnutrient transport to kelp forests (Bassin et al., 2005).
Macrocystis pyrifera is one of the few algae that possess sievetube elements that allow for internal transport of metabolites suchas mannitol and amino acids (Sykes, 1908; Schmitz and Srivastava,1979; Manley, 1983). One kelp individual could be limited in bothlight (at depth) and nutrients (at the surface) at the same time, yetstill be able to grow. The existence of the sieve tube transportsystem, which spans the water column, provides a mechanism bywhich deeper-water nitrate can support growth despite low nitratelevels at the ocean surface. This system may help explain whyM. pyrifera also can sustain growth in the absence of surfacenutrients for limited periods of time. Starting with high internal
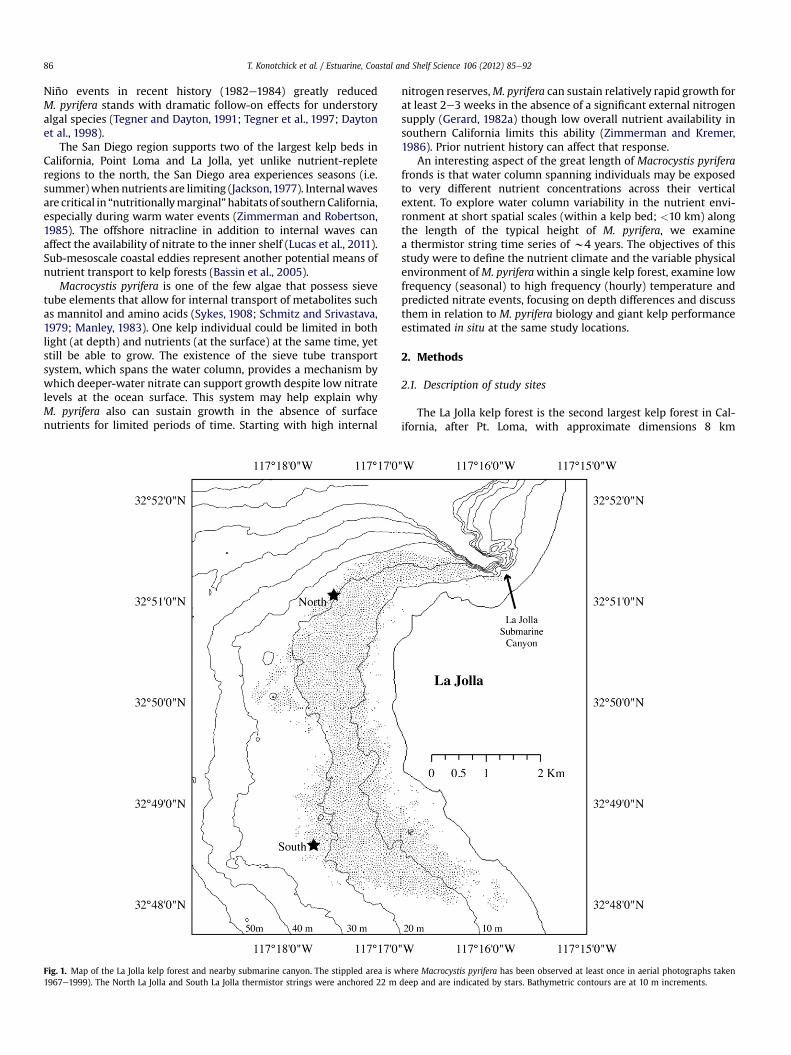
Fig. 1. Map of the La Jolla kelp forest and nearby submarine canyon. The stippled area is w1967e1999). The North La Jolla and South La Jolla thermistor strings were anchored 22 m
nitrogen reserves,M. pyrifera can sustain relatively rapid growth forat least 2e3 weeks in the absence of a significant external nitrogensupply (Gerard, 1982a) though low overall nutrient availability insouthern California limits this ability (Zimmerman and Kremer,1986). Prior nutrient history can affect that response.
An interesting aspect of the great length of Macrocystis pyriferafronds is that water column spanning individuals may be exposedto very different nutrient concentrations across their verticalextent. To explore water column variability in the nutrient envi-ronment at short spatial scales (within a kelp bed; <10 km) alongthe length of the typical height of M. pyrifera, we examinea thermistor string time series of w4 years. The objectives of thisstudy were to define the nutrient climate and the variable physicalenvironment ofM. pyriferawithin a single kelp forest, examine lowfrequency (seasonal) to high frequency (hourly) temperature andpredicted nitrate events, focusing on depth differences and discussthem in relation to M. pyrifera biology and giant kelp performanceestimated in situ at the same study locations.
2. Methods
2.1. Description of study sites
The La Jolla kelp forest is the second largest kelp forest in Cal-ifornia, after Pt. Loma, with approximate dimensions 8 km
here Macrocystis pyrifera has been observed at least once in aerial photographs takendeep and are indicated by stars. Bathymetric contours are at 10 m increments.
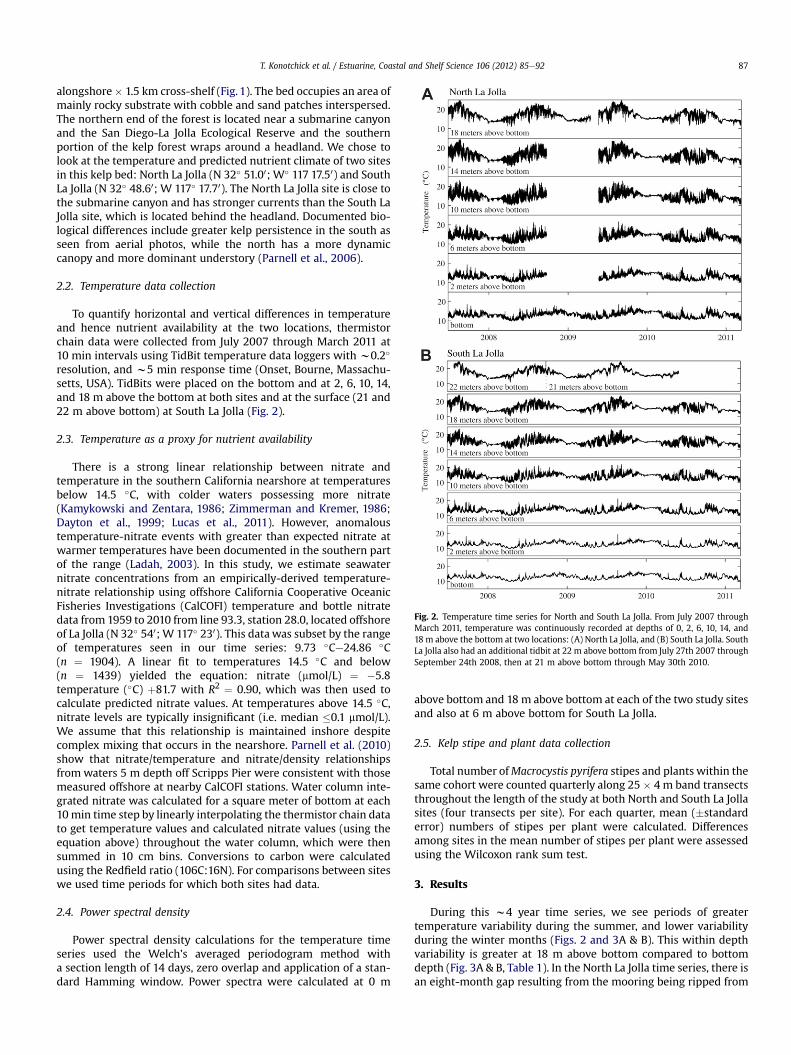
Fig. 2. Temperature time series for North and South La Jolla. From July 2007 throughMarch 2011, temperature was continuously recorded at depths of 0, 2, 6, 10, 14, and18 m above the bottom at two locations: (A) North La Jolla, and (B) South La Jolla. SouthLa Jolla also had an additional tidbit at 22 m above bottom from July 27th 2007 throughSeptember 24th 2008, then at 21 m above bottom through May 30th 2010.
T. Konotchick et al. / Estuarine, Coastal and Shelf Science 106 (2012) 85e92 87
alongshore� 1.5 km cross-shelf (Fig. 1). The bed occupies an area ofmainly rocky substrate with cobble and sand patches interspersed.The northern end of the forest is located near a submarine canyonand the San Diego-La Jolla Ecological Reserve and the southernportion of the kelp forest wraps around a headland. We chose tolook at the temperature and predicted nutrient climate of two sitesin this kelp bed: North La Jolla (N 32� 51.00; W� 117 17.50) and SouthLa Jolla (N 32� 48.60; W 117� 17.70). The North La Jolla site is close tothe submarine canyon and has stronger currents than the South LaJolla site, which is located behind the headland. Documented bio-logical differences include greater kelp persistence in the south asseen from aerial photos, while the north has a more dynamiccanopy and more dominant understory (Parnell et al., 2006).
2.2. Temperature data collection
To quantify horizontal and vertical differences in temperatureand hence nutrient availability at the two locations, thermistorchain data were collected from July 2007 through March 2011 at10 min intervals using TidBit temperature data loggers with w0.2�
resolution, and w5 min response time (Onset, Bourne, Massachu-setts, USA). TidBits were placed on the bottom and at 2, 6, 10, 14,and 18 m above the bottom at both sites and at the surface (21 and22 m above bottom) at South La Jolla (Fig. 2).
2.3. Temperature as a proxy for nutrient availability
There is a strong linear relationship between nitrate andtemperature in the southern California nearshore at temperaturesbelow 14.5 �C, with colder waters possessing more nitrate(Kamykowski and Zentara, 1986; Zimmerman and Kremer, 1986;Dayton et al., 1999; Lucas et al., 2011). However, anomaloustemperature-nitrate events with greater than expected nitrate atwarmer temperatures have been documented in the southern partof the range (Ladah, 2003). In this study, we estimate seawaternitrate concentrations from an empirically-derived temperature-nitrate relationship using offshore California Cooperative OceanicFisheries Investigations (CalCOFI) temperature and bottle nitratedata from 1959 to 2010 from line 93.3, station 28.0, located offshoreof La Jolla (N 32� 540; W 117� 230). This data was subset by the rangeof temperatures seen in our time series: 9.73 �Ce24.86 �C(n ¼ 1904). A linear fit to temperatures 14.5 �C and below(n ¼ 1439) yielded the equation: nitrate (mmol/L) ¼ �5.8temperature (�C) þ81.7 with R2 ¼ 0.90, which was then used tocalculate predicted nitrate values. At temperatures above 14.5 �C,nitrate levels are typically insignificant (i.e. median �0.1 mmol/L).We assume that this relationship is maintained inshore despitecomplex mixing that occurs in the nearshore. Parnell et al. (2010)show that nitrate/temperature and nitrate/density relationshipsfrom waters 5 m depth off Scripps Pier were consistent with thosemeasured offshore at nearby CalCOFI stations. Water column inte-grated nitrate was calculated for a square meter of bottom at each10min time step by linearly interpolating the thermistor chain datato get temperature values and calculated nitrate values (using theequation above) throughout the water column, which were thensummed in 10 cm bins. Conversions to carbon were calculatedusing the Redfield ratio (106C:16N). For comparisons between siteswe used time periods for which both sites had data.
2.4. Power spectral density
Power spectral density calculations for the temperature timeseries used the Welch’s averaged periodogram method witha section length of 14 days, zero overlap and application of a stan-dard Hamming window. Power spectra were calculated at 0 m
above bottom and 18 m above bottom at each of the two study sitesand also at 6 m above bottom for South La Jolla.
2.5. Kelp stipe and plant data collection
Total number ofMacrocystis pyrifera stipes and plants within thesame cohort were counted quarterly along 25 � 4 m band transectsthroughout the length of the study at both North and South La Jollasites (four transects per site). For each quarter, mean (�standarderror) numbers of stipes per plant were calculated. Differencesamong sites in the mean number of stipes per plant were assessedusing the Wilcoxon rank sum test.
3. Results
During this w4 year time series, we see periods of greatertemperature variability during the summer, and lower variabilityduring the winter months (Figs. 2 and 3A & B). This within depthvariability is greater at 18 m above bottom compared to bottomdepth (Fig. 3A & B, Table 1). In the North La Jolla time series, there isan eight-month gap resulting from the mooring being ripped from
A
B
C
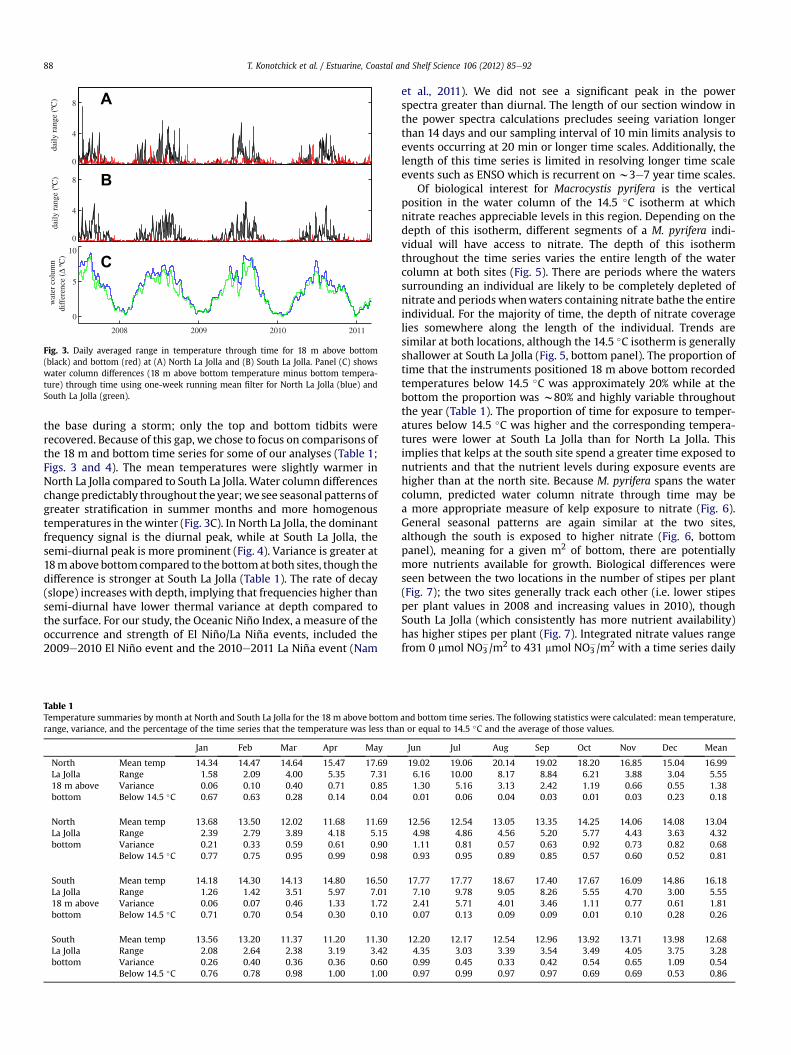
Fig. 3. Daily averaged range in temperature through time for 18 m above bottom(black) and bottom (red) at (A) North La Jolla and (B) South La Jolla. Panel (C) showswater column differences (18 m above bottom temperature minus bottom tempera-ture) through time using one-week running mean filter for North La Jolla (blue) andSouth La Jolla (green).
T. Konotchick et al. / Estuarine, Coastal and Shelf Science 106 (2012) 85e9288
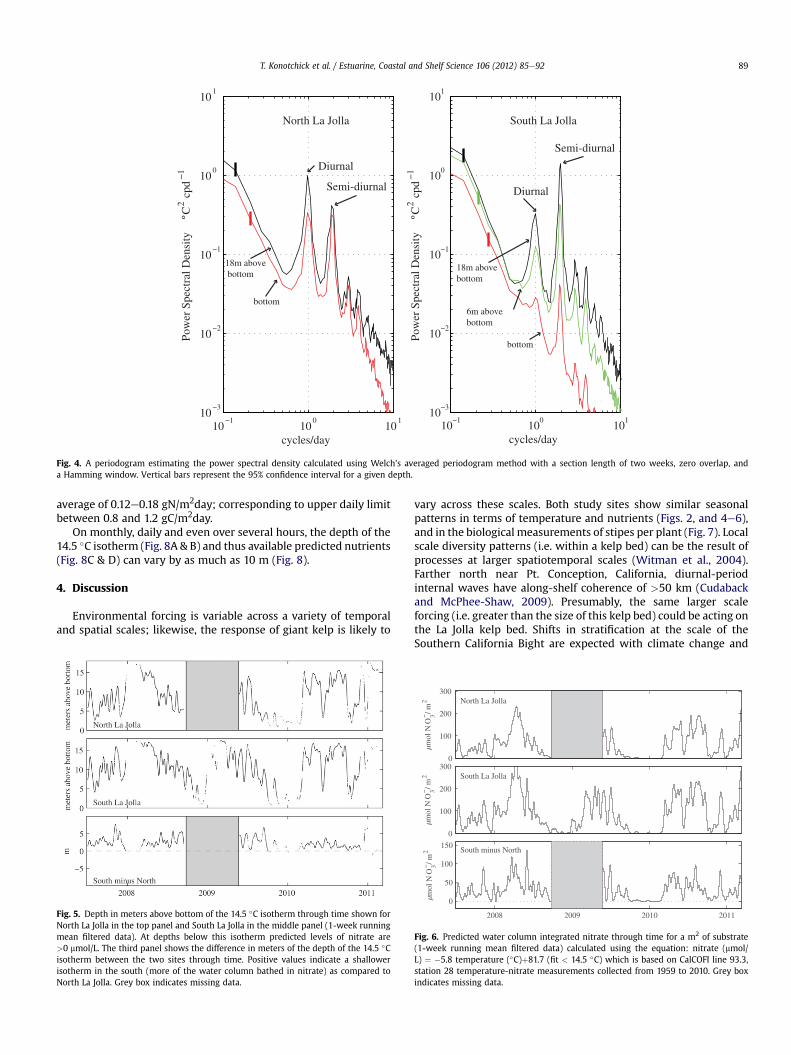
the base during a storm; only the top and bottom tidbits wererecovered. Because of this gap, we chose to focus on comparisons ofthe 18 m and bottom time series for some of our analyses (Table 1;Figs. 3 and 4). The mean temperatures were slightly warmer inNorth La Jolla compared to South La Jolla. Water column differenceschange predictably throughout the year;we see seasonal patterns ofgreater stratification in summer months and more homogenoustemperatures in the winter (Fig. 3C). In North La Jolla, the dominantfrequency signal is the diurnal peak, while at South La Jolla, thesemi-diurnal peak is more prominent (Fig. 4). Variance is greater at18mabove bottomcompared to the bottomat both sites, though thedifference is stronger at South La Jolla (Table 1). The rate of decay(slope) increases with depth, implying that frequencies higher thansemi-diurnal have lower thermal variance at depth compared tothe surface. For our study, the Oceanic Niño Index, a measure of theoccurrence and strength of El Niño/La Niña events, included the2009e2010 El Niño event and the 2010e2011 La Niña event (Nam
Table 1Temperature summaries by month at North and South La Jolla for the 18 m above bottomrange, variance, and the percentage of the time series that the temperature was less tha
Jan Feb Mar Apr May
North Mean temp 14.34 14.47 14.64 15.47 17.69La Jolla Range 1.58 2.09 4.00 5.35 7.3118 m above Variance 0.06 0.10 0.40 0.71 0.85bottom Below 14.5 �C 0.67 0.63 0.28 0.14 0.04
North Mean temp 13.68 13.50 12.02 11.68 11.69La Jolla Range 2.39 2.79 3.89 4.18 5.15bottom Variance 0.21 0.33 0.59 0.61 0.90
Below 14.5 �C 0.77 0.75 0.95 0.99 0.98
South Mean temp 14.18 14.30 14.13 14.80 16.50La Jolla Range 1.26 1.42 3.51 5.97 7.0118 m above Variance 0.06 0.07 0.46 1.33 1.72bottom Below 14.5 �C 0.71 0.70 0.54 0.30 0.10
South Mean temp 13.56 13.20 11.37 11.20 11.30La Jolla Range 2.08 2.64 2.38 3.19 3.42bottom Variance 0.26 0.40 0.36 0.36 0.60
Below 14.5 �C 0.76 0.78 0.98 1.00 1.00
et al., 2011). We did not see a significant peak in the powerspectra greater than diurnal. The length of our section window inthe power spectra calculations precludes seeing variation longerthan 14 days and our sampling interval of 10 min limits analysis toevents occurring at 20 min or longer time scales. Additionally, thelength of this time series is limited in resolving longer time scaleevents such as ENSO which is recurrent on w3e7 year time scales.
Of biological interest for Macrocystis pyrifera is the verticalposition in the water column of the 14.5 �C isotherm at whichnitrate reaches appreciable levels in this region. Depending on thedepth of this isotherm, different segments of a M. pyrifera indi-vidual will have access to nitrate. The depth of this isothermthroughout the time series varies the entire length of the watercolumn at both sites (Fig. 5). There are periods where the waterssurrounding an individual are likely to be completely depleted ofnitrate and periods whenwaters containing nitrate bathe the entireindividual. For the majority of time, the depth of nitrate coveragelies somewhere along the length of the individual. Trends aresimilar at both locations, although the 14.5 �C isotherm is generallyshallower at South La Jolla (Fig. 5, bottom panel). The proportion oftime that the instruments positioned 18 m above bottom recordedtemperatures below 14.5 �C was approximately 20% while at thebottom the proportion was w80% and highly variable throughoutthe year (Table 1). The proportion of time for exposure to temper-atures below 14.5 �C was higher and the corresponding tempera-tures were lower at South La Jolla than for North La Jolla. Thisimplies that kelps at the south site spend a greater time exposed tonutrients and that the nutrient levels during exposure events arehigher than at the north site. Because M. pyrifera spans the watercolumn, predicted water column nitrate through time may bea more appropriate measure of kelp exposure to nitrate (Fig. 6).General seasonal patterns are again similar at the two sites,although the south is exposed to higher nitrate (Fig. 6, bottompanel), meaning for a given m2 of bottom, there are potentiallymore nutrients available for growth. Biological differences wereseen between the two locations in the number of stipes per plant(Fig. 7); the two sites generally track each other (i.e. lower stipesper plant values in 2008 and increasing values in 2010), thoughSouth La Jolla (which consistently has more nutrient availability)has higher stipes per plant (Fig. 7). Integrated nitrate values rangefrom 0 mmol NO3
�/m2 to 431 mmol NO3�/m2 with a time series daily
and bottom time series. The following statistics were calculated: mean temperature,n or equal to 14.5 �C and the average of those values.
Jun Jul Aug Sep Oct Nov Dec Mean
19.02 19.06 20.14 19.02 18.20 16.85 15.04 16.996.16 10.00 8.17 8.84 6.21 3.88 3.04 5.551.30 5.16 3.13 2.42 1.19 0.66 0.55 1.380.01 0.06 0.04 0.03 0.01 0.03 0.23 0.18
12.56 12.54 13.05 13.35 14.25 14.06 14.08 13.044.98 4.86 4.56 5.20 5.77 4.43 3.63 4.321.11 0.81 0.57 0.63 0.92 0.73 0.82 0.680.93 0.95 0.89 0.85 0.57 0.60 0.52 0.81
17.77 17.77 18.67 17.40 17.67 16.09 14.86 16.187.10 9.78 9.05 8.26 5.55 4.70 3.00 5.552.41 5.71 4.01 3.46 1.11 0.77 0.61 1.810.07 0.13 0.09 0.09 0.01 0.10 0.28 0.26
12.20 12.17 12.54 12.96 13.92 13.71 13.98 12.684.35 3.03 3.39 3.54 3.49 4.05 3.75 3.280.99 0.45 0.33 0.42 0.54 0.65 1.09 0.540.97 0.99 0.97 0.97 0.69 0.69 0.53 0.86
10−1
100
101
10−3
10−2
10−1
100
101
cycles/day
Pow
er S
pect
ral D
ensi
tyºC
2 cpd
−1
North La Jolla
18m above bottom
bottom
10−1
100
101
10−3
10−2
10−1
100
101
cycles/day
Pow
er S
pect
ral D
ensi
tyºC
2 cpd
−1
6m abovebottom
South La Jolla
18m abovebottom
bottom
Diurnal
Semi-diurnal Diurnal
Semi-diurnal
Fig. 4. A periodogram estimating the power spectral density calculated using Welch’s averaged periodogram method with a section length of two weeks, zero overlap, anda Hamming window. Vertical bars represent the 95% confidence interval for a given depth.
T. Konotchick et al. / Estuarine, Coastal and Shelf Science 106 (2012) 85e92 89
average of 0.12e0.18 gN/m2day; corresponding to upper daily limitbetween 0.8 and 1.2 gC/m2day.
On monthly, daily and even over several hours, the depth of the14.5 �C isotherm (Fig. 8A & B) and thus available predicted nutrients(Fig. 8C & D) can vary by as much as 10 m (Fig. 8).
4. Discussion
Environmental forcing is variable across a variety of temporaland spatial scales; likewise, the response of giant kelp is likely to
Fig. 5. Depth in meters above bottom of the 14.5 �C isotherm through time shown forNorth La Jolla in the top panel and South La Jolla in the middle panel (1-week runningmean filtered data). At depths below this isotherm predicted levels of nitrate are>0 mmol/L. The third panel shows the difference in meters of the depth of the 14.5 �Cisotherm between the two sites through time. Positive values indicate a shallowerisotherm in the south (more of the water column bathed in nitrate) as compared toNorth La Jolla. Grey box indicates missing data.
vary across these scales. Both study sites show similar seasonalpatterns in terms of temperature and nutrients (Figs. 2, and 4e6),and in the biological measurements of stipes per plant (Fig. 7). Localscale diversity patterns (i.e. within a kelp bed) can be the result ofprocesses at larger spatiotemporal scales (Witman et al., 2004).Farther north near Pt. Conception, California, diurnal-periodinternal waves have along-shelf coherence of >50 km (Cudabackand McPhee-Shaw, 2009). Presumably, the same larger scaleforcing (i.e. greater than the size of this kelp bed) could be acting onthe La Jolla kelp bed. Shifts in stratification at the scale of theSouthern California Bight are expected with climate change and
0
100
200
300
µmol
NO
3−/ m
2 North La Jolla
0
100
200
300
µmol
NO
3−/ m
2 South La Jolla
2008 2009 2010 2011
0
50
100
150
µmol
NO
3−/ m
2 South minus North
Fig. 6. Predicted water column integrated nitrate through time for a m2 of substrate(1-week running mean filtered data) calculated using the equation: nitrate (mmol/L) ¼ �5.8 temperature (�C)þ81.7 (fit < 14.5 �C) which is based on CalCOFI line 93.3,station 28 temperature-nitrate measurements collected from 1959 to 2010. Grey boxindicates missing data.

2008 2009 2010 20110
10
20
30
40
50
60
# of
stip
es/p
lant
(m
ean)
*
*
North La Jolla
South La Jolla
Fig. 7. Quarterly averaged stipes per plant at North La Jolla (solid symbols) and SouthLa Jolla (open symbols) through time. Error bars indicate standard error and asterisksindicate significant differences at a � 0.05 according to Wilcoxon rank sum test.
T. Konotchick et al. / Estuarine, Coastal and Shelf Science 106 (2012) 85e9290
would likely affect the physical forcing of giant kelp. Alongshorewinds can also affect nearshore cross-shelf circulation at kilometerscale distances (Pringle and Riser, 2003).
Smaller scale differences (i.e. within a kelp bed; Figs. 3C and4e6) in temperature and nutrient exposure could potentially beexplained by the complex undersea topography and nearby head-land which may be setting up complex secondary circulation flowsin the nearshore (Wolanski and Hamner, 1988). Both physicaldifferences (i.e. shelf nearby canyon topography, currents) andbiological structure (i.e. biogenic alteration of flow) may alter thephysical environment kelps experience. Nutrient concentrationsvary in the alongshore direction (Jackson, 1977). The physical
Fig. 8. Linearly interpolated temperature plot using 6 h running mean filtered temperatur(second panel), as an example demonstrating that the depth of the 14.5 �C isotherm can visotherm. The bottom two panels are interpolated predicted nitrate (calculated as in Fig. 7
structure of the kelp bed itself attenuates horizontal transport andvertical mixing (Jackson and Winant, 1983; Jackson, 1998; Rosmanet al., 2010) which can have effects on nutrient availability. Themagnitude of this effect scales to the size of the bed (Gaylord et al.,2007). Evenwith a similar nitrate climate, growth, morphology andtissue composition of giant kelp can vary within a kelp forest(Stewart et al., 2008). Thus, within-bed nutrient gradients caninfluence morphology indicating that the nitrate climate can affectchange in regulatory mechanisms and metabolism of kelp. Signif-icant differences between sites in stipes per plant were seen in twoquarters during 2008 (Fig. 7). These biological differences corre-sponded to the highest integrated nitrate peaks of the study’s timeseries (Fig. 6).
The nutrient and temperature history can be quite distinct atdifferent depths: the bottom is characterized by cold temperatureswith warm water deviations, the mid-water depths (i.e. the ther-mocline) has variation in both directions; and the surface warmwater is punctuated by cold spikes (Fig. 2). This variable tempera-ture and nutrient environment has different biological relevancedepending on depth. The majority of photosynthesis occurs in thesurface canopy with half of the standing crop lying between thesurface and 1.5 m as fronds reach and spread along the surface(McFarland and Prescott, 1959; Towle and Pearse, 1973; Gerard,1986). Nitrate and colder temperatures are important for recruit-ment and juvenileMacrocystis pyrifera growth, processes that occurnear the benthos (Dean and Jacobsen, 1984). Nutrient uptake andphotosynthetic capacity of blades will vary depending on ambientconditions at a given depth. For example, nitrate uptake is higher inthe dark, a factor correlated with depth in the kelp forest (Wheelerand Srivastava, 1984).
It is also important to consider the total integrated kelp biomassat different depths as this may potentially affect the total amount ofavailable surface for nitrate uptake in a kelp individual. A largefraction of the kelp’s surface area floats at or near the surface; up to60% of the total weight of plant can be found between the surface
e data for the month of July 2009 (top panel) and an expanded view of July 19e21stary by several meters over the span of a few hours. Black lines represent the 14.5 �C) for the same time periods as the top two panels.
T. Konotchick et al. / Estuarine, Coastal and Shelf Science 106 (2012) 85e92 91
and a depth of 4 ft, though the proportion of tissues is highlyvariable amongst plants (North and Hubbs,1968). Measurements often 60 ft fronds from La Jolla showedweights concentrated near theupper end; 75% of the cumulative weight was in the upper half offronds (North, 1971). A recent study also showed higher ratios offrond wet mass (kg) to frond length (m) for canopy fronds vs.subsurface fronds (Reed et al., 2009). Differences in nitrateconcentrations in the upper portions may have a proportionallylarger effect on kelp physiology due to higher biomass and surfacearea at these shallower depths.
Warmwater and accompanying low surface nutrient conditionsfound during the late summer and more pronounced during ElNiño years, may increase with climate change. Hydrographic timeseries of the upper 500 m of the coast of southern California anddaily temperature records at Scripps Institution of Oceanography’spier have documented the rise in sea surface temperature over thelast several decades (Roemmich, 1992). Climate and wind patternsare likely to change due to changes in landesea interactions leadingto changes in upwelling (Bakun, 1990; Diffenbaugh et al., 2004;King et al., 2011). As spring (70%) and winter (10%) upwellingprovide 80% of total nutrient input in the Southern California Bight(McPhee-Shaw et al., 2007), this could have significant impacts onMacrocystis nutrition and health (Doney et al., 2012).
Biological impacts resulting from climate change driven envi-ronmental changes, such as altered upwelling strength, will likelyvary depending on the geographic location of the kelp bed.Geographically isolated populations have exhibited environmen-tally consistent physiological specialization to ambient nutrientavailability including growth rates, tissue nitrogen content andamino acid concentrations (Espinoza and Chapman, 1983;Kopczak et al., 1991). Kopczak et al. (1991) measured theresponses of Macrocystis to nitrate availability from populations inMonterey Bay (high nutrients, affected by storms), Santa Barbara(a transition zone), and Santa Catalina (low wave stress, lownutrients). While maximum growth rates were similar amongsites, those rates occurred at different nitrate concentrations;maximum rates occurred at lower nitrate concentrations for thealgae that were acclimated to more oligotrophic conditions. Thesites also differed in the amount of tissue nitrogen content, withmore tissue nitrogen in algae from more oligotrophic conditions.Thus, isolated populations have evolved different responses tonitrate availability. This is in concordance with earlier workfinding growth on restricted nitrogen supply leads to an increasedability to take up NO3
� from low concentrations (Haines andWheeler, 1978). Nutrients may be especially important forrecruitment and survival at the equatorward range limits of thespecies where low nutrient conditions are more prevalent(Hernández-Carmona et al., 2001).
While the physical environment structures kelp communitieson a variety of scales, that is not the only factor affecting theirpersistence. Biological processes including consumption by urchinsor competition with other species may also play structuring roles(Dayton et al., 1984,1999; Dayton,1985) and these factorsmay haveelements controlled by the physical environment. Strongercurrents in the northern part of the La Jolla bed, or internal tidalbores, could bring in an increased flux of urchin larvae (Pineda,1991, 1999; Parnell et al., 2006). Alternatively, the stronger persis-tence of the kelp forest in South La Jolla and its potential to decreasewater flow (Rosman et al., 2010), could serve to retain kelp sporeswithin that area, acting as a positive feedback. Epibionts mayactually serve a beneficial role, providing an alternate nitrogensource via ammonium to kelp (Hepburn and Hurd, 2005). Also,with higher environmental nitrate levels, Macrocystis pyriferacanopy cover would be expected to increase, resulting in less lightreaching the benthos, making it difficult for other algae to compete.
Daily changes in the thermocline depth are largely a function oftidal and internal wave activity. From power spectra we see theimportance of diurnal and semi-diurnal tidal energy altering thedepth of the thermocline and nitracline in this time series (Fig. 4).The structure of the kelp bed can change current flow, though thesemi-diurnal frequency has the least damping (Jackson andWinant, 1983). The 14.5 �C isotherm can vary by several metersover the span of minutes to hours (Figs. 5 and 8), and Macrocystispyrifera is able to take up nutrients on these time scales (Haines andWheeler, 1978; Haxen and Lewis, 1981). The arrival of cold-water,high nutrient internal waves, which can change the nutrientlevels of the water surrounding kelp on the order of minutes tohours, is an especially important nutrient input mechanism duringsummer stratified months (McPhee-Shaw et al., 2007). It is largelyunknown exactly how kelps are reacting physiologically to theseshort time scale events and utilizing reserves under limitingconditions. However, a recent study observed increased nitrogenlevels in algal tissues in response to a higher ambient internal wavedriven nitrate environment in the intertidal green alga Ulva lactuca(Pérez-Mayorga et al., 2011). Genomic-enabled approaches areincreasingly being applied in marine ecology, especially as a way toassess physiological response to environmental conditions (Dupontet al., 2007; Hofmann and Place, 2007). Thewater column spanningM. pyrifera is a unique system with which to explore physiologicalresponse to measured physical environmental gradients usingthese approaches.
The methods and analysis presented here are a simple, yetilluminating way to monitor nutrient influences in kelp forests.Time series of expanded duration would allow for characterizationof longer time scale events such as ENSO. Expanding this approachby coupling telemetered thermistor chainwith productivity studiesand satellite imagery (e.g., Cavanaugh et al., 2010) in several kelpbeds along the coast could potentially provide resource managerswith predictive capabilities of changes in productivity or evencollapse. Future studies should include flow measurements toresolve flux measurements. The development and integration oftools to study Macrocystis pyrifera physiological response on shorttime scales would also be a valuable addition. It is important toknow the time and space scales of hydrographic variation in orderto understand, measure and study the time and space scales of kelpbiological response (Denny et al., 2004).
Acknowledgments
A National Science Foundation Graduate Research Fellowshipand Mia J. Tegner Fellowship for Coastal Ecology Fieldworkprovided funding support (TK). We would like to thank K. Riser andR. Darrow for their efforts in the field. We appreciate the discussionwith and comments from C. Dupont, L.A. Levin, and three anony-mous reviewers, which significantly improved the manuscript.
References
Bakun, A., 1990. Global climate change and intensification of coastal oceanupwelling. Science 247, 198e201.
Bassin, C., Washburn, L., Brzezinski, M., McPhee-Shaw, E., 2005. Sub-mesoscalecoastal eddies observed by high frequency radar: a new mechanism for deliv-ering nutrients to kelp forests in the Southern California Bight. GeophysicalResearch Letters 32, L12604.
Cavanaugh, K., Siegel, D., Kinlan, B., Reed, D., 2010. Scaling giant kelp fieldmeasurements to regional scales using satellite observations. Marine EcologyProgress Series 403, 13e27.
Cudaback, C., McPhee-Shaw, E., 2009. Diurnal-period internal waves near PointConception, California. Estuarine, Coastal and Shelf Science 83, 349e359.
Dayton, P., Tegner, M., Edwards, P., Riser, K., 1998. Sliding baselines, ghosts, andreduced expectations in kelp forest communities. Ecological Applications 8,309e322.
T. Konotchick et al. / Estuarine, Coastal and Shelf Science 106 (2012) 85e9292
Dayton, P., Tegner, M., Edwards, P., Riser, K., 1999. Temporal and spatial scales ofkelp demography: the role of oceanographic climate. Ecological Monographs69, 219e250.
Dayton, P.K., 1985. Ecology of kelp communities. Annual Review of Ecology andSystematics 16, 215e245.
Dayton, P.K., Currie, V., Gerrodette, T., Keller, B.D., Rosenthal, R., Tresca, D.V., 1984.Patch dynamics and stability of some California kelp communities. EcologicalMonographs 54, 253.
Dean, T., Jacobsen, F., 1984. Growth of juvenileMacrocystis pyrifera (Laminariales) inrelation to environmental factors. Marine Biology 83, 301e311.
Denny, M., Helmuth, B., Leonard, G., Harley, C., Hunt, L., Nelson, E., 2004. Quanti-fying scale in ecology: lessons from a wave-swept shore. Ecological Mono-graphs 74, 513e532.
Diffenbaugh, N., Snyder, M., Sloan, L., 2004. Could CO2-induced land-cover feed-backs alter near-shore upwelling regimes? Proceedings of the NationalAcademy of Sciences 101, 27e32.
Doney, S., Ruckelshaus, M., Duffy, J., Barry, J., Chan, F., English, C., Galindo, H.,Grebmeier, J., Hollowed, A.B., Knowlton, N., et al., 2012. Climate change impactson marine ecosystems. Annual Review of Marine Science 4, 11e37.
Dupont, S., Wilson, K., Obst, M., Sköld, H., Nakano, H., Thorndyke, M., 2007. Marineecological genomics: when genomics meets marine ecology. Marine EcologyProgress Series 332, 257e273.
Espinoza, J., Chapman, A., 1983. Ecotypic differentiation of Laminaria longicruris inrelation to seawater nitrate concentration. Marine Biology 74, 213e218.
Gaylord, B., Rosman, J., Reed, D., Koseff, J., Fram, J., MacIntyre, S., Arkema, K.,McDonald, C., Brzezinski, M., Largier, J., et al., 2007. Spatial patterns of flow andtheir modification within and around a giant kelp forest. Limnology andOceanography 52, 1838e1852.
Gerard, V., 1982a. Growth and utilization of internal nitrogen reserves by the giantkelp Macrocystis pyrifera in a low-nitrogen environment. Marine Biology 66,27e35.
Gerard, V., 1982b. In situ rates of nitrate uptake by giant kelp, Macrocystis pyrifera(L.) C. Agardh: tissue differences, environmental effects, and predictions ofnitrogen-limited growth. Journal of Experimental Marine Biology and Ecology62, 211e224.
Gerard, V., 1986. Photosynthetic characteristics of the giant kelp (Macrocystis pyr-ifera) determined in situ. Marine Biology 90, 473e482.
Haines, K., Wheeler, P., 1978. Ammonium and nitrate uptake by the marinemacrophytes Hypnea musciformis (Rhodophyta) and Macrocystis pyrifera(Phaeophyta). Journal of Phycology 14, 319e324.
Haxen, P., Lewis, O., 1981. Nitrate assimilation in the marine kelp, Macrocystisangustifolia (Phaeophyceae). Botanica Marina 24, 631e635.
Hepburn, C., Hurd, C., 2005. Conditional mutualism between the giant kelp Mac-rocystis pyrifera and colonial epifauna. Marine Ecology Progress Series 302,37e48.
Hernández-Carmona, G., Robledo, D., Serviere-Zaragoza, E., 2001. Effect of nutrientavailability on Macrocystis pyrifera recruitment and survival near its southernlimit off Baja California. Botanica Marina 44, 221e229.
Hofmann, G., Place, S., 2007. Genomics-enabled research in marine ecology: chal-lenges, risks and pay-offs. Marine Ecology Progress Series 332, 249e255.
Jackson, G., 1977. Nutrients and production of giant kelp, Macrocystis pyrifera, offsouthern California. Limnology and Oceanography 22, 979e995.
Jackson, G., 1998. Currents in the high drag environment of a coastal kelp stand offCalifornia. Continental Shelf Research 17, 1913e1928.
Jackson, G., Winant, C., 1983. Effect of a kelp forest on coastal currents. ContinentalShelf Research 2, 75e80.
Kamykowski, D., Zentara, S.-J., 1986. Predicting plant nutrient concentrations fromtemperature and sigma-t in the upper kilometer of the world ocean. Deep SeaResearch 33, 89e105.
King, J., Agostini, V., Harvey, C., McFarlane, G., Foreman, M., Overland, J.,DiLorenzo, E., Bond, N., Aydin, K., 2011. Climate forcing and the CaliforniaCurrent ecosystem. ICES Journal of Marine Science 68, 1199e1216.
Kopczak, C., Zimmerman, R., Kremer, J., 1991. Variation in nitrogen physiology andgrowth among geographically isolated populations of the giant kelp, Macro-cystis pyrifera (Phaeophyta). Journal of Phycology 27, 149e158.
Ladah, L.B., 2003. The shoaling of nutrient-enriched subsurface waters as a mech-anism to sustain primary productivity off Central Baja California during El Niñowinters. Journal of Marine Systems 42, 145e152.
Lucas, A., Dupont, C., Tai, V., Largier, J., Palenik, B., Franks, P., 2011. The green ribbon:multiscale physical control of phytoplankton productivity and communitystructure over a narrow continental shelf. Limnology and Oceanography 56,611e626.
Manley, S., 1983. Composition of sieve tube sap from Macrocystis pyrifera (Phaeo-phyta) with emphasis on the inorganic constituents. Journal of Phycology 19,118e121.
Mann, K., 2000. Subtidal rocky shores. In: Ecology of Coastal Waters. BlackwellScience, Malden, MA, pp. 191e217.
McFarland, W., Prescott, J., 1959. Standing Crop, Chlorophyll Content and in situMetabolism of a Giant Kelp Community in Southern California, 6. Publicationsof the Institute of Marine Science. 109e132.
McPhee-Shaw, E., Siegel, D., Washburn, L., Brzezinski, M., Jones, J., Leydecker, A.,Melack, J., 2007. Mechanisms for nutrient delivery to the inner shelf: obser-vations from the Santa Barbara Channel. Limnology and Oceanography 52,1748e1766.
Nam, S., Kim, H., Send, U., 2011. Amplification of hypoxic and acidic events by LaNiña conditions on the continental shelf off California. Geophysical ResearchLetters 38, L22602.
North, W., 1971. The biology of giant kelp beds (Macrocystis) in California. BeihefteZur Nova Hedwigia, Heft.
North, W., Hubbs, C., 1968. Fish Bulletin 139: Utilization of Kelp-bed Resources inSouthern California. Department of Fish and Game, State of California.
North, W., Zimmerman, R., 1984. Influences of macronutrients and water temper-atures on summertime survival of Macrocystis canopies. Hydrobiologia 116/117,419e424.
Parnell, P., Dayton, P., Lennert-Cody, C., Rasmussen, L., Leichter, J., 2006. Marinereserve design: optimal size, habitats, species affinities, diversity, and oceanmicroclimate. Ecological Applications 16, 945e962.
Parnell, P., Miller, E., Lennert-Cody, C., Dayton, P., Carter, M., Stebbins, T., 2010. Theresponse of giant kelp (Macrocystis pyrifera) in southern California to low-frequency climate forcing. Limnology and Oceanography 55, 2686e2702.
Pérez-Mayorga, D., Ladah, L., Zertuche-Gonzalez, J., Leichter, J., Filonov, A., Lavin, M.,2011. Nitrogen uptake and growth by the opportunistic macroalga Ulva lactuca(Linnaeus) during the internal tide. Journal of Experimental Marine Biology andEcology 406, 108e115.
Pineda, J., 1991. Predictable upwelling and the shoreward transport of planktoniclarvae by internal tidal bores. Science 253, 548e551.
Pineda, J., 1999. Circulation and larval distribution in internal tidal bore warmfronts. Limnology and Oceanography 44, 1400e1414.
Pringle, J., Riser, K., 2003. Remotely forced nearshore upwelling in Southern Cal-ifornia. Journal of Geophysical Research 108, 3131.
Reed, D., Rassweiler, A., Arkema, K., 2009. Density derived estimates of standingcrop and net primary production in the giant kelp Macrocystis pyrifera. MarineBiology 156, 2077e2083.
Roemmich, D., 1992. Ocean warming and sea level rise along the southwest U.S.coast. Science 257, 373e375.
Rosman, J., Monismith, S., Denny, M., Koseff, J., 2010. Currents and turbulencewithin a kelp forest (Macrocystis pyrifera): insights from a dynamically scaledlaboratory model. Limnology and Oceanography 55, 1145e1158.
Schmitz, K., Srivastava, L., 1979. Long distance transport in Macrocystis integrifolia.I. translocation of 14C-labeled assimilates. Plant Physiology 63, 995e1002.
Seymour, R., Tegner, M., Dayton, P., Parnell, P., 1989. Storm wave induced mortalityof giant kelp, Macrocystis pyrifera, in Southern California. Estuarine, Coastal andShelf Science 28, 277e292.
Steneck, R., Graham, M., Bourque, B., Corbett, D., Erlandson, J., Estes, J., Tegner, M.,2002. Kelp forest ecosystems: biodiversity, stability, resilience and future.Environmental Conservation 29, 436e459.
Stewart, H., Fram, J., Reed, D., Williams, S., Brzezinski, M., MacIntyre, S., Gaylord, B.,2008. Differences in growth, morphology and tissue carbon and nitrogen ofMacrocystis pyrifera within and at the outer edge of a giant kelp forest in Cal-ifornia, USA. Marine Ecology Progress Series 375, 101e112.
Sykes, M., 1908. Anatomy and histology of Macrocystis pyrifera and Laminaria sac-charina. Annals of Botany 22, 291e325.
Tegner, M., Dayton, P., 1991. Sea urchins, El Niños and the long term stability ofsouthern California kelp forest communities. Marine Ecology Progress Series 77,49e63.
Tegner, M., Dayton, P., Edwards, P., Riser, K., 1997. Large-scale, low-frequencyoceanographic effects on kelp forest succession: a tale of two cohorts. MarineEcology Progress Series 146, 117e134.
Towle, D., Pearse, J., 1973. Production of the giant kelp, Macrocystis, estimated by insitu incorporation of 14C in polyethylene bags. Limnology and Oceanography 18,155e159.
Wheeler, W., Srivastava, L., 1984. Seasonal nitrate physiology of Macrocystis integ-rifolia. Journal of Experimental Marine Biology and Ecology 76, 35e50.
Witman, J., Etter, R., Smith, F., Paine, R., 2004. The relationship between regional andlocal species diversity in the marine benthic communities: a global perspective.Proceedings of the National Academy of Sciences 101, 15664e15669.
Wolanski, E., Hamner, W., 1988. Topographically controlled fronts in the ocean andtheir biological influence. Science 241, 177e181.
Zimmerman, R., Kremer, J., 1986. In situ growth and chemical composition of thegiant kelp, Macrocystis pyrifera: response to temporal changes in ambientnutrient availability. Marine Ecology Progress Series 27, 277e285.
Zimmerman, R., Robertson, D., 1985. Effects of El Niño on local hydrography andgrowth of the giant kelp, Macrocystis pyrifera, at Santa Catalina Island, Cal-ifornia. Limnology and Oceanography 30, 1298e1302.