version date : 01-22-2014 1 welcome to psprs. version date : 01-22-2014 2 public safety personnel...
TRANSCRIPT

Version Date : 01-22-2014 1
Welcome to PSPRS

Version Date : 01-22-2014 2
Public Safety Personnel Retirement SystemCorrections Officer Retirement Plan
Elected Officials’ Retirement Plan
Fiscal Year 2013 Financial Reportas of June 30, 2013

Version Date : 01-22-2014 3
Total Plan StatisticsDefined Benefit Plan
Active Members 33,855Terminated Vested Members 3,065Drop 1,482
Retired 15,026 Normal 11,450 Beneficiaries 2,036 Disability 1,540
Total Participants 53,428

Version Date : 01-22-2014 4
Total PSPRS StatisticsDefined Benefit Plan
Active Members 18,436Terminated Vested Members 1,442Drop 1,482
Retired 10,159 Normal 7,444 Beneficiaries 1,305 Disability 1,410
Total Participants 31,519

Version Date : 01-22-2014 5
Total Plan StatisticsDefined Benefit Plan
Non-RetiredTotal Plans PSPRS CORP EORP
Active Members 33,855 18,436 14,580 839Terminated Vested Members 3,065 1,442 1,463 160DROP 1,482 1,482 0 0Total Non-Retired Members 38,402 21,360 16,043 999
RetiredNormal 11,450 7,444 3,164 842Beneficiaries 2,036 1,305 531 200Disability 1,540 1,410 115 15Total Retired Members 15,026 10,159 3,810 1,057
Total Participants 53,428 31,519 19,853 2,056
Percentage Retired 28.1% 32.2% 19.2% 51.4%

Version Date : 01-22-2014 6
Total RevenueJune 30, 2013
Total Revenue $1,390,349,335

Version Date : 01-22-2014 7
Total RevenueJune 30, 2013
Total Plans PSPRS CORP EORP
Net Investment Income 723,261.918 551,337,629 140,661,688 31,262,601
ER Contributions 461,681,695 378,701,291 68,297,948 14,682,456
Alternative Contributions 2,462,274 2,151,786 203,683 106,805
Court Fees 8,411,739 0 0 8,411,739
EE Contributions 185,712,059 127,362,618 50,648,775 7,770,666
Service Purchase & Transfers 8,819,650 7,575,489 999,077 245,084
Total Revenue 1,390,349,335 1,067,128,813 260,811,171 62,409,351

Version Date : 01-22-2014 8
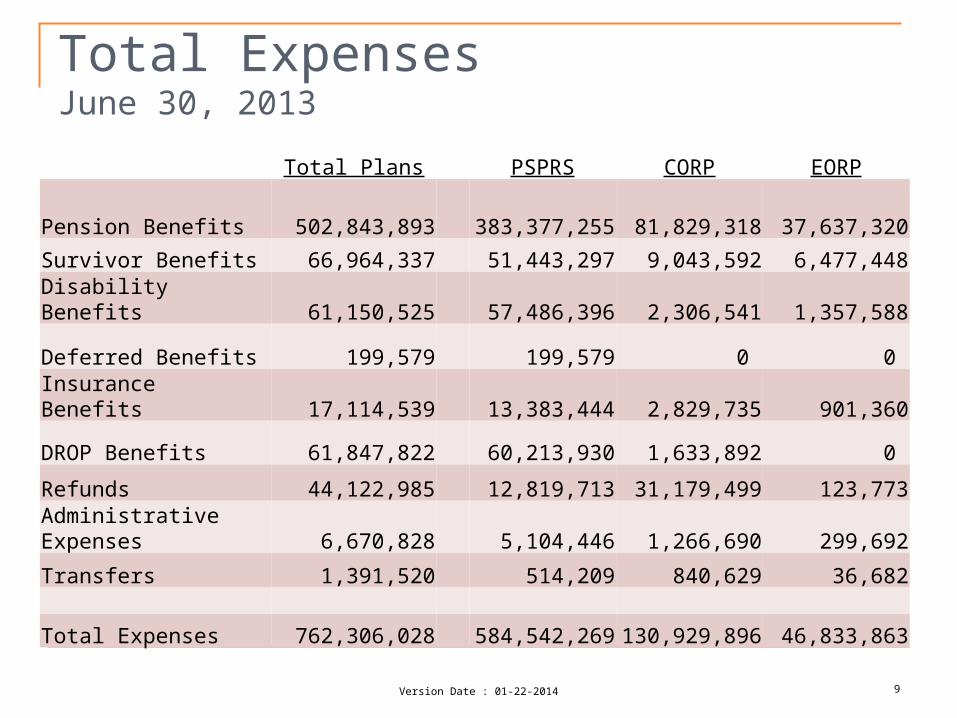
Total ExpensesJune 30, 2013
Total Expenses $762,306,028
Version Date : 01-22-2014 9
Total ExpensesJune 30, 2013
Total Plans PSPRS CORP EORP
Pension Benefits 502,843,893 383,377,255 81,829,318 37,637,320
Survivor Benefits 66,964,337 51,443,297 9,043,592 6,477,448
Disability Benefits 61,150,525 57,486,396 2,306,541 1,357,588
Deferred Benefits 199,579 199,579 0 0
Insurance Benefits 17,114,539 13,383,444 2,829,735 901,360
DROP Benefits 61,847,822 60,213,930 1,633,892 0
Refunds 44,122,985 12,819,713 31,179,499 123,773
Administrative Expenses 6,670,828 5,104,446 1,266,690 299,692
Transfers 1,391,520 514,209 840,629 36,682
Total Expenses 762,306,028 584,542,269 130,929,896 46,833,863
Version Date : 01-22-2014 10
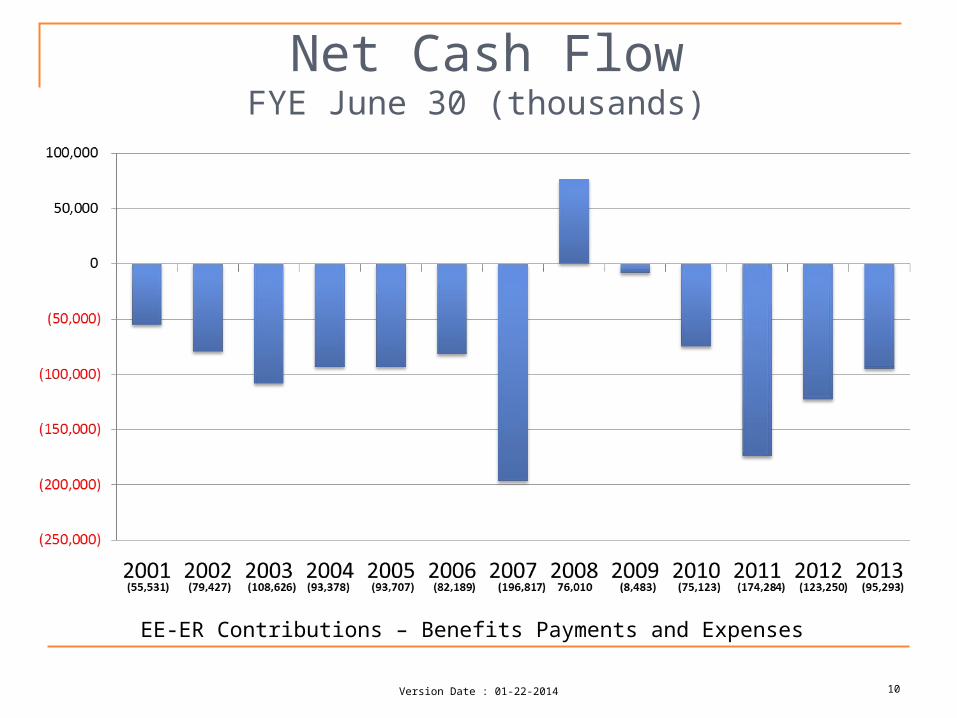
Net Cash FlowFYE June 30 (thousands)
EE-ER Contributions – Benefits Payments and Expenses

Asset AllocationJune 30, 2006 at Market
Bonds$1,293,717,764
21.4%
Real Estate$200,704,599
3.3%
Cash$295,260,920
4.9%
Stocks$4,267,607,566
70.5%
11Version Date : 01-22-2014

Version Date : 01-22-2014 12
Asset AllocationOctober 31, 2013
U.S. Equities, $1,274,231,133 , 19.23% Non-U.S. Equities, 936,178,955
, 14.13%
GTAA, 624,972,469 , 9.43%Fixed Income, 913,487,782,
13.79%
Absolute Return, 230,176,852 , 3.47%
Real Estate, 843,923,193, 12.74%
Credit Opportunities, 570,113,412, 8.6%
Real Assets, 412,644,507, 6.23%
Private Equity, 674,972,454 , 10.19%
Short Term, 145,656,371, 2.20%
Total Fund $7,669,845,141

Total Fund Rates of Return FY’13
Month FYTD Month FYTD
7/31/2012 0.86% 0.86% 1.02% 1.02%8/31/2012 1.43% 2.30% 1.42% 2.45%9/30/2012 1.35% 3.68% 1.77% 4.27%
10/31/2012 -0.19% 3.49% -0.21% 4.05%11/30/2012 1.16% 4.69% 0.68% 4.76%12/31/2012 1.27% 6.02% 1.04% 5.85%1/31/2013 1.92% 8.05% 2.24% 8.22%2/28/2013 0.26% 8.33% 0.30% 8.54%3/31/2013 2.04% 10.54% 1.28% 9.93%4/30/2013 1.14% 11.80% 1.43% 11.50%5/31/2013 0.53% 12.40% -0.03% 11.47%6/30/2013 -1.12% 11.14% -1.24% 10.09%
Net of Fees 10.64% *
Target BenchmarkPSPRS Trust Benchmark
13Version Date : 01-22-2014

Total Fund Rates of Return FY’14 (Gross of fees)
Month FYTD Month FYTD
7/31/2013 1.94% 1.94% 2.62% 2.62%8/31/2013 -0.04% 1.90% -0.91% 1.69%9/30/2013 1.98% 3.92% 2.56% 4.29%
10/31/2013 2.43% 6.44% 2.14% 6.44%11/30/2013 0.54% 7.02% 0.93% 7.43%12/31/2013 7.02% 7.43%1/31/2014 7.02% 7.43%2/28/2014 7.02% 7.43%3/31/2014 7.02% 7.43%4/30/2014 7.02% 7.43%5/31/2014 7.02% 7.43%6/30/2014 7.02% 7.43%
PSPRS Trust Benchmark
14Version Date : 01-22-2014

Version Date : 01-22-2014 15
Asset Allocation Asset Class Old % New % Range %
U.S. Equity 18% 17% 12-22%
Non-U.S. Equity 14% 14% 10-18%
Private Equity global 9% 10% 6-14%
Fixed Income global 12% 8% 4-12%
Credit Opportunities 12% 12% 6-15%
Absolute Return 4% 4% 0-8%
GTAA 8% 10% 6-14%
Real Assets 7% 8% 5-11%
Real Estate Global 10% 11% 6-16%
Risk Parity 4% 4% 0-8%
Short Term Equivalents 2% 2% 0-6%

Version Date : 01-22-2014 16
Total Fund Performance As of June 30, 2013
1-Year 3-Years 5-Years
Total Fund *
Risk-adjusted Rank
11.14%
-
9.27%
9
4.17%
69
Performance Benchmark
Risk-adjusted Rank
10.08%
-
10.00%
22
3.30%
95
Median Public Fund* 12.00% 11.30% 5.00%
• The Total Fund returned 11.14% over the Fiscal Year ending June 30, 2013 gross of fees per the CAFR
• The Total Fund Universe is comprised of Public Funds from the ICC Public Fund Universe and includes over 100 Public Funds over the five full years
• Rank shows how the performance of the Total Fund compared relative to other Public Funds
• Returns are gross of fees

Contribution to Return by Asset Class FY ‘13 (net of fees)
Version Date : 01-22-2014 17

18
Total Fund vs. Benchmark (as of June 30, 2013)
*Total Fund returns are gross of fees
** July 1, 2013 to Present: 17% Russell 3000, 14% MSCI World Ex-US Net, 10% Russell 3000 + 100 bps, 8% BC Global Aggregate, 12% Credit Opportunities Benchmark, 4% BofA ML 3-Month T-Bill + 200 bps, 10% 3-Month LIBOR + 300 bps, 8% CPI + 200 bps, 11% NCREIF NPI, 4% Risk Parity Benchmark and 2% BofA ML 3-Month T-Bill
Version Date : 01-22-2014

Events Today's Portfolio PSPRS Trust Actual
Asian Crisis of 1997 8.1% 5.7%
Russian/LTCM Crisis 1998 -5.4% -5.5%
WTC Attacks - Sept. 11 -2.7% -11.7%
Stock Market Crash 2002 -5.5% -21.1%
August Crisis 2007 3.3% 1.6%
January Crisis 2008 -2.3% -2.7%
Credit Crunch 2008 (Aug to Nov) -9.3% -23.1%
Crisis 2009 (Jan-Feb) -5.6% -12.9%
• Stress testing: The style analysis model of our current holding can be subjected to stress scenarios.
19
Worst case scenarios – lessons from the past
New: On request by Board of Trustees
Version Date : 01-22-2014

PSPRS Risk-adjusted return relative to the peer groups
Version Date : 01-22-2014 20
Rolling 3 Year 3 Rank (Right Axis) Percentile
PSPRS Universe9/30/2013 1.5 1.2 10 906/30/2013 1.6 1.3 9 913/31/2013 1.1 1 26 74
12/31/2012 1 1 43 579/30/2012 1 1 42 586/30/2012 1.3 1.1 22 783/31/2012 1.7 1.6 27 73
12/31/2011 0.9 1 66 349/30/2011 0.3 0.3 63 376/30/2011 0.2 0.3 59 413/31/2011 0.1 0.2 81 19

Version Date : 01-22-2014 21
Funding Levels
0.0%
20.0%
40.0%
60.0%
80.0%
100.0%
120.0%
6/30/2005 6/30/2006 6/30/2007 6/30/2008 6/30/2009 6/30/2010 6/30/2011 6/30/2012 6/30/2013PSPRS 83.2% 77.6% 66.4% 66.5% 68.2% 65.8% 61.9% 58.6% 57.1%
CORP 101.1% 93.7% 84.6% 86.8% 82.6% 80.3% 73.0% 67.8% 66.9%
EORP 92.3% 89.9% 74.6% 76.6% 71.3% 66.7% 62.1% 58.4% 55.5%
Version Date : 01-22-2014 22
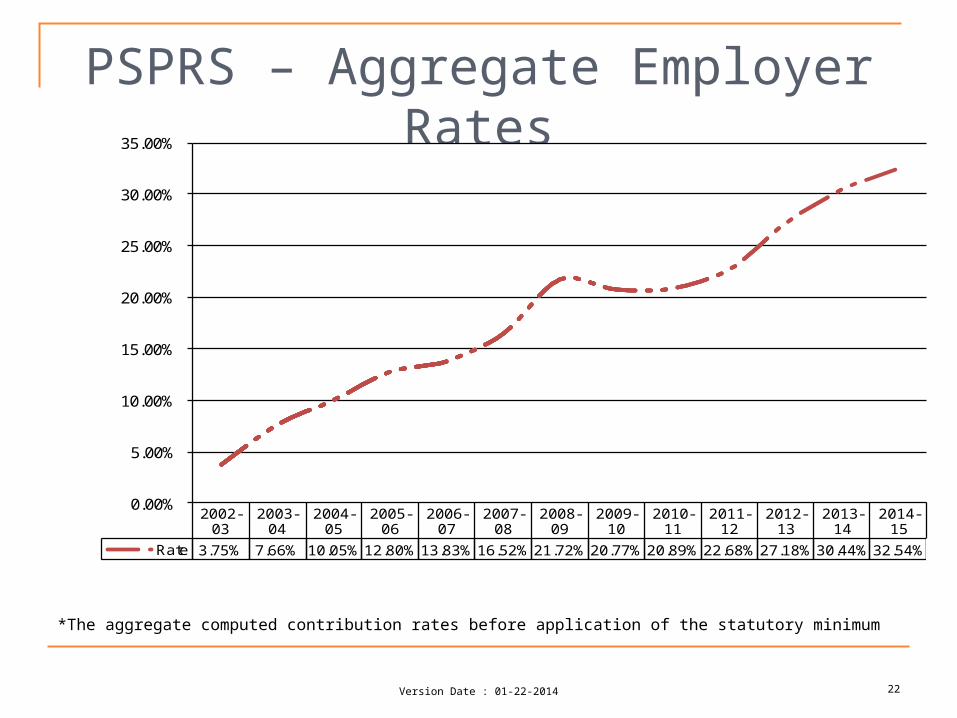
PSPRS – Aggregate Employer Rates
2002-03
2003-04
2004-05
2005-06
2006-07
2007-08
2008-09
2009-10
2010-11
2011-12
2012-13
2013-14
2014-15
Rate 3.75% 7.66% 10.05% 12.80% 13.83% 16.52% 21.72% 20.77% 20.89% 22.68% 27.18% 30.44% 32.54%
0.00%
5.00%
10.00%
15.00%
20.00%
25.00%
30.00%
35.00%
*The aggregate computed contribution rates before application of the statutory minimum

Version Date : 01-22-2014 23
*Market value does not include future benefit increase reserve
Total Fund Changing Financial Status (in 000s)FYE Asset Value Liabilities Ratio Market Value* Ratio
2000 $5,294,936 $4,169,958 127.0% $5,619,426 134.8%
2001 $5,793,886 $4,480,132 129.3% $4,688,259 104.6%
2002 $5,818,181 $5,056,396 115.1% $3,987,905 78.9%
2003 $5,946,631 $5,746,803 103.5% $4,207,662 73.2%
2004 $5,951,310 $6,292,029 94.6% $4,682,652 74.4%
2005 $6,104,548 $7,218,720 84.6% $5,105,869 70.7%
2005R $6,104,548 $7,109,867 85.9% $5,105,869 71.8%
2006 $6,271,480 $7,867,623 79.7% $5,554,802 70.6%
2007 $6,106,364 $8,830,392 69.2% $6,160,387 69.8%
2008 $6,650,684 $9,507,482 70.0% $5,984,152 62.9%
2009 $7,115,572 $10,079,935 70.6% $5,030,674 49.9%
2010 $7,330,790 $10,749,599 68.2% $5,677,168 52.8%
2011 $7,629,124 $11,964,152 63.8% $6,667,128 55.7%
2012 $7,920,930 $13,167,303 60.2% $6,658,622 50.6%
2013 $8,095,542 $13,786,315 58.7% $7,286,591 52.9%

Version Date : 01-22-2014 24
PSPRS Changing Financial Status (in 000s)
*Market value does not include future benefit increase reserve
FYE Asset Value Liabilities Ratio Ratio2000 $4,260,168 $3,415,157 124.7% $4,516,110 132.2%
2001 $4,661,941 $3,674,758 126.9% $3,759,164 102.3%
2002 $4,684,386 $4,144,211 113.0% $3,193,862 77.1%
2003 $4,781,377 $4,739,613 100.9% $3,364,413 71.0%
2004 $4,774,313 $5,167,333 92.4% $3,741,116 72.4%
2005 $4,886,963 $5,951,937 82.1% $4,070,529 68.4%
2005R $4,886,963 $5,872,736 83.2% $4,070,529 69.3%
2006 $4,999,911 $6,495,012 77.0% $4,415,684 68.0%
2007 $4,829,521 $7,268,291 66.4% $4,868,862 67.0%
2008 $5,095,645 $7,662,779 66.5% $4,519,329 59.0%
2009 $5,445,497 $7,989,451 68.2% $3,830,087 47.9%
2010 $5,591,304 $8,491,822 65.8% $4,310,574 50.8%
2011 $5,795,945 $9,365,261 61.9% $5,048,313 53.9%
2012 $6,051,595 $10,325,530 58.6% $5,074,688 49.1%
2013 $6,185,074 $10,823,540 57.1% $5,557,274 51.3%
Market Value*

Current Issues
Developing a communications plan to better reach the members.
65% of the membership have registered emails and will get periodic updates from PSPRS.
Six times a year we send out newsletters to the Local Boards (employer) about current issues and updates from PSPRS.
Version Date : 01-22-2014 25
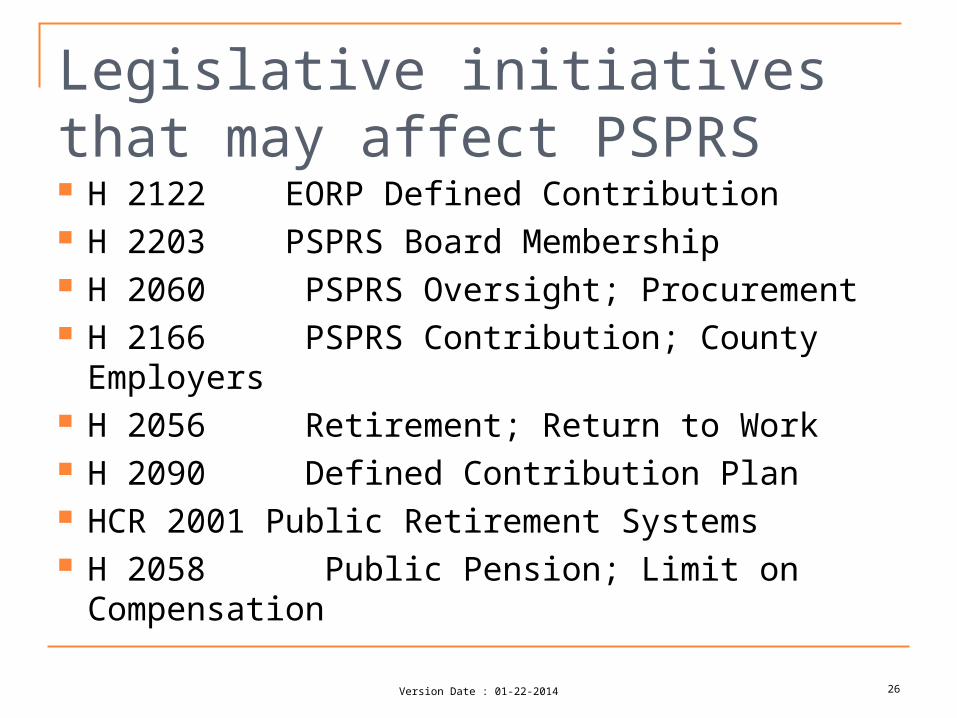
Legislative initiatives that may affect PSPRS H 2122 EORP Defined Contribution H 2203 PSPRS Board Membership H 2060 PSPRS Oversight; Procurement H 2166 PSPRS Contribution; County Employers H 2056 Retirement; Return to Work H 2090 Defined Contribution Plan HCR 2001 Public Retirement Systems H 2058 Public Pension; Limit on Compensation
Version Date : 01-22-2014 26

Fields Case
No update on the Supreme Court decision If unfavorable, the employer rates would
increase.
Version Date : 01-22-2014 27

Version Date : 01-22-2014 28
Questions?

Version Date : 01-22-2014 29
Thank you for attending