vermont freight and rail plan update
TRANSCRIPT

VERMONT FREIGHT PLAN
MULTIMODAL FREIGHT NEEDS & POTENTIAL INITIATIVES
AUGUST 2021
SUBMITTED BY
CAMBRIDGE SYSTEMATICS VANASSE HANGEN BRUSTLIN, INC. FITZGERALD & HALLIDAY INC.


Vermont Freight and Rail Plan UpdateUpdate
VERMONT FREIGHT PLAN (8/24/2021) i
TABLE OF CONTENTS
1.0 Introduction ................................................................................................................................................. 7
2.0 Multimodal Freight System Vision and Goals ............................................................................................ 9
3.0 Performance Evaluation and System Needs and Gaps ............................................................................ 11
3.1 Freight and Overall System Performance .................................................................................................................... 12
Multi-Modal Performance Measures ............................................................................................................................ 12
Rail Performance Measures .............................................................................................................................................. 15
Air Performance Measures ................................................................................................................................................ 19
3.2 Infrastructure Performance – State of Good Repair ................................................................................................ 20
Highway ................................................................................................................................................................................... 20
Rail ............................................................................................................................................................................................. 24
Air .............................................................................................................................................................................................. 25
Unmet Needs ......................................................................................................................................................................... 26
3.3 Travel Time and Reliability ................................................................................................................................................ 26
3.4 U.S.-Canada Border Crossing Delays ............................................................................................................................ 29
Highway ................................................................................................................................................................................... 29
Rail ............................................................................................................................................................................................. 32
3.5 Hazardous Materials ........................................................................................................................................................... 32
3.6 Crashes and Fatalities ......................................................................................................................................................... 36
Highway ................................................................................................................................................................................... 36
Rail ............................................................................................................................................................................................. 39
4.0 Additional freight Needs And Gaps .......................................................................................................... 40
4.1 Technological Innovation .................................................................................................................................................. 40
Alternative Fuel Technology ............................................................................................................................................. 40
Connected and Autonomous Vehicles Technology ................................................................................................ 43
Autonomous Delivery Technologies ............................................................................................................................. 45
Technological Innovation Need ...................................................................................................................................... 46
4.2 Post COVID-19 Economic Recovery .............................................................................................................................. 46
4.3 E-Commerce and Last-Mile Delivery ............................................................................................................................. 48
4.4 Cross-Border Issues ............................................................................................................................................................. 50
4.5 Truck Size and Weight Permitting Harmonization ................................................................................................... 52
4.6 “Freight Workforce” ............................................................................................................................................................. 54

VERMONT FREIGHT PLAN (8/24/2021) ii
4.7 Climate Change and Resiliency ....................................................................................................................................... 55
4.8 Freight as a “Good Neighbor” ......................................................................................................................................... 64
Truck Routes and Community Impacts ........................................................................................................................ 64
Quiet Zones ............................................................................................................................................................................ 64
Construction Activities........................................................................................................................................................ 65
4.9 VTrans Asset Management ............................................................................................................................................... 65
4.10 Broadband Internet Access ............................................................................................................................................... 66
5.0 Potential Initiatives .................................................................................................................................... 68

Vermont Freight and Rail Plan UpdateUpdate
VERMONT FREIGHT PLAN (8/24/2021) iii
LIST OF FIGURES
Figure 1.1 Vermont Freight and Rail Plan Elements ........................................................................................................................ 7
Figure 3.1 Real gross state product (2011 – 2020)........................................................................................................................ 13
Figure 3.2 freight Tonnage by direction (2007 – 2017) ............................................................................................................... 14
Figure 3.3 Freight value by direction (2007 – 2017) ..................................................................................................................... 14
Figure 3.4 Rail users (2016-2018) ........................................................................................................................................................ 15
Figure 3.5 Vermont Transload Facilities ............................................................................................................................................ 17
Figure 3.6 Landmass of vermont within 100 miles of an Intermodal Terminal .................................................................. 18
Figure 3.7 Vermont Composite Pavement Conditions (2019) .................................................................................................. 21
Figure 3.8 Vermont Paving Budget, FY2019-FY2025 (Projected) ............................................................................................. 22
Figure 3.9 Structurally deficient Bridges in Vermont ................................................................................................................... 23
Figure 3.10 Interstate and state highway bridge budget, FY2019-FY2025 (Projected) ............................................... 24
Figure 3.11 Vermont Truck Travel Time Reliability (Jan. 2019 – April 2020) .................................................................... 27
Figure 3.12 Vermont TTTR Index By Interstate (Jan. 2019 – April 2020) ........................................................................... 28
Figure 3.13 Peak Daily Commercial Vehicle Wait Time (in minutes) by Month at Vermont Ports of Entry, 2020 .. .............................................................................................................................................................................................. 29
Figure 3.13 HAZMAT Incidents by Transportation Mode, 2012-2020 ............................................................................... 33
Figure 3.14 HAZMAT Incidents by Transportation phase, 2012-2020 ............................................................................... 34
Figure 3.15 Number of Truck-Involved Crashes in Vermont, 2011-2020 ......................................................................... 37
Figure 3.16 Number of truck-involved Fatal Crashes in Vermont, 2011-2020 ............................................................... 37
Figure 3.17 Number of Reported Freight Rail Accidents by Year, 2011-2020 ................................................................ 39
Figure 4.1 Levels of Automation .......................................................................................................................................................... 44
Figure 4.2 Delivery Robot in Washington, DC ................................................................................................................................ 45
Figure 4.3 Percent Change in Vermont Employment by Industry Sector, January 15, 2020 through March 10, 2021 .................................................................................................................................................................................................... 47
Figure 4.4 Percent Change in Vermont Employment by Wage Cohort, January 15, 2020 through March 10, 2021 . .................................................................................................................................................................................................... 48
Figure 4.5 Estimated Quarterly Retail E-commerce Sales as Percent of Total Quarterly Retail Sales, 1st Quarter 2012-1st quarter 2021 ...................................................................................................................................................................... 49
Figure 4.6 Screen Capture – Vermont Statewide highway Flood Vulnerability and Risk Map ...................................... 59
Figure 4.7 National Preparedness Planning Frameworks ........................................................................................................... 61
Figure 4.8 Rail Flood Risk Vulnerability ............................................................................................................................................. 62
Figure 4.9 Bridge Information Available on Homeland Infrastructure Foundation-Level Data (HIFLD) .................... 63
Figure 4.10 Asset Management Life-Cycle Concept ................................................................................................................ 66

VERMONT FREIGHT PLAN (8/24/2021) iv
Figure 5.1 Sources for Rail Plan Initiatives ....................................................................................................................................... 68

Vermont Freight and Rail Plan UpdateUpdate
VERMONT FREIGHT PLAN (8/24/2021) v
LIST OF TABLES
Table 3.1 Vermont Freight Performance Measures And Targets ........................................................................................... 11
Table 3.2 Vermont Pavement Condition – All Highways .......................................................................................................... 20
Table 3.3 Vermont Pavement Condition - Interstates ................................................................................................................ 20
Table 3.4 Structurally Deficient Bridges by Highway Type ....................................................................................................... 22
Table 3.5 Rail Infrastructure Performance Measures .................................................................................................................. 25
Table 3.6 Peak Daily Commercial Vehicle Wait time (In Minutes) By Month, Including Day-of-Week and TIme-of-Day Detail ....................................................................................................................................................................................... 30
Table 3.7 Vermont-Quebec Border Region Projects Through 2025 ..................................................................................... 31
Table 3.8 Rail Yard and Siding 2017 Tier II MAterial Reporting Data ................................................................................... 34
Table 4.1 Truck Size and Weight Limits for Vermont and Neighboring States ................................................................ 52
Table 4.2 Vermont Structure Flood Vulnerability by County ................................................................................................... 57
Table 4.3 Vermont Road Segment Flood Vulnerability by County ........................................................................................ 58
Table 5.1 Potential Freight Initiatives ............................................................................................................................................... 69

VERMONT FREIGHT PLAN (8/24/2021) vi
LIST OF ACRONYMS
AAR Association of American Railroads AOT (VTrans) Vermont Agency of Transportation BUILD Transportation’s Better Utilizing Investments to Leverage Development CAV Cargo Air Vehicle CCRPC Chittenden County Regional Planning Commission CEP Comprehensive Energy Plan CLP Clarendon & Pittsford Railroad CN Canadian National COVID-19 Coronavirus Disease 2019 CP Canadian Pacific CRISI Consolidated Rail Infrastructure and Safety Improvements EPCRA Emergency Planning and Community Right-to-Know Act FAST Fixing America’s Surface Transportation Act FFY Federal Fiscal Year FHWA Federal Highway Administration FRA Federal Railroad Administration FTA Federal Transit Administration GMRC Green Mountain Railroad HFT High Frequency Train LRTP Long Range Transportation Plan MAP-21 Moving Ahead for Progress in the 21st Century MNRR Metro-North Railroad MPH Miles per hour MPO Metropolitan Planning Organization NECR New England Central Railroad NS Norfolk Southern OTP On-time Performance PAR Pan Am Railways PAS Pan Am Southern PRIIA Passenger Rail Investment and Improvement Act PTC Positive Train Control ROW Right of way RPC Regional Planning Commission SFY State Fiscal Year SLR St. Lawrence & Atlantic SRP State Rail Plan TIGER Transportation Investment Generating Economic Recovery TIP Transportation Improvement Program VRS Vermont Rail System VTR Vermont Railway WACR Washington County Railroad

Vermont Freight Plan Update
VERMONT FREIGHT PLAN (8/24/2021) 7
1.0 INTRODUCTION In April 2020, the Vermont Agency of Transportation (AOT or VTrans) contracted with Cambridge Systematics to update its State Rail Plan (2015) and State Freight Plan (2012 with minor revisions in 2013, 2015 and 2017) to meet Federal regulations under the Passenger Rail Investment and Improvement Act (PRIIA) and Fixing America’s Surface Transportation (FAST) Act. Although two separate documents, there is a significant amount of overlap between the efforts as shown in Figure 1.1.
FIGURE 1.1 VERMONT FREIGHT AND RAIL PLAN ELEMENTS
Source: Cambridge Systematics, 2020.
The State Rail Plan provides a framework for maintaining and enhancing the state rail system. It is important to note that the State Rail Plan focuses on rail freight and intercity passenger service provided by Amtrak. Commuter rail is a form of public transit that is addressed as part of public transit plans.1
The State Freight Plan provides a framework for maintaining and enhancing all modes of freight movement in Vermont—rail, highway, air, and water.
This Technical Memo is part of a set that will provide the background material and information necessary to complete the final State Rail Plan and State Freight Plan. The technical memos cover data analysis, forecasting, and
1 https://vtrans.vermont.gov/planning/PTPP

Vermont Freight Plan Update
VERMONT FREIGHT PLAN (8/24/2021) 8
the processes used in various steps of developing the rail and freight plans. The technical memos are available for review on VTrans’ webpages for the State Rail Plan2 and Freight Plan3.
This technical memorandum was produced while the effort to develop the Vermont Freight Plan was underway. In case of discrepancies between the contents of this technical memo and the Vermont Freight Plan document, the Vermont Freight Plan document prevails.
In addition, extensive public outreach will inform development of both plans and will meet Federal Railroad Admininstration (FRA) requirements for the Vermont Rail Plan.
The remainder of this Technical Memo contains the following Sections:
• Section 2 – Multimodal Freight System Vision and Goals
• Section 3 – Performance Evaluation and System Needs and Gaps
• Section 4 – Additional Freight Needs and Gaps
• Section 5 – Potential Initiatives
Additional work evaluating performance and identifying needs and gaps for passenger rail was developed separately as part of the Vermont Rail Plan update.
2 Vermont State Rail Plan webpage, available from: https://vtrans.vermont.gov/rail/reports. 3 Vermont Freight Plan webpage, available from: https://vtrans.vermont.gov/planning/freight.

Vermont Freight Plan Update
VERMONT FREIGHT PLAN (8/24/2021) 9
2.0 MULTIMODAL FREIGHT SYSTEM VISION AND GOALS As noted, the 2040 LRTP includes an overall vision for a safe, reliable and multimodal transportation sytsem that serves vulnerable populations, is affordable to use and operate, and grows the State’s economy.
Numerous goals support the freight portion of that vision. Goal 3.1 for example is to “Improve connections between modes for passenger and freight transportation.” This goal also aligns with the national performance goal included in the FAST Act to improve the national freight network, strengthen the ability of rural communities to access national and international trade markets, and support regional economic development.
In addition, the National Freight Strategic Plan includes three strategic goals:
• Improve the safety, security, and resilience of the national freight system;
• Modernize freight infrastructure and operations to grow the economy, increase competitiveness, and improve quality of life; and
• Prepare for the future by supporting the development of data, technologies, and workforce capabilities that improve freight system performance.4
The FAST Act established several strategic goals to improve the movement of freight on the National Highway Freight Network (NHFN) and throughout the country more generally. Those goals include:
• Investing in infrastructure and operational improvements that strengthen economic competitiveness, reduce congestion, reduce the cost of freight transportation, improve reliability, and increase productivity;
• Improving the safety, security, efficiency, and resiliency of freight transportation in rural and urban areas;
• Improving the state of good repair of the NHFN;
• Using innovation and advanced technology to improve NHFN safety, efficiency, and reliability;
• Improving the efficiency and productivity of the NHFN;
• Improving State flexibility to support multi-State corridor planning and address highway freight connectivity; and
• Reducing the environmental impacts of freight movement on the NHFN.
The prior freight plani found that overall the State’s freight system was adequate to meet current and future freight needs as long as three “meta-goals” were advanced. These “meta-goals” were discussed with the Freight Plan Advisory Committee (FPAC) during the development of the Freight Plan Update and were confirmed to still be valid.
4 https://www.transportation.gov/sites/dot.gov/files/2020-09/NFSP_fullplan_508_0.pdf
Vermont Freight Plan Update
VERMONT FREIGHT PLAN (8/24/2021) 10
The prior freight plan5 found that overall the State’s freight system was adequate to meet current and future freight needs as long as three “meta-goals” were advanced. These “meta-goals” were discussed with the Freight Plan Advisory Committee (FPAC) during the development of the Freight Plan Update and were confirmed to still be valid.
Combining the LRTP goals that address freight, National Freight Strategic Plan goals, and the prior freight plan meta-goals produces a set of six goals for the 2021 Vermont Freight Plan:
1. Improve the safety, security, and resilience of the freight system;
2. Modernize freight infrastructure and operations to grow the economy, increase competitiveness, and improve quality of life; and
3. Increase freight rail usage by expanding capacity, improving intermodal connectivity, and acting on opportunities for ancillary economic development
4. Prepare for the future by supporting the development of data, technologies, and workforce capabilities that improve freight system performance.6
5. Ensure reliable travel times between Vermont and its major regional markets such Boston, New York City, Albany, and Montreal;
6. Keep highway, rail, aviation, and water transportation infrastructure in a state of good repair; and
5 The previous freight plan was initially released in 2011, and substantially revised in 2012 to meet MAP-21 requirements. Subsequent revisions in 2015 and 2017 incorporated current project lists, but no other changes were made. Thus, the previous freight plan is referred to as the 2012 Freight Plan.
6 https://www.transportation.gov/sites/dot.gov/files/2020-09/NFSP_fullplan_508_0.pdf

Vermont Freight Plan Update
VERMONT FREIGHT PLAN (8/24/2021) 11
3.0 PERFORMANCE EVALUATION AND SYSTEM NEEDS AND GAPS
Understanding progress towards meeting established freight performance targets provides insight into remaining gaps in the system and thus potential initiatives. Performance measures from the 2012 Freight Plan were reviewed and are used in this Plan to identify needs/issues and potential initiatives to address them. These measures are shown in Table 3.1.
TABLE 3.1 VERMONT FREIGHT PERFORMANCE MEASURES AND TARGETS
Category Mode Measure Freight and Overall System Performance
Multi-Modal Gross State Product Multi-Modal Freight demand (by tons and value of goods) Rail Number of businesses using rail Rail Percent of Vermont within 100 miles of a transload facility Rail Percent of Vermont within 100 miles of an intermodal terminal Air Number of airports served by overnight carriers
Infrastructure Performance - State of Good Repair
Highway Pavement condition Highway Bridge condition Rail Bridges meeting 263,000-pound standard* Rail Bridges meeting 286,000-pound standard* Rail Rehabilitate and upgrade rail crossings* Rail 115-pound rail* Rail Eliminate permanent slow orders along passenger routes* Rail Continuously welded rail along all passenger routes* Rail Minimum FRA Track Class 4 for all passenger routes* Rail Vertical clearances* Air Runway conditions, adequacy for current operations
Travel Time and Reliability
Highway Truck Travel Time and Reliability (TTTR)
U.S.-Canada Border Crossing Delays
Highway Border Wait Times Rail Border Wait Times
Hazardous Materials Highway HAZMAT Incidents Rail HAZMAT Incidents
Truck-Involved Crashes
Highway Truck-Involved Crashes
* Discussed in "Rail Plan" version of Tech Memo 3 Source: Vermont Freight Plan, 2017.
The sections below provide additional information for each measure and discuss where gaps remain. Section 3.1 reviews overall freight system performance, with subsequent sections discussing key elements, such as infrastructure conditions, in more detail.

Vermont Freight Plan Update
VERMONT FREIGHT PLAN (8/24/2021) 12
3.1 Freight and Overall System Performance
This section provides information on general performance measures for each mode of freight transport. These measures are considered in addition to the freight rail measures considered in the Vermont Rail Plan.7 Both sets of freight-specific performance measures will inform the Vermont Freight Plan Update’s Needs Assessment. Freight performance measures reviewed in this document include those identified in the 2012 Vermont Freight Plan.
Multi-Modal Performance Measures
This section examines performance, needs, and issues directly related to multi-modal measures identified for inclusion in the 2021 Freight Plan Update. The three performance measures are:
• Gross State Product
• Freight Demand; and
• Stakeholder Outreach & Communication
Gross State Product
Gross state product refers to the total value of goods produced and services provided within Vermont on an annual basis. As a performance measure for Vermont, annual gross state product is adjusted for inflation in order to derive real gross state product. This allows for more accurate and normalized comparisons over set time periods.
As shown in Figure 3.1, real gross state product declined during the ten-year period of 2011 through 2020. Most of the ten year period however was characterized by small gain in real gross state product which culminated in 2019. In fact, 2019 real gross state product was nearly 4 percent higher at $29.8 billion, compared to the 2011 base figure of $28.7 billion. Largely the result of the COVID-19 pandemic however, 2020 real gross state product dropped by over 5 percent to a value of $28.2 billion, the lowest amount within the ten-year timeframe.
The significant drop in real gross state product in 2020 can be attributed to the early stages of the COVID-19 pandemic in the first half of the year, in which most non-essential businesses, including many manufacturers, miners, and retail establishments were forced to shut down for extended periods of time. While economic conditions improved significantly during the second half of 2020, many supply chains and businesses are still coping with backlogs and elevated demand, as consumers have embraced ‘reopening’. Together these economic conditions of a sudden and widespread economic shutdown followed by prolonged and elevated demand worked to supress real gross state product through 2020. It remains to be seen what the magnitude of the likely rebound in real gross state product will consist of for Vermont through the end of 2021.
7https://vtrans.vermont.gov/sites/aot/files/planning/documents/Tech%20Memo%203_Vision%20Goals%20Needs%20Potential%20Initiatives%2020210517.pdf.

Vermont Freight Plan Update
VERMONT FREIGHT PLAN (8/24/2021) 13
FIGURE 3.1 REAL GROSS STATE PRODUCT (2011 – 2020)
Source: https://fred.stlouisfed.org/series/VTRGSP.
Freight Demand
Freight demand is measured on the basis of two primary indicators – tonnage (weight), and the economic value of this tonnage. As a performance measure for Vermont, outbound, inbound, and intrastate moves are examined primarily for truck, rail, and air modes from 2007 through 2017.
Freight demand figures are derived from the Freight Analysis Framework (FAF), produced in partnership between the Bureau of Transportation Statistics (BTS) and Federal Highway Administration (FHWA). Released in five-year increments, 2007 data is dervied from FAF 3.4, 2012 data is derived from FAF 4.1, and 2017 data is derived from the recently released FAF 5.08. As part of this performance measure, truck, rail, and air modes are examined. While FAF also includes multi-modal, water, pipeline, and ‘other/unknown’ modes as well, discrepancies in how these modal figures were derived across each different FAF version makes temporal comparisons including these additional modes less accurate.
Figure 3.2 below depicts tonnage by direction and mode between 2007 and 2017. Since 2007, tonnage, largely comprised of truck moves, and to a lesser extent rail, has declined across all three directions. While tonnage was mostly down across each direction, outbound tonnage actually increased between 2012 and 2017 for both truck and rail modes. Still, when factoring in an increase in outbound rail tonnage, total freight volumes remained below those of 2007. Additionally, intrastate moves declined at a greater rate between 2012 and 2017.
8 As the initial release of FAF Version 5 data, 2017 figures are subject to revision as newer versions of FAF 5 are released.
$27.00
$27.50
$28.00
$28.50
$29.00
$29.50
$30.00
2011 2012 2013 2014 2015 2016 2017 2018 2019 2020
$ Bi
llion
s

Vermont Freight Plan Update
VERMONT FREIGHT PLAN (8/24/2021) 14
FIGURE 3.2 FREIGHT TONNAGE BY DIRECTION (2007 – 2017)
Source: USDOT Freight Analysis Framework versions 3, 4, and 5.
Next, Figure 3.3 depicts freight value by direction and mode between 2007 and 2017. Unlike tonnage which has decreased, total value, comprised of truck moves, and to a lesser extent rail and air, has increased since 2007. These increases in value primarily stem from outbound moves, attributed to increased truck and air value. On the other hand, inbound moves were stagnant, while intrastate moves declined somewhat. This trend suggests an increase in the value of goods produced and shipped out of Vermont, and an increase in the relative importance of air freight, parcel services, and trucking services that support those outbound moves.
FIGURE 3.3 FREIGHT VALUE BY DIRECTION (2007 – 2017)
Source: USDOT Freight Analysis Framework versions 3, 4, and 5.
2,000
5,000
8,000
11,000
14,000
17,000
20,000
Out
boun
d
Inbo
und
Intr
asta
te
Out
boun
d
Inbo
und
Intr
asta
te
Out
boun
d
Inbo
und
Intr
asta
te
2007 2012 2017
Truck Rail Air
$5,000
$8,000
$11,000
$14,000
$17,000
$20,000
Out
boun
d
Inbo
und
Intr
asta
te
Out
boun
d
Inbo
und
Intr
asta
te
Out
boun
d
Inbo
und
Intr
asta
te
2012 2017
Truck Rail Air

Vermont Freight Plan Update
VERMONT FREIGHT PLAN (8/24/2021) 15
Overall, trends associated with freight demand indicate less tonnage is being moved into, out of, and within Vermont. However, the value of this tonnage is increasing. This is likely attributed to a range of factors including rising commodity prices, and increased demand for higher-value goods such as electronics and machinery.
Rail Performance Measures
This section examines performance, needs, and issues directly related to rail measures identified for inclusion in the 2021 Freight Plan Update. The three performance measures are:
• Number of businesses using rail,
• Landmass within proximity to a transload facility; and
• Landmass within proximity to an intermodal terminal.
Number of Businesses Using Rail
This performance measure is used to assess the size and characteristics of the market for freight rail service in Vermont. In the 2015 Vermont Rail Plan, it was established that the vast majority of Vermont’s rail tonnage is handled by a small number of rail users, that rail traffic projections are sensitive to changes to these large rail users, and that Vermont has set a goal to diversify and expand the railroad customer base so that rail traffic would be less dependent on a small number of shippers.
The estimated number of rail users by direction and year are shown in Figure 3.4. The number of inbound rail users increased 24 percent and the number of outbound rail users decreased seven percent between 2016 and 2018, Intrastate rail shippers increased seven percent and intrastate receivers declined 43 percent between 2016 and 2018, which indicates that the Vermont businesses shipping products within Vermont has increased slightly, but the number of Vermont businesses receiving products from within Vermont has decreased significantly. Between 2016 and 2018, Vermont shippers (Outbound and Intrastate-Originating rail users) have remained constant and receivers (Inbound and Intrastate-Terminating rail users) have increased.
FIGURE 3.4 RAIL USERS (2016-2018)
Source: Cambridge Systematics, 2020.
45
1521
15
45
1216 14
56
14 1216
0
10
20
30
40
50
60
Inbound Outbound Intrastate-Terminating Intrastate-Originating
2016 2017 2018

Vermont Freight Plan Update
VERMONT FREIGHT PLAN (8/24/2021) 16
Landmass within Proximity to a Transload Facility
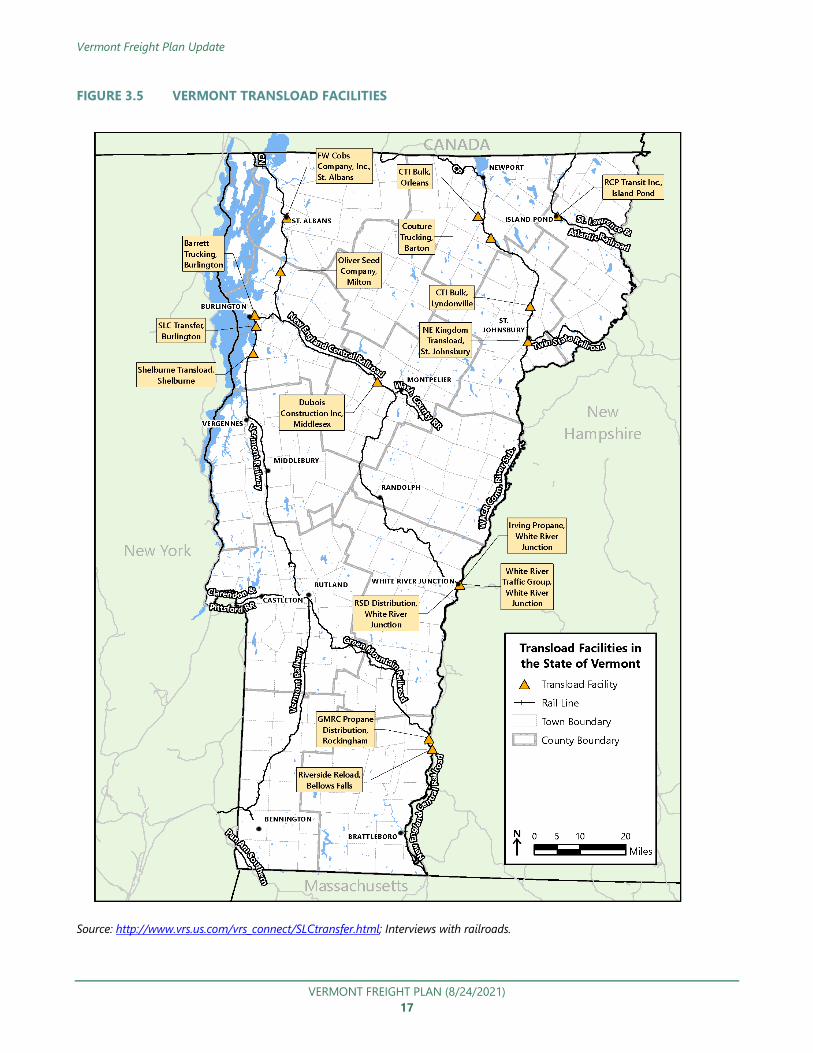
Transload facilities are used to transfer products between conveyances, such as raw materials, palletized items, and large, heavy items (such as transformers). As part of this performance measure, the landmass of Vermont is assessed for proximity, within 100 miles, to a transload facility.
Fifteen transload facilities have been identified across the state, and are shown in Figure 3.5. All of Vermont’s transload facilities are operated by private firms to move goods between truck and rail. 100 percent of the Vermont landmass is within 100 miles of a transload facility.
Vermont Freight Plan Update
VERMONT FREIGHT PLAN (8/24/2021) 17
FIGURE 3.5 VERMONT TRANSLOAD FACILITIES
Source: http://www.vrs.us.com/vrs_connect/SLCtransfer.html; Interviews with railroads.

Vermont Freight Plan Update
VERMONT FREIGHT PLAN (8/24/2021) 18
Landmass within Proximity to an Intermodal Terminal
Intermodal terminals are used to transfer containerized products. As part of this performance measure, the landmass of Vermont is assessed for proximity, within 100 miles, to an intermodal terminal.
Unlike transload terminals, intermodal facilites are less abundant, and are instead operated primarily by Class I railroads in major markets. Vermont does not have any intermodal terminals. As such, proximity is assessed to the following nearby intermodal terminals:
• Mechanicville, New York (Norfolk Southern)
• Springfield, Massachusetts (CSX)
• Montreal – (CP and CN)
Approximately 83 percent of the Vermont landmass is within 100 miles of at least one of these three intermodal terminals. Areas of Vermont outside of this 100 mile radius include small portions of the east-central and northeastern areas of the state, as Figure 3.6 shows. Another consideration is the markets accessible via intermodal service to/from the intermodal terminal locations proximate to Vermont. Service that CSX and Norfolk Southern offer to/from Springfield, MA and Mechanicville, NY, respectively, are aligned with service to/from Chicago, and to/from locations farther west via interchange with other railroads. CN and CP intermodal service in Montreal offers direct routes to several terminals located throughout each railroad’s respective network in the U.S. and Canada.
FIGURE 3.6 LANDMASS OF VERMONT WITHIN 100 MILES OF AN INTERMODAL TERMINAL

Vermont Freight Plan Update
VERMONT FREIGHT PLAN (8/24/2021) 19
Souce: Cambridge Systematics analysis, 2021.
Air Performance Measures
This section examines performance, needs, and issues directly related to air measures identified for inclusion in the 2021 Freight Plan Update. The measure is:
• Overnight air cargo carrier service use of Vermont airports.
Overnight Air Carrier Service
The primary performance measure for air freight considers availability of overnight air carrier cargo service, notably through the major shippers of Fedex and UPS. Currently, three airports have overnight air carrier service:
• Burlington International Airport
• Edward F. Knapp State Airport
• Rutland – Southern Vermont Regional Airport
This inventory of overnight air carrier-served airports has remained unchanged since the 2012 Vermont Freight Plan was developed. This is due to the specific infrastructure needs and requirements for overnight air carrier cargo, as well as total market demand for these services in Vermont and adjacent regions.
The most important infrastructure needs for the handling of air cargo at airports are runway length and precision approaches (GPS and ILS) that allow for efficient landings in inclement conditions. According to the Draft Vermont Airport System Plan (VASP), runway lengths of 4,000 and 5,000 are identified, with 5,000 feet as key to support regular corporate and business operations across the range of typical aircraft used to handle cargo. While these thresholds can support air cargo operations, they may be insufficient for expanded services beyond existing statewide locations.
Highway access is an additional important component in determining the suitability of an airport to handle air cargo. For the three airports with regular air cargo service (overnight or otherwise), highway access is generally good, given their proximity to Vermont’s interstates and key arterials. Highway access is also sufficient to good for those remaining airports lacking overnight air carriers. This indicates that accessibility is not a limiting factor in the availability of overnight air carriers in more airports.
Lastly, the availability of overnight air carrier services is based largely on the market size and catchment areas of each airport, with decisionmaking done primarily by FedEX and UPS – the two integrated carriers which handle the vast majority of air cargo traffic. Assuming a same day pickup/delivery of air cargo of 50 to 100 miles9, the majority of Vermont’s landmass, including every population and economic/tourism center, is already within proximity to an airport with overnight air carrier service, inclduing from out-of-state airports in Albany, New York, Manchester,
9 https://airportscouncil.org/wp-content/uploads/2020/03/Air-Cargo-Guide.pdf

Vermont Freight Plan Update
VERMONT FREIGHT PLAN (8/24/2021) 20
New Hampshire, Hartford, Connecticut, and Montreal, Quebec. As a result, there is currently limited need for expansion of overnight air carrier service to additional Vermont airports.
3.2 Infrastructure Performance – State of Good Repair
This section provides information on infrastructure performance measures assessed for state of good repair. These performance measures are assessed for highway, rail, and air modes.
Highway
Highway state of good repair performance measures focus on two primary components – pavement, and bridge conditions.
Pavement condition is assessed on the basis of smoothness. VTrans measures smoothness using a Composite Pavement Condition (COMP) score to determine pavement condition on one mile segments ranging from ‘Good’ to ‘Fair’ to ‘Poor’ to ‘Very Poor’ as shown in Table 3.2 and Figure 3.7 for Vermont highways. The data for one mile pavement condition indicates that only 10 percent of highways are in Very Poor condition. An additional 21 percent are in poor condition and the remainder are in Fair or Good condition. Those highways with poor pavement conditions are not locations with typically high levels of truck traffic. A review of interstate one-mile data, the locations where truck traffic is typically highest, reveals that only six percent of segments are ranked as Poor and none are ranked as Very Poor, as shown in Table 3.3.
TABLE 3.2 VERMONT PAVEMENT CONDITION – ALL HIGHWAYS
Score Pavement Condition (COMP)
Good/Fair 69% Poor 21% Very Poor 10%
Source: VTrans; Analysis by VHB, 2020.
TABLE 3.3 VERMONT PAVEMENT CONDITION - INTERSTATES
Score Pavement Condition (COMP) Good/Fair 94% Poor 6% Very Poor 0%
Source: VTrans; Analysis by VHB, 2020.
Pavement Conditions have improved significantly over time. A review of data between 2009 and 2019 reveals that the percentage of roads in very poor or poor condition was reduced from over 50 percent to approximately 30 percent during that period.

Vermont Freight Plan Update
VERMONT FREIGHT PLAN (8/24/2021) 21
FIGURE 3.7 VERMONT COMPOSITE PAVEMENT CONDITIONS (2019)

Vermont Freight Plan Update
VERMONT FREIGHT PLAN (8/24/2021) 22
Source: VTrans; Analysis by VHB, 2020.
Between Fiscal Year 2019 and projected expenditures in Fiscal Year 2025, Vermont is expected to spend approximately $100 million per year on paving projects. Although the values each year vary slightly, the overall trend in spending is generally steady, as Figure 3.8 shows.
FIGURE 3.8 VERMONT PAVING BUDGET, FY2019-FY2025 (PROJECTED)
Source: https://vtrans.vermont.gov/about/capital-programs.
Bridge conditions are assessed based on structural integrity. Vermont’s roadway inventory includes 2,791 long structures (greater than 20 feet in length and located on public roads) and 1,260 state owned short structures (bridges having a span length of greater than six feet up to and equal to 20 feet and located on public roads). The 2020 VTrans Factbook indicates that almost 13 percent of these structures are on an interstate and almost 47 percent on a state highway. The Factbook also indicates that 17 percent of bridges have an age of over 90 years and an additional 36 percent have an age of over 50 years.
On all roadway types, VTrans is ahead of the target for addressing structurally deficient bridges, as shown in Table 3.4. Only 2 percent of interstate bridges were structurally deficient, 4 percent of state highway system bridges were structurally deficient and only 2 percent of town highway system bridges were structurally deficient. The targets for these were 6, 10 and 12 percent, respectively. These structures are shown in Figure 3.9, along with average annual daily truck traffic (AADTT).
TABLE 3.4 STRUCTURALLY DEFICIENT BRIDGES BY HIGHWAY TYPE
Highway Type % Structurally Deficient
Target %
Interstate 2% 6% State Highway 4% 10%
Town Highway 2% 12%
Source: VTrans; Analysis by VHB, 2020.
020406080
100120140
FY19 FY20 FY21 FY22 FY23 FY24 FY25
Mill
ions
Paving Budget by Fiscal Year (FY), Millions of Dollars

Vermont Freight Plan Update
VERMONT FREIGHT PLAN (8/24/2021) 23
FIGURE 3.9 STRUCTURALLY DEFICIENT BRIDGES IN VERMONT
Source: VTrans; Analysis by VHB, 2020.

Vermont Freight Plan Update
VERMONT FREIGHT PLAN (8/24/2021) 24
Vermont’s bridges have a similar story to pavement. Ten years ago, 20.5 percent of Vermont’s 1,835 state highway bridges were categorized as “structurally deficient”. As of 2017, that figure was down to 5.1 percent. Interstate bridges and town highways have experienced similar improvement. This again is thanks to an acknowledgement of the critical importance of these structures to travel throughout that state, and the will to make significant, sustained reconstruction and maintenance investments. Vermont intends to maintain this state of good repair and is budgeting accordingly. The proposed FY2019 state highway bridge budget is approximately $57.6 million with increases projected out through 2021 (Figure 3.10). FIGURE 3.10 INTERSTATE AND STATE HIGHWAY BRIDGE BUDGET, FY2019-FY2025 (PROJECTED)
Source: https://vtrans.vermont.gov/about/capital-programs. Rail
Rail state of good repair performance measures were adopted directly from the 2021 Vermont Rail Plan. Established in the 2015 version of the Vermont Rail Plan, a total of 12 performance measures are identified, including four related to system infrasctructure and condition (Table 3.5). Those four performance measures are:
• 263,000 lb bridge weight standard
• 286,000 lb bridge weight standard
• Rehabilitation and upgrade of rail crossings
• 115 pound rail standard.
In addition to these performance measures, the Vermont Rail Plan establishes targets for annual improvements. VTrans is currently meeting each target for rail infrastructure improvements. In addition, all rail bridges have a weight standard of 263,000.
60
65
70
75
80
85
90
95
100
FY19 FY20 FY21 FY22 FY23 FY24 FY25
$ M
illio
ns

Vermont Freight Plan Update
VERMONT FREIGHT PLAN (8/24/2021) 25
TABLE 3.5 RAIL INFRASTRUCTURE PERFORMANCE MEASURES
Performance Measure Target Status Bridges meeting 263,000-pound standard All bridges 263k Being met Bridges meeting 286,000-pound standard Improve 3 or more annually Being met Rehabilitate and upgrade rail crossings Improve 3 or more annually Being met 115-pound rail 5 miles annually Being met
Air
The 2012/2017 Vermont Freight Plan suggested monitoring runway conditions with regard to their adequacy for current operations. According to the VASP , five of the system airports have a primary runway length greater than 5,000 feet. The longest runway in the system is at Burlington International, which boasts a primary runway length of more than 8,300 feet. For planning purposes, a runway length of 5,000 feet or greater is typically benchmarked as the minimum to accommodate turbo-prop and jet aircraft most often deployed by business/corporate operators.10 The runway conditions at these airports are adequate for current operations. Ongoing master planning work for Burlington International Airport may reveal additional needs.
Additional infrastructure performance measures and recommendations are identified in the VASP. This includes instrument landing system (ILS) precision approach status for each of Vermont’s airports. As part of the VASP, coverage of ILS is evaluated in terms of coverage across the entire state. According to these figures, ILS precision approach covers only 27 percent of the state, 46 percent of the population, and just 58 percent of major employment centers. This coverage is based on ILS precision capability at Burlington International Airport, Edward F. Knapp State Airport, and Rutland – Southern Vermont Regional Airport. As indicated in the VASP, the small number of airports with ILS precision capability indicates a potential need for additional infrastructure upgrades. As defined by the Federal Aviation Administration (FAA) within the VASP, precision ILS upgrades should be prioritized on the basis of current and projected air operations and runway lengths at each airport.
Recommendations are also provided for on-site weather reporting and establishing fueling stations. John H. Boylan State, Post Mills, and Deerfield Valley Regional are identified as locations to establish weather reporting. Morrisville-Stowe and William H. Morse Airports are recommended as the best locations to upgrade fueling service, based on the number and aircraft types served.
Additional infrastructure performance measures in the VASP are the presence of runway lighting and pavement status. Runway lights allow for takeoff and landing at night or in poor weather conditions. Ten airports in Vermont currently have runway lighting, while six are unequipped. Pavement conditions can affect the size and weight of aircraft that can be accommodated. A total of 12 airports have paved runways, while 4 airports have unpaved runways.
10 https://vtrans.vermont.gov/aviation/vermont-airport-system-plan.

Vermont Freight Plan Update
VERMONT FREIGHT PLAN (8/24/2021) 26
Unmet Needs
According to Vermont’s Transportation Asset Management Plan (TAMP), current funding provides approximately 67% of the monetary resources needed to maintain Vermont’s transportation system in a state of good repair. In 2018, the gap was approximately $258 million. The TAMP offers a list of potential strategies to help close funding gaps, including increased gas tax and “purchase and use” revenue, generate new revenue sources, reduce customer service levels (winter maintenance), reduce asset performance targets, consider strategic disinvestment strategies so there would be fewer assets to maintain.11
3.3 Travel Time and Reliability
This section provides information on travel time and reliability performance measures. These performance measures are assessed for both highway and rail modes.
Truck Travel Time and Reliability (TTTR) was derived for each Interstate and key US and state highways in Vermont, based on FHWA standards. This index compairs the 50th percentile travel time and the 95th percentile travel time over a number of different periods of the day/week.
Figure 3.11 shows the highest TTTR across the five reporting periods with higher numbers representing areas with more volatility in travel times. Overall, truck travel times in Vermont are relatively consistent, with areas of concern including VT 9 west of Bennington, I-89 and I-91 approaching the Canadian border (likely due to border crossing wait times), and some arterial roadways in the Burlington region. In particular, the Highgate Springs – St. Armand Border Crossing on I-89 which connects Montreal to Boston is the busiest in Vermont and one of the top-15 busiest in the United States. Although trucks and passenger vehicles have separate lanes in both directions, high traffic volumes can create a large amount of variability in travel time to/through the border. The I-91 crossing at Derby-Stanstead also shows a high TTTR. Interestingly, the highest TTTR is spread throughout the five reporting periods rather than having a larger number during the AM and PM Peak. This may indicate the role that weather and geography play in Vermont, especially on non-interstate routes, compared to heavy traffic volumes that are encountered in more urban states.
The freight performance measure associated with the FAST Act requires states to set and meet TTTR Index goals for the interstate system only. Vermont had a target TTTR Index of 1.75 in 2018 and met that goal with a TTR Index of 1.67. Vermont is using the same goal of 1.75 for the 2020 report. Between January 2019 and April 2020, Vermont had a TTTR Index on the interstate system of 1.61, meeting their goal. Figure 3.12 shows the TTTR Index separately for each interstate (note that although I-189 is above the goal, the measure is reported to FHWA for the entire interstate system, not any individual component).
11 https://vtrans.vermont.gov/sites/aot/files/planning/documents/2018%20Final%20VTrans%20TAMP.pdf.

Vermont Freight Plan Update
VERMONT FREIGHT PLAN (8/24/2021) 27
FIGURE 3.11 VERMONT TRUCK TRAVEL TIME RELIABILITY (JAN. 2019 – APRIL 2020)
Source: VTrans; Analysis by VHB, 2020.

Vermont Freight Plan Update
VERMONT FREIGHT PLAN (8/24/2021) 28
FIGURE 3.12 VERMONT TTTR INDEX BY INTERSTATE (JAN. 2019 – APRIL 2020)
Source: VTrans; Analysis by VHB, 2020.

Vermont Freight Plan Update
VERMONT FREIGHT PLAN (8/24/2021) 29
3.4 U.S.-Canada Border Crossing Delays
This section provides information on border crossing delay performance measures. These performance measures are assessed for both highway and rail modes.
Highway
Historic border crossing wait times for commercial vehicles entering the United States are available from U.S. Customs and Border Protection (CBP), going back to “the previous year,” with average wait times listed by time of day and day of week for each month. Figure 3.13 shows the highest wait time for any time of any day of the week in each month of 2020. Table 3.6 includes the day of the week and time of the day when the peak wait times were observed. At the Derby Line Port of Entry (POE), for example, the highest average wait time in June of 2020 was 23 minutes, which is the average wait time for Mondays at 5 PM in that month. All other days and times that month observed shorter average wait times. The peak average wait time observed at Highgate Springs was also 23 minutes, which was the average wait time on Thursdays at 7 AM in October.
“Live” wait times entering Canada are available from the Canada Border Services Agency (CBSA), but historic data are not readily available.12
FIGURE 3.13 PEAK DAILY COMMERCIAL VEHICLE WAIT TIME (IN MINUTES) BY MONTH AT VERMONT PORTS OF ENTRY, 2020
Source: https://bwt.cbp.gov/.
12 https://www.cbsa-asfc.gc.ca/bwt-taf/menu-eng.html.
0
5
10
15
20
25
Jan Feb Mar Apr May Jun Jul Aug Sep Oct Nov Dec
Highgate Springs POE Derby Line POE

Vermont Freight Plan Update
VERMONT FREIGHT PLAN (8/24/2021) 30
TABLE 3.6 PEAK DAILY COMMERCIAL VEHICLE WAIT TIME (IN MINUTES) BY MONTH, INCLUDING DAY-OF-WEEK AND TIME-OF-DAY DETAIL
Month Highgate Springs POE Derby Line POE Peak Average Wait Time (minutes)
Day of Week and Time of Day of Observed Peak
Peak Average Wait Time (minutes)
Day of Week and Time of Day of Observed Peak
January 1 Mondays, 1PM 0 February 0 3 Multiple days/times March 4 Fridays, 9AM 3 Wednesdays, 3PM April 4 Tuesdays, 7AM 4 Saturdays, 8AM May 3 Wednesdays, 7AM 0 June 0 23 Mondays, 5PM July 10 Multiple days/times 3 Multiple days/times August 16 Mondays, 4PM 0 September 10 Thursdays, 7AM 0 October 23 Thursdays, 7AM 0 November 15 Sundays, 5PM 0 December 7 Multiple days/times 0
Source: https://bwt.cbp.gov/.
For commercial vehicle traffic entering Canada, observed wait times have been longer, though the period of time for which data are available from Stats Canada ends prior to the COVID-19 pandemic, in Quarter 1, 2020. Figure 3.14 shows the longest wait times for commercial vehicles observed at the St. Armand Canadian POE (from I-89) and the Stanstead Canadian POE (from I-91) for each quarter of the year from Quarter 1 2018 through Quarter 1 2020. Wait times at St. Armand peaked in the second quarter of each year, at 105 minutes. The maximum observed wait times at Stanstead range from zero minutes (no delay) to 70 minutes, observed once during the second quarter of 2019.

Vermont Freight Plan Update
VERMONT FREIGHT PLAN (8/24/2021) 31
FIGURE 3.14 MAXIMUM QUARTERLY COMMERCIAL VEHICLE WAIT TIME (IN MINUTES) BY QUARTER AT CANADIAN PORTS OF ENTRY FROM VERMONT, QUARTER 1 2018 THROUGH QUARTER 1 2020
Source: https://open.canada.ca/data/en/dataset/000fe5aa-1d77-42d1-bfe7-458c51dacfef
Through 2025 a variety of construction projects will impact goods movmement along the US/Quebec border region. These are listed in Table 3.7 below.
TABLE 3.7 VERMONT-QUEBEC BORDER REGION PROJECTS THROUGH 2025
Project Responsible Agency
Description Projected Construction Period
A-35 Completion MTQ Construction of the final 8.3 mile (13.3 km) of A-35 (Segments 3 & 4) in Quebec up to the U.S. border/I-89 in Vermont.
2020-2025
St. Armand de Phillipsburg POE
CBSA Replacement of the Canadian POE, located on the Canada-US border at Highway 133/I-89.
2021-2023
St. Bernard de Lacolle POE
CBSA Replacement of the traveler and bus process portion of the Canadian POE at the US-Canada Border at Highway 15/I-87.
2020-2023
Highgate Springs LPOE
GSA/CBP Replacement of the U.S. Land POE to accommodate increased traffic as a result of A-35 completion at the terminus of I-89 in Highgate Springs, VT.
2022-2024
Souce: Cambridge Systematics, in consultation with VTrans, 2021.
Most significant is the projected completion of Autoroute 35 in Quebec, which will connect the Highgate Springs Port of Entry (POE) and Interstate 89 with Montreal through a limited-access expressway. Completion of Autoroute 35 will result in a limited-access facility over 300 miles long between Boston and Montreal via Vermont. U.S. CBP and the Canada Border Services Agency (CBSA) are anticipating the potential growth in traffic that will result from the completion of this extension through a complete reconstruction of the border facilities at Highgate Springs/St. Armand de Phillipsburg. At Champlain/St. Bernard de Lacolle on I-87, construction of a new US POE was
0
20
40
60
80
100
120
2018 Q1 2018 Q2 2018 Q3 2018 Q4 2019 Q1 2019 Q2 2019 Q3 2019 Q4 2020 Q1
St. Armand, QC Stanstead, QC

Vermont Freight Plan Update
VERMONT FREIGHT PLAN (8/24/2021) 32
completed in 2009, with replacement of its Canadian counterpart scheduled to begin in 2020. Improvements at the Derby Line POE were completed in 2019.
As these projects are under construction, the movement truck traffic across the border in both directions will be impacted at times. Due to the proximity I-89 and I-87 as highways linking Quebec with the US Eastern Seaboard, it is likely that there will be some diversion between the two routes as construction work on both routes impact fluidity at the US/Canada border. Once Autoroute 35 and border crossing facility improvments arecompleted, capacity will be considerably improved, thereby accomodating future growth and reducing delays.
Rail
While the number of railcars crossing the U.S.-Canada border at each Port of Entry are available, border crossing delays experienced by freight railroads are not reported in either nation’s transportation statistics. Since 2013, the number of loaded and empty railcars crossing at Vermont Ports of Entry has declined nearly 40% (from nearly 37,000 annual rail cars and containers in 2013 to 22,300 in 2020.13 The COVID-19 pandemic undoubtedly had an effect on the annual volume for 2020, however the trend had been downward for several years prior to the pandemic. As section 4.4 details, there are competitive changes in the freight rail network in the U.S. and Canada that may change, and potentially increase, rail traffic volumes across the border.
For freight rail traffic coming into the United States, CBP utilizes the following procedures, among others, to secure the border:
• Advanced Targeting – No later than two hours before the train arrives at the border, CBP electronically obtains the train’s manifest, which provides information on the train’s contents, from the railroad. Using CBP’s Automated Targeting System, CBP officials identify rail cars deemed high-risk, for additional inspection.
• Rail Vehicle and Cargo Inspection System (R-VACIS) – Requiring inbound trains to pass through R-VACIS, a machine that produces an image of the inside of railcars using gamma radiation technology. CBP officers review the scanned images for anomalies that may indicate the presence of un-manifested goods and contraband, including threats that could pose a risk to national security.14
Interviews with freight railroads operating in Vermont found that the railroads understand the procedures and that border crossing delays are not an issue of major concern to them or their customers.
3.5 Hazardous Materials
This section provides information on performance measures related to hazardous materials (HAZMAT). These performance measures are broadly assessed for highway, rail, and air modes.
13 https://explore.dot.gov/views/BorderCrossingData/Annual?:isGuestRedirectFromVizportal=y&:embed=y. 14 https://railroads.dot.gov/sites/fra.dot.gov/files/fra_net/17163/FRA%20-
%20International%20Border%20Passenger%20and%20Freight%20Rail%20Study%20-2017.pdf.

Vermont Freight Plan Update
VERMONT FREIGHT PLAN (8/24/2021) 33
HAZMAT transportation involves the movement of chemicals or materials that have one or more hazardous properties. The hazardous properties are those that make up the nine U.S. Department of Transportation (US DOT) HAZMAT classes: explosives, gasses, flammable liquids, flammable solids, oxidizing substances and organic peroxides, toxic and infectious substances, radioactive materials, corrosive substances, and miscellaneous.
HAZMAT moving by truck or rail in Vermont are a significant cause of stakeholder concern. Incidents such as the 2007 derailment of 18 rail cars carrying gasoline in Middlebury can have lasting impacts even if the infrastructure is quickly repaired.15 While loads of bulk HAZMAT commodities are typically handled in specialized equipment and marked with placards, many consumer products contain some hazardous substances and may be transported in unmarked highway trailers or rail cars.
Between 2012 and 2020, 117 incidents were reported involving hazardous materials being transported by truck, rail, or air. 92% of those incidents were highway incidents, 7% involved air transportation, and less than 1% were railroad incidents. While the number of incidents per year fluctuates considerably, the overall trend between 2012 and 2020 has been slightly downward (See Figure 3.15).16
FIGURE 315 HAZMAT INCIDENTS BY TRANSPORTATION MODE, 2012-2020
Source: https://portal.phmsa.dot.gov/analytics/.
More than half of the reported incidents occurred while unloading HAZMAT, about 31% occurred while in transit, and about 15% occurred while loading (see Figure 3.16).17 These observations suggest that recommendations focused on improving safety at trip ends (origins and destinations) would address more than two-thirds of HAZMAT incidents.
15 https://addisonindependent.com/news/two-freight-train-cars-derail-middlebury-no-injuries-or-spills 16 https://portal.phmsa.dot.gov/analytics/ 17 Ibid.
024681012141618
202020192018201720162015201420132012
Highway Air Rail

Vermont Freight Plan Update
VERMONT FREIGHT PLAN (8/24/2021) 34
FIGURE 3.16 HAZMAT INCIDENTS BY TRANSPORTATION PHASE, 2012-2020
Source: https://portal.phmsa.dot.gov/analytics/.
Storage of rail cars containing these materials, which shippers often plan in order to accommodate winter fueling needs, are similarly of concern to residents when they are parked near residential or environmentally sensitive areas. Petroleum or coal products accounted for approximately 12 percent of the total rail tonnage moving to, from, within, or through the State in 2018. Although this total is projected to decrease slightly through 2045, railcars carrying these substances will continue to be a concern.
A 2018 study of commodity flows in Vermont included a list of freight yards and sidings where HAZMAT were stored, based upon 2017 reports. Table 3.8 lists the locations and the materials reported in 2017.
TABLE 3.8 RAIL YARD AND SIDING 2017 TIER II MATERIAL REPORTING DATA
Facility Location Reported Chemicals Bartonsville Siding Rockingham Propane
Bell Passing Siding Ryegate Propane
Brattleboro Rail Yard Brattleboro Curve Grease
Burlington Rail Yard (2 Yards)
Burlington Acetylene, Activators/Hardeners, Anti Freeze, Cleaning Solvents, Fuel Oil #2, Laquer Thinner, Motor/Engine Oil, Oxygen, Paint Polyurethane, Sodium Chloride, Sulfuric Acid, Traction Sand
Charlotte Rail Facility Charlotte Propane
Danby Passing Siding Mount Tabor Propane
Ely Rail Racility Fairlee Propane
Hacienda Rail Yard East Dorset Propane
Rutland Rail Yard Rutland Acetylene, Anti Freeze, Cleaning Solvents, Electrical Cleaner, Fuel Oil #2, Motor/Engine Oil. Oxygen, Propoane, Sodium Chloride, Sulfuric Acid, Traction Sand
South Wallingford Passing Siding
Wallingford Propane
Loading15%
Unloading54%
In Transit31%

Vermont Freight Plan Update
VERMONT FREIGHT PLAN (8/24/2021) 35
Facility Location Reported Chemicals St. Albans Rail Yard St. Albans Acetylene, Mineral Spirits, Anti Freeze, Battery Acid, Degreaser, Curve
Grease, Water Treatment, Diesel Fuel, H2O Conditioner, Hydraulic Fluid, Journal Oil, Lube Oil, Motor Oil, Oxygen, Silica, Thermite Welding Kits
Steel Track Bellows Falls Propane
Summit Siding Mount Holly Propane
Wells River Siding Wells River Propane
Willoughby Passing Siding
Sutton Propane
Source: 2018 Vermont Commodity Flow Study, Two Rivers-Ottauquechee Regional Commission (TRORC), 2018.
HAZMAT planning is a critical need for the State in terms of supporting and enhancing existing solid efforts. Railroads are responsible for the safe transport and handling of HAZMAT on their systems. However, multiple parties are involved in HAZMAT spill and incident response on highways, rail facilities, and airports, including the Vermont Emergency Management (VEM), Vermont Agency of Natural Resources, AOT, local fire departments, and private/local jurisdictional officials. Railroad partners such as VRS are also critical partners who can provide prepardness and response training to local and state officials. Exsting efforts in this area include:
• VEM produces training events, including a session on response to overturned rail cars. Such sessions are open to the public, and registration is available on the VEM website.18
• Vermont Hazardous Materials Response Team. Vermont’s Department of Public Safety has a dedicated HAZMAT response team which has a regional footprint such that it can address incidents quickly and statewide. It is at the request of local fire departments in need of assistance. The team, colloquially referred to as the “Glow Team” due to their
brightly colored body protection attire, exercises and trains frequently and its personnel are all trained through the HAZMAT Technician level of expertise. Educational videos and training opportunities are available on the Vermont Hazardous Materials Response Team’s website.19
• Regional Local Emergency Planning Committees (LEPC). The State is currently divided into, generally, county-based LEPCs, which are chartered by the State Emergency Response Commission (SERC) to develop HAZMAT-specific response/coordination plans. While the regional LEPCs are in various states of maturity, their meetings frequently draw in local emergency management directors, first responders, and owner/operators of those sites which hold and store HAZMAT. More information on the LEPCs can be found at: https://vem.vermont.gov/programs/lepc
It should be noted that the State is moving towards a single statewide LEPC model. This will provide consistent focus, enhanced compliance with federal statutes, higher fidelity awareness of Vermont’s HAZMAT storage sites
18 https://vem.vermont.gov/training/trainingprogram 19 https://firesafety.vermont.gov/emergency/hazmat
Source: Vermont Hazardous Materials Response Team

Vermont Freight Plan Update
VERMONT FREIGHT PLAN (8/24/2021) 36
and commercial users, improved engagement with managers and operators of these sites, and direct support to all-hazards planners throughout the State, including a planned GIS capability.
Continued communication between these groups and the freight carriers can help to ensure safety precautions, protocols, and incident response plans are more than adequate, and that officials who liase with the public have information that responds to their concerns. An occasional “summit” or meeting of relevant stakeholders could be useful for facilitating this communication. A regional summit which includes partners from other states are held annually through Transportation Community Awareness and Emergency Response (TRANSCAER). Three VEM members attended this training in the fall of 2019 and the 2020 training was scheduled for Bellows Falls, VT prior to COVID-19.20
3.6 Crashes and Fatalities
This section provides information on performance measures related to crashes and fatalities. These performance measures are assessed for both highway and rail modes.
Highway
As a freight performance measure for Vermont highways, the number of annual crashes involving heavy trucks in Vermont, is provided in Figure 3.17. Over the 2011- 2020 ten year period, the number of truck-involved crashes has fluctuated significantly. Between 2011 and 2015, crashes decreased in number, from 567 in 2011 to 489 in 2015. In the period between 2016 and 2019, the number of crashes exceeded 600 each year, peaking at 710 in 2018. There were fewer (472) crashes involving heavy trucks in 2020, likely due to the COVID-19 pandemic. Overall, and based on the past ten years, these figures indicate that crashes are in fact rising, as illustrated by the trend line in Figure 3.17. This trend of rising crashes is further magnified when taking into consideration the uncharacteristically low number of crashes in 2016, and likely depressed figures for 2020. As a result, key freight strategies and project recommendations should focus on improving safety along highways, especially for trucks.
The geographic distribution of truck-involved crashes, as Figure 3.19 shows, includes concentrations of crashes in and near the state’s urbanized areas. The Burlington urbanized area, including portions or Interstate 89, U.S. Route 7, U.S. Route 2, and other roads and highways in the area, are where the greatest number of the truck-involved crashes have occurred. The Montpelier-Barre area and Brattleboro area are also locations that have experienced more truck-involved crashes than other parts of the state.
20 Email from Patrick McLaughlin (Chief, VT Hazardous Materials Response Team), December 17, 2020.

Vermont Freight Plan Update
VERMONT FREIGHT PLAN (8/24/2021) 37
FIGURE 3.17 NUMBER OF HEAVY TRUCK-INVOLVED CRASHES IN VERMONT, 2011-2020
Source: http://apps.vtrans.vermont.gov/CrashPublicQueryTool/.
Fatalities as a proportion of all heavy truck-involved crashes are low, as Figure 3.18 shows. The number of fatalities each year between 2011 and 2020 appears to fluctuate, and is not completely consistent with the trend in the number of total heavy truck-involved crashes. The largest number of fatalities (10) was observed in 2019. While fatalities dropped to three in 2020, this may be depressed due to the COVID-19 pandemic. Although fatalities appear to be trending down, their low frequency more likely indicates no clear trend. As a result, it can be assumed that fatalities from truck-involved crashes remain a pressing issue that requires attention.
FIGURE 3.18 NUMBER OF TRUCK-INVOLVED FATAL CRASHES IN VERMONT, 2011-2020
Source: http://apps.vtrans.vermont.gov/CrashPublicQueryTool/.
472
670710647679
489504425437
567
0
100
200
300
400
500
600
700
800
2020201920182017201620152014201320122011
Number of Truck-Involved Crashes
3
109
4
7
5
98
67
0
1
2
3
4
5
6
7
8
9
10
11
2020201920182017201620152014201320122011

Vermont Freight Plan Update
VERMONT FREIGHT PLAN (8/24/2021) 38
FIGURE 3.19 VERMONT HIGHWAY FREIGHT CRASHES, 2015-2019
Source: VHB, 2021, using crash data from VTrans.

Vermont Freight Plan Update
VERMONT FREIGHT PLAN (8/24/2021) 39
Rail
Between 2011 and 2020, 25 rail accidents on freight railroads in Vermont (not including Amtrak) were reported to the Federal Railroad Administration. These consisted of 15 derailments and 10 “other” types of accidents. No fatalities were reported, one injury was reported in 2019, and the sum total cost of damage to track and equipment across all ten analysis years was $1.4 million. (see Figure 3.20).
FIGURE 3.20 NUMBER OF REPORTED FREIGHT RAIL ACCIDENTS BY YEAR, 2011-2020
Source: https://safetydata.fra.dot.gov/officeofsafety/publicsite/query/AccidentByStateRailroad.aspx.
2
1
2
3
5
0
3 3
5
10
1
2
3
4
5
6
2011 2012 2013 2014 2015 2016 2017 2018 2019 2020

Vermont Freight Plan Update
VERMONT FREIGHT PLAN (8/24/2021) 40
4.0 ADDITIONAL FREIGHT NEEDS AND GAPS In addition to the performance measure-related needs and gaps discussed in the previous sections, there are additional areas where initiatives could help meet freight needs in the State. Some of these areas are specific to certain modes, while others cut across multiple modes and/or external effects of freight. These areas of need include:
• Technological Innovation
• Post-COVID-19 Economic Recovery
• E-Commerce and Last-Mile Delivery
• Cross-Border Issues
• Truck Size and Weight Permitting and Harmonization
• “Freight Workforce”
• Climate Change and Resiliency
• Freight as a “Good Neighbor”
• Asset Management
4.1 Technological Innovation
Technological innovation has been transforming supply chain logistics since there was a need to transport goods from one location to another. Today, robust networks of information technology are used to manage inventory, track shipments across the globe, monitor performance, and respond to disruptions. Among the technological advancements that are being developed and deployed across the supply chain, alternative fuel technologies, connected and autonomous vehicles technology, and intelligent transportation systems technology are likely to have widespread effects on the freight transportation system in Vermont.
Alternative Fuel Technology
The transportation of goods throughout North America is almost entirely reliant on the combustion of fossil fuels, with diesel being the primary fuel type for highway and rail. Although the emissions from diesel-powered engines have improved substantially in recent decades, they continue to be a major source of several criteria pollutants and greenhouse gases. A central challenge facing the industry over the coming decades is how to successfully transition the freight transportation fleet to low- or no-GHG alternative sources of propulsion energy. This migration presents a critical opportunity to mitigate climate change, improve air quality and, potentially, spin off other categories of public benefits.
Among the alternative fuel sources that exhibit the most potential to achieve meaningful shares of the motor carrier market are battery electric (BE), compressed natural gas (CNG), propane (LPG), biofuels, and hydrogen fuel cell electric (HFC). CNG, LPG, and biofuels are generally considered an interim or transitional measure, as they offer

Vermont Freight Plan Update
VERMONT FREIGHT PLAN (8/24/2021) 41
only modest gains in reducing GHG and other criteria pollutants. Also, these technologies risk locking in fossil fuels, and they require their own infrastructure at a time when policy makers need to focus on longer term technologies. Thus, the focus is on batteries and hydrogen fuel cell technology linked to electric propulsion systems. Trials are underway with both of these technologies in the rail and highway realm.
In the rail sector, development of alternative technologies to diesel engines has lagged highway developments. This is due to the much smaller market for railroad locomotives than for highway trucks, the inherent energy efficiency advantages of rail over highway, the far longer longevity of the rolling stock (locomotives typically last for 40 or more years), and far higher energy requirements of a mainline locomotive versus a diesel highway tractor. This raises technical and economic challenges that will need to be addressed before widespread adoption can occur, a burden that the rail supply industry may not be able to absorb on its own. While many of the large Class I railroads have committed to migrating away from conventional diesel-electric locomotives for future fleet acquisitions, implementation at smaller railroads, including those operating in Vermont is expected to lag due to the cost and initial complexities associated with their deployment.21 Federal and state support for BE or HFC locomotives and associated refueling infrastructure will be needed to minimize that lag.
The challenges in migrating aviation towards low- or no-carbon fuels are more substantial than for highway and rail, due to the critical importance of weight in flight. While aviation accounted for approximately 3 percent of carbon dioxide emissions in 2018 associated with the US transportation sector, it accounted for nearly 9
21 Railway Age, Zero-Emission Locomotives on U.S. Railways? (February 12, 2021). https://www.railwayage.com/mechanical/zero-emission-locomotives-on-u-s-railways/?RAchannel=home and https://www.trains.com/trn/union-pacific-sees-battery-electric-locomotives-as-the-future/

Vermont Freight Plan Update
VERMONT FREIGHT PLAN (8/24/2021) 42
percent of GHG emissions.22 The vast majority of these emissions are associated with passenger transport, and impacts from air freight are modest. Efforts to reduce air emissions include lower carbon fuels that can be used in modern jet engines, along with BE and HFC technology. One example is Burlington-based BETA Technologies, which is developing battery-powered aircraft (see side panel). However, the technical and economic challenges associated with all options are substantial, and a clear path forward to achieving substantial reductions in GHG emissions is not yet evident.23 Here again, federal and statute support are needed to bring these technologies up to scale in the aviation sector before market forces can take over.
Key challenges to widespread adoption of alternative fuel vehicles in freight transportation fleets include the availability and density of fueling stations for the specific fuel types, the total cost of ownership of alternative fuel vehicles to fleet owners, and lack of experience with these new technologies. Components of the total cost of ownership include the cost to acquire the vehicle, fuel costs, any additional maintenance costs. The net cost of ownership also accounts for any incentives offered by federal or state governments.
The Vermont Diesel Emissions Reduction Grants Program, administered by the Vermont Department of Environmental Conservation (DEC), provides funding to local, state, and regional agencies or departments, businesses, institutions, and nonprofit organizations. The grants are available for projects focused on reducing emissions from diesel engines and vehicles that meet a number of qualifications. Qualifying heavy-duty vehicles include Class 5-8 trucks, locomotives, marine engines, and non-road cargo handling equipment. 24 There are also grants available from the Vermont Department of Housing and Community Development, loans from Vermont State Infrastructure Bank, and incentive programs available from several utility companies in Vermont that are available to organizations that install fueling, charging, and/or other alternative fuel supportive equipment.25
A study conducted by the New York Metropolitan Transportation Council26 in 2021, analyzing alternative fuel vehicle technologies in several northeastern states, found that the greatest driver of total cost of ownership for each fuel type is the total lifetime fueling cost. The study also anticipated battery electric trucks would overtake diesel trucks in percent of new vehicle sales by 2034, and that diesel trucks would represent less than 5 percent of new vehicle sales by 2045. BE technology is already cost effective on a life-cycle basis for light and medium duty trucks.
While Vermont was not included in the study referenced above, a combination of incentives and building out fueling/charging infrastructure could promote more rapid adoption of alternative fuel trucks in the
22 https://www.c2es.org/content/reducing-carbon-dioxide-emissions-from-aircraft/ Inventory of U.S. Greenhouse Gas Emissions and Sinks: 1990-2018 https://www.epa.gov/ghgemissions/inventory-us-greenhouse-gas-emissions-and-sinks-1990-2018
23 How the Airlines Plan to Achieve a Greener Flying Future https://www.afar.com/magazine/how-airlines-are-working-to-reduce-their-carbon-footprint
24 https://dec.vermont.gov/air-quality/mobile-sources/diesel-emissions/vt-diesel-grant#:~:text=The%20Vermont%20Diesel%20Emissions%20Reduction,powered%20engines%20and%20the%20associated.
25 https://afdc.energy.gov/laws/all?state=VT. 26 https://www.nymtc.org/ereports/Spring-2021/Freight-Studies-Updates.

Vermont Freight Plan Update
VERMONT FREIGHT PLAN (8/24/2021) 43
state. As of 2021, three highway corridor segments in Vermont have been identified as “Corridor-Ready” for electric vehicles, based upon the availability of charging stations. There is no indication as to whether or not the stations in these corridors can accommodate rapid charging for trucks. The corridor-ready segments in Vermont include:
• US-2: Between Danville and Montpelier
• US-7: Between Bennington and the US-7/I-189 interchange in South Burlington; and
• SR-9: Between the VT/NH border and the VT/NY border.
While thee corridor designations may be useful to plan additional charging infrastructure and to coordinate with neighboring jurisdictinos, they should not be taken to mean that electric vehicles are impractical along other routes in Vermont. On the contrary, Vermont already has over 300 poublicly available charging stations in service, including nearly thirty fast charging stations, with more coming online all the time. Further analysis of the existing and planned fueling sites for various alternative fuels in Vermont and surrounding regions, and coordination with planning partners in neighboring states and Canada, could lead to the identification and implementation of strategies to promote alternative freight fueling infrastructure development in key freight corridors and trade lanes. Pilot projects for BE or HFC heavy duty trucks, along with locomotives and aircraft, would help these technologies establish a beachhead in Vermont. VTrans is working with DEC and AAFM on a potential pilot project to move heavy-duty dairy trucks around the State using BE or HFC systems.
Connected and Autonomous Vehicles Technology
The use of automated vehicle technologies in trucking is developing quickly. While passenger cars garner much of the media attention, an increasing number of trucks are utilizing sensor, communications, and/or processing software technologies for both steering and braking assistance. The implementation challenges as well as the potential benefits of greater vehicle automation are substantial. As outlined by the National Highway Traffic Safety Administration, the potential benefits include improved safety and efficiency, lower economic and societal costs, and greater convenience and mobility.27 Challenges include, but are not limited to, operations with mixed traffic, handling irregular or unexpected incidents, instilling confidence in the safety and reliability of autonomous trucks in the minds of the industry and public sector, inconsistent state-level regulations, developing procedures for roadside safety inspections, and the potential for substantial workforce displacement.
The Society of Automation Engineers’ automation levels classification scheme is the industry standard in terms of measuring the degree of automation in a vehicle (see Figure 4.1). Currently the highest level of truck automation commercially available is “driver assistance” (Level 1). Partial and conditional automation are in the pre-commercial stage, and high and full automation are in research and development.28
27 https://www.nhtsa.gov/technology-innovation/automated-vehicles-safety. 28 Source: “Automation in the long haul: Challenges and opportunities of autonomous heavy- duty trucking in the
United States”

Vermont Freight Plan Update
VERMONT FREIGHT PLAN (8/24/2021) 44
FIGURE 4.1 LEVELS OF AUTOMATION
Source: National Highway Traffic Safety Administration.
Global vehicle manufacturers are actively engaged in the development of autonomous trucks, which given the relative economic incentives, are expected to outpace autonomous passenger vehicles in terms of widespread commercial adoption. More than 50 companies are engaged in testing various technology schemes for autonomous trucking. Systems in testing phases today automate the freeway portion of a truck's journey, and allow the driver to take over to navigate the more complex local roads. The approach is designed to enable truck drivers to complete more journeys per day, while spending less time actually driving.
A related approach to autonomous vehicle operation drawing significant interest is platooning. Truck platoons use vehicle-to-vehicle communications and autonomous vehicle control technology to electronically “tether” tractor-trailers together in a convoy formation. One of the primary benefits of platooning is greater fuel efficiency, which stems from reduced aerodynamic drag on the following vehicle(s). According to the North American Council for Freight Efficiency, the average fuel savings of two-truck platooning in “real world” operations is approximately 4%.29 Key challenges or limiting factors to widespread platooning operations include industry and public acceptance, regulatory isses, and the practical issues of matching trucks by origin-destination, route, and time.
The federal government has been actively engaged in the development of autonomous vehicles in recent years. In 2016, the US Transportation Secretary announced a 10-year, $4 billion plan aimed at accelerating the development, adoption and integration of safe autonomous vehicles. Under the plan, the government is funding large-scale pilot programs, and works with both public and private-sector participants to ensure a shared framework for connected and autonomous vehicles.30
The US Department of Transportation released its Federal Automated Vehicle Policy in 2016, followed by Automated Driving Systems 2.0: Vision for Safety in 2017, and Preparing for the Future of Transportation: Automated Vehicle 3.0 in 2018, which provides more detailed guidance and best practices in terms of testing and deployment of automated technologies. It also focuses on greater transparency and public engagement in the
29 http://nacfe.org/technology/two-truck-platooning/. 30 https://www.transportation.gov/sites/dot.gov/files/docs/DOT-fy-17factsheet.pdf.

Vermont Freight Plan Update
VERMONT FREIGHT PLAN (8/24/2021) 45
process in order to improve public support and confidence, which is viewed as critical to the adoption of such technologies. Still, the challenges to implementing widespread autonomous vehicle technology are substantial and will require years of effort and cooperation between the part of industry, lawmakers, and the public to overcome.
Autonomous Delivery Technologies
Urban, town center, and otherwise congested areas represent a significant challenge for both autonomous and connected vehicles. The interaction of trucks, cars, cyclists, and pedestrians – all moving in different directions at different times for different purposes – presents automated vehicles with a huge amount of variability and unpredictability. As a result, the vehicle platooning automation currently in development generally functions with at least some degree of human control once the platoon exits limited-access highways. Similarly, while driver assistance technologies greatly enhance truck efficiency and safety on local roadways, development of higher levels of automation often focus on long-haul, over-the-road operation.
The costly nature of local deliveries, and challenges associated with operating trucks and commercial vans in urban contexts, have inspired numerous potential innovations, including fully autonomous delivery vehicles. Delivery “robots,” such as the food delivery bots operating in Washington, DC and shown in Figure 4.2, and parcel delivery bots being tested elsewhere, aim to improve the efficiency (in terms of time, cost, emissions, and other factors) of last-mile deliveries.
FIGURE 4.2 DELIVERY ROBOT IN WASHINGTON, DC
Source: Washington Post.
Autonomous aircraft and aerial drone technology for freight transportation applications is being developed and tested by several companies across the country, and is a potential future application of the ALIA aircraft developed by BETA Technologies of Burlington, featured earlier in this memorandum. As of 2021, there is a limited number of Federal Aviation Administration (FAA)-approved unmanned aircraft system (UAS), or drone, commercial delivery services. UPS Flight Forward was the first to receive approval for revenue-generating package delivery service via UAS in late 2019.31 UPS Flight Forward has agreed to purchase up to 150 ALIA aircraft from BETA technologies, with the first 10 expected to be delievered in 2024. The aircraft would be piloted by a human pilot, but autonomous operation could come later in the future.32 As of 2021, UPS Flight Forward is delivering medical
31 https://www.faa.gov/news/press_releases/news_story.cfm?newsId=24277. 32 https://evtol.com/news/beta-technologies-ups-deal-150-evtol-aircraft/.

Vermont Freight Plan Update
VERMONT FREIGHT PLAN (8/24/2021) 46
samples to testing labs for a healthcare customer in North Carolina. The FAA worked with nine partner organizations through a pilot program from 2017-2020, and is continuing to work with eight organizations in the BEYOND Program, launched in October 2020, to address remaining challenges to fully integrating UAS technologies.33
Technological Innovation Need
Vermont needs to anticipate and be prepared for the development and deployment of these and other technological innovations that could change the demands on the multimodal freight transportation system. “Getting ahead of the curve” could include efforts by VTrans and other organizations in the state to partner with research institutions, tech companies, transportation equipment manufacturers, and other innovators, to manufacture and/or pilot-test equipment in Vermont. In addition, Vermont officials could work with neighboring states to harmonize regulations that affect technological development and deployment. This work should including continued participation in New England Transportatoin Consortium34 efforts such as the development of 20-4 New England Connected and Automated Vehicle Legal, Regulatory and Policy Assessment and the implementation of the recommendations therein.
4.2 Post COVID-19 Economic Recovery
The COVID-19 pandemic has had a measurable impact on the economy of the State of Vermont, the nation, and the world. In March and April 2020, as stay-at-home orders were issued in many states, economic activity, across nearly all sectors, declined sharply. In the summer of 2020, as some businesses reopened, and many consumers adjusted to a “new normal” consisting of working from home, schooling from home, or following protocols designed to reduce the spread of the virus at worksites, consumer spending began to rise.
The pandemic introduced a number of challenges to supply chain systems and freight logistics. Shifts in demand resulted in problems with product production and logistics. In perhaps the most famous example, toilet paper “shortages” were reported when demand instantly shifted from institutional and commercial customers (e.g., public places, schools, and office building restrooms) to consumers seeking product to purchase and use in their homes. This change in demand also changed the distribution of product and logistics between two different supply channels. In short, the wrong product was in the wrong logistics pipeline, thus giving the consumer the impression of a supply shortage.
The pandemic resulted in a decline in business for many goods-producing and freight companies in Vermont. Milk producers who developed products consumed in public schools lost a large portion of their business when schools closed. Food product manufacturers and distributors that serve restaurants, hotels, and other businesses that rely upon tourism lost revenue when visitors stayed home.
33 https://www.faa.gov/uas/programs_partnerships/beyond/. 34 https://www.newenglandtransportationconsortium.org/

Vermont Freight Plan Update
VERMONT FREIGHT PLAN (8/24/2021) 47
The economic recovery from the pandemic has been uneven, when viewed by the effect on employment of high-wage versus low-wage workers, and by industry sector. As Figure 4.3 shows, employment in high-wage jobs earning more than $60,000 per year has largely rebounded and now exceeds pre-pandemic employment. Low-wage employment (less than $27,000 per year) remains nearly 35% below pre-pandemic levels. By industry sector, employment in health and education services is more than 6% higher than pre-pandemic, while tourism and hospitality employment has not recovered from the losses of 2020, as shown in Figure 4.4.
FIGURE 4.3 PERCENT CHANGE IN VERMONT EMPLOYMENT BY INDUSTRY SECTOR, JANUARY 15, 2020 THROUGH MARCH 10, 2021
Source: https://tracktherecovery.org/.

Vermont Freight Plan Update
VERMONT FREIGHT PLAN (8/24/2021) 48
FIGURE 4.4 PERCENT CHANGE IN VERMONT EMPLOYMENT BY WAGE COHORT, JANUARY 15, 2020 THROUGH MARCH 10, 2021
As the economy of Vermont and the nation recover from the pandemic over the next few years, several trends may continue or change. Near-term, the reduced capacity of the logistics system is resulting in higher transportation and purchase prices for many products, including construction materials, food products, and many durable consumer goods. The rapid rise in e-commerce demand (see Section 4.3 for more information) and capacity issues in the United States Postal Service are resulting in ongoing reliability issues affecting parcel delivery times.
Longer-term, continued e-commerce growth could necessitate the development of more e-commerce fulfillment centers, including in and near Vermont’s population centers. Some companies are considering diversifying production and materials sourcing in order to make their supply chains more resilient against disruptions associated with pandemics or other crises. Population growth in Vermont, which was observed during 2020, may continue or subside. Growth in population could generate more demand for products, more economic activity, and more freight demand in the State.
Vermont needs to monitor population and demographic trends, economic and logistics trends, and develop more advanced modeling and forecasting capabilities in order to anticipate the potential effects of various future scenarios on freight demand in the state.
4.3 E-Commerce and Last-Mile Delivery
E-commerce is typically defined as the processing of customer orders electronically, using the Internet, and shipment and delivery of the ordered products to the customer’s specified location. In the 1990s, e-commerce emerged with a focus on business-to-business transactions. Consumer retail e-commerce also emerged in the 1990s, with online retailers such as Amazon and eBay launching late in that decade.
Source: https://tracktherecovery.org/.

Vermont Freight Plan Update
VERMONT FREIGHT PLAN (8/24/2021) 49
U.S. e-commerce sales have been rapidly expanding since the late 1990s, rising from $4.5 billion in the fourth quarter of 1999 to $215 billion in the first quarter of 2021, per data from the US Census. Growth in online sales has widely outpaced overall retail sales growth. Between the fourth quarter of 1999 and the first quarter of 2021, quarterly e-commerce sales increased by an average of 20% year-over-year, compared to a pace of just 3% for total retail sales. As a result, e-commerce now accounts for about 14% of total US retail sales (see Figure 4.5), compared to less than 1% in 1999.
The COVID-19 pandemic, and associated stay-at-home orders and recommendations nationwide, contributed to a steep increase in e-commerce sales in the first half of 2020. As some pandemic-associated isolation protocols were relaxed later in 2020, brick-and-mortar retail reclaimed some market share. However, there is no doubt that e-commerce sales have exceeded pre-COVID growth trends.
FIGURE 4.5 ESTIMATED QUARTERLY RETAIL E-COMMERCE SALES AS PERCENT OF TOTAL QUARTERLY RETAIL SALES, 1ST QUARTER 2012-1ST QUARTER 2021
Source: https://www.census.gov/retail/mrts/www/data/pdf/ec_current.pdf.
The undisputed giant in e-commerce, Amazon, continues to dramatically impact consumer expectations regarding product delivery standards. In 2005, the company started Amazon Prime, providing free two-day shipping on certain products to Prime members for an annual fee. More recently, Prime Now offers free same-day delivery in major metro markets and faster and/or tailored delivery for select high-volume goods for an additional fee. Given Amazon’s significant market presence, other major retailers have had little choice but to follow suit, offering a combination of free and/or faster delivery. For instance, Target acquired online same-day delivery platform Shipt in 2018 with the goal of providing same-day delivery for all major product categories in all major markets. This is one of many examples of a trend that has become pervasive. These offerings have allowed consumers to become more demanding in terms of delivery times, without understanding the transportation system and environmental costs of fulfilling those demands (see GHG emissions discussion below).
The rapid growth in the consumer e-commerce market, combined with faster delivery standards, is having significant repercussions on warehouse location decisions. There is a notable shift away from the practice of using a small number of enormous facilities located at a considerable distance from the urban areas they serve, toward using more numerous, smaller industrial spaces located closer to the end consumer, wherever they live. E-commerce fulfillment centers are being developed as stand-alone facilities, or incorporated into retail stores for

Vermont Freight Plan Update
VERMONT FREIGHT PLAN (8/24/2021) 50
online orders placed for in-store pick-up. In some cases, such as many former Sears and K-Mart stores nationwide, 20th century retail buildings are being converted into e-commerce fulfillment centers to meet the retail needs of the 21st century. Amazon has several fulfillment center facilities serving Vermont customers, including in Schodack, New York and Nashua, New Hampshire.
Most parcel deliveries in rural areas are performed by the United States Postal Service, which handles approximately 40 percent of Amazon orders nationwide. UPS, FedEx, and Amazon’s own fleet of delivery vehicles also deliver many consumers’ e-commerce orders. While Amazon has maintained such services are only in place to supplement third-party capacity, given its significant impact on the retail market, its dealings in the distribution market are expected to have major repercussions for overall logistics operations and pricing.
Less-than-truckload (LTL) motor carriers have also benefitted from the rise of e-commerce orders. LTL carriers fill the gap between shipments under 150 pounds, which are transported and delivered by parcel carriers such as UPS and FedEx, and full truckload carriers moving loads in excess of 15,000 pounds. LTL carriers may use large trailers to move shipments for several customers at a time. E-commerce orders that are too large or heavy to move through the parcel delivery system, including furniture, appliances, and other large and bulky items, are typically delivered by LTL carriers.
Looking forward, e-commerce is likely to continue increasing its share of retail sales for the foreseeable future. If the historical growth trend continues, e-commerce could represent half of retail sales by 2050, resulting in an increase in package volume of more than 320%.35 In addition, the “reverse logistics” flow of unwanted items that consumers return places demands on parcel carriers and retailers’ warehousing capacity. Return rates vary, but in the apparel and shoes category, which makes up about 30% of e-commerce sales, an estimated 30-40% of items ordered are returned.36
The potential growth in orders (and returns) is likely to result in many more delivery vehicle trips and potential issues with parking and loading activities, particularly in town centers and urban areas. Use of autonomous delivery technologies could address some of these potential issues (see Autonomous Vehicle Technology discussion below).
Vermont needs to acquire more data and forecasting capacity in order to estimate the potential effects of e-commerce delivery trips on the performance of the highway system, town roads, emissions, and the economy.
4.4 Cross-Border Issues
As described in Section 3.4, several construction projects are underway or anticipated on I-89 at Highgate Springs, and its continuation into Canada as Autoroute 35. These construction activities, which are projected to be completed around 2025, will affect vehicular mobility throughout the region, particularly for cross-border traffic. Impacts will be especially significant on freight traffic, as large trucks have less operational flexibility and impose
35 https://www.njtpa.org/2050FreightForecasts.aspx. 36 https://www.cnbc.com/2019/01/10/growing-online-sales-means-more-returns-and-trash-for-landfills.html.

Vermont Freight Plan Update
VERMONT FREIGHT PLAN (8/24/2021) 51
greater collateral impacts on other road users than smaller commercial and passenger vehicles. Increases in processing time, lane/roadway closures, compromised roadway geometry, and detours will likely lead to periods of extended congestion at POEs as well as impact alternative state and Interstate routes, including I-91 at Derby Line VT and I-87 at Champlain, NY. VTrans has been leading an effort to coordinate activities among the involved parties, and undertake mitigating actions if needed.
In an increasingly competitive freight rail environment, the two Canadian Class I railroads are challenging each other to gain competitive advantages in their Canadian and U.S. markets. In 2020, Canadian Pacific (CP) acquired the Central Maine and Quebec Railway (CMQ), thus giving CP improved access to Canada’s East Coast. CP is investing in its eastern network, including development of a new transload facility in the Montreal area, and improvements related to the expansion of the Port of Saint John, New Brunswick. Through these investments, CP is expanding its market presence and attempting to capture growing port traffic in light of increased trade between Canada and the European Union. 37
Canadian National Railway (CN) is also investing in its network to maintain competitive advantages in the east, and to expand its West Coast capacity and compete with CP there. CN and CP are presently also locked in a competition to acquire Kansas City Southern Railway (KCS), which offers access to the sizable US Gulf Coast and Mexican markets. In May 2021, CN and KCS entered into a definitive merger agreement, which remains subject to Surface Transportation Board (STB) approval.38
The proposed acquisition of Pan Am Railways by CSX presents additional potential for ownership and competitive shifts in the region. The acquisition application was rejected by the STB in May 2021, with CSX directed to provide additional material to address STB concerns.39 A principal issue is the impact that the CSX acquisition will have on short line connections, including the Vermont Railway, and the proposed transfer of local rail operations along the Pan Am Southern trackage to Genesee and Wyoming (G&W) subsidiary Pittsburgh and Shawmut operating as the Berkshire and Eastern. G&W is also the parent company of the NECR. This proposed approach is likely to have competitive impacts on Vermont Railway and its afflliated carriers.
All of these competitive developments could affect the volume of freight and the level of service offered to rail shippers in Vermont. In the near term, the development of more transload capacity in the Montreal market could lead to additional truck crossings at the Vermont-Quebec border. Expanded Class I capacity in the region could, in theory, improve the frequency of interchange service with regional and short line railroads serving Vermont, and thus, improve Vermont’s freight rail level of service. However, consolidation can impact competitive pricing, and the continuation of Precision Schedule Railroading (PSR), with its focus on operational efficiency can lead to less attractive freight rail options for Vermont shippers, and thus, more truck trips instead.
Through multi-state and cross-border forums such as the Northeast Association of State Transportation Officials (NASTO) and the Eastern Border Transportation Coalition (EBTC), Vermont should work with other states and
37 https://www.rtands.com/freight/class-1/canadian-pacific-building-new-multi-commodity-transportation-and-distribution-terminal-in-montreal/; https://www.cpr.ca/en/.
38 https://www.railwayage.com/regulatory/for-cn-kcs-merger-proposal-support-growing/ 39 https://www.freightwaves.com/news/csxs-application-to-acquire-pan-am-railways-denied

Vermont Freight Plan Update
VERMONT FREIGHT PLAN (8/24/2021) 52
Canadian provinces in the region to anticipate and coordinate efforts that support or expand freight rail service, intermodal and transload terminal development, and truck and rail traffic associated with those developments.
4.5 Truck Size and Weight Permitting Harmonization
The maximum size and weight of trucks that can travel on highways in Vermont are determined by a combination of federal and state laws and enforcement policies. Vermont’s size and weight laws are enumerated in Title 23 of the Vermont Statutes.40
Vermont allows up to 22,400 lbs. on a single axle, 36,000 lbs. on tandem axles, and up to 600 lbs. per inch of tire width on non-Interstate highways. Trucks traveling on the Interstate Highway System, nationally, are limited to the Federal limits of 20,000 lbs. on a single axle, 34,000 lbs. on tandem axles, and a gross weight of 80,000 lbs. However, Vermont and Maine are permitted to apply state limits in lieu of Federal vehicle limits through December 31, 2031, as part of the extended Maine and Vermont Interstate Highway Heavy Truck Pilot Program.
In addition, Vermont allows milk to be hauled in vehicles weighing up to 90,000 lbs., including on Interstate Highways, due to a Federal grandfather provision. There are also accommodations for agricultural service vehicles up to 60,000 lbs. in gross weight, which do not require special permits. Vermont allows vehicles with six (6) or more axles to exceed state weight limits up to a maximum of 99,000 lbs. gross to obtain annual permits.
Vermont is also a participant in an ongoing Federal heavy truck pilot program, which allows trucks up to 99,000 lbs. in gross vehicle weight (the state highway limit) on interstate highways. Maine is also participating with a limit of 100,000 lbs. This program has been in effect since 2010.41
Compared to neighboring states, Vermont’s weight limits are relatively similar, with slight variations in maximum weights on non-Interstate highways and exemptions, as Table 4.1 shows.42
TABLE 4.1 TRUCK SIZE AND WEIGHT LIMITS (POUNDS) FOR VERMONT AND NEIGHBORING STATES
State Non-Interstate Interstate Gross Weight
Commodity Exemptions
Notes
Single Axle Weight
Tandem Axle Weight
Other Specifications
Single Axle Weight
Tandem Axle Weight
Vermont 22,400 (with a 10%
tolerance)
36,000 (with a
10% tolerance)
600 lbs. per inch of tire width
22,400 36,000 80,000 Milk (up to 90,000 lbs.)
Federal pilot program allows up to 99,000 lbs.;
40 https://legislature.vermont.gov/statutes/chapter/23/013. 41
https://ops.fhwa.dot.gov/freight/sw/reports/me_vt_pilot_2012/#:~:text=Vermont%20allows%20all%20trucks%20legal,weight%20allowance%2C%20which%20allows%20a
42 https://ops.fhwa.dot.gov/freight/policy/rpt_congress/truck_sw_laws/app_a.htm#vt.

Vermont Freight Plan Update
VERMONT FREIGHT PLAN (8/24/2021) 53
State Non-Interstate Interstate Gross Weight
Commodity Exemptions
Notes
Single Axle Weight
Tandem Axle Weight
Other Specifications
Single Axle Weight
Tandem Axle Weight
New Hamp-shire
22,400 36,000 99,000 lbs. GVW on non-interstate highways
20,000 34,000 80,000; 99,000
on non-interstate highways
None Higher weight limit (99,000) on some grandfathered routes (89, 93, 95)
New York 22,400 36,000 800 lbs. per inch of tire width
20,000 34,000 80,000 None Some special rules on NYS Thruway
Mass-achusetts
22,400 (if axles are more than
6ft apart, or else 18,000)
34,000 800 lbs. per inch of tire width
20,000 34,000 80,000; 99,000
on non-interstate highways
Construction materials, bulk feed, liquid petroleum, refuse
Different (higher) limits on Mass Pike
Maine 22,400 (20,000 when GVW
exceeds 73,280)
38,000 600 lbs. per inch of tire width
20,000 34,000 80,000 on
interstate highways
; 94,000 or
100,000 for
specific vehicle/
configur-ations
Potatoes, forest products, raw ore
Pilot-Program for Canadian Weight Limit Access from Calais to Baileyville
Source: “Compilation of Existing State Truck Size and Weight Limit Laws,” FHWA, 2019.
The Vermont Department of Motor Vehicles issues a variety of permits for commercial trucking, and provides information on required routing for oversized or overweight loads.
Vermont, New Hampshire, Massachusetts, Maine, and Rhode Island formed the New England Transportation Consortium (NETC), which developed a common approach to issuing multi-state permits for the movement of non-divisible loads. A single permit may be issued by one of the member states on behalf of all of the states in the consortium, provided the vehicle and load are within defined limits (90 feet in length; 13 feet 6 inches in height; 14 feet in width, with additional 6 inches of overhang allowed for the eaves on mobile and modular home components only; and 108,000 lbs. for 5 axle and 120,000 lbs. for 6 or more axle truck tractor-semitrailer combination vehicles). Vehicles and loads exceeding those thresholds must apply for permits within each applicable state. The permits may be used to travel on a list of predetermined routes.
The multi-state agreement helps to streamline the process of applying for and issuing permits for oversize and overweight loads in the New England region. Loads traveling between Vermont and New York, and/or other states

Vermont Freight Plan Update
VERMONT FREIGHT PLAN (8/24/2021) 54
outside the NETC, must apply for separate permits in each state. Working with New York and other states could further streamline the permitting process, improving administrative performance and reducing costs to carriers and shippers.
4.6 “Freight Workforce”
As introduced in Tech Memo 2, the transportation and logistics sector is facing some critical workforce challenges including:
• Many jobs in the transportation and goods movement industries are considered “middle skill” jobs that rely on experience and knowledge that is most effectively gained in the work environment or in apprenticeship programs that simulate the work environment.
• The motor carrier and railroad industries have been reporting labor shortages for many years, due to limited growth in earning potential, long and often irregular working hours, time away from home, and other factors.
• The median age of the workforce in these positions is quite high, suggesting retirements are and will continue to contribute to the attrition.
Combined with Vermont’s longstanding demographic trends of an aging and stagnant population, the prospect for producing a sizeable workforce of younger entrants into these positions has not been optimistic. Since the COVID-19 pandemic, evidence suggests that new residents, including young people and families with children, have been moving into Vermont, and that many plan to stay after the pandemic subsides.
Industry-proposed solutions to addressing the labor force shortage in the trucking industry have included lowering the permissible driving age from 23 to 18, and employing immigrants on special work visas. In addition, CDL training schools, community colleges, and other organizations can partner with the industry in order to offer training in emerging truck technologies, railroading, warehouse management, supply chain logistics, and other related fields. Longer-term, autonomous operations are expected to result in reduced workforce needs, or at least a less-skilled one.
There are a number of workforce-related programs in Vermont that focus on freight-related occupations. Examples of training and continuing education programs for careers in manufacturing and/or logistics include several degree programs and Office of Continuing Education & Workforce Development programs at Vermont Tech43 and the Vermont Manufacturing Extension Center.44 VTrans offers up to $1,500 to woman, minority, or disadvantaged persons to obtain a CDL, and many motor carriers are offering attractive signing bonuses and other incentives to help fill available positions. The Vermont Student Assistance Corportation also provides “non-degree” grants that
43 https://www.vtc.edu/ ; https://cewd.vtc.edu/cewd/manufacturing/ 44 https://vmec.org/about/

Vermont Freight Plan Update
VERMONT FREIGHT PLAN (8/24/2021) 55
can be used towards CDL training, and the Department of Labor’s Worforce Innovation and Opportunity Act programs can also provide assistance.45
The Vermont Department of Labor Workforce Development Division operates 12 regional offices (Career Resource Centers) which provide broader help for job-seekers across a number of industry areas. A formal apprenticeship program is also available with freight-related industries like advanced manufacturing and construction identified as promising career areas.46
Consistent with the National Freight Strategic Plan strategic goals, Vermont should prepare for the future by supporting the development of workforce capabilities that improve freight system performance.47 A policy initiative that includes reinforcing connections between private sector industry, educational institutions across Vermont, and workforce organizations can help to ensure Vermont has the workforce to meet future industry needs.
4.7 Climate Change and Resiliency
Freight rail requires substantially less energy and emits fewer tons of greenhouse gases (GHGs) than trucks. Freight trains can move a ton of freight more than 470 miles on one gallon of diesel fuel. 48
The transition of truck and locomotive engines from diesel to electric or other alternative fuel power (discussed in greater detail in the “Technology” sub-section), combined with the potential to shift electric power generation to more sustainable sources (e.g., solar and wind), could substantially reduce the GHG emissions associated with freight transportation.
In addition, companies that produce and distribute goods may begin producing more goods domestically in order to mitigate risk in light of global logistics challenges observed during the COVID-19 pandemic, and are building tiered distribution systems to make product placement and distribution as efficient as possible. These actions could bring the added benefit of reducing GHG emissions.
Consumers can also play a role in reducing freight emissions by researching the sources of products they buy, and by adjusting online shopping habits. As convenient as next-day shipping services may seem, placing multiple such orders over the course of a week or two results in multiple shipments and multiple delivery trips. Filling a “virtual shopping cart” over time, and placing an order when several items are gathered could result in more efficient packaging and fewer delivery trips, thus reducing the net GHG emissions effect of the purchase(s). Buying only the items the consumer intends to keep, instead of multiple items (different sizes, colors, etc.) with the intention of
45 https://vtrans.vermont.gov/civil-rights/employment/edhc/cdl 46 https://labor.vermont.gov/apprenticeship 47 https://www.transportation.gov/sites/dot.gov/files/2020-09/NFSP_fullplan_508_0.pdf 48 https://www.aar.org/climate-change

Vermont Freight Plan Update
VERMONT FREIGHT PLAN (8/24/2021) 56
return-shipping items back to the seller also helps to reduce the number of vehicle trips and associated emissions.49
Vermont’s multimodal freight transportation network is part of a larger regional and national system. Adding alternative routes and redundancy to the freight transportation network provides a resiliency benefit in the event that emergency conditions impact the availability of the roadway network or rail routes for travel, disaster response, or other immediate needs.
The closure of the Hoosac Tunnel between February and early April, 2020 due to a partial collapse provided the most recent example. Although the closure itself was not in Vermont, the State’s rail assets allowed freight traffic to bypass the closure. However, due to weight limits on the GMRC, rail cars were limited to 263,000 pounds reducing the efficacy of the bypass route.
Tropical Storm Irene, which passed through Vermont in August 2011, damaged more than 500 miles of state highway and 200 bridges, with more than 2,000 segments of municipal road damaged along with more than 280 bridges and 960 culverts. The rail network suffered as well: 107 washouts, including 50 very large washouts, and six rail bridges had major structural damage.50 In total, more than 200 miles of rail in the state-owned rail system were damaged, and with the bridges cost an estimated $21.5 million in repairs, with the Federal Emergency Management Agency (FEMA) covering those costs.
Since then, advocacy and stakeholder organizations in Vermont advanced a collaborative effort to identify lessons learned, along with a series of preemptive actions and plans to minimize the impacts and costs of similar events in the future. A significant part of these resiliency planning efforts is to integrate improvements to infrastructure, including transportation infrastructure,to be able to withstand weather events and climate change with the aim of mitigating property loss.
As part of these efforts, the Vermont Roadmap to Resilience was created, with four key principles:
• Know Our Risks
• Elevate & Integrate Emergency Management
• Align Rules & Investments for Stronger Communities
• Working Together & Learning Together51
This work also addresses a FAST Act planning goal, guiding statewide and non-MPO transportation planning processes to“improve the resiliency and reliability of the transportation system and reduce or mitigate stormwater
49 https://ctl.mit.edu/sites/default/files/library/public/Dimitri-Weideli-Environmental-Analysis-of-US-Online-Shopping_0.pdf; https://www.businesswire.com/news/home/20200127005508/en/The-Environmental-Impact-of-E-Commerce-2020---Special-Sales-like-Black-Friday-Cyber-Monday-Burden-the-Environment-Due-to-the-Intense-Amount-of-Packaging-Shipping-Delivery---ResearchAndMarkets.com.
50 Vermont Agency of Natural Resources: http://www.anr.state.vt.us/anr/climatechange/irenebythenumbers.html; http://www.vermontrailway.com/news_pages/images/gallery.pdf
51 https://anr.vermont.gov/about_us/faq/cr

Vermont Freight Plan Update
VERMONT FREIGHT PLAN (8/24/2021) 57
impacts of surface transportation.” This goal has been incorporated into the State’s LRTP through Objective 1.5 “Improve the resilience of the transportation system.” 52
One outcome from this emphasis on resiliency is development of the Vermont Transportation Resilience Planning Tool (TRPT).53 As part of the work to develop this tool, vulnerability assessments are being completed for all road/river embankments along state and town highways, all long structures (span greater than 20 feet) on state and town highways, and all culverts and short structures on the state highway system. This tool allows the state to quantify the flood vulnerability and risk to these assets as well as considerations of how critical the road segment is to transportation based on relative travel time impact. The second phase of work on the Transportation Resilience Planning Tool (TRPT) was completed in 2020 and encompassed several sub-watersheds across the state. TRPT flood vulnerability coverage to roads and structures now stands at 20% of the total statewide area. Phase 3 work commenced in late 2020 and will provide 100% TRPT flood vulnerability coverage to Vermont’s roads and structures in 2021.
The number of structures and the number of road miles in each county by relative vulnerability category are shown in Table 4.2 and Table 4.3, and Figure 4.6 shows a snapshop of the data available in the online tool.
Based upon the data available in the TRPT, approximately 3% of the structures in Vermont and 18% of Vermont’s road miles are highly vulnerable to flooding.
TABLE 4.2 VERMONT STRUCTURE FLOOD VULNERABILITY BY COUNTY
County Structure Vulnerability Category (Structure Count) Grand Total High Low Moderate Not Vulnerable
Addison 36 236 97 1,553 1,922 Bennington 33 191 101 811 1,136 Caledonia 47 253 103 1003 1,406 Chittenden 16 249 71 863 1,199 Essex 21 75 59 221 376 Franklin 25 297 108 1,091 1521 Grand Isle 31 4 195 230 Lamoille 32 162 77 608 879 Orange 62 187 129 1,445 1,823 Orleans 43 254 105 868 1,270 Rutland 60 291 147 1,167 1,665 Washington 58 244 165 1,288 1,755 Windham 57 332 177 1,715 2,281 Windsor 187 378 247 2,011 2,823 Grand Total 677 3,180 1,590 14,839 20,286
Source: https://vtrans.vermont.gov/planning/transportation-resilience/statewide; Analysis by VHB, 2020.
52 https://vtrans.vermont.gov/sites/aot/files/planning/documents/planning/2040_LRTP_%20Final.pdf 53 https://vtrans.vermont.gov/planning/transportation-resilience/statewide

Vermont Freight Plan Update
VERMONT FREIGHT PLAN (8/24/2021) 58
TABLE 4.3 VERMONT ROAD SEGMENT FLOOD VULNERABILITY BY COUNTY
County Road Segment Vulnerability Category (Road Miles) Grand Total High Low Moderate Not Vulnerable
Addison 28.4 102.8 22.5 35.0 188.7 Bennington 27.8 85.5 19.7 46.8 179.8 Caledonia 43.1 144.9 20.9 66.9 275.9 Chittenden 22.5 104.2 14.6 83.5 224.8 Essex 25.8 55.4 27.5 12.7 121.3 Franklin 31.6 124.4 30.6 54.9 241.4 Grand Isle 2.9 25.0 3.4 13.8 45.0 Lamoille 28.1 52.9 13.7 27.4 122.1 Orange 51.7 143.1 31.9 57.1 283.7 Orleans 42.1 132.8 24.8 54.4 254.2 Rutland 41.9 128.1 32.4 61.3 263.6 Washington 54.0 101.0 31.7 37.5 224.1 Windham 45.1 136.5 26.1 49.6 257.3 Windsor 120.2 201.0 54.8 75.3 451.3 Grand Total 565.1 1,537.6 354.5 676.2 3,133.3
Source: https://vtrans.vermont.gov/planning/transportation-resilience/statewide; Analysis by VHB, 2020.

Vermont Freight Plan Update
VERMONT FREIGHT PLAN (8/24/2021) 59
FIGURE 4.6 SCREEN CAPTURE – VERMONT STATEWIDE HIGHWAY FLOOD VULNERABILITY AND RISK MAP
Source: https://vtrans.maps.arcgis.com/apps/MapSeries/index.html?appid=f8a6527cf53e45a8896b494848b21e4f
The TRPT does not currently provide resiliency data for the rail network. Expanding the TRPT to explore rail resiliency issues using a similar methodology within five years is a next step in the Rail Plan.
In the meantime, Figure 4.8 provides a high-level analysis of where rail lines are within flood risk areas based on three data sources. These include:
• A river corridors layer, developed by the Vermont Agency of Natural Resources, which shows where rivers are likely to shift or meander over time;
• High risk dam inundation areas which show areas likely to flood if these at risk dams as identified by Vermont Emergency Management should fail; and

Vermont Freight Plan Update
VERMONT FREIGHT PLAN (8/24/2021) 60
• Flood hazard areas from the Federal Emergency Management Agency (FEMA) which identifies areas at risk of flooding.54
Of the State’s 578 miles of track, approximately 109 miles of state owned line and 71 miles of privately owned rail lines (180 miles total) are at risk of inundation, including much of the NECR, the VTR south of Middlebury, and sections of the GMRC. NECR is working to improve conditions on three culverts through a Consolidated Rail Infrastructure and Safety Improvements (CRISI) grant this year to help alleviate known issues, but the length of track in risk areas complicates any systemic efforts.55 Interviews with rail stakeholders indicated that bridge abutments are a critical area of concern and that having an overflow in place to help alleviate damage from high water is a potential mitigation approach. As of 2021, VRS is examining this issue at two bridges, one in East Dorset and one in Brandon.56
VTrans should continue to work with ANR, railroads, emergency personnel, and other relevant stakeholders to identify threats to critical freight infrastructure, and to ensure adequate preparedness and response capabilities. The Federal Emergency Management Agency (FEMA) has prepared frameworks57 for states, communities, and private sector to work together to implement in order to prevent, protect, mitigate, respond, and recover from disasters—natural or man-made. Figure 4.7 illustrates the functions and assets contained in each framework. In addition, VTrans and Vermont Agency of Natural Resources can work together and with railroads to ensure that future initiatives preserve and protect the state’s fragile flood plains and water courses.
54 River Corridors from VT Open Data: https://anrmaps.vermont.gov/arcgis/rest/services/Open_Data/OPENDATA_ANR_WATER_SP_NOCACHE_v2/MapServer;
High Risk Dam Inundation Areas from VCGI Open Data: https://maps.vcgi.vermont.gov/arcgis/rest/services/EGC_services/OPENDATA_VCGI_EMERGENCY_SP_NOCACHE_v1/MapServer;
Flood Hazard Areas from FEMA (note, statewide coverage not available): https://anrmaps.vermont.gov/arcgis/rest/services/Open_Data/OPENDATA_ANR_EMERGENCY_SP_NOCACHE_v2/MapServer
55 Interview with Genesee and Wyoming, July 7, 2020. 56 Interview with VRS, July 27, 2020. 57 https://www.fema.gov/emergency-managers/national-preparedness/frameworks

Vermont Freight Plan Update
VERMONT FREIGHT PLAN (8/24/2021) 61
FIGURE 4.7 NATIONAL PREPAREDNESS PLANNING FRAMEWORKS
Source: FEMA.

Vermont Freight Plan Update
VERMONT FREIGHT PLAN (8/24/2021) 62
FIGURE 4.8 RAIL FLOOD RISK VULNERABILITY
Sources: https://anrmaps.vermont.gov/arcgis/rest/services/Open_Data/OPENDATA_ANR_WATER_SP_NOCACHE_v2/MapServer; https://maps.vcgi.vermont.gov/arcgis/rest/services/EGC_services/OPENDATA_VCGI_EMERGENCY_SP_NOCACHE_v1/MapServer; https://anrmaps.vermont.gov/arcgis/rest/services/Open_Data/OPENDATA_ANR_EMERGENCY_SP_NOCACHE_v2/MapServer

Vermont Freight Plan Update
VERMONT FREIGHT PLAN (8/24/2021) 63
In addition, the U.S. Department of Homeland Securiy maintains datbases of transportation assets and other infrastructure critical to the nation’s defense in the Homeland Infrastructure Foundaion-Level Data (HIFLD) datbase. According to DHS:
“The HIFLD Subcommittee attracts a voluntary coalition of Federal, State, and Local government organizations and supporting private industry partners who are involved with geospatial issues related to Homeland Defense, Homeland Security, Emergency Preparedness and Response, or Civil Support. HIFLD members and non-federal contributors are involved in a wide range of different functions including Critical Infrastructure Protection, Crisis and Consequence Management, Intelligence and Threat Analysis, Antiterrorism/Force Protection, Defense Support to Civil Authorities, Man-Made and Natural Hazard Modeling, and Government Facilities Management.”
While much of the data in the HIFLD contains some open (public) information, many of the data layers are accessible to Federal, State, and/or local governments only.58 Rail layers include railroads, rail bridges, and railroad crossings. Figure 4.9 is an example of the railroad bridge data available in HIFLD.
FIGURE 4.9 BRIDGE INFORMATION AVAILABLE ON HOMELAND INFRASTRUCTURE FOUNDATION-LEVEL DATA (HIFLD)
Source: U.S. Department of Homeland Security, https://hifld-geoplatform.opendata.arcgis.com/datasets.
58 https://gii.dhs.gov/hifld/

Vermont Freight Plan Update
VERMONT FREIGHT PLAN (8/24/2021) 64
4.8 Freight as a “Good Neighbor”
Moving freight, by all modes, is critical to supporting the State’s economy. However, freight movement often raises concerns in communities, including safety and security, noise and air pollution, and potential land use compatability issues. With regard to moving freight by rail, working with stakeholders representing the freight modes to ensure that they act as “good neighbors” can help alleviate some of these concerns and reduce tensions while respecting rail exemptions from some local control.59
Nationally, such efforts have been grouped into an approach of “freight as a good neighbor.”60 Outreach efforts for this Plan identified three particular areas where a “good neighbor” approach could help improve the acceptance of rail freight.
Truck Routes and Community Impacts
State highways and other routes used by trucks pass through many of Vermont’s town centers, urban areas, and other communities. Residents in some of these communities have expressed concern about noise, pollutants, road safety, and other issues, often with truck movements cited as a cause for these concerns. Because trucks are performing an important duty to support the state’s economy and the quality of life of Vermonters, eliminating trucks from most areas is not a feasible solution. However, there are potential strategies for addressing the impacts of their movement in sensitive communities. Such strategies include implementing safety improvements to protect pedestrians, cyclists, and other road users; developing by-pass roadways to re-direct trucks passing through; governing the hours of operation in specific areas; prohibiting compression release engine braking (also known as “Jake braking”) in residential areas; and/or implementation of other traffic control devices to calm traffic flows and limit the externalities of truck (and other) traffic.
Quiet Zones
Quiet zones are designated stretches of track where routine sounding of train horns while approaching public crossings is not required. This greatly reduces the impact of both freight and passenger rail activities on nearby residents, especially on active rail lines or lines that see substantial use during the night when noise can be particularly disruptive. Minimum warning device requirements for public crossings designated as Quiet Zones include flashing light signals with gates, constant warning time train detection circuitry and power-off indicators visible to the train crew. In addition, crossings in Quiet Zones typically require additional safety improvements such as gates with channelization or medians, four-quadrant gates, one-way streets, and crossing closures.61
59https://vtrans.vermont.gov/sites/aot/files/planning/documents/Tech%20Memo%20%231_DataCollection%26ExistingConditions_10282020_Finalclean.pdf
60 http://www.trb.org/Main/Blurbs/175482.aspx; https://ops.fhwa.dot.gov/publications/fhwahop12006/index.htm. 61 https://oli.org/safety-near-trains/track-safety-basics/quiet-zones

Vermont Freight Plan Update
VERMONT FREIGHT PLAN (8/24/2021) 65
Quiet zones can only be established by public agencies, but railroads can provide valuable input, including where certain improvements may or may not be feasible.62
Construction Activities
Staging and temporary storage of railcars containing construction material to support ongoing maintenance and construction projects is also a concern in some Vermont communities, due to real or perceived risks to health and safety. Some of the concerns could be addressed through open communication and education about the materials being stored, safety protocols and procedures. Railroads or rail customers, in some instances, and where feasible, may consider alternative storage or staging plans in order to alleviate community concerns, and to act as “good neighbors” in the communities where they do business even though this is not a requirement.
4.9 VTrans Asset Management
An asset management approach helps VTrans maintain its roads, bridges, sidewalks, bikepaths, and other transportation facilities in a cost-effective way by:
• Ensuring VTrans is making the right level of investment in the right asset at the right time;
• Making preventive maintenance a priority;
• Integrating efforts throughout VTrans, including communication, business practices, and projects; and
• Investing strategically toward an efficient, cost-effective, sustainable transportation system. 63
Asset Management is a highly information-intensive process, and VTrans is continuing to collect information on State assets. A component of asset management practices includes working with stakeholders to determine customer service levels. In the context of state-owned bridges and upgrades to state-owned trackage, this would include meetings with the railroads to determine their required levels of service. A key aspect is to focus on a life cycle cost management for maintaining, rehabilitating, and replacing assets to provide the highest levels of service over time for the least cost. In the case of state-owned rail bridges, this would entail determining appropriate scopes of work to maintain, repair, replace, and upgrade bridges over time while ensuring the efficient uses of public funds. Another key component of the VTrans commitment to Asset Management is transparency, so that railroads, tax payers, and others can understand the nature, cost, and decision-making regarding State assets.
Vermont is continuing to improve its approach to managing data by implementing the Vermont Asset Management Information System (VAMIS) that will help store, analyze, and use data across highway, rail, aviation, transit modes. This solution will help use deterioration modeling and analysis to inform decision-making
62 https://railroads.dot.gov/elibrary/how-create-quiet-zone
63 https://vtrans.vermont.gov/sites/aot/files/planning/documents/2018%20Final%20VTrans%20TAMP.pdf

Vermont Freight Plan Update
VERMONT FREIGHT PLAN (8/24/2021) 66
and help VTrans monitor lifecycles and perform budgeting programming tasks that ensure the right treatment on the right asset at the right time.64
FIGURE 4.10 ASSET MANAGEMENT LIFE-CYCLE CONCEPT
Source: https://vtrans.vermont.gov/sites/aot/files/planning/documents/2018%20Final%20VTrans%20TAMP.pdf.
4.10 Broadband Internet Access
One potential key to Vermont’s success in a competitive economic environment during and after the COVID-19 pandemic recovery is the ability for people and businesses to have access to fast, reliable internet service. From 2010 to 2020, Americans with access to broadband internet (defined as speeds of at least 25 Mbps download, 3 Mbps upload) increased from an estimated 74.5% to 93.5%. During this same period, access to broadband in Vermont has grown tremendously, from 17% in 2010 to 89% in 2020. This 412% increase in broadband access represented the second-highest percentage growth in the past decade, after Montana. However, Vermont
64 https://vtrans.vermont.gov/sites/aot/files/2020%20VAMIS%20FACT%20SHEET%20Final.pdf

Vermont Freight Plan Update
VERMONT FREIGHT PLAN (8/24/2021) 67
currently ranks 36th out of all states and the District of Columbia in terms of percent of households with broadband access.65
More background information about broadband internet access and development is provided in Tech Memo 2.
Expanding the reach of broadband internet can support economic opportunity for Vermont residents, entrepreneurs starting their own businesses, and for larger-scale economic development. In 2019, passed Act 79, which calls for the rollout of broadband internet access, with a minimum threshold of 25mbps download and 3mbps upload speeds, statewide. The act created a new position, a Rural Broadband Technical Assistance Specialist, to help with coordination among stakeholder groups and various other technical assistance duties that support expanding broadband access.66 Over time, the minimum thresholds specified in Act 79 will become obsolete, and additional investments and/or legislation may become necessary to ensure Vermonters have the tools to compete in an increasingly online economy.
Many Vermont towns have joined Communications Union Districts (CUDs), which consist of two or more towns bonding together as a municipal entity for the purpose of building communications infrastructure together.67 Participating in CUDs allows some towns to benefit from economies of scale, more efficient use of funds, shared and mitigated risks, among other incentives. CUDs, independent municipalites, CUDs or independent municipalities can pursue a variety of grant and loan opportunities available from state, federal, and private entities that can help Vermont towns expand broadband access.68
65 All data from https://broadbandnow.com/research/broadband-2020 66 https://legislature.vermont.gov/Documents/2020/Docs/ACTS/ACT079/ACT079%20As%20Enacted.pdf. 67 Vermont Communications Union Districts | Department of Public Service 68 Broadband Funding | Department of Public Service (vermont.gov)

Vermont Freight Plan Update
VERMONT FREIGHT PLAN (8/24/2021) 68
5.0 POTENTIAL INITIATIVES Based on the needs and issues discussed above, a set of potential initiatives was developed to advance multimodal freight system vision and goals.
As shown in Figure 5.1, in addition to the analysis of needs and issues, potential initiatives were also drawn from outstanding recommendations from the 2017 update of the Vermont Freight Plan, 2021 Vermont Rail Plan, Vermont Airport System Plan, and relevant projects listed in the FY 2022 Vermont Transportation Program. Potential initiatives were also developed from or inspired by input from stakeholders gathered from the Freight Plan Advisory Committee, stakeholder interviews, Vermont Freight Forums, and a web map tool that allowed users to input comments on existing conditions or provide information on proposed initiatives.
FIGURE 5.1 SOURCES FOR FREIGHT PLAN INITIATIVES
Potential initiatives are the range of actions that would support and enhance multimodal freight transportation in Vermont. These initiatives could be advanced by a number of agencies or stakeholders in addition to VTrans.
Table 5.1, attached as an Excel worksheet, lists and categorizes the potential initiatives based upon the state and national goal areas addressed.
Long List of Potential Initiatives
Data Analysis
2017 Freight
Plan
Stake-holder Input

Vermont Freight Plan Update
VERMONT FREIGHT PLAN (8/24/2021) 69
TABLE 5.1 POTENTIAL FREIGHT INITIATIVES
See attached Excel Worksheet.
i The previous freight plan was initially released in 2011, and substantially revised in 2012 to meet MAP-21 requirements. Subsequent revisions in 2015 and 2017 incorporated current project lists, but no other changes were made. Thus, the previous freight plan is referred to as the 2012 Freight Plan.