(vermejo river ocate creek and mora river 2002 · water quality survey summary for the canadian...
TRANSCRIPT

WATER QUALITY SURVEY SUMMARY FOR THE
CANADIAN RIVER TRIBUTARIES (VERMEJO RIVER, OCATE CREEK, AND MORA RIVER)
2002
Prepared by
Surface Water Quality Bureau New Mexico Environment Department
May 2008

This page left intentionally blank.

PRINCIPLE INVESTIGATORS Survey Leads Contact information Water Chemistry: Seva Joseph [email protected] Watershed Protection: Chris Cudia [email protected] TMDL writer: Shelly Drinkard [email protected] GIS/Mapping Bill Skinner [email protected] Surface Water Quality Bureau Office: (505) 827-0187
Water quality surveys and assessments conducted by the New Mexico Environment Department Surface Water Quality Bureau are completed to fulfill Section 106 of the Clean Water Act [33 USC 1251 et seq.], Work Program for Water Quality Management. This project was funded by a grant
from the U.S. Environmental Protection Agency.

This page left intentionally blank.

Canadian River Tributaries April-October 2002
TABLE OF CONTENTS
TABLE OF CONTENTS
LIST OF TABLES
LIST OF FIGURES
LIST OF ACRONYMS
EXECUTIVE SUMMARY
1.0 INTRODUCTION
2.0 NM WATER QUALITY STANDARDS
3.0 METHODS
4.0 SAMPLING SUMMARY
5.0 WATER QUALITY ASSESSMENT
5.1 WATER QUALITY STANDARDS EXCEEDENCES
5.1.1 PHYSICOCHEMICAL DATA
5.1.2 DATA FROM THERMOGRAPHS
6.0 CONCLUSIONS
7.0 REFERENCES
LIST OF TABLES Table 1. Summary of Assessment Units and Associated Sampling Stations Table 2. SWQB Canadian River Tributaries Sampling Summary Table 3. SWQB Vermejo River and Ocate Creek Sampling Summary Table 4. Physicochemical Water Quality Standards Exceedences Table 5. Summary of Thermograph Data
LIST OF FIGURES
Figure 1. Canadian River Tributaries Study Area and Sampling Stations
Canadian River Tributaries April-October 2002
LIST OF ACRONYMS
ALU Aquatic Life Use AU Assessment Unit ADB Assessment Database C Celsius CWA Clean Water Act DO Dissolved Oxygen GIS Geographic Information Systems MAS Monitoring and Assessment Section NMAC New Mexico Administrative Code NMED New Mexico Environment Department QAPP Quality Assurance Project Plan STORET Storage and Retrieval System SWQB Surface Water Quality Bureau TMDL Total Maximum Daily Load USC United States Code EPA United States Environmental Protection Agency

Canadian River Tributaries April-October 2002
EXECUTIVE SUMMARY
The Monitoring and Assessment Section of the Surface Water Quality Bureau (SWQB) conducted a water quality survey of select tributaries of the Canadian River between April 1, 2002 and October 17, 2002. This survey focused on three tributaries, the Vermejo River, Ocate Creek, and Mora River and included 42 sampling stations (Figure 1 and Table 1). The primary purpose of this survey was to collect chemical, physical, and biological data to identify water quality problems within the watershed. The results of this study are summarized in the Integrated List portion of the biennial State of New Mexico Integrated Clean Water Act §303(d)/305(b) Report. Any assessment conclusions presented in this report are based on water quality standards and assessment protocols that existed at the time the report was developed. It is important to note that both the assessment protocols and water quality standards are revised periodically to incorporate new information and refinements. The U.S. Environmental Protection Agency (USEPA) uses the most recent state-developed assessment protocols and the most recent USEPA-approved water quality standards when deciding whether or not to approve impairment determinations on the biennial New Mexico Integrated List of Impaired Waters. Therefore, the impairment conclusions in the Integrated List supersede assessment conclusions in this survey report if they should differ. Water chemistry sampling at survey stations included total nutrients, total and dissolved metals, major anions and cations, radionuclides, and microbiological collections as indicated by proximity to potential sources and/or previous survey findings. Data loggers were deployed at select stations to collect temperature, pH, dissolved oxygen (DO), conductivity, and turbidity data for an extended period of time to monitor trends. Biological surveys were conducted at select stations, which included the collection of macroinvertebrates and physical habitat characteristics. Water quality in the Canadian River tributaries was found to be generally good. Other than a few exceedences for total recoverable selenium and dissolved aluminum, there were no other metals (total or dissolved), cyanide, or radionuclide samples that were found to be in exceedence of their respective water quality standards. Furthermore, no organic compounds (volatile or semi-volatile) were found above detection limits. Fecal coliform criteria were exceeded on the Mora and Sapello Rivers and a number of the field parameters such at conductivity, temperature, pH and DO criteria were exceeded occasionally throughout the study area. Some of the exceedences are likely due to the drought conditions in 2002 and resulting low flows. Assessment of data from thermographs showed exceedence for the temperature criteria in the lower Coyote Creek.

Canadian River Tributaries April-October 2002
1.0 INTRODUCTION
The Canadian River watershed (US Geological Survey [USGS] Hydrologic Unit Codes [HUCs] 11080001, 11080002, 11080003, 11080004, 11080005, 11080006, 11080007, 11080008, and 11090101) is part of the vast drainage system of the Arkansas River that covers approximately 47,700 square miles in three states. The Canadian Watershed encompasses about one-sixth the land area of New Mexico or about 1720 square miles, or 1.1 million acres. Historic and current land uses in the watershed include farming, ranching, recreation, and municipal related activities. Much of the land ownership adjacent to the river is private, but the Bureau of Land Management and the State of New Mexico also own and manage tracts of public lands in the eastern portions of the watershed. The Canadian River watershed is located in Omernick Level III Ecoregion 21 (Southern Rockies) in the headwaters and Level III Ecoregion 26 (Southwestern Tablelands) in the lowlands. The elevation range for the various sampling sites in the survey was 5771 feet (ft.) to 8826 ft. above sea level. Annual precipitation ranges from 30 inches in the mixed conifer forests at higher elevations to 15 inches in the semi-arid grasslands at lower elevations (NRCS 2007). This survey focused on three tributaries to the Canadian River: the Vermejo River, Ocate Creek, and the Mora River. From its headwaters in Colorado, the Vermejo River flows southeast to join the Canadian River near Maxwell, NM, draining approximately 650 square miles. Much of the land ownership adjacent to the river is private with the exceptions of Maxwell National Wildlife Refuge and a small portion of the Valle Vidal Unit of the Carson National Forest in the headwaters of Leandro Creek. Historic and current land uses in the watershed include agriculture, recreation, and mining. Coal has been mined in the area since the 1870s providing coal for railroads and copper and steel smelters in the Southwest. Areas throughout the Raton Coal Field, including the Vermejo River watershed, are currently being developed for coalbed methane with over 300 wells drilled since 2000 (Hoffman 2004). The Mora River and its tributaries originate in the southern Sangre de Cristo Mountains. Luna and Lujan Creeks form the headwaters of the Mora River. After their confluence just north of Chacón, the Mora River flows southeast through the villages of Holman, Cleveland, Mora, Buena Vista, and Watrous. The river turns east near Watrous and begins to entrench into the plains as it travels towards the Canadian River. Tributaries to the Mora River include: La Jara Creek, Coyote Creek, Little Coyote Creek, Rio la Casa, Santiago Creek, Rito Morphy, Rito Cebolla, Rito de Gascon, Rito San Jose, Manuelitas Creek, Sapello River, and Wolf Creek. All of the perennial streams in Mora County are diverted for irrigation. The Mora River watershed drains approximately 1104 square miles with elevations ranging from 13,102 ft. at South Truchas Peak to 6145 ft. at the USGS Gage 07221000 near Shoemaker. Much of the land ownership adjacent to the river is private with the exceptions of Fort Union National Monument on Wolf Creek, Coyote Creek State Park, and U.S. Forest Service land in the headwaters. There are three main land uses in the Mora River watershed: forest (spruce-fir-pine-aspen in higher elevations and piñon-juniper in lower elevations) in the western mountainous region, rangeland characterized by gramma grass in association with other species in the eastern plains, and agriculture, which is located primarily along narrow, alluvial valleys and river corridors. Both the geologic and the bedrock hydrologic system are complex.

Canadian River Tributaries April-October 2002
The Ocate Creek Watershed is bounded to the west by the Sangre de Cristo Mountains, to the east by the Canadian River, to the north by the Cimarron Range, and to the south by the Mora River. The creek flows approximately 50 miles from its headwaters to its confluence with the Canadian River and has seasonally interrupted flow below the village of Ocate. This slope consists of sandstone, siltstone and shale of the Sandia Formation, Madera Group and Sangre de Cristo Formation. In many areas these sedimentary rocks are covered by basalt flows from the Ocate Volcanic field. The volcanic rock in the area range from alkali olivine basalt to dacite, with the predominant rock type being basaltic lavas erupted from shield volcanoes, composite cones, fissures, and cinder cones (McLemore 1999). Much of the land ownership adjacent to the creek is private. Historic and current land uses in the watershed include agriculture, rangeland, and recreation. The Monitoring and Assessment Section (MAS) of the Surface Water Quality Bureau (SWQB) conducted a water quality survey of the Canadian River Tributaries between April and October, 2002. This water quality survey included 42 sampling sites (Figure 1 and Table 1). Most sites were sampled 8-10 times, while some secondary sites were sampled only one to three times. Monitoring these sites enabled an assessment of the cumulative influence of the physical habitat, water sources, and land management activities upstream from the sites. Table 1 lists the location of sampling stations in each assessment unit (AU), station numbers, STORET identification codes, the current listings on the Integrated Clean Water Act (CWA) §303(d)/§305(b) Report, and the associated water quality segment number. Water samples were analyzed for plant nutrients, ions, total and dissolved metals, fecal coliform bacteria, radionuclides, and anthropogenic organic compounds. Variables such as dissolved oxygen (DO), pH, turbidity, and specific conductance were measured in the field. Physical habitat and benthic macroinvertebrate communities were surveyed to determine the impacts of excessive nutrients and settled sediment on aquatic life within a stream. The type of monitoring done at each site is summarized in Tables 2 and 3.

Canadian River Tributaries April-October 2002
Figure 1. Canadian River Tributaries Study Area and Sampling Stations

Canadian River Tributaries April-October 2002
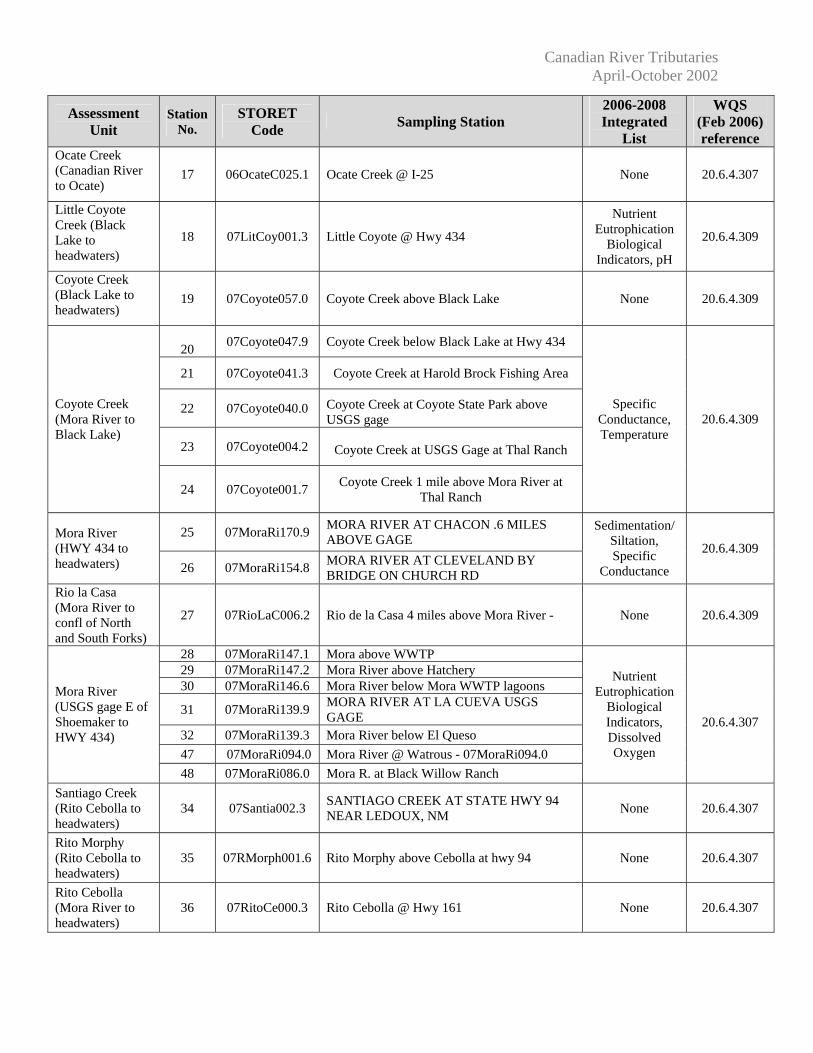
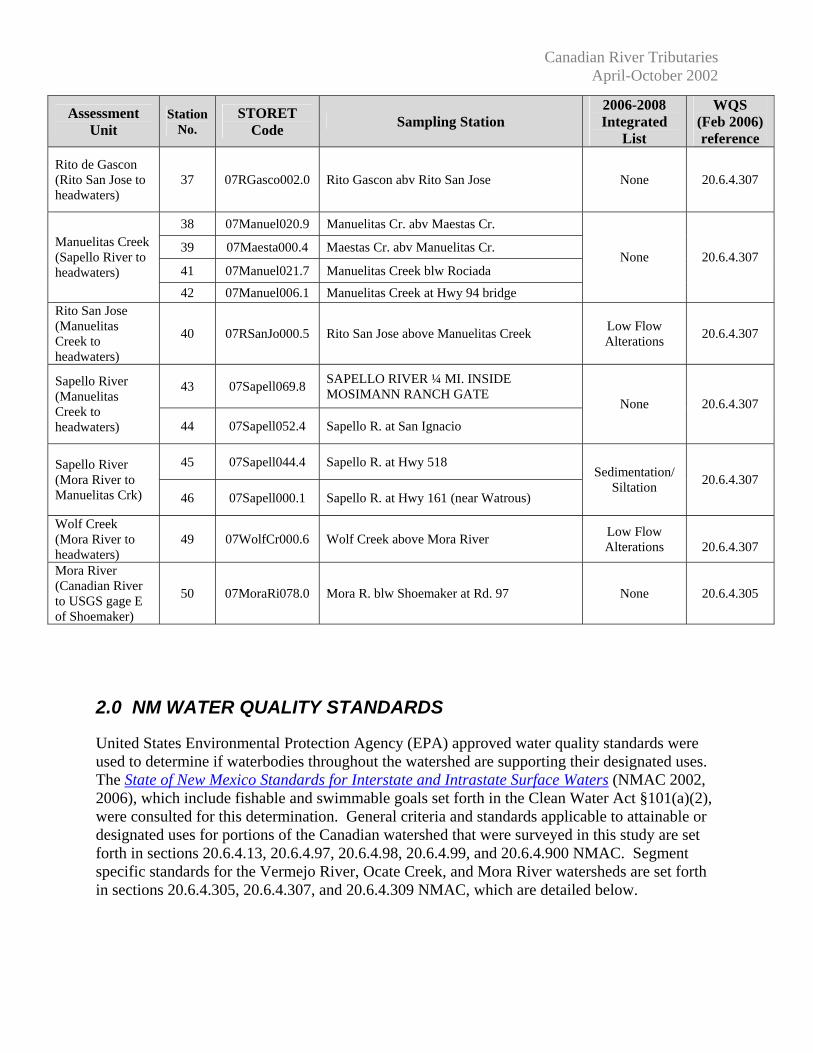
Table 1. Summary of Assessment Units and Associated Sampling Stations
Assessment Unit
Station No.
STORET Code Sampling Station
2006-2008 Integrated
List
WQS (Feb 2006) reference
1 04Vermej094.1 Vermejo River below Leandro Creek
2 04Vermej080.2 Vermejo River at Juan Baca Canyon Vermejo River (York Canyon to headwaters)
3 04Vermej076.0 Vermejo River above York Canyon Creek
Benthic Bioassessment,
Temperature 20.6.4.305
York Canyon (Vermejo River to headwaters)
4 04YorkCa000.1 York Canyon Creek above Vermejo River Specific
Conductance, Turbidity
20.6.4.305
5 04Vermej073.7 Vermejo River below York Canyon Creek Vermejo River (Rail Canyon to York Canyon) 6 04Vermej060.8 Vermejo River above Caliente Canyon
Specific Conductance, Temperature
20.6.4.305
Caliente Canyon (Vermejo River to headwaters)
7 04Calien000.1 Caliente Canyon above Vermejo River Specific Conductance 20.6.4.305
Blosser Arroyo 8 04BlossA013.3 Blosser Arroyo at Blosser Gap unknown 20.6.4.97
9 04Vermej038.8 Vermejo River (downstream of) Dawson (below conf with Rail) Vermejo River
(Canadian River to Rail Canyon) 11 04Vermej002.9 Vermejo River at I-25
Low Flow Alterations 20.6.4.305
VanBremmer Creek (HWY 64 to headwaters) 10 04VanBre009.4 VanBremmer Creek @ Hwy 64
Specific Conductance, Temperature,
Turbidity
20.6.4.305
12 05CIMARR011.8
Cimarron River above Springer WWTP Cimarron River (Canadian River to Cimarron)
13 05Cimarr010.4 Cimarron River below Springer WWTP
None 20.6.4.306
Wheaton Creek (Manuelas Creek to headwaters)
14 06Wheato000.8 Wheaton Creek ~ 0.5 mi above confluence with Ocate Creek None 20.6.4.309
Manuelas Creek (Ocate Creek to headwaters)
15 06Manuel008.7 Manuelas Creek above Ocate Creek - None 20.6.4.309
Ocate Creek (Ocate to Wheaton Creek)
16 06OcateC063.0 Ocate Creek above village of Ocate
Low Flow Alterations 20.6.4.309
Canadian River Tributaries April-October 2002
Assessment Unit
Station No.
STORET Code Sampling Station
2006-2008 Integrated
List
WQS (Feb 2006) reference
Ocate Creek (Canadian River to Ocate)
17 06OcateC025.1 Ocate Creek @ I-25 None 20.6.4.307
Little Coyote Creek (Black Lake to headwaters)
18 07LitCoy001.3 Little Coyote @ Hwy 434
Nutrient Eutrophication
Biological Indicators, pH
20.6.4.309
Coyote Creek (Black Lake to headwaters)
19 07Coyote057.0 Coyote Creek above Black Lake None 20.6.4.309
20 07Coyote047.9 Coyote Creek below Black Lake at Hwy 434
21 07Coyote041.3 Coyote Creek at Harold Brock Fishing Area
22 07Coyote040.0 Coyote Creek at Coyote State Park above USGS gage
23 07Coyote004.2 Coyote Creek at USGS Gage at Thal Ranch
Coyote Creek (Mora River to Black Lake)
24 07Coyote001.7 Coyote Creek 1 mile above Mora River at Thal Ranch
Specific Conductance, Temperature
20.6.4.309
25 07MoraRi170.9 MORA RIVER AT CHACON .6 MILES ABOVE GAGE Mora River
(HWY 434 to headwaters) 26 07MoraRi154.8 MORA RIVER AT CLEVELAND BY
BRIDGE ON CHURCH RD
Sedimentation/ Siltation, Specific
Conductance
20.6.4.309
Rio la Casa (Mora River to confl of North and South Forks)
27 07RioLaC006.2 Rio de la Casa 4 miles above Mora River - None 20.6.4.309
28 07MoraRi147.1 Mora above WWTP 29 07MoraRi147.2 Mora River above Hatchery 30 07MoraRi146.6 Mora River below Mora WWTP lagoons
31 07MoraRi139.9 MORA RIVER AT LA CUEVA USGS GAGE
32 07MoraRi139.3 Mora River below El Queso 47 07MoraRi094.0 Mora River @ Watrous - 07MoraRi094.0
Mora River (USGS gage E of Shoemaker to HWY 434)
48 07MoraRi086.0 Mora R. at Black Willow Ranch
Nutrient Eutrophication
Biological Indicators, Dissolved Oxygen
20.6.4.307
Santiago Creek (Rito Cebolla to headwaters)
34 07Santia002.3 SANTIAGO CREEK AT STATE HWY 94 NEAR LEDOUX, NM None 20.6.4.307
Rito Morphy (Rito Cebolla to headwaters)
35 07RMorph001.6 Rito Morphy above Cebolla at hwy 94 None 20.6.4.307
Rito Cebolla (Mora River to headwaters)
36 07RitoCe000.3 Rito Cebolla @ Hwy 161 None 20.6.4.307
Canadian River Tributaries April-October 2002
Assessment Unit
Station No.
STORET Code Sampling Station
2006-2008 Integrated
List
WQS (Feb 2006) reference
Rito de Gascon (Rito San Jose to headwaters)
37 07RGasco002.0 Rito Gascon abv Rito San Jose None 20.6.4.307
38 07Manuel020.9 Manuelitas Cr. abv Maestas Cr.
39 07Maesta000.4 Maestas Cr. abv Manuelitas Cr.
41 07Manuel021.7 Manuelitas Creek blw Rociada
Manuelitas Creek (Sapello River to headwaters)
42 07Manuel006.1 Manuelitas Creek at Hwy 94 bridge
None 20.6.4.307
Rito San Jose (Manuelitas Creek to headwaters)
40 07RSanJo000.5 Rito San Jose above Manuelitas Creek Low Flow Alterations 20.6.4.307
43 07Sapell069.8 SAPELLO RIVER ¼ MI. INSIDE MOSIMANN RANCH GATE
Sapello River (Manuelitas Creek to headwaters) 44 07Sapell052.4 Sapello R. at San Ignacio
None 20.6.4.307
45 07Sapell044.4 Sapello R. at Hwy 518 Sapello River (Mora River to Manuelitas Crk) 46 07Sapell000.1 Sapello R. at Hwy 161 (near Watrous)
Sedimentation/ Siltation 20.6.4.307
Wolf Creek (Mora River to headwaters)
49 07WolfCr000.6 Wolf Creek above Mora River Low Flow Alterations
20.6.4.307
Mora River (Canadian River to USGS gage E of Shoemaker)
50 07MoraRi078.0 Mora R. blw Shoemaker at Rd. 97 None 20.6.4.305
2.0 NM WATER QUALITY STANDARDS
United States Environmental Protection Agency (EPA) approved water quality standards were used to determine if waterbodies throughout the watershed are supporting their designated uses. The State of New Mexico Standards for Interstate and Intrastate Surface Waters (NMAC 2002, 2006), which include fishable and swimmable goals set forth in the Clean Water Act §101(a)(2), were consulted for this determination. General criteria and standards applicable to attainable or designated uses for portions of the Canadian watershed that were surveyed in this study are set forth in sections 20.6.4.13, 20.6.4.97, 20.6.4.98, 20.6.4.99, and 20.6.4.900 NMAC. Segment specific standards for the Vermejo River, Ocate Creek, and Mora River watersheds are set forth in sections 20.6.4.305, 20.6.4.307, and 20.6.4.309 NMAC, which are detailed below.

Canadian River Tributaries April-October 2002
20.6.4.305 CANADIAN RIVER BASIN - The main stem of the Canadian river from the headwaters of Conchas reservoir upstream to the New Mexico-Colorado line, perennial reaches of the Conchas river, the Mora river downstream from the USGS gaging station near Shoemaker, the Vermejo river downstream from Rail canyon and perennial reaches of Raton, Chicorica and Uña de Gato creeks. A. Designated Uses: irrigation, marginal warmwater aquatic life, livestock watering, wildlife habitat and secondary contact. B. Criteria: (1) In any single sample: pH within the range of 6.6 to 9.0, temperature 32.2°C (90°F) or less and TDS 3,500 mg/L or less at flows above 10 cfs. The use-specific numeric criteria set forth in 20.6.4.900 NMAC are applicable to the designated uses listed above in Subsection A of this section. (2) The monthly geometric mean of E. coli bacteria 126 cfu/100 mL or less; single sample 410 cfu/100 mL or less (see Subsection B of 20.6.4.14 NMAC). [20.6.4.305 NMAC - Rp 20 NMAC 6.1.2305, 10-12-00; A, 05-23-05] 20.6.4.307 CANADIAN RIVER BASIN - Perennial reaches of the Mora river from the USGS gaging station near Shoemaker upstream to the state highway 434 bridge in Mora, all perennial reaches of tributaries to the Mora river downstream from the USGS gaging station at La Cueva in San Miguel and Mora counties, perennial reaches of Ocate creek and its tributaries downstream of Ocate, and perennial reaches of Rayado creek downstream of Miami lake diversion in Colfax county. A. Designated Uses: marginal coldwater aquatic life, warmwater aquatic life, secondary contact, irrigation, livestock watering and wildlife habitat. B. Criteria: (1) In any single sample: temperature 25°C (77°F) or less and pH within the range of 6.6 to 9.0. The use-specific numeric criteria set forth in 20.6.4.900 NMAC are applicable to the designated uses listed above in Subsection A of this section. (2) The monthly geometric mean of E. coli bacteria 126 cfu/100 mL or less; single sample 410 cfu/100 mL or less (see Subsection B of 20.6.4.14 NMAC). [20.6.4.307 NMAC - Rp 20 NMAC 6.1.2305.3, 10-12-00; A, 05-23-05] 20.6.4.309 CANADIAN RIVER BASIN - The Mora river and perennial reaches of its tributaries upstream from the state highway 434 bridge in Mora, all perennial reaches of tributaries to the Mora river upstream from the USGS gaging station at La Cueva, perennial reaches of Coyote creek and its tributaries, the Cimarron river and its perennial tributaries above state highway 21 in Cimarron, all perennial reaches of tributaries to the Cimarron river north and northwest of highway 64, perennial reaches of Rayado creek and its tributaries above Miami lake diversion, Ocate creek and perennial reaches of its tributaries upstream of Ocate, perennial reaches of the Vermejo river upstream from Rail canyon and all other perennial reaches of tributaries to the Canadian river northwest and north of U.S. highway 64 in Colfax county unless included in other segments. A. Designated Uses: domestic water supply, irrigation, high quality coldwater aquatic life, livestock watering, wildlife habitat, municipal and industrial water supply and secondary contact. B. Criteria: (1) In any single sample: specific conductance 500 µmhos/cm or less, pH within the range of 6.6 to 8.8 and temperature 20°C (68°F) or less. The use-specific numeric criteria set forth in 20.6.4.900 NMAC are applicable to the designated uses listed above in Subsection A of this section. (2) The monthly geometric mean of E. coli bacteria 126 cfu/100 mL or less; single sample 235 cfu/100 mL or less (see Subsection B of 20.6.4.14 NMAC). [20.6.4.309 NMAC - Rp 20 NMAC 6.1.2306, 10-12-00; A, 7-19-01; A, 05-23-05]
Fecal coliform criteria were changed to E. coli criteria in 2005 at the recommendation of the USEPA. The obsolete fecal coliform criteria of the 2002 version of the WQS were:
For 20.6.4.305 and 20.6.4.307 NMAC: monthly geometric mean of fecal coliform bacteria shall not exceed 200/100 mL; no single sample shall exceed 400/100 mL, and For 20.6.4.309 NMAC: monthly geometric mean of fecal coliform bacteria shall not exceed 100/100 mL; no single sample shall exceed 200/100 mL.
Canadian River Tributaries April-October 2002
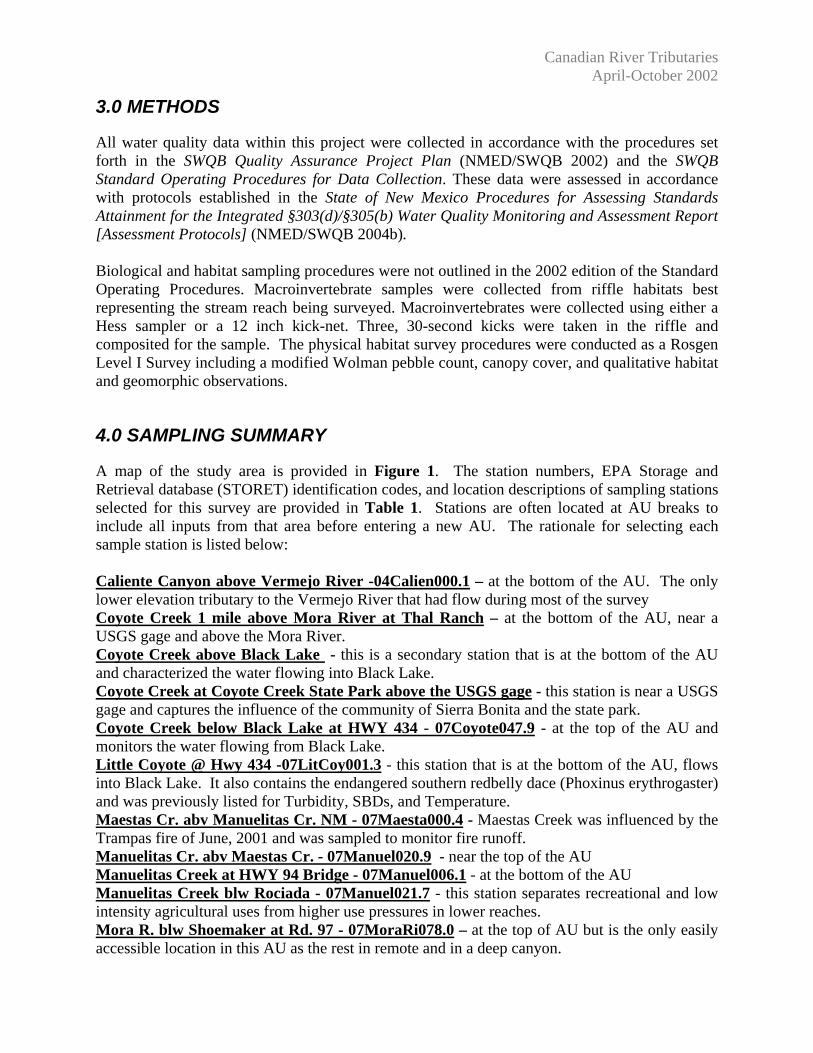
3.0 METHODS
All water quality data within this project were collected in accordance with the procedures set forth in the SWQB Quality Assurance Project Plan (NMED/SWQB 2002) and the SWQB Standard Operating Procedures for Data Collection. These data were assessed in accordance with protocols established in the State of New Mexico Procedures for Assessing Standards Attainment for the Integrated §303(d)/§305(b) Water Quality Monitoring and Assessment Report [Assessment Protocols] (NMED/SWQB 2004b). Biological and habitat sampling procedures were not outlined in the 2002 edition of the Standard Operating Procedures. Macroinvertebrate samples were collected from riffle habitats best representing the stream reach being surveyed. Macroinvertebrates were collected using either a Hess sampler or a 12 inch kick-net. Three, 30-second kicks were taken in the riffle and composited for the sample. The physical habitat survey procedures were conducted as a Rosgen Level I Survey including a modified Wolman pebble count, canopy cover, and qualitative habitat and geomorphic observations.
4.0 SAMPLING SUMMARY
A map of the study area is provided in Figure 1. The station numbers, EPA Storage and Retrieval database (STORET) identification codes, and location descriptions of sampling stations selected for this survey are provided in Table 1. Stations are often located at AU breaks to include all inputs from that area before entering a new AU. The rationale for selecting each sample station is listed below: Caliente Canyon above Vermejo River -04Calien000.1 – at the bottom of the AU. The only lower elevation tributary to the Vermejo River that had flow during most of the survey Coyote Creek 1 mile above Mora River at Thal Ranch – at the bottom of the AU, near a USGS gage and above the Mora River. Coyote Creek above Black Lake - this is a secondary station that is at the bottom of the AU and characterized the water flowing into Black Lake. Coyote Creek at Coyote Creek State Park above the USGS gage - this station is near a USGS gage and captures the influence of the community of Sierra Bonita and the state park. Coyote Creek below Black Lake at HWY 434 - 07Coyote047.9 - at the top of the AU and monitors the water flowing from Black Lake. Little Coyote @ Hwy 434 -07LitCoy001.3 - this station that is at the bottom of the AU, flows into Black Lake. It also contains the endangered southern redbelly dace (Phoxinus erythrogaster) and was previously listed for Turbidity, SBDs, and Temperature. Maestas Cr. abv Manuelitas Cr. NM - 07Maesta000.4 - Maestas Creek was influenced by the Trampas fire of June, 2001 and was sampled to monitor fire runoff. Manuelitas Cr. abv Maestas Cr. - 07Manuel020.9 - near the top of the AU Manuelitas Creek at HWY 94 Bridge - 07Manuel006.1 - at the bottom of the AU Manuelitas Creek blw Rociada - 07Manuel021.7 - this station separates recreational and low intensity agricultural uses from higher use pressures in lower reaches. Mora R. blw Shoemaker at Rd. 97 - 07MoraRi078.0 – at the top of AU but is the only easily accessible location in this AU as the rest in remote and in a deep canyon.
Canadian River Tributaries April-October 2002
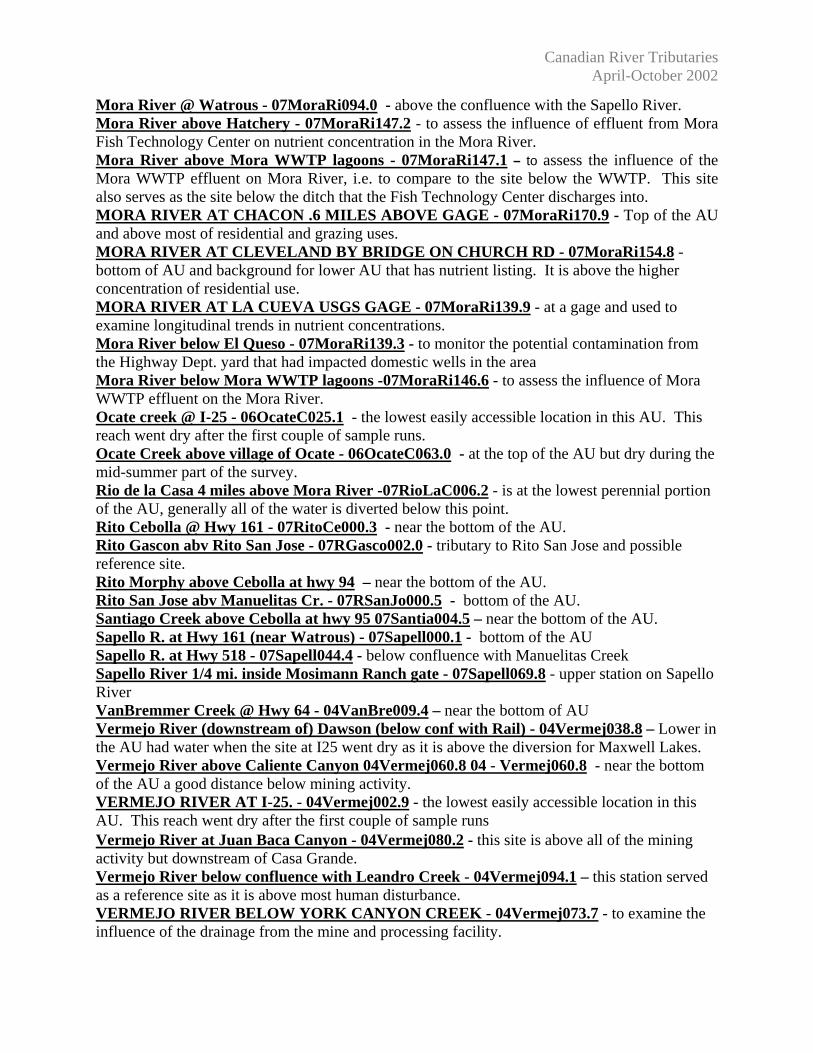
Mora River @ Watrous - 07MoraRi094.0 - above the confluence with the Sapello River. Mora River above Hatchery - 07MoraRi147.2 - to assess the influence of effluent from Mora Fish Technology Center on nutrient concentration in the Mora River. Mora River above Mora WWTP lagoons - 07MoraRi147.1 – to assess the influence of the Mora WWTP effluent on Mora River, i.e. to compare to the site below the WWTP. This site also serves as the site below the ditch that the Fish Technology Center discharges into. MORA RIVER AT CHACON .6 MILES ABOVE GAGE - 07MoraRi170.9 - Top of the AU and above most of residential and grazing uses. MORA RIVER AT CLEVELAND BY BRIDGE ON CHURCH RD - 07MoraRi154.8 - bottom of AU and background for lower AU that has nutrient listing. It is above the higher concentration of residential use. MORA RIVER AT LA CUEVA USGS GAGE - 07MoraRi139.9 - at a gage and used to examine longitudinal trends in nutrient concentrations. Mora River below El Queso - 07MoraRi139.3 - to monitor the potential contamination from the Highway Dept. yard that had impacted domestic wells in the area Mora River below Mora WWTP lagoons -07MoraRi146.6 - to assess the influence of Mora WWTP effluent on the Mora River. Ocate creek @ I-25 - 06OcateC025.1 - the lowest easily accessible location in this AU. This reach went dry after the first couple of sample runs. Ocate Creek above village of Ocate - 06OcateC063.0 - at the top of the AU but dry during the mid-summer part of the survey. Rio de la Casa 4 miles above Mora River -07RioLaC006.2 - is at the lowest perennial portion of the AU, generally all of the water is diverted below this point. Rito Cebolla @ Hwy 161 - 07RitoCe000.3 - near the bottom of the AU. Rito Gascon abv Rito San Jose - 07RGasco002.0 - tributary to Rito San Jose and possible reference site. Rito Morphy above Cebolla at hwy 94 – near the bottom of the AU. Rito San Jose abv Manuelitas Cr. - 07RSanJo000.5 - bottom of the AU. Santiago Creek above Cebolla at hwy 95 07Santia004.5 – near the bottom of the AU. Sapello R. at Hwy 161 (near Watrous) - 07Sapell000.1 - bottom of the AU Sapello R. at Hwy 518 - 07Sapell044.4 - below confluence with Manuelitas Creek Sapello River 1/4 mi. inside Mosimann Ranch gate - 07Sapell069.8 - upper station on Sapello River VanBremmer Creek @ Hwy 64 - 04VanBre009.4 – near the bottom of AU Vermejo River (downstream of) Dawson (below conf with Rail) - 04Vermej038.8 – Lower in the AU had water when the site at I25 went dry as it is above the diversion for Maxwell Lakes. Vermejo River above Caliente Canyon 04Vermej060.8 04 - Vermej060.8 - near the bottom of the AU a good distance below mining activity. VERMEJO RIVER AT I-25. - 04Vermej002.9 - the lowest easily accessible location in this AU. This reach went dry after the first couple of sample runs Vermejo River at Juan Baca Canyon - 04Vermej080.2 - this site is above all of the mining activity but downstream of Casa Grande. Vermejo River below confluence with Leandro Creek - 04Vermej094.1 – this station served as a reference site as it is above most human disturbance. VERMEJO RIVER BELOW YORK CANYON CREEK - 04Vermej073.7 - to examine the influence of the drainage from the mine and processing facility.
Canadian River Tributaries April-October 2002
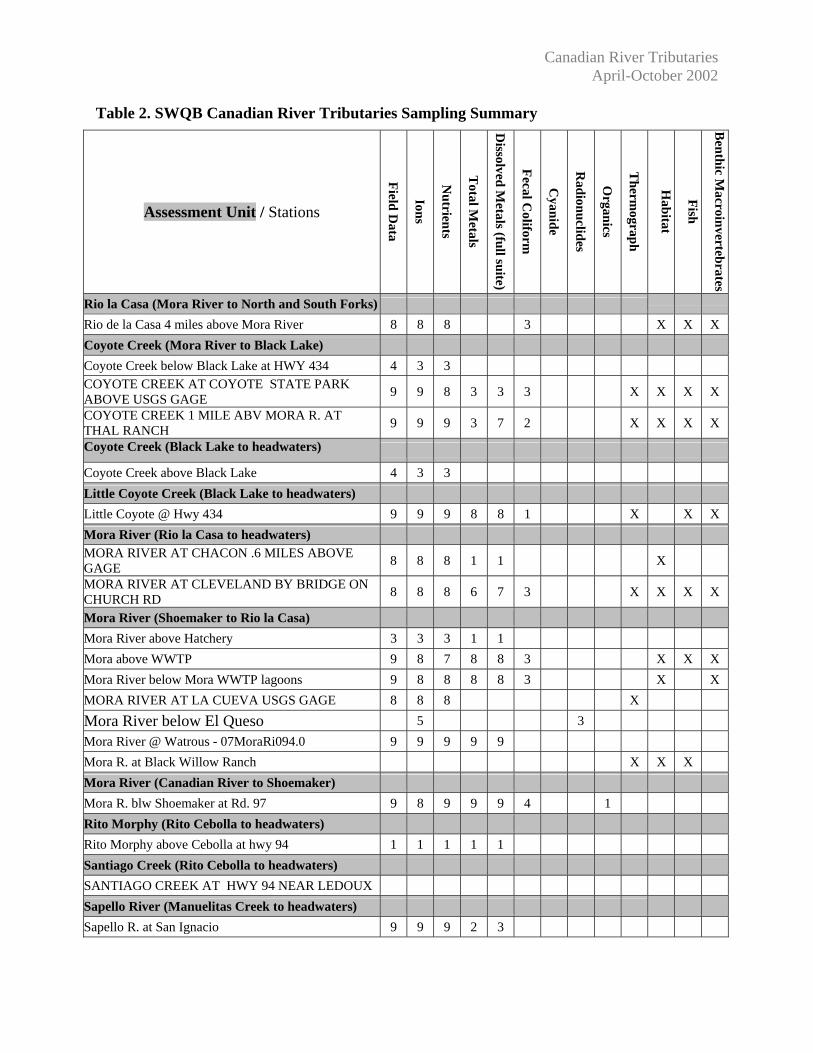
Wheaton Creek ~ 0.5 mi above confluence with Ocate Creek - 06Wheato000.8 - near the bottom of the AU. Wolf Cr. abv Mora R. - 07WolfCr000.6 - at the bottom of the AU, went dry during survey. YORK CANYON CR. ABOVE THE VERMEJO RIVER 04YorkCa000.1 -York Canyon drains the area of reclaimed mining area and processing plant Tables 2 and 3 summarize the data collected in each assessment unit and at each station. The number of times each parameter (or suite of parameters) was monitored is indicated. Field data include temperature, specific conductance, pH, dissolved oxygen, and turbidity.
Canadian River Tributaries April-October 2002
Table 2. SWQB Canadian River Tributaries Sampling Summary
Assessment Unit / Stations
Field Data
Ions
Nutrients
Total M
etals
Dissolved M
etals (full suite)
Fecal Coliform
Cyanide
Radionuclides
Organics
Therm
ograph
Habitat
Fish
Benthic M
acroinvertebrates
Rio la Casa (Mora River to North and South Forks)
Rio de la Casa 4 miles above Mora River 8 8 8 3 X X X Coyote Creek (Mora River to Black Lake) Coyote Creek below Black Lake at HWY 434 4 3 3 COYOTE CREEK AT COYOTE STATE PARK ABOVE USGS GAGE 9 9 8 3 3 3 X X X X
COYOTE CREEK 1 MILE ABV MORA R. AT THAL RANCH 9 9 9 3 7 2 X X X X
Coyote Creek (Black Lake to headwaters)
Coyote Creek above Black Lake 4 3 3 Little Coyote Creek (Black Lake to headwaters) Little Coyote @ Hwy 434 9 9 9 8 8 1 X X X Mora River (Rio la Casa to headwaters) MORA RIVER AT CHACON .6 MILES ABOVE GAGE 8 8 8 1 1 X
MORA RIVER AT CLEVELAND BY BRIDGE ON CHURCH RD 8 8 8 6 7 3 X X X X
Mora River (Shoemaker to Rio la Casa) Mora River above Hatchery 3 3 3 1 1 Mora above WWTP 9 8 7 8 8 3 X X X Mora River below Mora WWTP lagoons 9 8 8 8 8 3 X X MORA RIVER AT LA CUEVA USGS GAGE 8 8 8 X Mora River below El Queso 5 3 Mora River @ Watrous - 07MoraRi094.0 9 9 9 9 9 Mora R. at Black Willow Ranch X X X Mora River (Canadian River to Shoemaker) Mora R. blw Shoemaker at Rd. 97 9 8 9 9 9 4 1 Rito Morphy (Rito Cebolla to headwaters) Rito Morphy above Cebolla at hwy 94 1 1 1 1 1 Santiago Creek (Rito Cebolla to headwaters) SANTIAGO CREEK AT HWY 94 NEAR LEDOUX Sapello River (Manuelitas Creek to headwaters)
Sapello R. at San Ignacio 9 9 9 2 3

Canadian River Tributaries April-October 2002
Assessment Unit / Stations
Field Data
Ions
Nutrients
Total M
etals
Dissolved M
etals (full suite)
Fecal Coliform
Cyanide
Radionuclides
Organics
Therm
ograph
Habitat
Fish
Benthic M
acroinvertebrates
SAPELLO RIVER 1/4 MI. INSIDE MOSIMANN RANCH GATE 9 9 10 1 1 3 1 X X X X
Sapello River (Mora River to Manuelitas Creek) Sapello R. at Hwy 161 (near Watrous) 8 8 8 8 8 3 1 Sapello R. at Hwy 518 9 9 9 9 9 4 1 1 X X X X Manuelitas Creek (Sapello River to headwaters)
Maestas Cr. abv Manuelitas Cr. 2 2 2 2 1
MANUELITAS CREEK AT HWY 94 BRIDGE 7 5 5 5 5 1 X
Manuelitas Cr. abv Maestas Cr. 7 6 6 X
Manuelitas Creek blw Rociada 1 1 1
Rito San Jose (Manuelitas Creek to headwaters)
Rito San Jose above Manuelitas Creek 6 5 5 2 2
Rito de Gascon (Rito San Jose to headwaters)
Rito Gascon abv Rito San Jose 2 2 2 1 1
Rito Cebolla (Mora River to headwaters)
Rito Cebolla @ Hwy 161 8 8 8 2 2 X
Wolf Creek (Mora River to headwaters)
Wolf Creek above Mora River 8 4 4

Canadian River Tributaries April-October 2002
Table 3. SWQB Vermejo River and Ocate Creek Sampling Summary
Assessment Unit / Stations
Field Data
Ions
Nutrients
Total M
etals
Dissolved M
etals (full suite)
Fecal Coliform
Cyanide
Radionuclides
Organics
Therm
ograph
Habitat
Fish
Benthic M
acroinvertebrates
Caliente Canyon (Vermejo River to headwaters)
Caliente Canyon above Vermejo River 2 2 2 2 2
Vermejo River (York Canyon to headwaters)
Vermejo River below Leandro Creek 3 3 3 1 1 X X X Vermejo River at Juan Baca Canyon 8 8 8 8 8 X X X Vermejo River (Rail Canyon to York Canyon)
Vermejo River above Caliente Canyon 7 7 7 7 7 1 X X X X Vermejo River (Canadian River to Rail Canyon)
Vermejo River (downstream of) Dawson (below conf with Rail) 3 3 3
VERMEJO RIVER AT I-25 5 5 5 5 5 X
York Canyon (Vermejo River to headwaters) YORK CANYON CR. ABOVE THE VERMEJO RIVER 8 8 8 8 8
VanBremmer Creek (HWY 64 to headwaters)
VanBremmer Creek @ Hwy 64 4 4 4
Ocate Creek (Canadian River to Ocate)
Ocate Creek @ I-25 3 3 3 3 3
Ocate Creek (Ocate to Wheaton Creek)
Ocate Creek above village of Ocate 2 5 5 5 5 3
Manuelas Creek (Ocate Creek to headwaters)
Manuelas Creek above Ocate Creek 8 8 8 8 8 3 1 1 X
Wheaton Creek (Manuelas Creek to headwaters)
Wheaton Creek ~ 0.5 mi above Ocate Creek) 8 8 8
Canadian River Tributaries April-October 2002
5.0 WATER QUALITY ASSESSMENT
5.1 Water Quality Standards Exceedences For many water quality parameters, the State of New Mexico maintains numeric water quality standards. However, for several parameters (e.g., plant nutrients, stream bottom deposits), only narrative standards exist. Data are assessed for designated use attainment status for both numeric and narrative water quality standards by application of the Assessment Protocol and associated appendices (NMED/SWQB 2004b). A complete data set can be obtained by contacting the water chemistry survey lead or calling the SWQB. The following discussion includes information pertaining to all exceedences of water quality standards found during the intensive watershed survey. The purpose of this section of the report is to provide the reader with information on where current water quality standards are being exceeded within the watershed. These exceedences are used to determine designated use impairment status. Final assessment determinations as to whether or not a stream reach is considered to be meeting its designated uses depend on the overall amount and type of data available during the assessment process (Refer to SWQB’s Assessment Protocol for additional information on the assessment process, NMED/SWQB 2004b). When available, outside sources of data that meet quality assurance requirements are combined with data collected by SWQB during intensive watershed survey to determine final impairment status. Final designated use impairment status is housed in the Assessment Database (ADB) and is reported in the biennial State of New Mexico Integrated CWA §303(d)/§305(b) Report (NMED/SWQB 2004a).
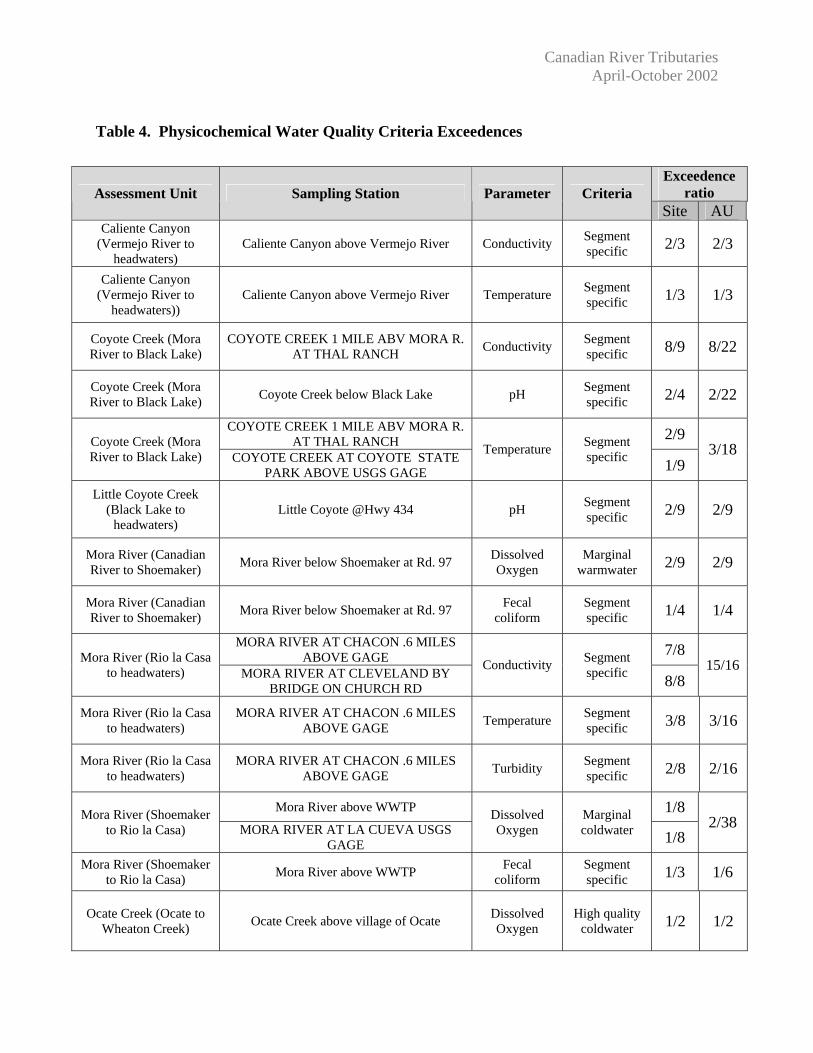
5.1.1 Physicochemical Data Water quality criteria exceedences are provided in Table 4. The table lists the AU, Sampling Station, parameter, applicable criteria, and the exceedence ratio. The exceedence ratio is the number of times the parameter exceeded the applicable criterion divided by the total number of times that parameter was measured at a given site or assessment unit.
Canadian River Tributaries April-October 2002
Table 4. Physicochemical Water Quality Criteria Exceedences
Exceedence ratio Assessment Unit Sampling Station Parameter Criteria
Site AU Caliente Canyon
(Vermejo River to headwaters)
Caliente Canyon above Vermejo River Conductivity Segment specific 2/3 2/3
Caliente Canyon (Vermejo River to
headwaters)) Caliente Canyon above Vermejo River Temperature Segment
specific 1/3 1/3
Coyote Creek (Mora River to Black Lake)
COYOTE CREEK 1 MILE ABV MORA R. AT THAL RANCH Conductivity Segment
specific 8/9 8/22
Coyote Creek (Mora River to Black Lake) Coyote Creek below Black Lake pH Segment
specific 2/4 2/22
COYOTE CREEK 1 MILE ABV MORA R. AT THAL RANCH 2/9 Coyote Creek (Mora
River to Black Lake) COYOTE CREEK AT COYOTE STATE PARK ABOVE USGS GAGE
Temperature Segment specific 1/9
3/18
Little Coyote Creek (Black Lake to
headwaters) Little Coyote @Hwy 434 pH Segment
specific 2/9 2/9
Mora River (Canadian River to Shoemaker) Mora River below Shoemaker at Rd. 97 Dissolved
Oxygen Marginal
warmwater 2/9 2/9
Mora River (Canadian River to Shoemaker) Mora River below Shoemaker at Rd. 97 Fecal
coliform Segment specific 1/4 1/4
MORA RIVER AT CHACON .6 MILES ABOVE GAGE 7/8 Mora River (Rio la Casa
to headwaters) MORA RIVER AT CLEVELAND BY BRIDGE ON CHURCH RD
Conductivity Segment specific 8/8
15/16
Mora River (Rio la Casa to headwaters)
MORA RIVER AT CHACON .6 MILES ABOVE GAGE Temperature Segment
specific 3/8 3/16
Mora River (Rio la Casa to headwaters)
MORA RIVER AT CHACON .6 MILES ABOVE GAGE Turbidity Segment
specific 2/8 2/16
Mora River above WWTP 1/8 Mora River (Shoemaker to Rio la Casa) MORA RIVER AT LA CUEVA USGS
GAGE
Dissolved Oxygen
Marginal coldwater 1/8
2/38
Mora River (Shoemaker to Rio la Casa) Mora River above WWTP Fecal
coliform Segment specific 1/3 1/6
Ocate Creek (Ocate to Wheaton Creek) Ocate Creek above village of Ocate Dissolved
Oxygen High quality
coldwater 1/2 1/2

Canadian River Tributaries April-October 2002
Exceedence ratio Assessment Unit Sampling Station Parameter Criteria
Site AU Rito San Jose
(Manuelitas Creek to headwaters)
Rito San Jose above Manuelitas Creek Dissolved Aluminum
Aquatic Life (chronic) 2/2 2/2
Rito San Jose (Manuelitas Creek to
headwaters) Rito San Jose above Manuelitas Creek pH Segment
specific 2/6 2/6
Sapello River (Mora River to Manuelitas
Creek) Sapello R. at Hwy 161 (near Watrous)
Total recoverable
selenium
Aquatic Life (chronic) 1/8 1/17
Sapello River (Mora River to Manuelitas
Creek) Sapello R. at Hwy 161 (near Watrous) Dissolved
Oxygen Marginal coldwater 3/8 3/17
Sapello River (Mora River to Manuelitas
Creek) Sapello R. at Hwy 161 (near Watrous) Fecal
coliform Segment specific 1/3 1/7
Sapello River (Mora River to Manuelitas
Creek) Sapello R. at Hwy 161 (near Watrous) Temperature Segment
specific 1/8 1/17
Wheaton Creek (Manuelas Creek to
headwaters)
Wheaton Creek ~ 0.5 mi above confluence with Ocate Creek Turbidity Segment
specific 1/8 1/8
Wolf Creek (Mora River to headwaters) Wolf Creek above Mora River Ammonia Aquatic Life
(chronic) 1/4 1/4
Wolf Creek (Mora River to headwaters) Wolf Creek above Mora River Dissolved
Oxygen Marginal coldwater 1/8 1/8
Wolf Creek (Mora River to headwaters) Wolf Creek above Mora River Temperature Segment
specific 1/8 1/8
York Canyon (Vermejo River to headwaters)
YORK CANYON CR. ABOVE THE VERMEJO RIVER Conductivity Segment
specific 7/8 7/8
York Canyon (Vermejo River to headwaters)
YORK CANYON CR. ABOVE THE VERMEJO RIVER Turbidity Segment
specific 2/8 2/8
Criteria for metals were exceeded in two areas: the Rito San Jose above Manuelitas Creek for dissolved aluminum and the Sapello River at Highway 161 for total recoverable selenium. No cyanide or radionuclide samples were found to be in exceedence of their respective water quality criteria. Furthermore, no organic compounds (volatile or semi-volatile) were found above detection limits. Fecal coliform criteria were exceeded on the Mora and Sapello Rivers. Criteria for a number of the field parameters such at conductivity, temperature, pH, and DO were exceeded occasionally throughout the study area. Some of the exceedences are likely due to the drought and resulting low flow conditions. For example sites on Caliente, Ocate and Wolf Creeks did not have flow during the entire survey and were sampled as they were drying up and
Canadian River Tributaries April-October 2002
concentrating solutes. While the average annual flow of the Mora River generally ranges from 10-40 cubic feet per second (cfs) in 2002 it was just 2 cfs and the Canadian River which generally runs between 20-80 cfs averaged 9 cfs.
5.1.2 Data from Thermographs Temperature data loggers (thermographs) were deployed at selected stations within the study area. The thermographs were programmed to record temperature once per hour over their respective collection intervals. Table 5 summarizes temperature data from thermographs in degrees Celsius (°C).
Large data sets generated from thermographs are assessed according to protocols developed specifically for such data sets (with few exceptions). This is because, unlike grab sample data, it is not reasonable to list as not supporting on the basis of one or a few exceedences out of several hundred or thousand data points. Temperature assessment criteria are tied to the criteria in the New Mexico Standards for Interstate and Intrastate Surface Waters (NMAC 2006). Details of large data set assessment procedures are available in the Assessment Protocol (NMED/SWQB 2004b). Exceedences of the temperature criteria were documented on three assessment units which are detailed below. Coyote Creek (Mora River to Black Lake): Two thermographs were deployed on this reach in 2002, one at Coyote Creek at Thal Ranch and another at Coyote Creek at Coyote State Park. The thermograph at the State Park recorded temperatures from May 2 through September 17 and exceeded the coldwater aquatic life (CWAL) use criterion 189 of 3,337 times (6%) with a maximum temperature of 22.69°C on July 19. The thermograph at Thal Ranch recorded temperatures from May 1 through October 1 and exceeded the CWAL use criterion 1,248 of 3,672 times (34%) with a maximum temperature of 31.24°C on July 8. Vermejo River (York Canyon to headwaters): One thermograph was deployed on this reach in 2002 at Vermejo River at Juan Baca Canyon. Recorded temperatures from May 8 through September 17 exceeded the CWAL use criterion 865 of 3,192 times (27%) with a maximum temperature of 30.08°C on July 8. Vermejo River (Rail Canyon to York Canyon): One thermograph was deployed on this reach in 2002 at Vermejo River above Caliente Canyon. Recorded temperatures from May 8 through August 1 exceeded the CWAL use criterion 631 of 2,051 times (31%) with a maximum temperature of 30.67°C on July 12.

Canadian River Tributaries April-October 2002
Table 5. Summary of Thermograph Data
Station Data
Collection Interval
WQS Temperature Criterion (°C)
Maximum Recorded
Temperature (°C)
Total # of data points
(n)
Exceedence Ratio =
% Exceedences
Coyote Creek at Coyote State Park
2 May- 17 Sep 2002 20 22.69 3,337 189/3337=6%
Coyote Creek at Thal Ranch 1 May- 1 Oct 2002 20 31.24 3,672 1248/3672=34%
Little Coyote Creek @ Hwy 434
2 May- 17 Sep 2002 20 23.97 3,311 251/3311=8%
Manuelas Creek abv Ocate Creek
2 May- 16 Sep 2002 20 19.5 3,296 0/3296=0%
Manuelitas Creek @ Hwy 94 bridge
14 May- 30 Sep 2002 20 25.86 3,333 240/3333=7%
Manuelitas Creek abv Maestas Creek
14 May- 16 Oct 2002 20 18.39 3,719 0/3719=0%
Mora River @ Black Willow Ranch
11 Jun- 1 Oct 2002 25 27.62 2,685 65/2685=2%
Mora River @ Cleveland by bridge on Church Rd.
1 May- 17 Sep 2002 20 20.58 3,336 11/3336=0.3%
Mora River @ La Cueva USGS gauge
1 May- 17 Sep 2002 25 25.21 3,332 3/3332=0.1%
Rito Cebolla @ Hwy 161 1 May- 31 Oct 2002 25 27.19 4,386 67/4386=2%
Sapello River @ Hwy 518 14 May- 30 Sep 2002 25 29.88 3,335 259/3335=8%
Sapello River ¼ mi. inside Mossiman Ranch gate
14 May- 30 Sep 2002 25 25.77 3,339 7/3339=0.2%
Vermejo River @ I-25 8 May- 14 Jun 2002 32.2 25.23 890 0/890=0%
Vermejo River above Caliente Canyon
8 May- 1 Aug 2002 20 30.67 2,051 631/2051 = 31%
Vermejo River at Juan Baca Canyon
8 May - 17 Sep 2002 20 30.08 3,192 865/3192 = 27%
Canadian River Tributaries April-October 2002
6.0 Conclusions
Due to the large volume of data collected during this survey, it will not be included in this report. To acquire specific data, contact the SWQB or search USEPA’s STORET database. Water quality monitoring stations were located within the Canadian watershed during the intensive watershed survey to evaluate the impact of tributary streams and ambient water quality conditions. All of the monitoring that was conducting by the SWQB is summarized in Tables 2 and 3. Those parameters that exceeded the State’s Water Quality Criteria are shown in Table 4. As a result of assessing data generated during this monitoring effort impairment determinations of New Mexico water quality standards for specific conductance were documented for Caliente Canyon (Vermejo River to headwaters), Vermejo River (Rail Canyon to York Canyon), York Canyon (Vermejo River to headwaters), Coyote Creek (Mora River to Black Lake), and Mora River (Hwy 434 to headwaters). Impairment of the narrative plant nutrients criterion was determined for Little Coyote Creek (Black Lake to headwaters) and the Mora River (USGS gage east of Shoemaker to Hwy 434). Exceedences of temperature criteria were documented on Vermejo River (Rail Canyon to York Canyon), Vermejo River (York Canyon to headwaters), and Coyote Creek (Mora River to Black Lake). Impairment due to sedimentation/siltation was determined on Mora River (Hwy 434 to headwaters) and Sapello River (Mora River to Manuelitas Creek). Total Maximum Daily Load (TMDL) documents were prepared by the SWQB to address the above noted impairments. The TMDLs were approved by the EPA in September 2007. A number of assessment units could not be assessed due to insufficient data. These impairments will remain on the Integrated Clean Water Act §303(d)/§305(b) list of waters until additional data are available. Additional water quality data will be collected by the SWQB during the standard rotational period for intensive stream surveys. As a result, targets will be re-examined and potentially revised. When water quality standards have been achieved, the reach will be moved to the appropriate category on the Integrated Clean Water Act §303(d)/§305(b) list of waters.

Canadian River Tributaries April-October 2002
7.0 References Hoffman, Gretchen. 2004. History of Development of Coal and Coalbed Methane Resources on
the Raton Coalfield in New Mexico. The Geological Society of America (GSA). 2004 Annual Meeting, http://gsa.confex.com/gsa/2004AM/finalprogram/abstract_74028.htm
McLemore, V.T. 1999. Coyote Creek State Park: New Mexico Geology, v. 21, p. 18-21
New Mexico Administrative Code (NMAC). 2002. State of New Mexico Standards for Interstate and Intrastate Streams. 20.6.4. New Mexico Water Quality Control Commission. As amended through October 11, 2002.
NMAC. 2006. State of New Mexico Standards for Interstate and Intrastate Surface Waters.
20.6.4. New Mexico Water Quality Control Commission. As amended through February 16, 2006. (20.6.4 NMAC) http://www.nmenv.state.nm.us/swqb/Standards/index.html
New Mexico Environment Department/Surface Water Quality Bureau (NMED/SWQB). 2002.
Quality Assurance Project Plan (QAPP) for Water Quality Management Programs, 2002.
NMED/SWQB. 2004a. Integrated Clean Water Act §303(d)/§305(b) Report. Santa Fe, NM. http://www.nmenv.state.nm.us/wqcc/303d-305b/2004/index.html NMED/SWQB. 2004b. Procedures for Assessing Standards Attainment for the Integrated CWA §303(d)/§305(b) Water Quality Monitoring and Assessment Report. Santa Fe, NM. Natural Resources Conservation Service National Water and Climate Center (NRCS). 2007.
http://www.wcc.nrcs.usda.gov/climate/avg/