venture pulse q4 2016 - assets.kpmg · quarterly data reveals a nearly 5 quarters straight slide in...
TRANSCRIPT

1#Q4VC© 2017 KPMG LLP, a Canadian limited liability partnership and a member firm of the KPMG network of independent
member firms affiliated with KPMG International Cooperative (“KPMG International”), a Swiss entity. All rights reserved.
Venture PulseQ4 2016Global analysis of
venture funding

2#Q4VC© 2017 KPMG LLP, a Canadian limited liability partnership and a member firm of the KPMG network of
independent member firms affiliated with KPMG International Cooperative (“KPMG International”), a Swiss
entity. All rights reserved.
Welcome
We explore these and a number of other global and regional trends
in this quarter’s Venture Pulse Report. We also examine a number
of questions related to venture capital investment, including:
― Is the VC investment tide about to turn?
― How have investor behaviors changed in light of 2016 trends?
― Is the IPO market opening, particularly in the US?
― What might 2017 have in store for VC investing?
We hope you find this edition of the Venture Pulse Report insightful.
If you would like to discuss any of the results in more detail, contact
a KPMG adviser in your area.
message
© 2017 KPMG LLP, a Canadian limited liability partnership and a member firm of the KPMG network of
independent member firms affiliated with KPMG International Cooperative (“KPMG International”), a Swiss
entity. All rights reserved
You know KPMG, you might not
know KPMG Enterprise.
KPMG Enterprise advisers in
member firms around the world are
dedicated to working with
businesses like yours. Whether
you’re an entrepreneur looking to
get started, an innovative, fast
growing company, or an established
company looking to an exit, KPMG
Enterprise advisers understand what
is important to you and can help you
navigate your challenges — no
matter the size or stage of your
business. You gain access to
KPMG’s global resources through a
single point of contact — a trusted
adviser to your company. It’s a local
touch with a global reach.

3#Q4VC© 2017 KPMG LLP, a Canadian limited liability partnership and a member firm of the KPMG network of
independent member firms affiliated with KPMG International Cooperative (“KPMG International”), a Swiss
entity. All rights reserved.
Foreword By all accounts, 2016 was a banner year for VC activity in Canada. As this edition of
Venture Pulse illustrates, capital continued to flow into the Canadian marketplace in
2016. Total invested capital was up more than 16 percent (year-over-year).
Competition for deals was feverish. Multiples continued to rise.
The past year also yielded a number of rather important deals – ones that will help
improve the overall value of the Canadian ecosystem. This publication notes the
funding of Toronto-based BlueRock Therapies and Hubba Inc., as well as Montreal-
based Element AI. But there were many other deals that also attracted significant
attention from foreign (particularly US) investors.
We believe that this year will be equally exciting for the Canadian marketplace. The
reality is that the fundamentals of the Canadian ecosystem remain strong. Our
corporate tax rate and tax credit systems encourage innovation. Our education and
development programs produce world-class talent. Our entrepreneurs and startups
form a collaborative ecosystem for high growth companies. And our corporate
community continues to offer investment and support to new ideas and
technologies.
Foreign investors will continue to view Canada as a top destination for activity this
year. For some, Canada continues to be viewed as a value market where great
growth companies can be purchased at reasonable multiples. Others see Canadian
investments as a stable mid-point between Europe and the US. Our discussions
with foreign VC investors suggest that many also view Canada as a market that
develops strong talent and executive teams.
With all signs pointing to an exciting 2017, the big challenge will be in matching the
flow of capital with strong growth companies – making sure the right investors are
meeting the right entrepreneurs to maximize value for all parties involved. And that
will require entrepreneurs and VC investors (foreign and national) to build broader
networks and deeper relationships with key players in the ecosystem.
At KPMG, our focus is on helping entrepreneurs and investors identify, create and
maximize value. We leverage our extensive network and deep industry capabilities
to help high-growth companies explore all of their options and meet the right players
to achieve their objectives. And our experience suggests that this year will be
exciting for those able to capitalize on the market environment.
To learn more about the trends raised in this report, or to discuss your organization’s
own unique challenges, we encourage you to contact your local KPMG office.
© 2017 KPMG LLP, a Canadian limited liability partnership and a member firm of the KPMG network of independent
member firms affiliated with KPMG International Cooperative (“KPMG International”), a Swiss entity. All rights reserved.
Sunil Mistry
Partner, Audit
KPMG Enterprise
Technology, Media &
Telecommunications
KPMG in Canada

5Summary
6Global Americas
31
47US
70Europe
99Asia
Contents
© 2017 KPMG LLP, a Canadian limited liability partnership and a member firm of the KPMG network of independent
member firms affiliated with KPMG International Cooperative (“KPMG International”), a Swiss entity. All rights reserved.

5#Q4VC© 2017 KPMG LLP, a Canadian limited liability partnership and a member firm of the KPMG network of independent
member firms affiliated with KPMG International Cooperative (“KPMG International”), a Swiss entity. All rights reserved.
Global VC investment remains substantial, despite major decline in activity
Worldwide venture capital activity declined 24% year-over-year, with just 13,665 completed deals in
2016, compared to 17,992 in 2015. Despite the weakening activity, total venture capital investment
remained substantial, with $127.4 billion invested globally during the year. While the amount may be
below the peak of $140.6 billion invested in 2015, it is nearly double the total global VC investment
seen in 2013.
Asia holds steady year-over-year, while Americas and Europe slip
Unlike the other major regions, Asia’s total venture capital invested remained steady between 2015 and
2016, just eclipsing $39 billion each year. The Americas and Europe saw VC capital investment decline
significantly during the same period. In the Americas, VC investment dropped from $82 billion to $72
billion, while in Europe investment dropped from $18 billion to $16 billion. The decline in deals activity
was even more noticeable – with a drop from 11,208 to 8,642 deals in the Americas, and a drop from
4,378 to 3,142 deals in Europe. Across nearly all regions, investments at the angel and seed-stage
recorded quarter-over-quarter declines during 2016, with Asia in particular showing a sudden downturn
in angel and seed-stage investment between Q3 and Q4 2016.
Deal metrics suggest investors are still willing to pay up
In 2016, median deal sizes remained high across virtually every series of VC financing. Globally, the
median Seed investment and Series A investment both increased in size from 2015, while the median
Series B investment held steady at approximately $12 million. In terms of later stage deals, while the
median Series D+ investment declined somewhat, from $35 million to $30 million, it remained far
higher than in years preceding 2015 and double 2011’s median investment. It’s clear that while there
was a slight increase in investor caution for late-stage deals, investors were still willing to pay up for the
right opportunities. Moreover, valuations remained near decade highs. Worldwide, the median Series
B pre-money valuation stood at $39.6 million in 2016, close to twice the $20.8 million logged in 2012.
US sees a significant year-over-year slide in first-time financings
High prices had an effect on the level of first-time financings during 2016, with the most highly valued
markets experiencing another year-over-year decline. For example, the US recording a decrease from
3,331 closed first-time fundings in 2015 to 2,340 during 2016 – a slide of nearly 30%. Notably, even in
the expensive climate, corporate venture arms participated in nearly 15% of all venture activity during
2016 worldwide, the combined value of all such financings hitting a decade high of $64.9 billion.
Corporate M&A accounts for the bulk of exit value in 2016, but declines quarter-over-quarter
Liquidity for venture investors remained on the wane. Exits declined further from the decade high
reached in 2014, with year-over-year decreases of almost 26% by count and 13% by value worldwide.
Quarterly data reveals a nearly 5 quarters straight slide in completed sales of venture-backed holdings
globally. On a brighter note, until the final quarter of 2016, most regions saw less of an impact on
quarterly tallies of exit value. For example, the 5 quarters from Q3 2015 to Q3 2016, inclusive, each
eclipsed $18 billion in global VC-backed exit value. Corporate M&A continued to account for the bulk of
all VC-backed exit value at 84% in 2016 alone, for a total of $58 billion. However, quarterly data
reveals a slow but steady slide in corporate M&A, which could suggest a period of lessened liquidity for
VC firms unless other exit options arise.
Big disparity in fundraising activity regionally, with Europe showing seven year high in VC
raised
Venture fundraising activity differed greatly between the key regions in 2016, with the global markets
standing at 372 pools of capital combining for $64.4 billion. In the Americas, the US experienced
relatively steady fundraising totals, recording 255 closed funds for 2015 and 253 for 2016, although
mega-vehicles drove last year’s total VC committed to $41.6 billion. Worldwide, the trend of more
money flowing to larger VC managers continued, with Europe, in particular, seeing a seven-year high
of $10.5 billion raised across a seven-year low of 62 closed funds in 2016.
All currency amounts are in USD, unless otherwise specified, data provided by Pitchbook.
Q4’16 summary

Globally, in Q4’16 VC-
backed companies
raised
$21.8Bacross
2,809 deals

7#Q4VC© 2017 KPMG LLP, a Canadian limited liability partnership and a member firm of the KPMG network of independent
member firms affiliated with KPMG International Cooperative (“KPMG International”), a Swiss entity. All rights reserved.
After a record breaking 2015, 2016 offered a reality check to the venture capital market around the
globe. Concerned about high valuations and other economic challenges, they tightened their funding
taps and became more cautious with their investments. The uncertainties associated with the June
Brexit vote and its aftermath in the UK, ongoing concern around the lack of exits and the end-of-year
presidential election in the US only added to the caution.
Despite the nervousness permeating the VC market throughout much of the year, VC funds conducted
what many believe to be a record amount of fundraising. This fundraising, combined with the settling
down of several macroeconomic uncertainties that plagued 2016 and the belief that the US IPO market
will open again in 2017, however, is giving investors hope that 2017 will see renewed interest and
activity in VC globally.
Global annual VC funding remains high, while deal volume plummets
Globally, the total amount of VC funding in 2016 came second only to the peak of 2015, making it a
reasonably good year overall for the VC market, despite the steep drop-off experienced in the second
half of the year. While 2016’s total level of funding may be relatively good by comparison to previous
years, the major decline in the number of deals suggests a more complicated year for VC investment.
In Q4’16 in particular, funding dropped to an 11 quarter low, while the total number of deals fell to a
number not seen since Q4’11. The Americas, Asia and Europe experienced a marked decrease in both
metrics, with Asia and the Americas experiencing the largest declines. Europe’s VC market showed
some resilience in the amount of VC invested, although the region’s VC market as a whole remains but
a fraction of those in the other regions.
Caution driving investor behaviors
2016 was characterized by far more caution on the part of investors. While many VC investors were
jumping the gun on investments in 2015 so they wouldn’t miss the perceived investment boat, during
the second half of 2016, in particular, investors became more selective and took far more time to
evaluate potential investments. Investors increasingly focused on companies that had a concrete
business plan and a proven path to profitability. Companies began to recognize that they could no
longer burn cash if they wanted to attract investors.
Investor caution as a result of IPOs failing to achieve their private sector valuations earlier in 2016 also
drove many investors to request greater down-round protections for investments. An increasing
number of deals also involved convertible debt or options coverage in the event companies could not
meet identified milestones.
IPO market fizzles in 2016, but hope for 2017 renewal
The IPO market in the US for VC-backed companies almost came to a standstill in 2016 following a
number of high-profile IPOs earlier in the year that failed to achieve their private sector valuations. In
the latter half of the year, a small number of tech companies tested the IPO waters again. Twilio
showed strong Q3 and Q4 pricing, which could be a positive sign for the IPO market in 2017.
Expectations that a number of large private tech giants will head to IPO early in 2017 are driving
renewed interest in the IPO market. Already, Snap, the parent company of Snapchat, has filed for an
IPO expected to occur in Q1’17, while others are expected to follow suit, particularly if Snap’s endeavor
is successful. The opening up of the IPO market would likely have a positive ripple effect on broader
VC investment.
Uncertainties hold back global VC funding through end of 2016

8#Q4VC© 2017 KPMG LLP, a Canadian limited liability partnership and a member firm of the KPMG network of independent
member firms affiliated with KPMG International Cooperative (“KPMG International”), a Swiss entity. All rights reserved.
Corporate VC participation continues to grow
Corporate investors were particularly active in the VC market during 2016, with Q4’16 being no exception.
Many corporate investors have different KPIs for their investments than do VC funds, PE firms or institutional
investors. A combination of strategic and investment drivers have kept them active, even in a market
dominated by caution overall.
Corporate investors are also making a broad range of investments beyond simple direct VC funding. While a
number have set up corporate VC funds, other forms of investment are also growing, including the
development of internal business accelerators or the sponsorship of incubators that align with their future
strategies. There is little doubt that an increasing number of corporates are looking to the long-term value
offered by supporting startups and fostering the innovation ecosystem. As a result, it is expected that
corporate participation will likely remain high or even grow further in the foreseeable future.
VC Investment in Asia and Americas drops dramatically
VC funding to Asia-based and Americas-based companies dropped dramatically in Q4’16. In Asia, the lack of
large mega-rounds caused significant declines during the quarter, with just one $500m+ financing round during
Q4 – a $500m Series E round to Beijing-based software company Yixia. In the US, the largest deal of the quarter
was less than half of that size – a $210m Series D round to San Francisco based software company Opendoor.
In Asia, the total dollars invested came relatively close to 2015, although the total number of deals in the
region dropped sharply. In the Americas, both deals volume and deal value dropped considerably compared
to the banner year the region experienced in 2015.
Europe shows some resilience in Q4 despite uncertainty
While Europe’s VC market experienced a challenging year overall, the region showed some resilience in total
capital invested in Q4’16 compared to the experience of Asia and the Americas. In a post-Brexit world, investors
mostly appear to be taking a ‘business as usual’ approach to their investments until more details around the UK’s
Brexit strategy are released in 2017. While the investment environment remains cautious, a number of positive
factors have helped with building resilience, including several successful IPO exits by European companies.
Government initiatives by the UK, France and Germany also have set the stage for additional VC investment in
2017.
Uncertainties hold back Global VC funding through end of 2016, cont’d

9#Q4VC© 2017 KPMG LLP, a Canadian limited liability partnership and a member firm of the KPMG network of independent
member firms affiliated with KPMG International Cooperative (“KPMG International”), a Swiss entity. All rights reserved.
Governments helping to drive and support innovation economy
One positive trend seen during 2016 is the rising interest in governments supporting innovation and the
development of technology hubs, with initiatives coming from Europe, in particular during Q4. In the UK, the
government announced £1 billion in funding to drive the development of digital infrastructure, part of which
includes measures to support UK-based startups – such as investing £400 million into venture capital firms
through the British Business Bank¹. This announcement could reflect the UK’s desire to show its ongoing
commitment to being a leading technology center despite plans for an exit from the EU.
The governments of Germany and France are also working together to create a €1billion fund to assist
startups in their countries to grow beyond the seed-stage². This announcement suggests the level of
importance both countries are placing on helping startups grow. While companies can typically get access to
seed-stage funding or late-stage funding following proof of concept, middle-stage funding can be more difficult.
By bridging the gap, the governments are showing their commitment to developing a solid ecosystem for
startups at all stages of development.
In China, the Central Government has continued its efforts to implement its 5 year strategic plan, which
includes a large focus on innovation. In Q4, provincial governments within the country started working on the
implementation of specific innovation-focused initiatives. For example, in Q4 the Hubei province announced
$81 billion³ for investments focused on diversifying the job base as the country works to move from a
manufacturing-based economy to an innovation-driven one. This money will be invested through a number of
large investment companies, such as Sequoia Capital and CBC Capital.
Healthtech remains a hot investment area
A number of areas peaked VC investor interest during 2016, including healthtech, fintech, artificial
intelligence, and the Internet of Things. While each of these areas won significant attention, healthtech
and biotech stood out as an investor priority in all regions of the world – a trend expected to continue into
the next year. The reality is that many jurisdictions are faced with major inefficiencies across their
healthcare systems. Companies that have strong solutions to a myriad of healthcare issues, from back-
office scheduling to patient record-keeping and diagnosis, will likely be able to obtain funding. Other
areas expected to continue to attract significant interest over the next year include artificial intelligence,
virtual reality and data analytics.
Cautious optimism heading into 2017
Looking into 2017, there is a sense of cautious optimism with respect to the VC market globally and in
key regions around the world. Should the IPO market open up, as many expect, this liquidity will likely
have a positive impact on the VC market as a whole. At the same time, it is expected that investors will
remain cautious with their investments. The days of companies being able to burn cash are gone for the
foreseeable future. Rather, investors will likely continue to focus on those companies that have an
efficient operating structure, strong business model and defined path to profitability.
Uncertainties hold back Global VC funding through end of 2016, cont’d
1. http://realbusiness.co.uk/funding/2016/11/23/autumn-statement-2016-400m-venture-capital-funds-british-business-bank/
2. http://www.forbes.com/sites/federicoguerrini/2016/12/19/germany-and-france-plan-to-set-up-a-1-billion-fund-for-startups/#1bc32b133366
3. https://www.bloomberg.com/news/articles/2016-10-20/china-heartland-province-deploying-81-billion-to-seed-startups

10#Q4VC© 2017 KPMG LLP, a Canadian limited liability partnership and a member firm of the KPMG network of independent
member firms affiliated with KPMG International Cooperative (“KPMG International”), a Swiss entity. All rights reserved.
Global venture financing by year
2010 – 2016
Amid the ongoing reset in the venture industry worldwide, it’s worth noting that total VC invested remains
very high, in fact, nearly twice the total seen in 2013. Although driven by mega-financings, the consistent
highs seen in round sizes and valuations on a global basis speak to the demand for worthwhile startups to
fund among venture firms, as well as the demand for exposure to potentially high-growth businesses by
institutional investors via the venture asset class.
$45 $64 $59 $65 $108 $141 $127
8,459
10,842
13,006
15,800
18,157 17,992
13,665
2010 2011 2012 2013 2014 2015 2016
Capital invested ($B) Deal count
Source: Venture Pulse, Q4’16, Global Analysis of Venture Funding, KPMG Enterprise. Data provided by PitchBook, January 12, 2017.
Note: Refer to the Methodology section on page 127 to understand any possible data discrepancies between this edition and previous
editions of Venture Pulse.
Steep slide in number of deals in 2016

11#Q4VC© 2017 KPMG LLP, a Canadian limited liability partnership and a member firm of the KPMG network of independent
member firms affiliated with KPMG International Cooperative (“KPMG International”), a Swiss entity. All rights reserved.
Global venture financing by stage
2010 – 2016
The final quarter of 2016 saw the lowest total of VC invested — $21.8 billion — for a given quarter since
Q1’14, which recorded $20.9 billion. As for deal flow, the year-over-year decline from Q4’15 was just over
30%, while to find a comparably low quarterly tally for total activity, one must look back to the final quarter of
2011. In short, the highs of 2014 and 2015 are on the wane, slowly but steadily.
0
1,000
2,000
3,000
4,000
5,000
6,000
$0
$5
$10
$15
$20
$25
$30
$35
$40
$45
$50
1Q 2Q 3Q 4Q 1Q 2Q 3Q 4Q 1Q 2Q 3Q 4Q 1Q 2Q 3Q 4Q 1Q 2Q 3Q 4Q 1Q 2Q 3Q 4Q 1Q 2Q 3Q 4Q
2010 2011 2012 2013 2014 2015 2016
Capital invested ($B) # of deals closed Angel/Seed Early VC Later VC
Source: Venture Pulse, Q4’16, Global Analysis of Venture Funding, KPMG Enterprise. Data provided by PitchBook, January 12, 2017.
Q4’16 sees multi-quarter lows

Arik SpeierCo-Leader, KPMG Enterprise Innovative
Startups Network and
Head of Technology,
KPMG in Israel
While there was a significant decline
in the overall number of deals this
year around the globe, the total
capital invested was more resilient,
thanks in part to some very large
mega-deals. The outlook for 2017
remains positive with a large number
of US and Chinese unicorns actively
exploring possible IPOs.
“
“
12#Q4VC© 2017 KPMG LLP, a Canadian limited liability partnership and a member firm of the KPMG network of independent
member firms affiliated with KPMG International Cooperative (“KPMG International”), a Swiss entity. All rights reserved.

13#Q4VC© 2017 KPMG LLP, a Canadian limited liability partnership and a member firm of the KPMG network of independent
member firms affiliated with KPMG International Cooperative (“KPMG International”), a Swiss entity. All rights reserved.
Global median deal size ($M) by stage
2010 – 2016
Global up, flat or down rounds
2010 – 2016
2016 saw the first significant proportional increase in down rounds for the first time in 2 years, amid the overall
decline. Median financing sizes stayed high, testifying to caution and strong demand persisting hand in hand.
$0.5 $0.5 $0.5 $0.5 $0.5 $0.6 $0.8
$2.5 $2.5$2.1 $2.4
$3.0$3.5
$4.6
$5.6
$6.4$6.0
$5.6
$7.4
$10.0 $10.0
2010 2011 2012 2013 2014 2015 2016
Angel/seed Early stage VC Later stage VC
0%
10%
20%
30%
40%
50%
60%
70%
80%
90%
100%
2010 2011 2012 2013 2014 2015 2016
Up
Flat
Down
Source: Venture Pulse, Q4’16, Global Analysis of Venture Funding, KPMG Enterprise. Data provided by PitchBook, January 12, 2017.
Deal sizes remain high as demand persists

14#Q4VC© 2017 KPMG LLP, a Canadian limited liability partnership and a member firm of the KPMG network of independent
member firms affiliated with KPMG International Cooperative (“KPMG International”), a Swiss entity. All rights reserved.
Global median deal size ($M) by series
2010 – 2016
Much attention has been paid to what some deemed the over-exuberant round sizes and valuations seen
among late-stage, venture-backed companies that, in years past, would have already gone public. However,
in a sign of growing investor caution, the median financing size at the Series D and later stage finally
declined by 15.1% year-over-year after climbing to a peak of $35.3 million in 2015. However, across the
same timeframe, financing rounds at earlier stages remained relatively high, with Series C deals inching up
by 13.1%.
$0.4 $0.5 $0.4 $0.4 $0.5 $0.8 $1.1
$2.5 $2.8 $2.7 $3.0$3.5
$4.2$5.0
$7.0 $7.3 $7.0 $6.8
$10.0
$12.3 $12.0
2010 2011 2012 2013 2014 2015 2016
Seed Series A Series B
$10.0
$12.0 $11.9 $12.3
$15.1
$20.0
$22.6
$12.4
$15.0$16.0 $16.0
$26.6
$35.3
$30.0
2010 2011 2012 2013 2014 2015 2016Series C Series D+
Source: Venture Pulse, Q4’16, Global Analysis of Venture Funding, KPMG Enterprise. Data provided by PitchBook, January 12, 2017.
The latest stage finally declined

15#Q4VC© 2017 KPMG LLP, a Canadian limited liability partnership and a member firm of the KPMG network of independent
member firms affiliated with KPMG International Cooperative (“KPMG International”), a Swiss entity. All rights reserved.
Global median pre-money valuation ($M) by series
2010 – 2016
Even as financing sizes may have slid a little across a few series, median pre-money valuations stayed
very high worldwide, although the largest figures either flatlined (as at Series D or later and Series B)
or they increased by less relative to prior years. Median Series C valuations, for example, only went up by
$6 million year-over-year, while the prior increase from 2014 to 2015 was a hefty $17.7 million.
$3.0 $3.6 $3.5 $3.7 $4.0 $4.8 $5.6$6.3 $7.0 $7.9 $8.8$11.2
$13.0$15.0
$19.2$20.5 $20.8
$25.0
$31.5
$39.0 $39.6
2010 2011 2012 2013 2014 2015 2016
Seed Series A Series B
$39.1$46.6 $50.0 $54.0
$60.0
$77.7$83.8
$66
$84$92
$97
$144
$190 $189
2010 2011 2012 2013 2014 2015 2016
Series C Series D+
Source: Venture Pulse, Q4’16, Global Analysis of Venture Funding, KPMG Enterprise. Data provided by PitchBook, January 12, 2017.
Valuations remain relatively high

16#Q4VC© 2017 KPMG LLP, a Canadian limited liability partnership and a member firm of the KPMG network of independent
member firms affiliated with KPMG International Cooperative (“KPMG International”), a Swiss entity. All rights reserved.
Global deal share by series
2010 – 2016, number of closed deals
Quarterly global deal share by series
2010 – 2016, VC invested ($B)
As stronger evidence for rising caution among investors, as well as broader macroeconomic conditions,
the riskiest angel and seed-stage has seen the greatest decline in proportionate activity.
0
2,000
4,000
6,000
8,000
10,000
12,000
14,000
16,000
2010 2011 2012 2013 2014 2015 2016
Series D+
Series C
Series B
Series A
Angel/seed
$0.0
$20.0
$40.0
$60.0
$80.0
$100.0
$120.0
2010 2011 2012 2013 2014 2015 2016
Series D+
Series C
Series B
Series A
Angel/seed
Source: Venture Pulse, Q4’16, Global Analysis of Venture Funding, KPMG Enterprise. Data provided by PitchBook, January 12, 2017.
Early-stages have declined the most

17#Q4VC© 2017 KPMG LLP, a Canadian limited liability partnership and a member firm of the KPMG network of independent
member firms affiliated with KPMG International Cooperative (“KPMG International”), a Swiss entity. All rights reserved.
Global financing trends to VC-backed
companies by sector
2010 – 2016, VC invested ($B)
Global financing trends to VC-backed
companies by sector
2010 – 2016, Number of closed deals
The outsized proportion of VC investment attracted by software companies in 2016 is testament to the
gradual pervasion of software into multiple industries with outliers, such as Uber, raking in billions of dollars
as they disrupt traditional sectors. It’s also notable that even as overall VC invested climbed over the past
few years, pharma and biotech companies still drew in plenty of VC, attributable to the strong demand for
more innovative therapies.
0%
10%
20%
30%
40%
50%
60%
70%
80%
90%
100%
201
0
201
1
201
2
201
3
201
4
201
5
201
6
CommercialServices
ConsumerGoods &
Recreation
Energy
HC Devices &Supplies
HC Services &Systems
IT Hardware
Media
Other
Pharma &Biotech
Software 0%
10%
20%
30%
40%
50%
60%
70%
80%
90%
100%
201
0
201
1
201
2
201
3
201
4
201
5
201
6
Source: Venture Pulse, Q4’16, Global Analysis of Venture Funding, KPMG Enterprise. Data provided by PitchBook, January 12, 2017.
Software remains predominant

18#Q4VC© 2017 KPMG LLP, a Canadian limited liability partnership and a member firm of the KPMG network of independent
member firms affiliated with KPMG International Cooperative (“KPMG International”), a Swiss entity. All rights reserved.
0
2,000
4,000
6,000
8,000
10,000
12,000
2006 2007 2008 2009 2010 2011 2012 2013 2014 2015 2016
Americas Europe Asia
Global financing trends to VC-backed companies by continent
2006 – 2016, VC invested ($B)
Global financing trends to VC-backed companies by continent
2006 – 2016, number of closed deals
Source: Venture Pulse, Q4’16, Global Analysis of Venture Funding, KPMG Enterprise. Data provided by PitchBook, January 12, 2017.
VC investment in Asia stays high
$0
$10
$20
$30
$40
$50
$60
$70
$80
$90
2006 2007 2008 2009 2010 2011 2012 2013 2014 2015 2016
Americas Europe Asia

19#Q4VC© 2017 KPMG LLP, a Canadian limited liability partnership and a member firm of the KPMG network of independent
member firms affiliated with KPMG International Cooperative (“KPMG International”), a Swiss entity. All rights reserved.
Corporate VC participation in global venture deals
2010 – 2016
* The capital invested is the sum of all the round values in which corporate venture capital investors participated, not the amount that corporate
venture capital arms invested themselves. Likewise, the percentage of deals is calculated by taking the number of rounds in which corporate venture
firms participated over total deals.
As venture capital becomes more institutionalized and corporations hunt for innovation via acquisitions,
participating in the backing of fledgling startups to supplement R&D or to position for ownership down the
road is only becoming more popular, with total VC invested driven by outlier financings of large, late-stage
businesses in which corporate venture arms took part. Investing purely for financial returns is also a
significant driver*.
$12 $17 $18 $20 $38 $60 $65
11%
12%
11% 12% 12%
13%
15%
2010 2011 2012 2013 2014 2015 2016
Capital invested in associated deals ($B) % of total deal count
Source: Venture Pulse, Q4’16, Global Analysis of Venture Funding, KPMG Enterprise. Data provided by PitchBook, January 12, 2017.
Corporates dial-up their participation

20#Q4VC© 2017 KPMG LLP, a Canadian limited liability partnership and a member firm of the KPMG network of independent
member firms affiliated with KPMG International Cooperative (“KPMG International”), a Swiss entity. All rights reserved.
Global first-time venture financings of companies
2010 – 2016
One of the primary themes in venture analysis over the past year has been the gradual increase in investor
caution as a driver of declining deal counts. The drop-off in first-time financings of fledgling startups, a year-
over-year decrease of nearly 33% in number between 2015 and 2016, testifies to a shift in investor sentiment
as capital is hardly in short supply and the pipeline of companies looking for funding has not diminished
significantly.
$9 $11 $13 $11 $14 $18 $13
3,781
5,116
6,024
6,756
7,137
6,020
4,070
2010 2011 2012 2013 2014 2015 2016
Capital invested ($B) Deal count
Source: Venture Pulse, Q4’16, Global Analysis of Venture Funding, KPMG Enterprise. Data provided by PitchBook, January 12, 2017.
Falling first-time financings point to investor caution on the upswing

21#Q4VC© 2017 KPMG LLP, a Canadian limited liability partnership and a member firm of the KPMG network of independent
member firms affiliated with KPMG International Cooperative (“KPMG International”), a Swiss entity. All rights reserved.
Global unicorn rounds
2014 – 2016
* PitchBook defines a unicorn venture financing as a VC round that generates a post-money valuation of $1 billion or more.
The ‘unicorn’ phenomenon, in which a private company received a post-money venture valuation of
$1 billion or more, peaked in 2015 and has since seen a considerable decline in frequency. Just 6 of such
financings occurred in Q4’16, the lowest quarterly tally since 2013, when the term was coined. Venture
investors, both traditional and non-traditional are increasingly wary of such expensive financings,
particularly given the current liquidity climate*.
Source: Venture Pulse, Q4’16, Global Analysis of Venture Funding, KPMG Enterprise. Data provided by PitchBook, January 12, 2017.
Financings of unicorns diminished considerably in the last half of 2016
0
5
10
15
20
25
$0
$1
$2
$3
$4
$5
$6
$7
$8
$9
$10
1Q 2Q 3Q 4Q 1Q 2Q 3Q 4Q 1Q 2Q 3Q 4Q
2014 2015 2016
Capital invested ($B) # of deals closed

Brian HughesCo-Leader, KPMG Enterprise Innovative
Startups Network and National Co-Lead
Partner, KPMG Venture Capital Practice,
KPMG in the US
2016 brought a dose of reality back to
the VC market. Investors seem to
have recognized a big disconnect
between the valuations that occurred
in 2015 and what they should have
been. Funding shifted and slowed as
investors became cautious,
re-evaluated their portfolios and
focused investments on the best bets.
“
“
22#Q4VC© 2017 KPMG LLP, a Canadian limited liability partnership and a member firm of the KPMG network of independent
member firms affiliated with KPMG International Cooperative (“KPMG International”), a Swiss entity. All rights reserved.

23#Q4VC© 2017 KPMG LLP, a Canadian limited liability partnership and a member firm of the KPMG network of independent
member firms affiliated with KPMG International Cooperative (“KPMG International”), a Swiss entity. All rights reserved.
Global SaaS investment activity
2010 – 2016
The declining number of SaaS venture rounds is more testament to consolidation within the space
beginning to occur and the relative overheating of valuations within the sector than anything else. Relative to
Q4’15, the final quarter of 2016 saw its tally of completed financings fall by 33%. With outliers in SaaS M&A
such as Qlik Technologies, Demandware and more, certain segments are already seeing considerable
competition from sizable players as they acquire in order to bulk up their offerings.
0
200
400
600
800
1,000
1,200
$0
$2
$4
$6
$8
$10
$12
1Q 2Q 3Q 4Q 1Q 2Q 3Q 4Q 1Q 2Q 3Q 4Q 1Q 2Q 3Q 4Q 1Q 2Q 3Q 4Q 1Q 2Q 3Q 4Q 1Q 2Q 3Q 4Q
2010 2011 2012 2013 2014 2015 2016
Capital invested ($B) # of deals closed
Source: Venture Pulse, Q4’16, Global Analysis of Venture Funding, KPMG Enterprise. Data provided by PitchBook, January 12, 2017.
Consolidation is occurring in SaaS

24#Q4VC© 2017 KPMG LLP, a Canadian limited liability partnership and a member firm of the KPMG network of independent
member firms affiliated with KPMG International Cooperative (“KPMG International”), a Swiss entity. All rights reserved.
Global healthtech investment activity
2012 – 2016
Healthtech startups enjoyed a considerable uptick in venture investors’ interest amid the general VC boom
over the past few years. With aging demographics across multiple developed countries, a strong need for
advanced analytics (as government healthcare systems moved to empower healthcare consumers further)
and general costs rising, many firms are looking to back companies that can expedite back-end logistics,
provide easy-to-use digital health offerings and more. Although Q3 and Q4’16 saw declining totals of VC
invested to $580 million and $540 million apiece, activity remains high.
0
20
40
60
80
100
120
140
160
$0.0
$0.2
$0.4
$0.6
$0.8
$1.0
$1.2
$1.4
1Q 2Q 3Q 4Q 1Q 2Q 3Q 4Q 1Q 2Q 3Q 4Q 1Q 2Q 3Q 4Q 1Q 2Q 3Q 4Q
2012 2013 2014 2015 2016
Capital invested ($B) # of deals closed
Source: Venture Pulse, Q4’16, Global Analysis of Venture Funding, KPMG Enterprise. Data provided by PitchBook, January 12, 2017.
Interest in healthtech remains high

25#Q4VC© 2017 KPMG LLP, a Canadian limited liability partnership and a member firm of the KPMG network of independent
member firms affiliated with KPMG International Cooperative (“KPMG International”), a Swiss entity. All rights reserved.
Global cybersecurity investment activity
2012 – 2016
0
20
40
60
80
100
120
$0.0
$0.2
$0.4
$0.6
$0.8
$1.0
$1.2
$1.4
1Q 2Q 3Q 4Q 1Q 2Q 3Q 4Q 1Q 2Q 3Q 4Q 1Q 2Q 3Q 4Q 1Q 2Q 3Q 4Q
2012 2013 2014 2015 2016
Capital invested ($B) # of deals closed
Source: Venture Pulse, Q4’16, Global Analysis of Venture Funding, KPMG Enterprise. Data provided by PitchBook, January 12, 2017.
Cyber sees dramatic VC decline
With such publicity throughout the entirety of 2016, ranging from widely publicized breaches of millions of
customer accounts at Yahoo to allegations of spamming ‘fake news’ during election cycles, cybersecurity
looks set to remain a hot topic of discussion and investor interest in the coming year, as more enterprises
look to secure their offerings. The final quarter of 2016 may have experienced a sudden drop-off in both
activity and dollars invested but Q3’16 saw no less than $1.2 billion invested across 84 financings of
cybersecurity-focused startups worldwide.

26#Q4VC© 2017 KPMG LLP, a Canadian limited liability partnership and a member firm of the KPMG network of independent
member firms affiliated with KPMG International Cooperative (“KPMG International”), a Swiss entity. All rights reserved.
Global venture-backed exit activity
2010 – 2016
One of the more troubling signs for venture firms has been the consistent decline in total exits over the past
2 years, although overall exit value has remained fairly robust. This decline could be attributable to
cyclicality and, thus, may resolve in due time. However, VC investors are more closely assessing targets’
paths to profitability and, consequently prospective liquidity.
$44 $53 $63 $62 $114 $80 $69
1,1421,202
1,358
1,482
1,810
1,733
1,283
2010 2011 2012 2013 2014 2015 2016
Exit value ($B) Exit count
Source: Venture Pulse, Q4’16, Global Analysis of Venture Funding, KPMG Enterprise. Data provided by PitchBook, January 12, 2017.
Exits have slid steadily for some time

27#Q4VC© 2017 KPMG LLP, a Canadian limited liability partnership and a member firm of the KPMG network of independent
member firms affiliated with KPMG International Cooperative (“KPMG International”), a Swiss entity. All rights reserved.
Global venture-backed exit activity
(#) by type
2010 – 2016
Global venture-backed exit activity
($B) by type
2010 – 2016
The M&A boom over the past few years has been the primary driver of venture-backed exits, with IPOs
decreasing in relative importance as an exit route since a peak in 2014. As of yet, whether or not the IPO
market will reopen in 2017 remains to be seen.
0
200
400
600
800
1,000
1,200
1,400
1,600
1,800
2,000
2010 2011 2012 2013 2014 2015 2016
Strategic Acquisition
Buyout
IPO
$0.0
$20.0
$40.0
$60.0
$80.0
$100.0
$120.0
$140.0
2010 2011 2012 2013 2014 2015 2016
Strategic Acquisition Buyout IPO
Source: Venture Pulse, Q4’16, Global Analysis of Venture Funding, KPMG Enterprise. Data provided by PitchBook, January 12, 2017.
The M&A boom was a primary driver

28#Q4VC© 2017 KPMG LLP, a Canadian limited liability partnership and a member firm of the KPMG network of independent
member firms affiliated with KPMG International Cooperative (“KPMG International”), a Swiss entity. All rights reserved.
Global venture fundraising
2010 – 2016
Venture firms have been able to raise more and more capital, even as the total number of funds has
declined over the past few years. This trend illustrates ongoing interest in exposure to the venture asset
class, as well as the ability of fund managers who reaped significant success in the venture boom, to raise
even larger follow-on vehicles.
$37 $45 $40 $31 $49 $55 $64
380
412 413
361
412
395
372
2010 2011 2012 2013 2014 2015 2016
Capital raised ($B) Fund count
Source: Venture Pulse, Q4’16, Global Analysis of Venture Funding, KPMG Enterprise. Data provided by PitchBook, January 12, 2017.
Larger firms attracting more and more VC

29#Q4VC© 2017 KPMG LLP, a Canadian limited liability partnership and a member firm of the KPMG network of independent
member firms affiliated with KPMG International Cooperative (“KPMG International”), a Swiss entity. All rights reserved.
Global venture fundraising (#) by size
2010 – 2016
Proportionally, more and more firms are able to raise larger funds, borne on the back of past success in the
upswing of the venture cycle in 2014 and 2015. No less than $13.7 billion was raised across 9 venture
vehicles sized at $1 billion or more in 2016.
Global first-time vs. follow-on venture
funds (#)
2010 – 2016
0%
10%
20%
30%
40%
50%
60%
70%
80%
90%
100%
201
0
201
1
201
2
201
3
201
4
201
5
201
6
Under $50M $50M-$100M $100M-$250M
$250M-$500M $500M-$1B $1B+
0%
10%
20%
30%
40%
50%
60%
70%
80%
90%
100%
201
0
201
1
201
2
201
3
201
4
201
5
201
6
First-time Follow-on
Source: Venture Pulse, Q4’16, Global Analysis of Venture Funding, KPMG Enterprise. Data provided by PitchBook, January 12, 2017.
Concentration of VC at the upper end leads to fewer first-time funds

30#Q4VC© 2017 KPMG LLP, a Canadian limited liability partnership and a member firm of the KPMG network of independent
member firms affiliated with KPMG International Cooperative (“KPMG International”), a Swiss entity. All rights reserved.
Top 10 global financings in Q4 2016
Yixia – $500M, Beijing
Video platform
Series E
51credit – $394M, Beijing
Online credit marketplace
Series C
Innovent Biologics – $260M, Suzhou
Pharma & biotech
Series D
BlueRock Therapeutics – $225M, Toronto
Pharma & biotech
Series A
Opendoor – $210M, San Francisco
Residential real estate platform
Series D
7
8
6
9
105
4
3
2
1 Yiguo– $200M, Shanghai
Food products & e-commerce
Series C
Xueleyen – $200M, Hsinchu
Online education platform
Series C
Payoneer – $180M, New York
Online payments distribution
Series E
Sigfox – $162.1M, Labege
Cellular network
Series E
Yunmanman – $160M, Shanghai
Mobile logistics
Series D
Source: Venture Pulse, Q4’16, Global Analysis of Venture Funding, KPMG Enterprise. Data provided by PitchBook, January 12, 2017.
The largest Q4 deals clustered in China
5
10
763
8
49
21

In Q4’16 VC-backed
companies in the
Americas raised
$13.7Bacross
1,832 deals

32#Q4VC© 2017 KPMG LLP, a Canadian limited liability partnership and a member firm of the KPMG network of independent
member firms affiliated with KPMG International Cooperative (“KPMG International”), a Swiss entity. All rights reserved.
2016 was a challenging year for VC investment in the Americas. After two particularly strong years, the
Americas saw a substantial decline in total deal count from 11,208 to only 8,642, the lowest level seen
since roughly 2012. Deal value also decreased from 2015’s record high of $82 billion to $72 billion, a
total more in line with 2014 levels.
The decline in activity is likely a response to overheated valuations and larger financing sizes seen in
prior years, especially within the US, resulting in a cyclical downturn in activity. Market uncertainties,
including the US election, also motivated increased investor caution. New startups in particular
experienced a downturn, though total investment shows that VC interest in new companies remains high.
Rising Activity beyond the US
While the US accounts for the bulk of activity in the Americas, which is discussed in greater detail in the
US section of this report, Canada and Latin America experienced strong levels of activity. VC activity in
Canada rose to $2.1 billion in 2016, driven by a bevy of mega-financings, including the largest Q4’16
funding round in the Americas. Foreign VC interest in Latin America continued to increase, with startups
in Mexico, Brazil and Colombia attracting debut investments from major US venture firms.
Median financing sizes indicative of market normalization
Median deal size remained strong across the Americas in 2016, ranging from $28.7 million for Series D+
to $1.5 million for seed deals. The strength of median deal sizes across series indicates that the
downturn in VC numbers is more reflective of normalization following a period of overheating rather than
a slump in the industry. Given this context, it is relevant to note that median deal size for latest stage
funding has decreased by only $1.3 million compared to 2015’s peak, and still nearly doubles 2013’s
median.
Corporate investment remains strong
Corporate VC involvement in the Americas increased relative to total VC activity, reaching a new high in
2016 despite a small slide in total round counts. While corporate venture investment has always been a
factor in the market, corporate VC activity in the Americas has risen following the financial crisis. The
rapid pace of technological innovation is driving corporations to shore up their offerings, and financing
more mature companies is an attractive way to supplement internal R&D, especially within the
pharmaceutical and biotech sectors.
Canada bucks downturn trend in VC market
In 2016, Canada bucked the downward VC investment trend experienced by many of its Americas
counterparts, driven significantly by late Q4’16 deals. Despite quarterly fluctuations in activity, the
Canadian VC market is clearly maturing and becoming an appealing area for US VCs able to invest
beyond the border.
The country saw numerous large investments in 2016, including the Americas’ biggest funding round
during the fourth quarter: a Series A raise of $225 million by Toronto-based BlueRock Therapies backed
by Bayer and Versant Ventures. This deal, in addition to an undisclosed funding round by Hubba Inc. led
by Goldman Sachs Group Inc., illustrate how the country is gaining attention on investment radar of
international VC investors and corporates. During Q4’16, the Montreal-based Element AI incubator also
received a significant seed investment from Microsoft Ventures – support that should go a long way
toward growing the city’s burgeoning artificial intelligence tech hub.
Declining deal count tempered by rising activity in Canada and Latin America

33#Q4VC© 2017 KPMG LLP, a Canadian limited liability partnership and a member firm of the KPMG network of independent
member firms affiliated with KPMG International Cooperative (“KPMG International”), a Swiss entity. All rights reserved.
US investors expanding into Latin America
Continuing a trend seen over the past two years, US VC firms are continuing to show their interest in
Latin America startups¹. Multiple big players made their first investments in Latin America in 2016:
Sequoia Capital, Founders Fund and QED made their debut Brazilian investments with fintech firm
Nubank; and Andreessen Horowitz chose to back Rappi, a Colombian grocery delivery service. QED
also backed Mexican grocery service Cornershop as part of their $6.7 million in Series A funding.
Latin America also drew foreign participation in the form of new accelerators. In September 2016
Chinese giant Baidu launched a tech startup program in Brazil in partnership with the Latin American
Angels Society (LAAS), offering mentoring and support as a method of identifying high-potential scalable
ventures.
Brazil corporates drive growth of local tech ecosystem
During 2016, Brazil gained more attention for the growth of its startup ecosystems, particularly in Sao
Paulo. The evolution of these ecosystems is being driven primarily by corporates, including big banks
and telecoms. The recent devaluation of the Real against the American dollar has also made the country
more attractive to foreign based VC investors. Companies that provide logistics services or ecommerce
products that can improve or support logistics are seen as particularly attractive. While a number of
Brazil-based startups have been successful at raising funds, there has been growing pressure from
investors for companies to become more efficient with funding and to move more quickly to a point of
profitability².
Governments investing in entrepreneurship
As Latin American startups attract more international attention and VC funding, governments are looking
for ways to help encourage startup creation, especially within the technology sector. In Argentina, newly
elected President Mauricio Macri introduced legislative changes that will help facilitate the creation of
new companies and encourage entrepreneurship. Similar efforts are also underway in Brazil and
Mexico³.
Declining deal count tempered by rising activity in Canada and Latin America, cont’d
1. http://venturebeat.com/2016/10/09/vcs-should-give-latin-america-another-look/
2. https://techcrunch.com/2016/09/17/brazils-tech-sector-bright-spots-beckon-as-it-begins-to-emerge-from-long-economic-crisis/
3. https://techcrunch.com/2016/09/28/why-have-some-of-silicon-valleys-top-investors-started-investing-in-latin-america/

34#Q4VC© 2017 KPMG LLP, a Canadian limited liability partnership and a member firm of the KPMG network of independent
member firms affiliated with KPMG International Cooperative (“KPMG International”), a Swiss entity. All rights reserved.
Venture financing trends in the Americas
2010 – 2016
In some respects, a downturn was almost inevitable after 2 strong years of venture activity within the
Americas, as a cyclical boom in investing activity led to overheated valuations and consequently larger
financing sizes, resulting in some investors beginning to shy away eventually. The slow rate of the downturn
is evident in the massive sums still invested throughout 2016, even as activity declined significantly,
suggesting that investors are still willing to ply worthwhile companies with plenty of cash if they can meet
more stringent benchmarks of quality.
Source: Venture Pulse, Q4’16, Global Analysis of Venture Funding, KPMG Enterprise. Data provided by PitchBook, January 12, 2017.
$32 $46 $43 $47 $72 $82 $72
5,728
7,219
8,673
10,187
11,340 11,208
8,642
2010 2011 2012 2013 2014 2015 2016
Capital invested ($B) Deal count
A cyclical downturn after 2 strong years

35#Q4VC© 2017 KPMG LLP, a Canadian limited liability partnership and a member firm of the KPMG network of independent
member firms affiliated with KPMG International Cooperative (“KPMG International”), a Swiss entity. All rights reserved.
Quarterly venture financing trends in the Americas
2010 – 2016
Source: Venture Pulse, Q4’16, Global Analysis of Venture Funding, KPMG Enterprise. Data provided by PitchBook, January 12, 2017.
0
500
1,000
1,500
2,000
2,500
3,000
3,500
$0
$5
$10
$15
$20
$25
1Q 2Q 3Q 4Q 1Q 2Q 3Q 4Q 1Q 2Q 3Q 4Q 1Q 2Q 3Q 4Q 1Q 2Q 3Q 4Q 1Q 2Q 3Q 4Q 1Q 2Q 3Q 4Q
2010 2011 2012 2013 2014 2015 2016
Capital invested ($B) # of deals closed Angel/Seed Early VC Later VC
Analyzing activity by stage, much of the decline has been centered on the angel & seed-stage,
understandably. The relative resilience of activity at even the early-stage speaks to the nature of venture
investors’ caution in the current climate, especially in the absence of significant shocks to either the
economy or financial markets that would more immediately impact the venture arena. VCs are definitely
more wary yet, among relatively less risky playing fields, such as the late-stage, they are still cutting checks,
albeit at a more sedated pace. The decline has been noteworthy, however, with late-stage venture activity in
the Americas dropping by 6.8% year-over-year from Q4’15 to Q4’16.
Until Q4’16, VC invested stayed robust

36#Q4VC© 2017 KPMG LLP, a Canadian limited liability partnership and a member firm of the KPMG network of independent
member firms affiliated with KPMG International Cooperative (“KPMG International”), a Swiss entity. All rights reserved.
Median deal size ($M) by stage in the Americas
2010 – 2016
Source: Venture Pulse, Q4’16, Global Analysis of Venture Funding, KPMG Enterprise. Data provided by PitchBook, January 12, 2017.
Up, flat or down rounds in Americas
2010 – 2016
$0.5 $0.5 $0.5 $0.5 $0.6 $0.7$1.0
$2.6 $2.7 $2.6$3.0
$3.3
$4.2
$5.0
$6.0
$7.5 $7.5
$6.4
$8.2
$10.0 $10.0
2010 2011 2012 2013 2014 2015 2016
Angel/seed Early stage VC Later stage VC
0%
10%
20%
30%
40%
50%
60%
70%
80%
90%
100%
2010 2011 2012 2013 2014 2015 2016
Up
Flat
Down
Plenty of VC is still being invested

37#Q4VC© 2017 KPMG LLP, a Canadian limited liability partnership and a member firm of the KPMG network of independent
member firms affiliated with KPMG International Cooperative (“KPMG International”), a Swiss entity. All rights reserved.
Median deal size ($M) by series in the Americas
2010 – 2016
Source: Venture Pulse, Q4’16, Global Analysis of Venture Funding, KPMG Enterprise. Data provided by PitchBook, January 12, 2017.
$0.4 $0.5 $0.5 $0.5 $0.6$1.0
$1.5
$2.4 $2.5 $2.8$3.2
$3.5
$4.5$5.0
$7.0 $7.1 $7.0 $7.0
$10.0
$11.6 $11.7
2010 2011 2012 2013 2014 2015 2016
Seed Series A Series B
$10.0
$12.3 $12.0 $12.0
$15.0
$18.0
$21.1
$12.4
$15.0$16.0 $16.0
$25.0
$30.0$28.7
2010 2011 2012 2013 2014 2015 2016
Series C Series D+
The continued strength of median financing sizes across nearly all series is further proof that the venture
industry in the Americas isn’t experiencing a slump so much as a return to normalcy. In a typical response
to overheating, activity is cooling down or, as median round sizes above suggest, plateauing. It’s still worth
noting that the latest stage (Series D or later) has only slid by $1.3 million between 2015 and 2016 and is
still close to twice what was recorded in 2013.
Round sizes remain elevated

38#Q4VC© 2017 KPMG LLP, a Canadian limited liability partnership and a member firm of the KPMG network of independent
member firms affiliated with KPMG International Cooperative (“KPMG International”), a Swiss entity. All rights reserved.
Median pre-money valuation ($M) by series in the Americas
2010 – 2016
Source: Venture Pulse, Q4’16, Global Analysis of Venture Funding, KPMG Enterprise. Data provided by PitchBook, January 12, 2017.
$3.2 $4.0 $3.9 $4.4 $4.8 $5.2 $5.9$6.5 $7.1 $7.9$8.9
$11.5$13.1
$15.0
$19.3$20.8 $20.8
$25.3
$31.8
$38.6 $38.7
2010 2011 2012 2013 2014 2015 2016
Seed Series A Series B
$39.6$47.6 $50.0
$55.2 $58.5
$71.9$80.0
$66
$83$92
$97
$136
$173
$144
2010 2011 2012 2013 2014 2015 2016
Series C Series D+
Interestingly, the median pre-money valuation at the latest series exhibits the most significant signs of
cooling within the Americas’ venture ecosystem. It makes sense that in the Americas, the epicenter of the
venture industry, investors would respond more quickly to the skyrocketing valuations observed between
2013 and 2015. Hence, the decline by nearly 17% in size between 2015 and last year for Series D and later
valuations.
The latest stage finally declined

39#Q4VC© 2017 KPMG LLP, a Canadian limited liability partnership and a member firm of the KPMG network of independent
member firms affiliated with KPMG International Cooperative (“KPMG International”), a Swiss entity. All rights reserved.
Annual deal share by series in the Americas
2010 – 2016, number of closed deals
Source: Venture Pulse, Q4’16, Global Analysis of Venture Funding, KPMG Enterprise. Data provided by PitchBook, January 12, 2017.
Deal share by series in the Americas
2010 – 2016, VC invested ($B)
0
1,000
2,000
3,000
4,000
5,000
6,000
7,000
8,000
9,000
10,000
2010 2011 2012 2013 2014 2015 2016
Series D+
Series C
Series B
Series A
Angel/seed
$0.0
$10.0
$20.0
$30.0
$40.0
$50.0
$60.0
$70.0
$80.0
2010 2011 2012 2013 2014 2015 2016
Series D+
Series C
Series B
Series A
Angel/seed
Early-stage activity has dropped the most

40#Q4VC© 2017 KPMG LLP, a Canadian limited liability partnership and a member firm of the KPMG network of independent
member firms affiliated with KPMG International Cooperative (“KPMG International”), a Swiss entity. All rights reserved.
Financing trends to VC-backed
companies by sector in the Americas
2010 – 2016, VC invested ($B)
Source: Venture Pulse, Q4’16, Global Analysis of Venture Funding, KPMG Enterprise. Data provided by PitchBook, January 12, 2017.
Financing trends to VC-backed
companies by sector in the Americas
2010 – 2016, number of closed deals
0%
10%
20%
30%
40%
50%
60%
70%
80%
90%
100%
201
0
201
1
201
2
201
3
201
4
201
5
201
6
CommercialServices
ConsumerGoods &
Recreation
Energy
HC Devices &Supplies
HC Services &Systems
IT Hardware
Media
Other
Pharma &Biotech
Software
0%
10%
20%
30%
40%
50%
60%
70%
80%
90%
100%
201
0
201
1
201
2
201
3
201
4
201
5
201
6
Particularly as the software industry matured into different business models such as SaaS and the costs of
computing plummeted over the past decade and a half, increased venture financing within software was
bound to happen. What’s more interesting for the Americas region, in particular, is how much more
proliferation in terms of venture activity has occurred into sectors beyond the traditional VC realms of
healthcare, software and consumer. A quarter of 2016 deals have been in non-traditional arenas that blur
lines between sectors, such as Zymergen’s bio-engineering of molecules for a variety of applications.
VC diversifies further

41#Q4VC© 2017 KPMG LLP, a Canadian limited liability partnership and a member firm of the KPMG network of independent
member firms affiliated with KPMG International Cooperative (“KPMG International”), a Swiss entity. All rights reserved.
Financing trends in Canada
2010 – 2016
Source: Venture Pulse, Q4’16, Global Analysis of Venture Funding, KPMG Enterprise. Data provided by PitchBook, January 12, 2017.
$0.9 $1.3 $1.6 $1.5 $1.8 $1.8 $2.1
242
323
405
525514 520
356
2010 2011 2012 2013 2014 2015 2016
Capital invested ($B) Deal count
Even as 2016 registered a decline exceeding 30% in completed venture financings of Canada-based
companies, the total of VC invested hit a 7 year high of $2.1 billion, a 16.5% increase from the level in 2015.
Similarly to other regions, that sum was driven by a bevy of mega-financings.
Canadian VC activity drops but VC invested jumps by 16.5%

Sunil MistryPartner, KPMG Enterprise,
Technology, Media and
Telecommunications
KPMG in Canada
If the new US administration moves
quickly on the promise to lower
corporate tax rates and open up trade
deals, it could have a huge impact –
not only on the Americas, but on
jurisdictions around the world. Some
investors may be cautious during the
first quarter of 2017 as they wait and
see what happens.
“
“
42#Q4VC© 2017 KPMG LLP, a Canadian limited liability partnership and a member firm of the KPMG network of independent
member firms affiliated with KPMG International Cooperative (“KPMG International”), a Swiss entity. All rights reserved.

43#Q4VC© 2017 KPMG LLP, a Canadian limited liability partnership and a member firm of the KPMG network of independent
member firms affiliated with KPMG International Cooperative (“KPMG International”), a Swiss entity. All rights reserved.
Venture financing trends in Brazil
2010 – 2016
$0.1 $0.1 $0.6 $0.5 $0.7 $0.8 $0.4
30
56
117
126
113
99
69
2010 2011 2012 2013 2014 2015 2016
Capital invested ($B) Deal count
Source: Venture Pulse, Q4’16, Global Analysis of Venture Funding, KPMG Enterprise. Data provided by PitchBook, January 12, 2017.
After a blockbuster 2015 in terms of VC invested, a pullback in Brazil

Olivier Trave BourleyPartner,
KPMG in Brazil
Brazil has seen significant growth
around the development of ecosystems
to promote startups. While funding
exists for early stage startups, VC
funds are becoming aggressive with
later stage companies – questioning
budgets and requiring them to become
more cost efficient in order to raise
additional financing.
“
“
44#Q4VC© 2017 KPMG LLP, a Canadian limited liability partnership and a member firm of the KPMG network of independent
member firms affiliated with KPMG International Cooperative (“KPMG International”), a Swiss entity. All rights reserved.

45#Q4VC© 2017 KPMG LLP, a Canadian limited liability partnership and a member firm of the KPMG network of independent
member firms affiliated with KPMG International Cooperative (“KPMG International”), a Swiss entity. All rights reserved.
Venture financing trends in Mexico
2010 – 2016
$48 $65 $17 $149 $173 $94 $170
11
25
31
62
54
60
45
2010 2011 2012 2013 2014 2015 2016
Capital invested ($M) Deal count
Source: Venture Pulse, Q4’16, Global Analysis of Venture Funding, KPMG Enterprise. Data provided by PitchBook, January 12, 2017.
Mexico’s venture scene enjoyed a resurgence in VC invested last year

46#Q4VC© 2017 KPMG LLP, a Canadian limited liability partnership and a member firm of the KPMG network of independent
member firms affiliated with KPMG International Cooperative (“KPMG International”), a Swiss entity. All rights reserved.
10
7
6
38
549
2 1
BlueRock Therapeutics – $225M, Toronto
Biotech
Series A
Opendoor – $210M, San Francisco
Residential real-estate platform
Series D
Payoneer – $180M, New York
Online payments & distribution
Series E
Stripe – $150M, San Francisco
Payments platform
Series D
Postmates – $141M, San Francisco
Delivery services
Series E
7
8
6
9
105
4
3
2
1 OfferUp – $130M, Bellevue
Online shopping platform
Series C1
Zymergen – $130M, Emeryville
Biotech
Series B
Memebox – $126M, San Francisco
Beauty products
Series C
Unity Biotechnology – $116M,
San Francisco
Biotech
Series B
JetSmarter – $105M, Fort Lauderdale
Private air travel
Series C
Top 10 Americas financings in Q4 2016
Source: Venture Pulse, Q4’16, Global Analysis of Venture Funding, KPMG Enterprise. Data provided by PitchBook, January 12, 2017.
Toronto takes the top spot in Q4

In Q4’16 US VC-
backed companies
raised
$12.7Bacross
1,744 deals

48#Q4VC© 2017 KPMG LLP, a Canadian limited liability partnership and a member firm of the KPMG network of independent
member firms affiliated with KPMG International Cooperative (“KPMG International”), a Swiss entity. All rights reserved.
After 2 strong years, both VC investment and the number of deals in the US declined substantially in
2016. Total VC investment slid to $69.1 billion from 2015’s peak of $79.3 billion, while total activity
declined by more than 20 percent. The cooling of the US’s venture scene is likely a result of numerous
issues that plagued the market for much of the year, instilling caution in many VC investors. The
completion of the US election in November brought an end to one major uncertainty, while the Federal
Reserve’s December interest rate increase demonstrated its renewed optimism for the US economy as a
whole. These signs could bode well for the US heading into 2017.
While VC activity by deal stage declined across the board during Q4’16, higher risk seed-stage deal
activity declined the most as investors focused on their existing portfolios and companies with proven
business plans. Investors are expected to remain cautious headed into 2017, taking more time to
evaluate investment options and conduct due diligence. Companies will likely continue to require a
strong business plan and path to profitability in order to attract investment for the near future.
Unicorns and IPOs almost non-existent in 2016
Both unicorn births and IPOs were in short supply during 2016. The 2016 IPO market for VC-backed
companies in particular is said to have been the worst since 2013. Poor IPO results earlier in the year led
to significant market skepticism of potential valuations. There are indications, however, that the tide is
turning for the IPO market, particularly in the US. The success of Twilio has spurred some optimism that
the IPO market will open up again in 2017.
Already Snap, the parent company of Snapchat, has filed for an IPO which is expected toward the end of
Q1’17. Other companies are also predicted to follow suit. With a number of unicorn companies in the
group of rumored IPOs, any early successes could be a boost for the remainder of the year. A
successful IPO market would help renew the VC market at the same time.
Riskier seed-stage businesses struggle to find backing
The US election prompted a significant amount of economic uncertainty throughout 2016. While the
election was resolved midway through Q4’16, the pending change in administration may continue to hold
investors back heading into Q1’17 as the change could spark both new opportunities and new risks for
VC investors. While the expected lessening of regulations and corporate tax rates could have a positive
impact on the VC market, other trade-focused initiatives could cause consternation. Some investors are
likely to take a ‘wait and see’ approach to making any major changes to their investments until after the
new president has taken office.
Looking ahead: Healthcare, AI, IoT and Cloud remain big bets
The outlook for the VC market in the Americas is optimistic for 2017. Should the IPO market open as
expected, there could be a positive resonance across the VC market. While the first quarter may begin
cautiously as investors wait and see whether the new Trump administration in the US moves quickly on
its promises to reduce regulation and lower corporate tax rates. The speed and extent of movement on
these fronts could significantly impact the appetite for VC investment and the overall exit market.
Heading into the next year, a number of sectors are expected to remain particularly attractive in the
Americas, including healthcare and biotech, artificial intelligence, the Internet of Things and cloud SaaS.
While some of these sectors have seen a pullback in 2016, each is expected to rebound now that market
uncertainties are stabilizing.
VC funding decline continues in US, rebound hopeful in 2017

49#Q4VC© 2017 KPMG LLP, a Canadian limited liability partnership and a member firm of the KPMG network of independent
member firms affiliated with KPMG International Cooperative (“KPMG International”), a Swiss entity. All rights reserved.
Venture financing trends in the US
2010 – 2016
After 2 years straight of lofty venture activity, the US finally saw its overheated venture scene begin to cool
down, with a decline of over 20% in total round counts. Total VC invested for the year came in at $69.1
billion, down from the peak of $79.3 billion observed in 2015 but on par with the $68.9 billion recorded in
2014. Given the decline in activity coupled with the robust sum of VC invested, it’s clear US venture
investors have pulled back cautiously yet there has been no crash.
$31 $44 $41 $45 $69 $79 $69
5,411
6,771
7,987
9,326
10,550 10,468
8,136
2010 2011 2012 2013 2014 2015 2016
Capital invested ($B) Deal count
Source: Venture Pulse, Q4’16, Global Analysis of Venture Funding, KPMG Enterprise. Data provided by PitchBook, January 12, 2017.
Activity declines by over 20% from 2015

50#Q4VC© 2017 KPMG LLP, a Canadian limited liability partnership and a member firm of the KPMG network of independent
member firms affiliated with KPMG International Cooperative (“KPMG International”), a Swiss entity. All rights reserved.
Quarterly financing trends in the US
2010 – 2016
Year-over-year quarterly comparisons illustrate the steady onset of the lull in the US venture industry.
Relative to the final quarter of 2015, US VC invested fell by nearly 25% in Q4’16, while the count of
completed financings slid by 26.6%. The sheer steadiness of the decline is suggestive of caution gradually
pervading the venture market, while still-robust quarterly totals of sums invested speak to VC firms with
ample supplies of dry powder still plying mature, late-stage companies with plenty of capital.
0
500
1,000
1,500
2,000
2,500
3,000
$0
$5
$10
$15
$20
$25
1Q 2Q 3Q 4Q 1Q 2Q 3Q 4Q 1Q 2Q 3Q 4Q 1Q 2Q 3Q 4Q 1Q 2Q 3Q 4Q 1Q 2Q 3Q 4Q 1Q 2Q 3Q 4Q
2010 2011 2012 2013 2014 2015 2016
Capital invested ($B) # of deals closed Angel/Seed Early VC Later VC
Source: Venture Pulse, Q4’16, Global Analysis of Venture Funding, KPMG Enterprise. Data provided by PitchBook, January 12, 2017.
Quarterly numbers illustrate a steep slide

51#Q4VC© 2017 KPMG LLP, a Canadian limited liability partnership and a member firm of the KPMG network of independent
member firms affiliated with KPMG International Cooperative (“KPMG International”), a Swiss entity. All rights reserved.
Median deal size ($M) by stage in the US
2010 – 2016
Up, flat or down rounds in the US
2010 – 2016
$0.5 $0.5 $0.5 $0.5 $0.6 $0.8 $1.0
$2.6 $2.7 $2.6$3.0
$3.3
$4.5
$5.3
$6.0
$7.9$7.5
$6.5
$8.4
$10.3 $10.0
2010 2011 2012 2013 2014 2015 2016
Angel/seed Early stage VC Later stage VC
0%
10%
20%
30%
40%
50%
60%
70%
80%
90%
100%
2010 2011 2012 2013 2014 2015 2016
Up
Flat
Down
A surer sign of VCs’ relatively resilient attitudes in the current climate is the proportion of up rounds that are
still occurring. Even amid the downturn in activity, nearly 75% of all financings were increases from previous
rounds.
Source: Venture Pulse, Q4’16, Global Analysis of Venture Funding, KPMG Enterprise. Data provided by PitchBook, January 12, 2017.
Nearly 75% of 2016 rounds were up

52#Q4VC© 2017 KPMG LLP, a Canadian limited liability partnership and a member firm of the KPMG network of independent
member firms affiliated with KPMG International Cooperative (“KPMG International”), a Swiss entity. All rights reserved.
Median deal size ($M) by series in the US
2010 – 2016
$0.5 $0.5 $0.5 $0.5 $0.7$1.0
$1.5
$2.5 $2.6 $2.8$3.2
$3.5
$4.5$5.1
$6.9 $7.1 $7.0 $7.0
$10.0
$11.6$12.0
2010 2011 2012 2013 2014 2015 2016
Seed Series A Series B
$10
$13 $12 $12
$15
$18
$22
$12
$15$16 $16
$25
$30 $30
2010 2011 2012 2013 2014 2015 2016
Series C Series D+
Across all series, the size of the median round has either plateaued or even grown between 2015 and 2016
in yet another sign of the elevated levels of dry powder venture firms have on hand, which is contributing to
still-lofty prices. In addition, competition for the best opportunities amid the general decline in activity is also
exerting upward pressure.
*Figures rounded in some cases for legibility.
Source: Venture Pulse, Q4’16, Global Analysis of Venture Funding, KPMG Enterprise. Data provided by PitchBook, January 12, 2017.
Financing sizes are still at multi-year highs

53#Q4VC© 2017 KPMG LLP, a Canadian limited liability partnership and a member firm of the KPMG network of independent
member firms affiliated with KPMG International Cooperative (“KPMG International”), a Swiss entity. All rights reserved.
Median pre-money valuation ($M) by series in the US
2010 – 2016
$3 $4$4 $5 $5 $5 $6$6 $7 $8
$9
$12$13
$15
$19$21 $21
$25
$32
$39 $39
2010 2011 2012 2013 2014 2015 2016
Seed Series A Series B
* Figures rounded in some cases for legibility.
$39
$48 $50$55
$60
$72$80
$66
$83$92
$97
$136
$171
$145
2010 2011 2012 2013 2014 2015 2016
Series C Series D+
The late-stage phenomenon of the past few years in the US appears to be finally cooling somewhat,
although a median pre-money valuation of $145 million at Series D or later is still 49% higher than what
was seen in 2013.
Source: Venture Pulse, Q4’16, Global Analysis of Venture Funding, KPMG Enterprise. Data provided by PitchBook, January 12, 2017.
Cooling at the latest stage

Brian HughesCo-Leader, KPMG Enterprise Innovative
Startups Network and National Co-Lead
Partner, KPMG Venture Capital Practice,
KPMG in the US
Investor protections are also likely to
remain a high priority, particularly for
late-stage deals where investors are
concerned about potential down
rounds.
“ “
54#Q4VC© 2017 KPMG LLP, a Canadian limited liability partnership and a member firm of the KPMG network of independent
member firms affiliated with KPMG International Cooperative (“KPMG International”), a Swiss entity. All rights reserved.

55#Q4VC© 2017 KPMG LLP, a Canadian limited liability partnership and a member firm of the KPMG network of independent
member firms affiliated with KPMG International Cooperative (“KPMG International”), a Swiss entity. All rights reserved.
Deal share by series in the US
2010 – 2016, number of closed deals
Deal share by series in the US
2010 – 2016, VC invested ($B)
0
1,000
2,000
3,000
4,000
5,000
6,000
7,000
8,000
9,000
10,000
201
0
201
1
201
2
201
3
201
4
201
5
201
6
Series D+
Series C
Series B
Series A
Angel/seed
$0.0
$10.0
$20.0
$30.0
$40.0
$50.0
$60.0
$70.0
$80.0
201
0
201
1
201
2
201
3
201
4
201
5
201
6
Series D+
Series C
Series B
Series A
Angel/seed
Source: Venture Pulse, Q4’16, Global Analysis of Venture Funding, KPMG Enterprise. Data provided by PitchBook, January 12, 2017.
US angel & seed financings slid the most

56#Q4VC© 2017 KPMG LLP, a Canadian limited liability partnership and a member firm of the KPMG network of independent
member firms affiliated with KPMG International Cooperative (“KPMG International”), a Swiss entity. All rights reserved.
Financing trends by sector in the US
2010 – 2016, VC invested ($B)
Financing trends by sector in the US
2010 – 2016, number of closed deals
0%
10%
20%
30%
40%
50%
60%
70%
80%
90%
100%
201
0
201
1
201
2
201
3
201
4
201
5
201
6
CommercialServices
ConsumerGoods &
Recreation
Energy
HC Devices& Supplies
HC Services& Systems
IT Hardware
Media
Other
Pharma &Biotech
Software
0%
10%
20%
30%
40%
50%
60%
70%
80%
90%
100%
201
0
201
1
201
2
201
3
201
4
201
5
201
6
Proportionally, software financings remained flat between 2015 and 2016 by count, although their relative
decrease was greater than that of other sectors, given its outsized percentage of total activity. What’s more
telling is the fact VC invested in software hit a decade high in 2016 of nearly $33 billion, topping even the
$31.2 billion recorded in 2015. That colossal sum was driven in large part by mega-rounds of established
disruptors.
Source: Venture Pulse, Q4’16, Global Analysis of Venture Funding, KPMG Enterprise. Data provided by PitchBook, January 12, 2017.
Software remains predominant

57#Q4VC© 2017 KPMG LLP, a Canadian limited liability partnership and a member firm of the KPMG network of independent
member firms affiliated with KPMG International Cooperative (“KPMG International”), a Swiss entity. All rights reserved.
Corporate participation in venture deals in the US
2010 – 2016
Corporate venture investing has been around for a long time but has enjoyed more of a renaissance of
sorts in the past few years, post-financial crisis. The surge in total capital invested across financings in
which corporate VC arms participated in the past 2 years is part and parcel of the overall overheating in
the US venture industry but the fact it stayed resolutely high in 2016 speaks to the more sustainable
rationales of corporate venture in general. Corporations are still striving to shore up their offerings, given
the rapid pace of innovation and more frequently getting involved in VC rounds to supplement their internal
R&D efforts. Certain sectors, such as pharmaceuticals and biotech, are seeing more of this push than
others.
$8 $13 $11 $13 $24 $31 $30
10%10%
10%
11%
11%
12%
13%
2010 2011 2012 2013 2014 2015 2016
Capital invested in associated deals ($B) % of total deal count
Corporates remain highly involved in VC
Source: Venture Pulse, Q4’16, Global Analysis of Venture Funding, KPMG Enterprise. Data provided by PitchBook, January 12, 2017.

With respect to innovation, corporates are becoming more realistic about what they can do organically and what they can’t do. Many in the US have realized that it may be more effective to market-test and conduct signals if they have a venture arm where they can leverage their balance sheet and deploy equity into startups. In order to be effective, however, corporates need the right infrastructure in place to partner with.
“
“
58#Q4VC
Ali GeramianManager,
KPMG Innovation Lab
KPMG in the US
© 2017 KPMG LLP, a Canadian limited liability partnership and a member firm of the KPMG network of independent
member firms affiliated with KPMG International Cooperative (“KPMG International”), a Swiss entity. All rights reserved.

59#Q4VC© 2017 KPMG LLP, a Canadian limited liability partnership and a member firm of the KPMG network of independent
member firms affiliated with KPMG International Cooperative (“KPMG International”), a Swiss entity. All rights reserved.
First-time venture financings of companies in the US
2010 – 2016
First-time financings in the US hit the lowest level last year since 2010, although the total of VC invested in
those rounds remained substantial at $6.6 billion. It’s not that venture firms have lost their appetite to that
extent for backing new businesses, but that in a highly priced climate, they have pulled back on such risky
prospects the most. That said, a fortunate few are still able to rake in plenty of VC, judging by the coupled
decline in activity and capital raised.
$4.7 $6.0 $6.7 $6.6 $8.1 $8.7 $6.6
2,089
2,829
3,340
3,5863,739
3,331
2,340
2010 2011 2012 2013 2014 2015 2016
Capital invested ($B) Deal count
US first-time rounds hit the lowest level in 6 years as 2016 closes
Source: Venture Pulse, Q4’16, Global Analysis of Venture Funding, KPMG Enterprise. Data provided by PitchBook, January 12, 2017.

60#Q4VC© 2017 KPMG LLP, a Canadian limited liability partnership and a member firm of the KPMG network of independent
member firms affiliated with KPMG International Cooperative (“KPMG International”), a Swiss entity. All rights reserved.
Venture-backed exit activity in the US
2010 – 2016
As 2017 dawns, liquidity prospects for not only unicorns and other heavily financed late-stage companies will
be assessed eagerly by venture firms. As the tally of completed exits has declined steadily for some time now,
VC fund managers are increasingly wary of the general climate for sales. For perspective, Q4’16 saw year-
over-year declines of 57% in exit value and 35% in count.
0
50
100
150
200
250
300
$0
$5
$10
$15
$20
$25
$30
$35
$40
1Q 2Q 3Q 4Q 1Q 2Q 3Q 4Q 1Q 2Q 3Q 4Q 1Q 2Q 3Q 4Q 1Q 2Q 3Q 4Q 1Q 2Q 3Q 4Q 1Q 2Q 3Q 4Q
2010 2011 2012 2013 2014 2015 2016
Exit value ($B) Exit count
Throughout 2016, exits of US VC-backed businesses slid steadily in count
Source: Venture Pulse, Q4’16, Global Analysis of Venture Funding, KPMG Enterprise. Data provided by PitchBook, January 12, 2017.

61#Q4VC© 2017 KPMG LLP, a Canadian limited liability partnership and a member firm of the KPMG network of independent
member firms affiliated with KPMG International Cooperative (“KPMG International”), a Swiss entity. All rights reserved.
Venture-backed exit activity (#) by
type in the US
2010 – 2016
Venture-backed exit activity ($B)
by type in the US
2010 – 2016
Especially as the IPO market fell into doldrums in 2016, corporate M&A became even more crucial for
venture investors’ liquidity prospects. The $42.4 billion in exit value achieved via that exit route was the
second-highest tally of the decade, only below the massive $68.8 billion notched in 2014.
0
200
400
600
800
1,000
1,200
2010 2011 2012 2013 2014 2015 2016
Strategic Acquisition
Buyout
IPO
$0.0
$10.0
$20.0
$30.0
$40.0
$50.0
$60.0
$70.0
$80.0
$90.0
2010 2011 2012 2013 2014 2015 2016
Strategic Acquisition Buyout IPO
As the IPO market cooled, M&A drove exit value
Source: Venture Pulse, Q4’16, Global Analysis of Venture Funding, KPMG Enterprise. Data provided by PitchBook, January 12, 2017.

62#Q4VC© 2017 KPMG LLP, a Canadian limited liability partnership and a member firm of the KPMG network of independent
member firms affiliated with KPMG International Cooperative (“KPMG International”), a Swiss entity. All rights reserved.
US venture fundraising
2010 – 2016
The significant year-over-year 18.3% increase in total VC raised by US VC firms, from $35.2 billion to
$41.6 billion, signifies continued appetite for exposure to the asset class on the part of limited partners. It
also speaks to the maturation of much of the VC firm population, as they raise larger and larger vehicles
throughout the course of the decade.
$20 $23 $24 $21 $35 $35 $42
153141
190
204
268255 253
2010 2011 2012 2013 2014 2015 2016
Capital raised ($B) Fund count
US fundraising tallies remain stable, with larger funds spiking total raised
Source: Venture Pulse, Q4’16, Global Analysis of Venture Funding, KPMG Enterprise. Data provided by PitchBook, January 12, 2017.

Conor Moore National Co-Lead Partner,
KPMG Venture Capital Practice,
KPMG in the US
With some of the uncertainty gone, optimism is growing within the VC market in the US. Economic indicators look reasonably good and it seems like it could be a strong year for IPO exits. If the expected exits materialize, they will put a lot of money back into the coffers of VC firms, which could loosen up VC investment dollars as well.
“ “
63#Q4VC© 2017 KPMG LLP, a Canadian limited liability partnership and a member firm of the KPMG network of independent
member firms affiliated with KPMG International Cooperative (“KPMG International”), a Swiss entity. All rights reserved.

64#Q4VC© 2017 KPMG LLP, a Canadian limited liability partnership and a member firm of the KPMG network of independent
member firms affiliated with KPMG International Cooperative (“KPMG International”), a Swiss entity. All rights reserved.
Venture fundraising (#) by size in the
US
2010 – 2016
First-time fundraising in the US essentially flat-lined between 2015 and 2016, with only 23 raised in the
former and 22 in the latter. Follow-on fundraising stayed steady as well. In fact, the total number of follow-on
funds raised from 2014 to 2016 has hovered around 230. Again, this testifies to the maturation of a significant
number of venture fund managers that have been active from before or since the financial crisis. On another
note, the decline in smaller fundraises (with 96 sub-$50 million vehicles closed in 2016, more on par with
2012 and 2013 totals), suggests crowding in the market, as well as a lull in limited partner (LP) enthusiasm
for smaller, newer managers.
First-time vs. follow-on venture funds
(#) in the US
2010 – 2016
0%
10%
20%
30%
40%
50%
60%
70%
80%
90%
100%
201
0
201
1
201
2
201
3
201
4
201
5
201
6
Under $50M $50M-$100M $100M-$250M
$250M-$500M $500M-$1B $1B+
0%
10%
20%
30%
40%
50%
60%
70%
80%
90%
100%
201
0
201
1
201
2
201
3
201
4
201
5
201
6First-time Follow-on
Decrease in smaller funds contributes to fewer first-time raises
Source: Venture Pulse, Q4’16, Global Analysis of Venture Funding, KPMG Enterprise. Data provided by PitchBook, January 12, 2017.

65#Q4VC© 2017 KPMG LLP, a Canadian limited liability partnership and a member firm of the KPMG network of independent
member firms affiliated with KPMG International Cooperative (“KPMG International”), a Swiss entity. All rights reserved.
In the past 3 years, pharma & biotech saw $43.7B in exit valueVenture-backed exit activity (#) by
sector in the US
2010 – 2016
Venture-backed exit activity ($B)
by sector in the US
2010 – 2016
Pharmaceuticals and biotechnology companies dominated the exit scene in 2016, the sector’s
tally coming to a massive $17.2 billion total, driven by huge outliers but still overtopping software’s
$14.1 billion for the year.
0
200
400
600
800
1,000
1,200
201
0
201
1
201
2
201
3
201
4
201
5
201
6
CommercialServices
ConsumerGoods &
Recreation
Energy
HC Devices& Supplies
HC Services& Systems
IT Hardware
Media
Other
Pharma &Biotech
Software
$0.0
$10.0
$20.0
$30.0
$40.0
$50.0
$60.0
$70.0
$80.0
$90.0
201
0
201
1
201
2
201
3
201
4
201
5
201
6
Source: Venture Pulse, Q4’16, Global Analysis of Venture Funding, KPMG Enterprise. Data provided by PitchBook, January 12, 2017.

66#Q4VC© 2017 KPMG LLP, a Canadian limited liability partnership and a member firm of the KPMG network of independent
member firms affiliated with KPMG International Cooperative (“KPMG International”), a Swiss entity. All rights reserved.
Only $1.2B in 2016’s total of US VC raised was in sub-$50M fundsVenture fundraising ($B) by size in the
US
2010 – 2016
First-time vs. follow-on funds ($B)
in the US
2010 – 2016
0%
10%
20%
30%
40%
50%
60%
70%
80%
90%
100%
201
0
201
1
201
2
201
3
201
4
201
5
201
6
$1B+
$500M-$1B
$250M-$500M
$100M-$250M
$50M-$100M
Under$50M
0%
10%
20%
30%
40%
50%
60%
70%
80%
90%
100%
201
0
201
1
201
2
201
3
201
4
201
5
201
6
First Time Follow-on
Source: Venture Pulse, Q4’16, Global Analysis of Venture Funding, KPMG Enterprise. Data provided by PitchBook, January 12, 2017.

67#Q4VC© 2017 KPMG LLP, a Canadian limited liability partnership and a member firm of the KPMG network of independent
member firms affiliated with KPMG International Cooperative (“KPMG International”), a Swiss entity. All rights reserved.
Proportionally, life sciences has ticked up as of lateLife sciences as % of total US VC
2010 – 2016
Life sciences investing in the US was relatively more in vogue years ago, even amid the more slow-paced
period from 2010 to 2012. The decrease in its portion of overall US financing activity must be compared
with the venture boom in the same timeframe—it’s not that life sciences declined, but rather that it simply
didn’t see a commensurate increase in activity. For example, life sciences rounds increased from 1,563 in
2012 to 1,726 in 2015, while total venture financing soared from 13,006 to 17,992 in the same period.
That said, its proportionate increase amid the downturn demonstrates the continued activity of an
established coterie of life sciences-focused VCs.
$8 $8 $9 $9 $11 $15 $12
18%
15%
14%
12%
11% 12%
12%
2010 2011 2012 2013 2014 2015 2016
Life sciences deal value ($B) Life sciences as % of total US VC (#)
Source: Venture Pulse, Q4’16, Global Analysis of Venture Funding, KPMG Enterprise. Data provided by PitchBook, January 12, 2017.

68#Q4VC© 2017 KPMG LLP, a Canadian limited liability partnership and a member firm of the KPMG network of independent
member firms affiliated with KPMG International Cooperative (“KPMG International”), a Swiss entity. All rights reserved.
Traditional US strongholds of VC still capture most of deal flowUS venture activity ($B) by US region
2010 – 2016
US venture activity (#) by US region
2010 – 2016
0%
10%
20%
30%
40%
50%
60%
70%
80%
90%
100%
201
0
201
1
201
2
201
3
201
4
201
5
201
6
Great Lakes Mid-Atlantic Midwest
Mountain New England Other Territory
South Southeast West Coast
0%
10%
20%
30%
40%
50%
60%
70%
80%
90%
100%
201
0
201
1
201
2
201
3
201
4
201
5
201
6
Great Lakes Mid-Atlantic Midwest
Mountain New England Other Territory
South Southeast West Coast
Source: Venture Pulse, Q4’16, Global Analysis of Venture Funding, KPMG Enterprise. Data provided by PitchBook, January 12, 2017.
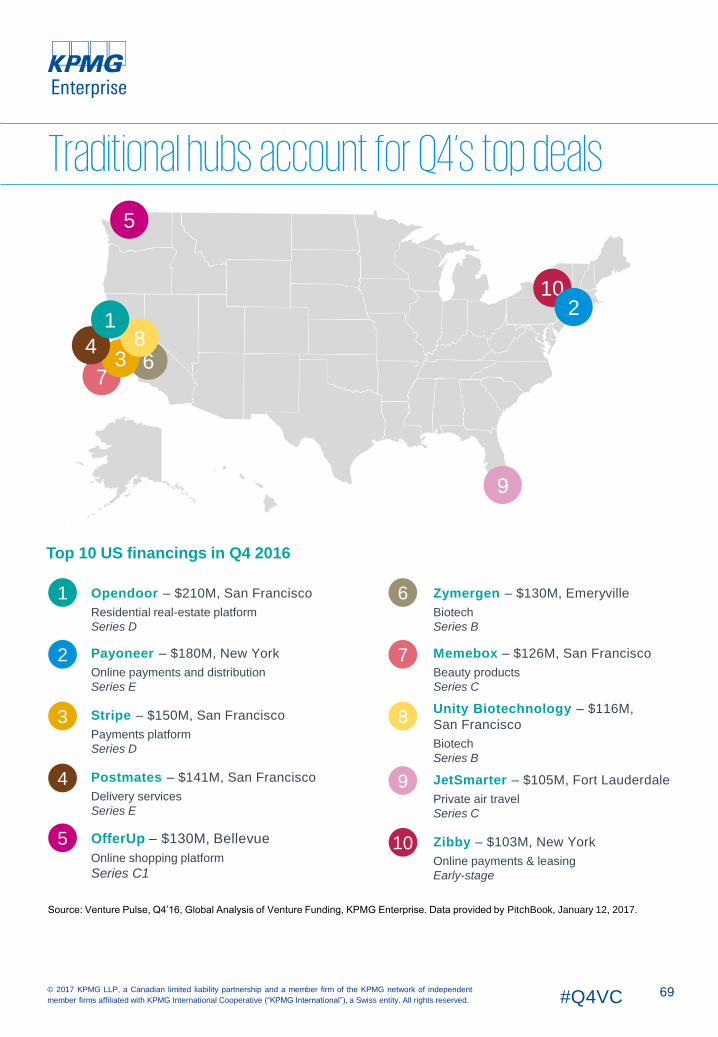
69#Q4VC© 2017 KPMG LLP, a Canadian limited liability partnership and a member firm of the KPMG network of independent
member firms affiliated with KPMG International Cooperative (“KPMG International”), a Swiss entity. All rights reserved.
10
763
8
5
4
9
21
Opendoor – $210M, San Francisco
Residential real-estate platform
Series D
Payoneer – $180M, New York
Online payments and distribution
Series E
Stripe – $150M, San Francisco
Payments platform
Series D
Postmates – $141M, San Francisco
Delivery services
Series E
OfferUp – $130M, Bellevue
Online shopping platform
Series C1
7
8
6
9
105
4
3
2
1 Zymergen – $130M, Emeryville
Biotech
Series B
Memebox – $126M, San Francisco
Beauty products
Series C
Unity Biotechnology – $116M,
San Francisco
Biotech
Series B
JetSmarter – $105M, Fort Lauderdale
Private air travel
Series C
Zibby – $103M, New York
Online payments & leasing
Early-stage
Top 10 US financings in Q4 2016
Traditional hubs account for Q4’s top deals
Source: Venture Pulse, Q4’16, Global Analysis of Venture Funding, KPMG Enterprise. Data provided by PitchBook, January 12, 2017.

In Q4’16 European
VC-backed companies
raised
$3.3Bacross
585 deals

71#Q4VC© 2017 KPMG LLP, a Canadian limited liability partnership and a member firm of the KPMG network of independent
member firms affiliated with KPMG International Cooperative (“KPMG International”), a Swiss entity. All rights reserved.
Europe experienced a drop in both VC funding and the number of VC deals during 2016. However,
compared to its counterparts in Asia and the Americas, the region showed some resilience during
Q4’16. While uncertainties related to the UK’s Brexit strategy and a degree of geopolitical uncertainty in
other European countries is making investors cautious, positive signs, such as the successful IPO exits
of a number of European companies, have also kept them optimistic.
The current exchange rates between both the Euro and British Pound and the US Dollar have also
likely helped add to the resilience of Europe’s VC market. The favorable currency climate has made
Europe a more attractive place to invest in the eyes of foreign investors, despite other perceived market
challenges.
VC Investors in Europe becoming more selective
Similar to trends experienced elsewhere in the world, VC investors in Europe were more cautious with
their investment dollars during 2016. Investors continued to make investments, but were far more
selective about where they put funds. Investors took more time to evaluate investment decisions and
undertook more due diligence. Companies with viable business plans and avenues to profitability
continued to receive funding, in addition to those that could show efficiencies rather than burning
through cash.
Diversity a big part of Europe’s resilience – also a key challenge
The uniqueness of Europe’s varied technology hubs may be one of the region’s prime factors when it
comes to stability. With established or growing technology hubs across Europe, such as London,
Berlin, Madrid, Paris, Dublin, Stockholm and Tel Aviv, there are varied opportunities for both startups
and VC investors to achieve success. At the same time, the complexity of the region poses challenges
for startups wanting to grow beyond their initial borders. The complexity stems from, amongst others,
different regulatory environments, cultures and languages across Europe. Many, in fact, choose to
target the US or China first when it comes to places to grow internationally.
‘Business as usual’ in post-Brexit UK
In the UK, the Brexit vote caused significant uncertainty during 2016, particularly in Q2 and Q3. Despite
the plan to exit the EU, companies and investors appear to be taking a ‘business as usual’ approach to
their activities in the UK. This approach may change as more details are released about the UK’s
official Brexit strategy in 2017.
The UK government appears to be taking some proactive actions in order to support its strong
innovation ecosystem and continue to attract investment in its post-Brexit economy. During Q4’16, the
UK government announced £1 billion in funding for the development of digital infrastructure across the
country, including £400 million for VC investments in UK-based startups through the British Business
Bank.
Renewal of IPO market could come in 2017
While the IPO market in Europe has traditionally been smaller than that in the Americas or Asia, in
2016 a number of European-based technology firms tested the appetite for IPOs in the region,
including Nordic payments firm Nets A/S, food delivery platform Takeaway.com and online pharmacy
Shop Apotheke Europe in Germany. Further IPOs are expected heading into 2017, suggesting that
Europe may be entering a new era of opportunity for IPO exits.
European VC interest remains resilient with growth of innovation ecosystems

72#Q4VC© 2017 KPMG LLP, a Canadian limited liability partnership and a member firm of the KPMG network of independent
member firms affiliated with KPMG International Cooperative (“KPMG International”), a Swiss entity. All rights reserved.
Governments providing strong backing for innovation
Governments in Europe are starting to recognize the need to support startup companies beyond the
seed-stage. During Q4’16, the governments of Germany and France took a major step toward growing
their innovation ecosystems¹. The two governments announced the creation of a joint €1 billion fund to
assist startups in their countries to evolve beyond the seed-stage – a critical challenge for companies
that often find it difficult to bridge the gap between seed funding and later stage funding. The provision
of middle-stage funding should increase the opportunities for companies to thrive beyond the seed-
stage, which should help create a more renewable innovation ecosystem.
The UK government appears to be taking some proactive actions in order to support its strong
innovation ecosystem and continue to attract investment in its post-Brexit economy. During Q4’16, the
UK government announced £1 billion in funding for the development of digital infrastructure across the
country, including £400 million for VC investments in UK-based startups through the British Business
Bank.
Future outlook positive for VC investment in Europe
The maturity level of various tech hubs throughout Europe is rising, with new centers like Scandinavia
and France emerging, while established hubs in Germany, the UK, Ireland and Israel continue to
evolve. This evolution bodes well for the opportunities for VC investment heading into 2017 and
beyond.
There is expected to be some consolidation among startups in Europe, particularly acquisitions led by
corporate investors making strategic investments. There are a number of well-capitalized companies in
the region, which makes M&A a strong possibility.
Fintech and healthtech are expected to continue to be major investment areas for VC investors in
Europe, while emerging areas, such as AI, machine learning and deep tech, are expected to take on a
higher investment priority.
European VC interest remains resilient with growth of innovation ecosystems, cont’d
1. http://www.forbes.com/sites/federicoguerrini/2016/12/19/germany-and-france-plan-to-set-up-a-1-billion-fund-for-
startups/#1bc32b133366

73#Q4VC© 2017 KPMG LLP, a Canadian limited liability partnership and a member firm of the KPMG network of independent
member firms affiliated with KPMG International Cooperative (“KPMG International”), a Swiss entity. All rights reserved.
Venture financing trends in Europe
2010 – 2016
Although European venture activity slid again year-over-year, declining by 28% from 2015 levels, VC
investment remained quite robust on a historical basis at $15.7 billion. That actually overtops the second-
highest tally of the past 7 years, 2014’s $15 billion. As Europe’s venture ecosystem is more driven by
pockets of activity around metropolitan areas, outsized financings of large, late-stage companies have a
proportionately greater effect.
$9 $10 $10 $11 $15 $18 $16
2,101
2,657
3,223
4,117
4,723
4,378
3,142
2010 2011 2012 2013 2014 2015 2016
Capital invested ($B) Deal count
Europe experiences a significant decline in number of deals
Source: Venture Pulse, Q4’16, Global Analysis of Venture Funding, KPMG Enterprise. Data provided by PitchBook, January 12, 2017.
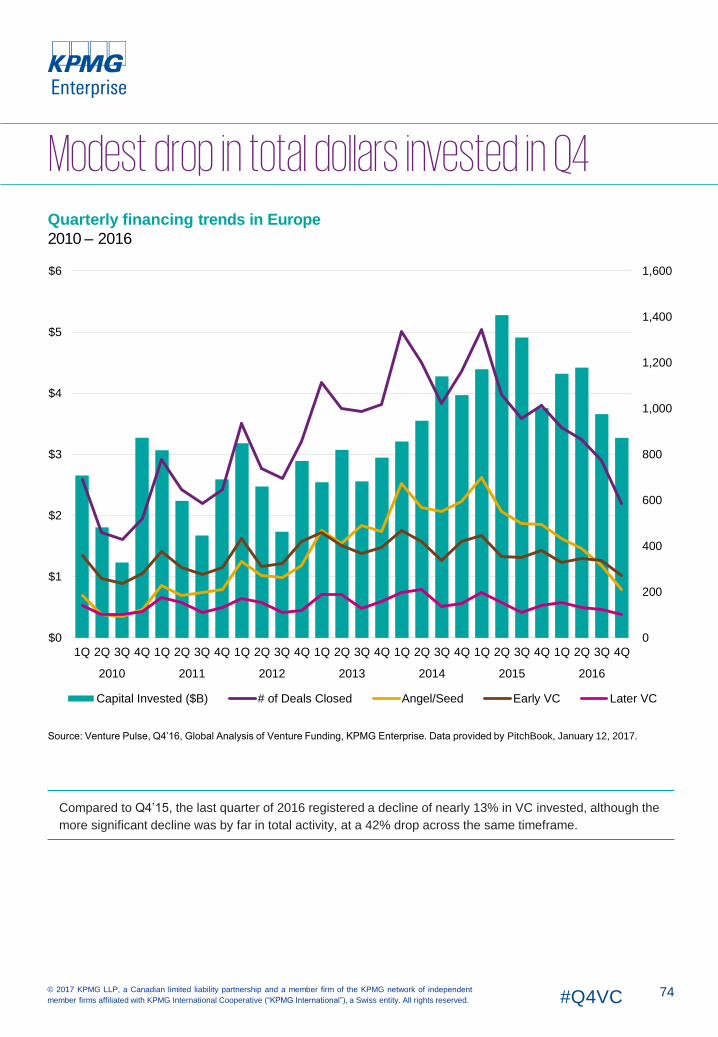
74#Q4VC© 2017 KPMG LLP, a Canadian limited liability partnership and a member firm of the KPMG network of independent
member firms affiliated with KPMG International Cooperative (“KPMG International”), a Swiss entity. All rights reserved.
Quarterly financing trends in Europe
2010 – 2016
Compared to Q4’15, the last quarter of 2016 registered a decline of nearly 13% in VC invested, although the
more significant decline was by far in total activity, at a 42% drop across the same timeframe.
0
200
400
600
800
1,000
1,200
1,400
1,600
$0
$1
$2
$3
$4
$5
$6
1Q 2Q 3Q 4Q 1Q 2Q 3Q 4Q 1Q 2Q 3Q 4Q 1Q 2Q 3Q 4Q 1Q 2Q 3Q 4Q 1Q 2Q 3Q 4Q 1Q 2Q 3Q 4Q
2010 2011 2012 2013 2014 2015 2016
Capital Invested ($B) # of Deals Closed Angel/Seed Early VC Later VC
Modest drop in total dollars invested in Q4
Source: Venture Pulse, Q4’16, Global Analysis of Venture Funding, KPMG Enterprise. Data provided by PitchBook, January 12, 2017.

75#Q4VC© 2017 KPMG LLP, a Canadian limited liability partnership and a member firm of the KPMG network of independent
member firms affiliated with KPMG International Cooperative (“KPMG International”), a Swiss entity. All rights reserved.
Median deal size ($M) by stage in Europe
2010 – 2016
Up, flat or down rounds in Europe
2010 – 2016
0%
10%
20%
30%
40%
50%
60%
70%
80%
90%
100%
201
0
201
1
201
2
201
3
201
4
201
5
201
6
Up
Flat
Down
$0.4 $0.4 $0.3 $0.3 $0.3$0.5
$0.8
$1.9$1.6 $1.5
$1.3$1.6
$2.0
$2.7
$3.5 $3.4$3.2 $3.2
$4.1
$5.2
$5.5
2010 2011 2012 2013 2014 2015 2016Angel/seed Early stage VC Later stage VC
Especially at the late-stage, round sizes remain high
Source: Venture Pulse, Q4’16, Global Analysis of Venture Funding, KPMG Enterprise. Data provided by PitchBook, January 12, 2017.

76#Q4VC© 2017 KPMG LLP, a Canadian limited liability partnership and a member firm of the KPMG network of independent
member firms affiliated with KPMG International Cooperative (“KPMG International”), a Swiss entity. All rights reserved.
Median deal size ($M) by series in Europe
2010 – 2016
$0.4 $0.3 $0.3 $0.3 $0.3 $0.6$0.9
$2.3
$3.0$2.5
$3.0 $3.2
$3.9
$5.1
$6.0
$7.0
$4.9 $5.0
$7.5
$11.0
$12.0
2010 2011 2012 2013 2014 2015 2016
Seed Series A Series B
$11$7
$10 $11$13
$18 $20
$9
$21
$12
$30
$60
$25
2010 2011 2012 2013 2014 2015 2016
Series C Series D+
Between 2015 and last year, Series D and later financings took a steep dive in terms of median size. In
fact, among relatively developed venture markets, the European late-stage was alone in seeing such a
decline. It should be noted that on a historical basis, $25 million is within the norm.
The latest stage took a plunge
Source: Venture Pulse, Q4’16, Global Analysis of Venture Funding, KPMG Enterprise. Data provided by PitchBook, January 12, 2017.

Anna ScallyPartner, Head of Technology, Media and
Telecommunications,
KPMG in Ireland
In spite of 2016 being a challenging year globally, it’s been the second best year on record for the amount of VC dollars invested in Europe. However, the number of deals benefiting from those investments has fallen considerably – back to 2012 levels. Looking forward there is a good pipeline of startups that have grown substantially. If they want to scale, going to the IPO market might be a credible option for a select few in 2017.
““
77#Q4VC© 2017 KPMG LLP, a Canadian limited liability partnership and a member firm of the KPMG network of independent
member firms affiliated with KPMG International Cooperative (“KPMG International”), a Swiss entity. All rights reserved.

78#Q4VC© 2017 KPMG LLP, a Canadian limited liability partnership and a member firm of the KPMG network of independent
member firms affiliated with KPMG International Cooperative (“KPMG International”), a Swiss entity. All rights reserved.
Median pre-money valuation ($M) by early series in Europe
2010 – 2016
$1.2 $0.9 $1.0 $1.2 $1.4$2.0 $2.3
$4.2 $4.1 $4.3
$7.1$6.2 $6.3
$9.6
$12.0
$15.5
$17.9
$13.9
$20.4
$33.5
$42.4
2010 2011 2012 2013 2014 2015 2016
Seed Series A Series B
One of the significant hurdles within the European venture ecosystem is scaling beyond a certain point up
the venture capital stack. On an anecdotal basis, the main challenge is breaching the significantly sized
Series A or even Series B level. Accordingly, the skyrocketing median Series B pre-money valuation over
the past few years suggests that amid the global venture boom, investors are eager to ply European
companies that are able to clear that threshold with plenty of VC.
Series B valuations indicate a clear threshold
Source: Venture Pulse, Q4’16, Global Analysis of Venture Funding, KPMG Enterprise. Data provided by PitchBook, January 12, 2017.

79#Q4VC© 2017 KPMG LLP, a Canadian limited liability partnership and a member firm of the KPMG network of independent
member firms affiliated with KPMG International Cooperative (“KPMG International”), a Swiss entity. All rights reserved.
Deal share by series in Europe
2010 – 2016, number of closed deals
Deal share by series in Europe
2010 – 2016, VC invested ($B)
0
500
1,000
1,500
2,000
2,500
3,000
3,500
201
0
201
1
201
2
201
3
201
4
201
5
201
6
Series D+
Series C
Series B
Series A
Angel/seed
$0.0
$2.0
$4.0
$6.0
$8.0
$10.0
$12.0
201
0
201
1
201
2
201
3
201
4
201
5
201
6
Series D+
Series C
Series B
Series A
Angel/seed
Angel and seed deals grow in VC investment
Source: Venture Pulse, Q4’16, Global Analysis of Venture Funding, KPMG Enterprise. Data provided by PitchBook, January 12, 2017.

Jonathan LavenderPrincipal, Head of Markets,
KPMG in Israel
There is still a strong hunger for tech
development in Europe, particularly in
the UK, Germany and France, where a
lot of traditional businesses know they
need to digitize. The question will be
how quickly they can do it.
“ “
80#Q4VC© 2017 KPMG LLP, a Canadian limited liability partnership and a member firm of the KPMG network of independent
member firms affiliated with KPMG International Cooperative (“KPMG International”), a Swiss entity. All rights reserved.

81#Q4VC© 2017 KPMG LLP, a Canadian limited liability partnership and a member firm of the KPMG network of independent
member firms affiliated with KPMG International Cooperative (“KPMG International”), a Swiss entity. All rights reserved.
European venture financings trends
by sector
2010 – 2016, VC invested ($B)
European venture financing trends by
sector
2010 – 2016, number of closed deals
0%
10%
20%
30%
40%
50%
60%
70%
80%
90%
100%
201
0
201
1
201
2
201
3
201
4
201
5
201
6
0%
10%
20%
30%
40%
50%
60%
70%
80%
90%
100%
201
0
201
1
201
2
201
3
201
4
201
5
201
6Commercial
Services
ConsumerGoods &
Recreation
Energy
HC Devices& Supplies
HCServices &Systems
ITHardware
Media
Other
Pharma &Biotech
Software
Among all the sectors, sums invested to healthcare-related companies actually remained relatively stable
between 2015 and 2016, with virtually every other seeing slides in capital to varying degrees. $1.05 billion
went to energy companies based in Europe in 2016, while pharmaceuticals and biotechnology raked in
just over $2 billion in total in the same timeframe.
Software slides in capital invested
Source: Venture Pulse, Q4’16, Global Analysis of Venture Funding, KPMG Enterprise. Data provided by PitchBook, January 12, 2017.

82#Q4VC© 2017 KPMG LLP, a Canadian limited liability partnership and a member firm of the KPMG network of independent
member firms affiliated with KPMG International Cooperative (“KPMG International”), a Swiss entity. All rights reserved.
Corporate VC participation in venture deals in Europe
2010 – 2016
The value of European rounds in which corporate VCs participated in 2016 grew significantly year-over-
year, by no less than 14% to $5.5 billion total. As a percentage of total financings, the number in which they
participated also grew significantly. With differing investment rationales, corporate venture arms have been
able to maintain their activity amid the downturn.
$3.0 $2.3 $4.3 $4.0 $3.8 $4.9 $5.5
13%
14%
13%
12%
11%
12%
17%
2010 2011 2012 2013 2014 2015 2016
Capital invested ($B) % of total deal count
Corporate participation jumps
Source: Venture Pulse, Q4’16, Global Analysis of Venture Funding, KPMG Enterprise. Data provided by PitchBook, January 12, 2017.

Patrick ImbachCo-Head of KPMG Tech Growth,
KPMG in the UK
While there is still uncertainty in the
European economy resulting from Brexit,
the message from the VC market is that
they continue “business as usual”. We are
seeing though that investors are
conducting more due diligence on Brexit-
related risks and implications to ensure
that management has thought through
any potential ramifications before moving
forward.
“
“
83#Q4VC© 2017 KPMG LLP, a Canadian limited liability partnership and a member firm of the KPMG network of independent
member firms affiliated with KPMG International Cooperative (“KPMG International”), a Swiss entity. All rights reserved.

84#Q4VC© 2017 KPMG LLP, a Canadian limited liability partnership and a member firm of the KPMG network of independent
member firms affiliated with KPMG International Cooperative (“KPMG International”), a Swiss entity. All rights reserved.
Venture financing in the UK
2010 – 2016
Impacted by the onset of uncertainty around multiple political and diplomatic issues in the wake of Brexit,
the UK venture scene saw total completed financings fall throughout the back half of the year to a low
unseen since 2011. Deal value remained resilient, as has been a common theme throughout 2016, but it
remains to be seen how Brexit will affect UK VC in the coming year.
$3.1 $1.9 $2.6 $3.2 $5.0 $6.0 $4.8
599
743
988
1,251
1,494
1,363
860
2010 2011 2012 2013 2014 2015 2016
Capital invested ($B) Deal count
Source: Venture Pulse, Q4’16, Global Analysis of Venture Funding, KPMG Enterprise. Data provided by PitchBook, January 12,
2017.
The UK records a steep drop

85#Q4VC© 2017 KPMG LLP, a Canadian limited liability partnership and a member firm of the KPMG network of independent
member firms affiliated with KPMG International Cooperative (“KPMG International”), a Swiss entity. All rights reserved.
After cresting in 2015, London saw a sudden slide in activity in 2016Venture activity in London
2010 – 2016
In light of Brexit, a swift year-over-year decline in the number of completed venture deals makes intuitive
sense, yet as there is simply so much uncertainty around the UK’s leaving the European Union, it is
premature to assume London’s top-line venture activity will diminish dramatically. Plenty of VC was still
invested in the city’s startups in 2016 alone.
$0.8 $0.6 $1.4 $1.8 $3.1 $3.7 $3.1
177
260
417
616
749778
488
2010 2011 2012 2013 2014 2015 2016
Capital invested ($B) Deal count
Source: Venture Pulse, Q4’16, Global Analysis of Venture Funding, KPMG Enterprise. Data provided by PitchBook, January 12, 2017.

86#Q4VC© 2017 KPMG LLP, a Canadian limited liability partnership and a member firm of the KPMG network of independent
member firms affiliated with KPMG International Cooperative (“KPMG International”), a Swiss entity. All rights reserved.
Venture financing in Nordic region
2010 – 2016
The Nordic region enjoyed a relatively healthy 2016 in both VC invested and total activity, especially in the
context of the broader global downturn in venture funding. Driven by some outliers, VC investment
remained substantial at $1.15 billion, down from an outlier 2015 by some 35%.
$0.7 $0.9 $0.7 $1.1 $1.2 $1.8 $1.1
285
322
349
428447
539
508
2010 2011 2012 2013 2014 2015 2016
Capital invested ($B) Deal count
The Nordic region remains healthy
Source: Venture Pulse, Q4’16, Global Analysis of Venture Funding, KPMG Enterprise. Data provided by PitchBook, January 12, 2017.

87#Q4VC© 2017 KPMG LLP, a Canadian limited liability partnership and a member firm of the KPMG network of independent
member firms affiliated with KPMG International Cooperative (“KPMG International”), a Swiss entity. All rights reserved.
Venture financing in Germany
2010 – 2016
After 2 outsized years in terms of the total value of all venture fundings of domestic companies, Germany
finally saw its annual total of VC dispersed return to historical norms, retaining a healthy margin of $260
million over the figure notched in 2013.
$0.7 $1.4 $1.5 $1.7 $3.2 $3.6 $1.9
241
312
348
413
449
407
345
2010 2011 2012 2013 2014 2015 2016
Capital invested ($B) Deal count
Germany reverts to historical norms
Source: Venture Pulse, Q4’16, Global Analysis of Venture Funding, KPMG Enterprise. Data provided by PitchBook, January 12, 2017.

Tim Dümichen,Partner,
KPMG in Germany
There is strong political will in Europe to
compete with the US in new areas of
technology, like virtual reality and artificial
intelligence. VC investors seem to be
doing everything they can to foster these
investments, including setting up big
funds to help incentivize companies to
care about these areas and to fund
advancements.
“
“
88#Q4VC© 2017 KPMG LLP, a Canadian limited liability partnership and a member firm of the KPMG network of independent
member firms affiliated with KPMG International Cooperative (“KPMG International”), a Swiss entity. All rights reserved.

89#Q4VC© 2017 KPMG LLP, a Canadian limited liability partnership and a member firm of the KPMG network of independent
member firms affiliated with KPMG International Cooperative (“KPMG International”), a Swiss entity. All rights reserved.
Berlin experiences rapid shift in VC invested, even as activity remains high
Venture activity in Berlin
2010 – 2016
After rising steadily year over year to crest at $2.5 billion in total VC invested in 2015, last year saw nearly
$1.0 billion in total capital dispersed to Berlin-based businesses. Although lower than each of the
preceding three years, that sum still outperforms on a longer-term historical basis.
$0.1 $0.3 $0.3 $1.3 $1.8 $2.5 $1.0
64
89
140
185
204
188
165
2010 2011 2012 2013 2014 2015 2016
Capital invested ($B) Deal count
Source: Venture Pulse, Q4’16, Global Analysis of Venture Funding, KPMG Enterprise. Data provided by PitchBook, January 12, 2017.

90#Q4VC© 2017 KPMG LLP, a Canadian limited liability partnership and a member firm of the KPMG network of independent
member firms affiliated with KPMG International Cooperative (“KPMG International”), a Swiss entity. All rights reserved.
French capital investment totals stay strongVenture activity in France
2010 – 2016
French venture activity experienced a shift similar to that of other European nations in terms of activity,
yet its total VC invested remained quite resilient.
$0.9 $0.9 $1.1 $1.0 $1.2 $1.7 $1.6
274
303317
359
419
389
310
2010 2011 2012 2013 2014 2015 2016
Capital invested ($B) Deal count
Source: Venture Pulse, Q4’16, Global Analysis of Venture Funding, KPMG Enterprise. Data provided by PitchBook, January 12, 2017.

91#Q4VC© 2017 KPMG LLP, a Canadian limited liability partnership and a member firm of the KPMG network of independent
member firms affiliated with KPMG International Cooperative (“KPMG International”), a Swiss entity. All rights reserved.
Paris hits a high in VC investment as activity remains stableVenture activity in Paris
2010 – 2016
Paris venture activity continued unabated throughout 2016, maintaining a lofty plateau that
kicked off in 2014. Gradually, VC invested has risen in tandem, simply due to a greater
preponderance of larger financings.
$0.2 $0.3 $0.6 $0.4 $0.6 $0.9 $1.1
103
146 144 144
184
197192
2010 2011 2012 2013 2014 2015 2016
Capital invested ($B) Deal count
Source: Venture Pulse, Q4’16, Global Analysis of Venture Funding, KPMG Enterprise. Data provided by PitchBook, January 12, 2017.

François BlochPartner, Head of Innovative Startups,
KPMG in France
Looking to the future, we are likely going to see an increase in corporate ventures. A lot of big ticket companies want to invest in European startups right now. Corporates activity is expected to rise – not only in pure VC investment, but also in terms of those supporting or setting up incubators or accelerators for startups.
“ “
92#Q4VC© 2017 KPMG LLP, a Canadian limited liability partnership and a member firm of the KPMG network of independent
member firms affiliated with KPMG International Cooperative (“KPMG International”), a Swiss entity. All rights reserved.

93#Q4VC© 2017 KPMG LLP, a Canadian limited liability partnership and a member firm of the KPMG network of independent
member firms affiliated with KPMG International Cooperative (“KPMG International”), a Swiss entity. All rights reserved.
First-time venture financings of companies in Europe
2010 – 2016
Given the reversal in investor sentiment, European first-time financings fell by both count and value, hitting a
7 year low in each category. VC invested fell by just over 27% year-over-year, while activity slid by just
under 40%.
$2.6 $3.1 $3.9 $3.0 $2.4 $2.6 $1.9
1,126
1,452
1,678
1,963
2,084
1,509
915
2010 2011 2012 2013 2014 2015 2016
Capital invested ($B) Deal count
First-time financings continue their year-over-year decline in Europe
Source: Venture Pulse, Q4’16, Global Analysis of Venture Funding, KPMG Enterprise. Data provided by PitchBook, January 12, 2017.

94#Q4VC© 2017 KPMG LLP, a Canadian limited liability partnership and a member firm of the KPMG network of independent
member firms affiliated with KPMG International Cooperative (“KPMG International”), a Swiss entity. All rights reserved.
Venture-backed exit activity in Europe
2010 – 2016
After chugging along steadily at elevated totals for value for 3 years, European venture-backed exits finally
slid by nearly 16% year-over-year. Activity fell by nearly 27%, roughly back to the level observed in 2013.
$6 $7 $5 $16 $16 $16 $13
280
309
345
384
522512
374
2010 2011 2012 2013 2014 2015 2016
Exit value ($B) Exit count
Exits drop in 2016
Source: Venture Pulse, Q4’16, Global Analysis of Venture Funding, KPMG Enterprise. Data provided by PitchBook, January 12, 2017.

95#Q4VC© 2017 KPMG LLP, a Canadian limited liability partnership and a member firm of the KPMG network of independent
member firms affiliated with KPMG International Cooperative (“KPMG International”), a Swiss entity. All rights reserved.
Venture-backed exit activity (#) by
type in Europe
2010 – 2016
Venture-backed exit activity ($B)
by type in Europe
2010 – 2016
One of the primary factors behind the decline in overall exit activity in Europe last year was a decline in
corporate acquisitions by nearly 29%.
0
100
200
300
400
500
600
2010 2011 2012 2013 2014 2015 2016
Strategic Acquisition
Buyout
IPO
$0.0
$2.0
$4.0
$6.0
$8.0
$10.0
$12.0
$14.0
$16.0
$18.0
2010 2011 2012 2013 2014 2015 2016
Strategic Acquisition Buyout IPO
Almost a 29% decline in corporate acquisitions led to a fall overall
Source: Venture Pulse, Q4’16, Global Analysis of Venture Funding, KPMG Enterprise. Data provided by PitchBook, January 12, 2017.

96#Q4VC© 2017 KPMG LLP, a Canadian limited liability partnership and a member firm of the KPMG network of independent
member firms affiliated with KPMG International Cooperative (“KPMG International”), a Swiss entity. All rights reserved.
European venture fundraising
2010 – 2016
Over the past 7 years, the number of funds raised domestically in Europe has only declined, even if the
past 2 years have seen a resurgence in total VC raised, combining to amass $20.7 billion in total.
$9 $8 $7 $7 $7 $10 $10
127
136
122
113
87
75
62
2010 2011 2012 2013 2014 2015 2016
Capital raised ($B) Fund count
The decline in domestic venture fundraising is pronounced in Europe
Source: Venture Pulse, Q4’16, Global Analysis of Venture Funding, KPMG Enterprise. Data provided by PitchBook, January 12, 2017.

97#Q4VC© 2017 KPMG LLP, a Canadian limited liability partnership and a member firm of the KPMG network of independent
member firms affiliated with KPMG International Cooperative (“KPMG International”), a Swiss entity. All rights reserved.
Venture fundraising (#) by size in
Europe
2010 – 2016
Larger venture managers are still able to raise on follow-on vehicles of considerable size, with only a small
bevy of smaller managers able to close funds as of late, particularly in 2016.
First-time vs. follow-on venture funds
(#) in Europe
2010 – 2016
0%
10%
20%
30%
40%
50%
60%
70%
80%
90%
100%
201
0
201
1
201
2
201
3
201
4
201
5
201
6
First-time Follow-on
0%
10%
20%
30%
40%
50%
60%
70%
80%
90%
100%
201
0
201
1
201
2
201
3
201
4
201
5
201
6
Under $50M $50M-$100M $100M-$250M
$250M-$500M $500M-$1B $1B+
Larger, more experienced VC firms dominate fundraising in Europe
Source: Venture Pulse, Q4’16, Global Analysis of Venture Funding, KPMG Enterprise. Data provided by PitchBook, January 12, 2017.

98#Q4VC© 2017 KPMG LLP, a Canadian limited liability partnership and a member firm of the KPMG network of independent
member firms affiliated with KPMG International Cooperative (“KPMG International”), a Swiss entity. All rights reserved.
10
76
3
85
49
2
1
SigFox – $162.1M, Labege
Cellular network
Series E
Oxford Nanopore Technologies – $124.4M,
Oxford
Biotech
Late-stage
Devialet – $108.1M, Paris
Drug discovery
Series C
ADC Therapeutics – $105M, Epalinges
Pharma & biotech
Early-stage
Kymab – $100M, Cambridge
Pharma & Biotech
Series C
7
8
6
9
105
4
3
2
1 Carrick Therapeutics – $95M, Dublin
Pharma & biotech
Early-stage
HelloFresh – $91.9M, Berlin
Food products
Series G
Nova Lumos – $90M, Amsterdam
Electricity distributor
Early-stage
Sonnen (battery storage) – $85M,
Wildpolsried
Solar-based battery developer
Late-stage
GoEuro – $70M, Berlin
Travel search platform
Series C
Top 10 European financings in Q4 2016
Europe’s VC hubs account for most rounds
Source: Venture Pulse, Q4’16, Global Analysis of Venture Funding, KPMG Enterprise. Data provided by PitchBook, January 12, 2017.

In Q4’16 VC-backed
companies in the Asia
region raised
$4.9Bacross
357 deals

100#Q4VC© 2017 KPMG LLP, a Canadian limited liability partnership and a member firm of the KPMG network of independent
member firms affiliated with KPMG International Cooperative (“KPMG International”), a Swiss entity. All rights reserved.
Despite a significant decline in investment in Q4’16, total VC funding in Asia for 2016 came just shy of
2015’s all-time high. This reflects the importance of mega-deals to Asia’s VC market. Numerous mega-
deals early in the year buoyed total funding overall, then trailed off during the second half of the year, to
just a single $500 million+ funding round in Q4’16.
Similar to VC investors in other regions around the world, investors in the VC market in Asia have taken
a more cautious approach to their investments this year. While investments are still being made, the
due diligence and deals approvals process is taking longer than it has historically. As a result, the
number of deals has slowed dramatically, particularly in Q4’16.
Innovation mandate driving government activity in China
In China, provincial governments have started to implement the central government’s mandate for
innovation. The Hubei province, in particular, announced a fund of $81 billion for investments focused
on diversifying the job base during Q4’16. Rather than make investments directly, the province is
investing funds through a number of large investment companies, including Sequoia Capital and CBC
Capital¹.
In addition to acquiring companies or investing in startups, provincial governments are also starting to
set-up research centres and programs to attract foreign IT talent and providing tax incentives, subsidies
and other supports in order to grow local technology hubs.
IPO market in Asia remains relatively lackluster
The IPO market in China, specifically, continues to face numerous delays, with hundreds of companies
deadlocked, waiting for the opportunity to exit. Despite these drawbacks, many companies from
mainland China view Hong Kong as a better option for IPO than the US, where valuations are often
less certain. One positive sign for the IPO market in Asia during Q4’16 was the Hong Kong based IPO
of selfie app maker Meitu.
Corporate investment in Asia remains strong
Corporate investors have played a significant role in the VC market in Asia – in China, India and Japan
in particular. At the same time, corporate investment may be one contributing factor toward why fewer
companies have reached unicorn status in the region during 2016. Large corporates have made major
efforts to acquire promising startups before they get to that stage, particularly in China.
India continues to attract VC attention, particularly for tech enablement
VC interest in India was relatively strong during 2016, although deal-making was slower than in 2015.
The government introduced initiatives aimed at clarifying rules and regulations for startups, in an effort
to make it easier for companies with new business models to understand what they could and could not
do in the country. The positive growth in India’s startup ecosystem has likely led to the growth of VC
investments being made by successful Indian entrepreneurs, in addition to the increase of established
professionals leaving their corporate jobs to start new business ventures.
The latter trend bodes well for the future of India-based startups as established professionals may be
better equipped to guide a startup than individuals with a creative idea but less business experience.
Heading into 2017, startups looking to attract capital will likely put more emphasis on their cost
structure in order to show investors they are well organized to achieve profitability. Subsectors of
technology expected to grow over the next year include healthcare, fintech and any technology that
enables other businesses to grow.
Asia-based VC investment drops further amid ongoing lack of mega-deals
1. https://www.bloomberg.com/news/articles/2016-10-20/china-heartland-province-deploying-81-billion-to-seed-startups

101#Q4VC© 2017 KPMG LLP, a Canadian limited liability partnership and a member firm of the KPMG network of independent
member firms affiliated with KPMG International Cooperative (“KPMG International”), a Swiss entity. All rights reserved.
Japan’s startup ecosystem growing
While the volume and value of VC deals may still be low, there was a strong push in Japan to support
the development of new technologies and startups during 2016, both from the government and from
corporates. Japanese corporates, in particular, continued to accelerate their shift from an internal
closed loop innovation system to a more open innovation culture. Looking ahead to 2017, a steady
uptick in VC fundraising and VC investment is expected as the startup ecosystem in the country
continues to grow¹.
Trends to watch for in 2017
Looking ahead to 2017, artificial intelligence and cognitive learning are poised to transform almost
every aspect of people’s lives. Consequently, VC investment across sectors in this space is expected
to be a very hot topic for the foreseeable future. Outsourcing, healthcare and education technologies
are also seen as top priorities for VC investment.
In China, outbound VC investment is expected to continue at a solid pace as companies look to acquire
technologies for use in the Chinese market. Barring any unexpected challenges introduced by the
change in government, the United States is likely to continue to gain the lion’s share of outbound
investment, although Canada, Israel and countries in Europe may also see additional interest from
Chinese investors, especially in countries where their currencies have devalued over the past 6
months.
Asia-based VC investment drops further amid ongoing lack of mega deals, cont’d
1. http://news.stanford.edu/2016/08/31/japan-transforming-innovation-culture/

102#Q4VC© 2017 KPMG LLP, a Canadian limited liability partnership and a member firm of the KPMG network of independent
member firms affiliated with KPMG International Cooperative (“KPMG International”), a Swiss entity. All rights reserved.
Venture financing trends in the Asia region
2010 – 2016
Without a well-developed venture ecosystem, the Asia region is driven primarily by deals within India and
China. Early winners of select niches within those countries are responsible for boosting overall sums
invested in the area over the past 2 years. The role of non-traditional venture investors should also not be
underestimated, as both local and US firms eye relatively better-priced opportunities in emerging markets.
$4 $8 $5 $6 $21 $39 $39
585
889
1,009
1,365
1,919
2,266
1,742
2010 2011 2012 2013 2014 2015 2016
Capital invested ($B) Deal count
Asia experiences a more significant decline in activity
Source: Venture Pulse, Q4’16, Global Analysis of Venture Funding, KPMG Enterprise. Data provided by PitchBook, January 12, 2017.

103#Q4VC© 2017 KPMG LLP, a Canadian limited liability partnership and a member firm of the KPMG network of independent
member firms affiliated with KPMG International Cooperative (“KPMG International”), a Swiss entity. All rights reserved.
Quarterly financing trends in the Asia region
2010 – 2016
Year-over-year, the final quarter of 2016 saw a decline of 24.7% in VC invested relative to the same period
in 2015, while activity slid by close to 29%. Even more so than in other regions, however, the final Q4
tallies were still above historical means.
0
100
200
300
400
500
600
700
$0
$2
$4
$6
$8
$10
$12
$14
$16
$18
$20
1Q 2Q 3Q 4Q 1Q 2Q 3Q 4Q 1Q 2Q 3Q 4Q 1Q 2Q 3Q 4Q 1Q 2Q 3Q 4Q 1Q 2Q 3Q 4Q 1Q 2Q 3Q 4Q
2010 2011 2012 2013 2014 2015 2016
Capital Invested ($B) # of Deals Closed Angel/Seed Early VC Later VC
On a quarterly basis, the decline in activity mirrors worldwide trends
Source: Venture Pulse, Q4’16, Global Analysis of Venture Funding, KPMG Enterprise. Data provided by PitchBook, January 12, 2017.

104#Q4VC© 2017 KPMG LLP, a Canadian limited liability partnership and a member firm of the KPMG network of independent
member firms affiliated with KPMG International Cooperative (“KPMG International”), a Swiss entity. All rights reserved.
Median deal size ($M) by stage in the Asia region
2010 – 2016
The median late-stage financing in the Asia region remains well above historical comparables, 60% larger
than what was recorded in 2014. That figure is again driven by a small cluster of mature companies that
capitalized early on opportunities with the emerging markets of the region.
$0.3 $0.4 $0.3 $0.4 $0.5 $0.5 $0.5
$5.0 $5.0
$3.5$3.0
$4.9 $5.0
$7.0
$10.0$10.7
$8.0
$9.6
$15.0
$26.3
$24.0
2010 2011 2012 2013 2014 2015 2016
Angel/seed Early stage VC Later stage VC
At the late-stage, round sizes remain high, while early remains strong
Source: Venture Pulse, Q4’16, Global Analysis of Venture Funding, KPMG Enterprise. Data provided by PitchBook, January 12, 2017.

105#Q4VC© 2017 KPMG LLP, a Canadian limited liability partnership and a member firm of the KPMG network of independent
member firms affiliated with KPMG International Cooperative (“KPMG International”), a Swiss entity. All rights reserved.
Median deal size ($M) by series in the Asia region
2010 – 2016
Note: Select figures are rounded for legibility.
$0.1 $0.4 $0.3 $0.4 $0.4 $0.5 $0.5
$4.0
$5.0
$3.2$2.4
$4.3$4.8 $4.5
$8.3
$10.0
$7.8 $8.1
$15.0
$16.2
$15.0
2010 2011 2012 2013 2014 2015 2016
Seed Series A Series B
$13.8
$20.0
$15.0 $15.0
$30.0
$35.5$32.0
$50.0
$37.9
$30.0
$15.5
$50.0
$100.0
$62.4
2010 2011 2012 2013 2014 2015 2016
Series C Series D+
Nearly every series plateaued
Source: Venture Pulse, Q4’16, Global Analysis of Venture Funding, KPMG Enterprise. Data provided by PitchBook, January 12, 2017.

106#Q4VC© 2017 KPMG LLP, a Canadian limited liability partnership and a member firm of the KPMG network of independent
member firms affiliated with KPMG International Cooperative (“KPMG International”), a Swiss entity. All rights reserved.
Deal share by series in the Asia region
2010 – 2016, number of closed deals
Quarterly deal share by series in the Asia region
2010 – 2016, VC invested ($B)
0
200
400
600
800
1,000
1,200
1,400
1,600
1,800
2,000
201
0
201
1
201
2
201
3
201
4
201
5
201
6
Series D+
Series C
Series B
Series A
Angel/seed
$0.0
$5.0
$10.0
$15.0
$20.0
$25.0
$30.0
$35.0
201
0
201
1
201
2
201
3
201
4
201
5
201
6
Series D+
Series C
Series B
Series A
Angel/seed
Unlike other regions, angel and seed activity has stayed relatively resilient
Source: Venture Pulse, Q4’16, Global Analysis of Venture Funding, KPMG Enterprise. Data provided by PitchBook, January 12, 2017.

107#Q4VC© 2017 KPMG LLP, a Canadian limited liability partnership and a member firm of the KPMG network of independent
member firms affiliated with KPMG International Cooperative (“KPMG International”), a Swiss entity. All rights reserved.
Asia venture financings trends by
sector
2010 – 2016, VC invested ($B)
Asia venture financing trends by sector
2010 – 2016, number of closed deals
Healthcare investments stayed relatively stable between 2015 and 2016 in terms of activity, while
software fell by just over 20% by count in the same timeframe. Notably, however, software hit a new high
in terms of VC invested, at a staggering $21.1 billion, well over the $15.6 billion achieved in 2015.
0%
10%
20%
30%
40%
50%
60%
70%
80%
90%
100%
201
0
201
1
201
2
201
3
201
4
201
5
201
6
CommercialServices
ConsumerGoods &
Recreation
Energy
HC Devices &Supplies
HC Services &Systems
IT Hardware
Media
Other
Pharma &Biotech
Software
0%
10%
20%
30%
40%
50%
60%
70%
80%
90%
100%
201
0
201
1
201
2
201
3
201
4
201
5
201
6
Software hits $21.1B invested in 2016
Source: Venture Pulse, Q4’16, Global Analysis of Venture Funding, KPMG Enterprise. Data provided by PitchBook, January 12, 2017.

Philip NgPartner, Head of Technology
KPMG China
Investors in Asia are shifting their
investment focus. While there has
previously been a lot of attention paid to
online to offline (o2o), the second half of
2016 saw investors more focused on
artificial intelligence, robotics and big data.
There is also increased focus on fintech,
education and healthcare related startups.
“ “
108#Q4VC© 2017 KPMG LLP, a Canadian limited liability partnership and a member firm of the KPMG network of independent
member firms affiliated with KPMG International Cooperative (“KPMG International”), a Swiss entity. All rights reserved.

109#Q4VC© 2017 KPMG LLP, a Canadian limited liability partnership and a member firm of the KPMG network of independent
member firms affiliated with KPMG International Cooperative (“KPMG International”), a Swiss entity. All rights reserved.
Corporate participation in venture deals in the Asia region
2010 – 2016
Relative to other regions, the fledgling venture ecosystem in Asia entails a higher percentage of its total VC
activity to be associated with corporate venture arms historically, given their typical investment rationales in
backing companies with an eye toward future strategic and innovative gains as well as financial. However,
the global increase in CVC investing has certainly not escaped the region, as is evident from a new high in
the proportion of total activity in which corporate VCs participated.
$1$2 $2 $2
$10 $24 $28
15%
18%
16%
18%
17%
18%19%
2010 2011 2012 2013 2014 2015 2016
Capital invested in associated deals ($B) % of total deal count
Corporate VCs hit a new high
Source: Venture Pulse, Q4’16, Global Analysis of Venture Funding, KPMG Enterprise. Data provided by PitchBook, January 12, 2017.

110#Q4VC© 2017 KPMG LLP, a Canadian limited liability partnership and a member firm of the KPMG network of independent
member firms affiliated with KPMG International Cooperative (“KPMG International”), a Swiss entity. All rights reserved.
To put 2016’s performance in overall venture activity in context, the 859 completed financings of India-based
companies that year represents no less than 70% more than the total recorded in 2014 and a 296% increase
over the 290 in 2012.
India stays strongVenture financing in India
2010 – 2016
$0.6 $1.1 $1.2 $1.5 $5.3 $8.2 $3.3
139
205
290
396
505
890859
2010 2011 2012 2013 2014 2015 2016
Capital invested ($B) Deal count
Source: Venture Pulse, Q4’16, Global Analysis of Venture Funding, KPMG Enterprise. Data provided by PitchBook, January 12, 2017.

Sreedhar PrasadPartner, Internet Business and Startups,
KPMG in India
There is still considerable interest among
VC investors in India, however deal
cycles have been longer as investors are
taking more time to evaluate startups to
ensure they are investing in companies
that have clear business models and truly
unique value propositions. “Me too’’
companies are now finding it difficult to
raise funds, whereas companies with
unique models for example, in the fintech,
healthcare and logistics ecosystems are
taking the lion share of funding.
““
111#Q4VC© 2017 KPMG LLP, a Canadian limited liability partnership and a member firm of the KPMG network of independent
member firms affiliated with KPMG International Cooperative (“KPMG International”), a Swiss entity. All rights reserved.

112#Q4VC© 2017 KPMG LLP, a Canadian limited liability partnership and a member firm of the KPMG network of independent
member firms affiliated with KPMG International Cooperative (“KPMG International”), a Swiss entity. All rights reserved.
VC investment in Mumbai startups has virtually trebled 2011 – 2013 totalsVenture activity in Mumbai
2010 – 2016
Mumbai saw a sudden surge of venture activity in 2015, a performance unlikely to be replicated, and yet
2016 came close, notching no fewer than 131 closed VC financings.
$64 $234 $172 $167 $548 $880 $573
25
4552
76
87
159
131
2010 2011 2012 2013 2014 2015 2016
Capital invested ($M) Deal count
Source: Venture Pulse, Q4’16, Global Analysis of Venture Funding, KPMG Enterprise. Data provided by PitchBook, January 12,
2017.

113#Q4VC© 2017 KPMG LLP, a Canadian limited liability partnership and a member firm of the KPMG network of independent
member firms affiliated with KPMG International Cooperative (“KPMG International”), a Swiss entity. All rights reserved.
Venture financing in China
2010 – 2016
At $31 billion in total VC invested through 300 rounds (the latter a steep drop from the 513 completed
financings in 2015), it is clear that both traditional and non-traditional VCs avidly sought to gain exposure to
innovative businesses within China last year.
$3 $6 $3 $3 $12 $26 $31
243
369
273
339
553
513
300
2010 2011 2012 2013 2014 2015 2016
Capital invested ($B) Deal count
VC in China boomed in 2016
Source: Venture Pulse, Q4’16, Global Analysis of Venture Funding, KPMG Enterprise. Data provided by PitchBook, January 12, 2017.
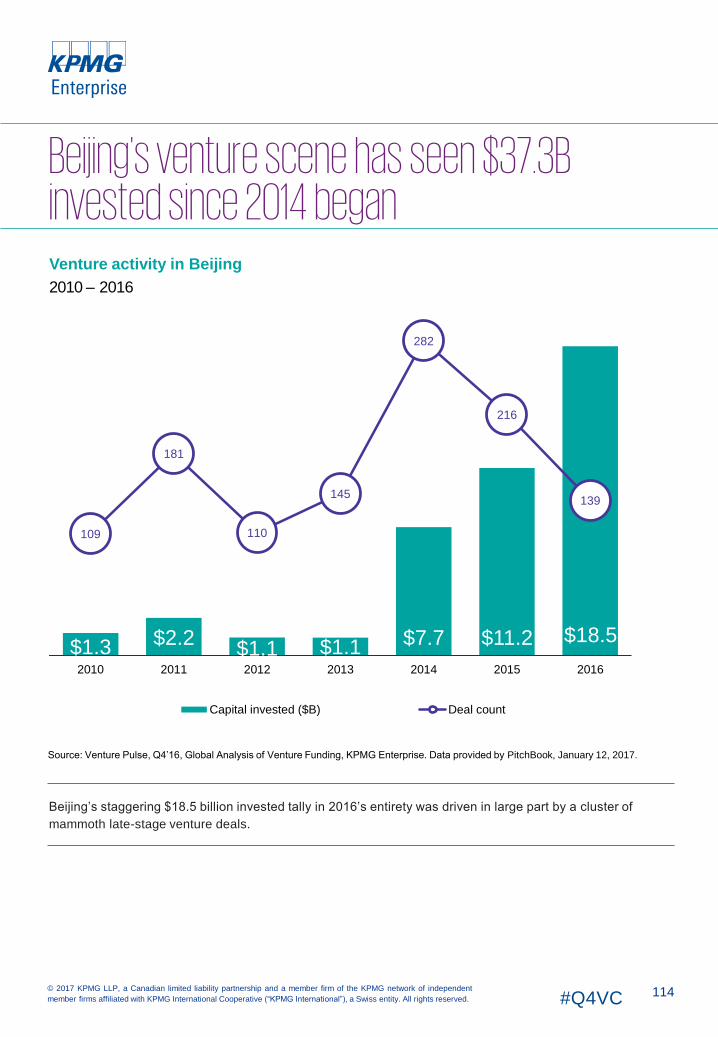
114#Q4VC© 2017 KPMG LLP, a Canadian limited liability partnership and a member firm of the KPMG network of independent
member firms affiliated with KPMG International Cooperative (“KPMG International”), a Swiss entity. All rights reserved.
Beijing's venture scene has seen $37.3B invested since 2014 beganVenture activity in Beijing
2010 – 2016
Beijing’s staggering $18.5 billion invested tally in 2016’s entirety was driven in large part by a cluster of
mammoth late-stage venture deals.
$1.3 $2.2$1.1 $1.1 $7.7 $11.2 $18.5
109
181
110
145
282
216
139
2010 2011 2012 2013 2014 2015 2016
Capital invested ($B) Deal count
Source: Venture Pulse, Q4’16, Global Analysis of Venture Funding, KPMG Enterprise. Data provided by PitchBook, January 12, 2017.

Egidio ZarrellaClients and Innovation Partner,
KPMG Hong Kong
China is becoming a more mature economy.
We’re seeing it move from being heavily
reliant on agriculture and manufacturing to
an economy driven by innovation and
services. Over the next year, the world will
likely recognize how much artificial
intelligence (AI) is going to transform
everything we do. For example, the amount
being invested in AI in Asia is growing by the
day. 2017 will likely be the year investors will
look at AI and say, ‘if you’re not investing in
it, you’re missing the boat’.
““
115#Q4VC© 2017 KPMG LLP, a Canadian limited liability partnership and a member firm of the KPMG network of independent
member firms affiliated with KPMG International Cooperative (“KPMG International”), a Swiss entity. All rights reserved.

116#Q4VC© 2017 KPMG LLP, a Canadian limited liability partnership and a member firm of the KPMG network of independent
member firms affiliated with KPMG International Cooperative (“KPMG International”), a Swiss entity. All rights reserved.
First-time venture financings of companies in Asia
2010 – 2016
At 651, the total number of first-time financings of Asia companies declined to a 4 year low, yet not only was
the total invested the second-highest sum of the past 7 years, the record back-to-back period from 2014 to
2015 suggests cyclicality in part as well as the reversal in global investor sentiment as the primary drivers of
the drop more than anything else.
$1.5 $1.9 $1.6 $1.3 $2.8 $6.3 $4.0
371
530557
741
907 907
651
2010 2011 2012 2013 2014 2015 2016
Capital invested ($B) Deal count
The downturn in first-time financings even hit the Asia region
Source: Venture Pulse, Q4’16, Global Analysis of Venture Funding, KPMG Enterprise. Data provided by PitchBook, January 12, 2017.

117#Q4VC© 2017 KPMG LLP, a Canadian limited liability partnership and a member firm of the KPMG network of independent
member firms affiliated with KPMG International Cooperative (“KPMG International”), a Swiss entity. All rights reserved.
Venture-backed exit activity in the Asia region
2010 – 2016
The swift drop between 2015 and 2016 is hard to chalk up to any one primary factor or even set of factors,
apart from timing. The smaller the market, the more affected it is by timing. Hence, the 32.6% drop in exit
counts likely reflects mainly timing as well as a period of digestion for corporate acquirers interested in
purchasing Asia VC-backed holdings, in light of the steadily rising totals over the prior 3 years.
$7 $8$2
$8 $16 $12 $8
118
91 90
135
166
181
122
2010 2011 2012 2013 2014 2015 2016
Exit value ($B) Exit count
Asia exits slid after a recent peak
Source: Venture Pulse, Q4’16, Global Analysis of Venture Funding, KPMG Enterprise. Data provided by PitchBook, January 12, 2017.

118#Q4VC© 2017 KPMG LLP, a Canadian limited liability partnership and a member firm of the KPMG network of independent
member firms affiliated with KPMG International Cooperative (“KPMG International”), a Swiss entity. All rights reserved.
Venture-backed exit activity (#) by
type in the Asia region
2010 – 2016
Venture-backed exit activity ($B)
by type in the Asia region
2010 – 2016
0
20
40
60
80
100
120
140
160
180
200
2010 2011 2012 2013 2014 2015 2016
Strategic Acquisition Buyout IPO
Expectedly, corporate M&A drove $6.3B in 2016 exit value
$0.0
$2.0
$4.0
$6.0
$8.0
$10.0
$12.0
$14.0
$16.0
$18.0
2010 2011 2012 2013 2014 2015 2016
Strategic Acquisition
Buyout
IPO
Source: Venture Pulse, Q4’16, Global Analysis of Venture Funding, KPMG Enterprise. Data provided by PitchBook, January 12, 2017.

Paul FordPartner, Deal Advisory,
KPMG in Japan
Japanese companies remain leaders in
internal R&D, but some have struggled to
adapt to the rapid global pace of
commercial and business model
innovation. This is forcing a transition
towards a more open approach to
innovation, with companies increasingly
looking externally for new technologies
and business models that will help them
compete in a fast-moving global
marketplace.
““
119#Q4VC© 2017 KPMG LLP, a Canadian limited liability partnership and a member firm of the KPMG network of independent
member firms affiliated with KPMG International Cooperative (“KPMG International”), a Swiss entity. All rights reserved.

120#Q4VC© 2017 KPMG LLP, a Canadian limited liability partnership and a member firm of the KPMG network of independent
member firms affiliated with KPMG International Cooperative (“KPMG International”), a Swiss entity. All rights reserved.
Venture fundraising in the Asia region
2010 – 2016
Fundraising in the Asia region enjoyed a bit of a surge in terms of dedicated VC raised, even if total counts
remained steady. At $11.6 billion, the region has only seen 1 year that was more lucrative: 2011 at $12.5
billion in capital commitments.
$7 $12 $6 $2 $6 $9 $12
85
117
82
25
4348
44
2010 2011 2012 2013 2014 2015 2016
Capital raised ($B) Fund count
Fundraising activity chugs along, with a surge in VC raised
Source: Venture Pulse, Q4’16, Global Analysis of Venture Funding, KPMG Enterprise. Data provided by PitchBook, January 12, 2017.

121#Q4VC© 2017 KPMG LLP, a Canadian limited liability partnership and a member firm of the KPMG network of independent
member firms affiliated with KPMG International Cooperative (“KPMG International”), a Swiss entity. All rights reserved.
Venture fundraising (#) by size in the
Asia region
2010 – 2016
First-time vs. follow-on venture funds
(#) in the Asia region
2010 – 2016
0%
10%
20%
30%
40%
50%
60%
70%
80%
90%
100%
201
0
201
1
201
2
201
3
201
4
201
5
201
6
Under $50M $50M-$100M $100M-$250M
$250M-$500M $500M-$1B $1B+
0%
10%
20%
30%
40%
50%
60%
70%
80%
90%
100%
201
0
201
1
201
2
201
3
201
4
201
5
201
6
First-time Follow-on
The trend toward larger funds is impacting Asia as well
Source: Venture Pulse, Q4’16, Global Analysis of Venture Funding, KPMG Enterprise. Data provided by PitchBook, January 12, 2017.

Lyndon FungUS Capital Markets Group,
KPMG China
In China, there is a lot of opportunity for
entrepreneurs with creative solutions and
business models to implement and launch
their ideas to market quickly. Given the size
of the population, this is particularly attractive
to companies that can link their offerings to
consumer spending.
“ “
122#Q4VC© 2017 KPMG LLP, a Canadian limited liability partnership and a member firm of the KPMG network of independent
member firms affiliated with KPMG International Cooperative (“KPMG International”), a Swiss entity. All rights reserved.

123#Q4VC© 2017 KPMG LLP, a Canadian limited liability partnership and a member firm of the KPMG network of independent
member firms affiliated with KPMG International Cooperative (“KPMG International”), a Swiss entity. All rights reserved.
Yixia – $500M, Beijing
Online fashion & e-commerce
Series E
51credit – $394M, Beijing
Online credit marketplace
Series C
Innovent Biologics – $260M, Suzhou
Pharma & biotech
Series D
Yiguo– $200M, Shanghai
Food products & e-commerce
Series C
Xueleyen – $200M, Hsinchu
Online education platform
Series C
7
8
6
9
105
4
3
2
1 Yunmanman – $160M, Shanghai
Mobile logistics
Series D
Ofo – $130M, Beijing
Bikesharing platform
Series C
Sensetime – $120M, Beijing
AI & Big Data analytics
Series B
Changing Education – $118M,
Guangzhou
Online teaching platform
Series C
Huochebang – $115M, Guiyang
Logistics & shipping
Series B1
China accounts for top Q4 deals in Asia
10
7
6
3
8
5
4
9
21
Top 10 financings in Q4 2016 in Asia
Source: Venture Pulse, Q4’16, Global Analysis of Venture Funding, KPMG Enterprise. Data provided by PitchBook, January 12, 2017.

124#Q4VC© 2017 KPMG LLP, a Canadian limited liability partnership and a member firm of the KPMG network of independent
member firms affiliated with KPMG International Cooperative (“KPMG International”), a Swiss entity. All rights reserved.
KPMG Enterprise Innovative Startup Network. From seed to speed, we’re here throughout your journey
Contact us:
Brian Hughes
Co-Leader, KPMG Enterprise
Innovative Startups Network
Arik Speier
Co-Leader, KPMG Enterprise
Innovative Startups Network

125#Q4VC© 2017 KPMG LLP, a Canadian limited liability partnership and a member firm of the KPMG network of independent
member firms affiliated with KPMG International Cooperative (“KPMG International”), a Swiss entity. All rights reserved.
About KPMG Enterprise
You know KPMG, you might not know KPMG Enterprise.
KPMG Enterprise advisers in member firms around the world are dedicated to working with businesses
like yours. Whether you’re an entrepreneur looking to get started, an innovative, fast growing company, or
an established company looking to an exit, KPMG Enterprise advisers understand what is important to you
and can help you navigate your challenges — no matter the size or stage of your business. You gain
access to KPMG’s global resources through a single point of contact — a trusted adviser to your company.
It’s a local touch with a global reach.
The KPMG Enterprise Global Network for Innovative Startups has extensive knowledge and experience
working with the startup ecosystem. Whether you are looking to establish your operations, raise capital,
expand abroad, or simply comply with regulatory requirements — we can help. From seed to speed, we’re
here throughout your journey.
The Pulse of Fintech…..coming soonThe VC market globally is dynamic and ever changing. Technology companies looking to attract
investment reflect a myriad of sectors, products and solutions. In today’s technology-centric society,
however, one sector stands apart: Fintech. Globally, fintech innovators are changing the very foundation
of how business works and are enabling incumbent financial institutions. Every day, new fintech
companies are finding ways to make banking, financial and insurance services more personalized,
smarter and faster. Fintech solutions have the potential to reach every market sector, business, and
consumer on the planet. The opportunities fintech offers are significant – and investors know it. That’s
why KPMG International created the Pulse of Fintech Report. Every quarter, we bring you insights on the
fintech deals and trends making headlines. Our annual summary and Q4’16 report will be released soon.
If you wish to join the Pulse of Fintech subscription list, contact us at [email protected].
About KPMG Enterprise

126#Q4VC© 2017 KPMG LLP, a Canadian limited liability partnership and a member firm of the KPMG network of independent
member firms affiliated with KPMG International Cooperative (“KPMG International”), a Swiss entity. All rights reserved.
We acknowledge the contribution of the following individuals who assisted in the
development of this publication:
Dennis Fortnum, Global Chairman, KPMG Enterprise, KPMG International
Brian Hughes, Co-Leader, KPMG Enterprise Innovative Startups Network, and National Co-Lead Partner,
KPMG Venture Capital Practice, KPMG in the US
Arik Speier, Co-Leader, KPMG Enterprise Innovative Startups Network, and Head of Technology, KPMG
in Israel
Ali Geramian, Manager, KPMG Innovation Lab, KPMG in the US
Anna Scally, Partner, Head of Technology, Media and Telecommunications, KPMG in Ireland
Conor Moore, National Co-Lead Partner, KPMG Venture Capital Practice, KPMG in the US
Egidio Zarrella, Clients and Innovation Partner, KPMG Hong Kong
François Bloch, Partner, Head of Innovative Startups, KPMG in France
Gerardo Rojas, Head of Deal Advisory, KPMG in Mexico
Jonathan Lavender, Principal, Head of Markets, KPMG in Israel
Lindsay Hull, Senior Marketing Manager, KPMG Enterprise Global Innovative Startups Network, KPMG in
the US
Lyndon Fung, US Capital Markets Group, KPMG China
Melany Eli, Global Head of Marketing and Communications, KPMG Enterprise, KPMG International
Oliver Cunningham, Partner, KPMG in Brazil
Olivier Trave Bourely, Partner, KPMG in Brazil
Patrick Imbach, Co-Head of KPMG Tech Growth, KPMG in the UK
Paul Ford, Partner, Deal Advisory, KPMG in Japan
Philip Ng, Head of Technology, KPMG China
Sreedhar Prasad, Partner, Internet Business and Startups, KPMG in India
Sunil Mistry, Partner, KPMG Enterprise, Technology, Media and Telecommunications, KPMG in Canada,
Tim Dümichen, Partner, KPMG in Germany
Acknowledgements

127#Q4VC© 2017 KPMG LLP, a Canadian limited liability partnership and a member firm of the KPMG network of independent
member firms affiliated with KPMG International Cooperative (“KPMG International”), a Swiss entity. All rights reserved.
KPMG has switched to PitchBook as the provider of venture data for the Venture
Pulse report. Due to differing methodologies between data providers, there may
be discrepancies between this and prior editions of the Venture Pulse report.
Fundraising
PitchBook defines venture capital funds as pools of capital raised for the purpose of investing in the equity
of startup companies. In addition to funds raised by traditional venture capital firms, PitchBook also
includes funds raised by any institution with the primary intent stated above. Funds identified as growth-
stage vehicles are classified as PE funds and are not included in this report. A fund’s location is
determined by the country in which the fund is domiciled, if that information is not explicitly known, the HQ
country of the fund’s general partner is used. Only funds based in the US that have held their final close
are included in the fundraising numbers. The entirety of a fund’s committed capital is attributed to the year
of the final close of the fund. Interim close amounts are not recorded in the year of the interim close.
Deals
PitchBook includes equity investments into startup companies from an outside source. Investment does
not necessarily have to be taken from an institutional investor. This can include investment from individual
angel investors, angel groups, seed funds, venture capital firms, corporate venture firms, and corporate
investors. Investments received as part of an accelerator program are not included, however, if the
accelerator continues to invest in follow-on rounds, those further financings are included. All financings are
of companies headquartered in the US.
Angel/seed: PitchBook defines financings as angel rounds if there are no PE or VC firms involved in the
company to date and it cannot determine if any PE or VC firms are participating. In addition, if there is a
press release that states the round is an angel round, it is classified as such. If angels are the only
investors, then a round is only marked as seed if it is explicitly stated.
Early-stage: Rounds are generally classified as Series A or B (which PitchBook typically aggregates
together as early-stage) either by the series of stock issued in the financing or, if that information is
unavailable, by a series of factors including: the age of the company, prior financing history, company
status, participating investors, and more.
Late-stage: Rounds are generally classified as Series C or D or later (which PitchBook typically
aggregates together as late-stage) either by the series of stock issued in the financing or, if that
information is unavailable, by a series of factors including: the age of the company, prior financing history,
company status, participating investors, and more.
Growth equity: Rounds must include at least one investor tagged as growth/expansion, while deal size
must either be $15 million or more (although rounds of undisclosed size that meet all other criteria are
included). In addition, the deal must be classified as growth/expansion or later-stage VC in the PitchBook
Platform. If the financing is tagged as late-stage VC it is included regardless of industry.
Methodology

128#Q4VC© 2017 KPMG LLP, a Canadian limited liability partnership and a member firm of the KPMG network of independent
member firms affiliated with KPMG International Cooperative (“KPMG International”), a Swiss entity. All rights reserved.
Also, if a company is tagged with any PitchBook vertical, excepting manufacturing and infrastructure, it is
kept. Otherwise, the following industries are excluded from growth equity financing calculations: buildings
and property, thrifts and mortgage finance, real estate investment trusts, and oil & gas equipment, utilities,
exploration, production and refining. Lastly, the company in question must not have had an M&A event,
buyout, or IPO completed prior to the round in question.
Corporate venture capital: Financings classified as corporate venture capital include rounds that saw both
firms investing via established CVC arms or corporations making equity investments off balance sheets or
whatever other non-CVC method actually employed.
Exits
PitchBook includes the first majority liquidity event for holders of equity securities of venture-backed
companies. This includes events where there is a public market for the shares (IPO) or the acquisition of
the majority of the equity by another entity (corporate or financial acquisition). This does not include
secondary sales, further sales after the initial liquidity event, or bankruptcies. M&A value is based on
reported or disclosed figures, with no estimation used to assess the value of transactions for which the
actual deal size is unknown.
Methodology, cont’d

The information contained herein is of a general nature and is not intended to address
the circumstances of any particular individual or entity. Although we endeavor to
provide accurate and timely information, there can be no guarantee that such
information is accurate as of the date it is received or that it will continue to be
accurate in the future. No one should act on such information without appropriate
professional advice after a thorough examination of the particular situation.
© 2017 KPMG LLP, a Canadian limited liability partnership and a member firm of the
KPMG network of independent member firms affiliated with KPMG International
Cooperative (“KPMG International”), a Swiss entity. All rights reserved.
The KPMG name and logo are registered trademarks or trademarks of KPMG
International.
kpmg.ca/enterprise
Contact usSunil MistryPartner, AuditKPMG EnterpriseTechnology, Media & TelecomKPMG in Canada
T: 416-228-7052E: [email protected]