venture capital investment: the role of predator-prey
TRANSCRIPT

Venture Capital Investment: The Role of Predator-Prey Dynamics with Learning by Doing
James A. Brander and Jean-Etienne de Bettignies
Sauder School of Business University of British Columbia
June 2007
Abstract:
This paper suggests that endogenous dynamics of the “predator-prey” type can provide a
contributing explanation for both high venture capital concentration by industry and “boom and
bust” industry-level investment dynamics. We propose a model based on the idea that venture
capitalists favor industries where they have significant experience and industries with a large pool
of good investment opportunities. However, investment “uses up” opportunities and therefore tends
to deplete the pool of unexploited opportunities. The resulting industry-level interactive dynamics
naturally give rise to venture capital investment cycles similar to observed patterns.
JEL Classification codes: G24, M21 keywords: venture capital, dynamics, predator-prey, concentration, learning
James A. Brander Sauder School of Business University of British Columbia Vancouver, BC V6T 1Z2 Canada email: [email protected]; tel: (604) 822-8483 Jean-Etienne de Bettignies (Corresponding Author) Sauder School of Business University of British Columbia Vancouver, BC V6T 1Z2 Canada email: [email protected]; tel: (604) 822-8481 Acknowledgement: We thank the editor and two anonymous referees for very helpful comments. We are also very appreciative of comments from colleagues at the University of British Columbia. The authors are associated with the Entrepreneurship Research Alliance and gratefully acknowledge financial support from Social Sciences and Humanities Research Council (SSHRC) MCRI grant 412-98-0025.

1
1. Introduction One striking fact about venture capital is its extraordinary concentration by industry. For
example, in 2006, approximately 20% of all venture capital invested in the United States went into
the software industry despite the fact that software, very broadly defined, accounted for under 3%
of GDP.1 Similarly, biotechnology and telecommunications also receive disproportionately large
shares of venture capital. Other industries such as finance, general manufacturing, and retailing
receive correspondingly small amounts of venture capital.
At first glance, this concentration of venture capital by industry might seem unsurprising and
readily explained. What is more surprising and harder to explain, however, is the dramatic variation
over time in the importance of different sectors. For example, over the 1995-2007 period, the share
of software in venture capital investment varied between 12% (in the 1st quarter of 1995) and over
28% (in the 4th quarter of 2001). Biotech and medical devices went through an even stronger cycle,
with a share of about 25% in the first quarter of 1995, dropping to under 5% in the 3rd quarter of
2000, and recovering to over 25% by mid-2002. Relatively little attention has been paid to this
striking time series variation in concentration.
It is natural to explain both the concentration of venture capital and its variation over time on
the basis of various factors that affect differential profit opportunities by industry but are exogenous
to specific venture capitalists (VCs). Such factors might include the rate of scientific progress in
different areas, the nature of exit opportunities, the structure of regulation and taxation, etc. The
importance of such factors has been the focus of significant attention in the venture capital
literature. In this paper, however, we take a different approach. Specifically, we ask whether the
“boom and bust” aspect of industry-level venture capital investment shares might be generated in
part by learning by doing on the part of venture capitalists. If so, we could think of such cyclical
1 Venture capital data reported here is from PWCMoneytree, available online at www.pwcmoneytree.com (accessed May 2007). GDP data is available online from the U.S. Department of Commerce Bureau of Economic Analysis at www.bea.doc.gov and from the U.S. census at www.census.gov.

2
dynamics as being endogenously generated within the venture capital sector rather than being the
product of cyclical changes in exogenous factors.
Accordingly, the primary objective of this paper is to offer a formal theory of venture
capital investment based on venture capitalist experience or “learning by doing”. We seek to
demonstrate that such a theory is consistent with both the persistent concentration of venture capital
in a few industries and the cyclical pattern of venture capital shares by industry. A second objective
is to offer a partial explanation of the dramatic boom and bust in venture capital investment
surrounding the turn of the 21st century.2 While often attributed to the rise and fall of high
technology stock prices over the same period, the venture capital investment pattern could be
explained in part by the endogenous dynamics that underlie industry level cycles in VC investment.
In focusing on endogenous industry-level investment dynamics based on learning by
venture capitalists we in no way wish to ignore or discount important exogenous determinants of
venture capital investments of the type mentioned earlier. Our contribution is to suggest that, in
addition to these (and other) factors that are largely exogenous to individual venture capital firms, it
is possible that endogenous dynamics might also play an important role.
In addition to learning, we also focus on two other considerations. One consideration is a
potential countervailing force to VC learning. Specifically, when a specific area receives a large
amount of venture capital this means that many promising opportunities are taken, leaving fewer
good opportunities for other venture capitalists. Thus high levels of venture capital investment in a
particular area tend to deplete the set of unexploited opportunities. The other factor we consider is
the natural growth of investment opportunities. We expect venture capital investment in areas
where new scientific and technological developments generate new investment opportunities at a
rapid rate. Even without exogenous changes or random shocks to other variables such a dynamic
2 As reported in PWCMoneytree (May, 2007), available online at www.pwcmoneytree.com, annual venture capital investment in the U.S. grew by a factor of 5 between 1995 and 2000 and then fell by approximately 80% to the 2003 trough before a slow recovery began.

3
system might well generate the “boom and bust” dynamics and the concentration by industry that
are observed in venture capital investment.
Learning by doing, exhaustion of investment opportunities, and natural growth of investment
opportunities are not unique to venture capital. Most financial markets are affected by such
considerations. However, we suggest that these factors are particularly significant in venture
capital. This applies especially to learning by doing.
VCs are often involved with the management of their client firms. VCs help startups find
alternative equity financing (Gorman and Salhman, 1989; Erhlich et al., 1994), key management
personnel (Hellmann and Puri, 2002), and candidates for licensing or acquisitions (Gans et al.,
2002). They also reduce the time required to bring products to market (Hellmann and Puri 2000),
increase the likelihood of an IPO (Hsu, 2006a), provide certification (Megginson and Weiss, 1991;
Hsu, 2004), and improve governance structures (Hochberg, 2005). We expect that the impact of
these value-added services on firm profits and ultimately on VC profits depends in part on VC
experience. It therefore seems plausible that experience should have a positive impact on VC
investment and performance.
There is a significant literature documenting the importance of such experience effects3,
including accounts of interviews with venture capitalists. When queried about the highly
concentrated pattern of venture capital, respondents commonly suggest that VCs favor certain
industries because of their prior experience and hence high value-added in those areas. A venture
capital manager quoted in Wüstenhagen and Teppo (2004, p. 28) states that “[p]eople tend to invest
in technologies they know .... [a]nd most of the funds have people that come from ... IT, telecom or
life sciences”. See also Cumming (2005) for a discussion of learning by VCs.
This experience effect is consistent with recent empirical work documenting the positive
impact of venture capitalists’ industry experience on investment (Sorenson and Stuart, 2001;
3 Entrepreneurs’ experience also plays a role in startups. See, e.g. Hsu (2006b), who finds that founder experience increases venture valuation.

4
Gompers et al., 2005) and the positive relationship between VC experience and performance in
venture capital investment (Sorenson and Stuart, 2001; Kaplan and Schoar, 2005; Kaplan et al.,
2006; Gompers et al., 2005; Hochberg et al., 2006; Sorensen, 2007). As documented in Lindsey
(2002), venture capitalists also take advantage of their experience by facilitating collaborations
among their portfolio firms, who then benefit from a “keiretsu” effect.
Our paper is also related to a recent strand in the literature that examines the key factors
affecting venture capital activity.4 Such factors might include VC efficiency in selecting and
monitoring investments relative to other types of investors (Amit et al. 1998), the availability of
IPOs as exit options for VCs (Jeng and Wells, 2000), firms’ ability to appropriate (part of) the
marginal social product of their innovations (Gans and Stern, 2003), the liquidity of stock markets
and the stock of human capital in the economy (Schertler, 2003), returns to venture capital
investments (Inderst and Müller, 2004), and the legal environment (Megginson, 2004).
Overall, this literature suggests that cross-industry and temporal variations in VC activity
would normally result from variations in exogenous factors of the type described in the previous
paragraph. For example, Amit et al. (1998) provides a static agency model in which, if extended to
a dynamic framework, variation in venture capital investment would most naturally arise from
differences in the degree of information asymmetry between the entrepreneur and the VC. In Gans
and Stern (2003), venture capital fluctuations can be explained by the degree of appropriability of
inventions and other exogenous factors. Even in dynamic models such as in Inderst and Müller
(2004), an increase in returns to venture capital yields a one-time increase in long-term venture
capital activity through entry of firms in the industry, but not to multiple investment cycles.5
4 There is a large general literature on venture capital that we not review here. Useful background is covered in Gompers and Lerners (1999) and in Wright, Sapienza and Busenitz (2003). An influential analysis of VC contracts is in Kaplan and Strömberg (2003). See Bottazzi et al. (2004) for analysis of the European venture capital industry and Dosi (1988) for an overview of the effects of innovation. 5 Similarly in the herding literature, a single, exogenous, positive (negative) shock leads to a “cascading” increase (decrease) in activity/investment, but not to cyclical behavior. See for example Banerjee (1992), Bikhchandani et al. (1992), and Scharfstein and Stein (1990).

5
Notwithstanding the literature noting the importance of VC experience and the literature
addressing VC investment patterns, we believe that this paper offers a unique and interesting
contribution. Specifically, our contribution is to propose a formal model of cyclical dynamics in
which cross-industry and temporal variations in venture capital activity emerge endogenously as a
result of learning by doing, the impact of investment on unexploited opportunities, and the natural
growth of the opportunity pool, rather than from successive exogenous perturbations. While we are
certainly not the first researchers to emphasize the importance of learning by doing for venture
capitalists, we believe that we are the first to demonstrate that experience effects might naturally
lead to industry-level venture capital investment cycles.
A central component of this contribution arises from our application of the traditional Lotka-
Volterra biological predator-prey model to venture capital investment. This model was originally
used to explain otherwise very puzzling cycles in wildlife populations. We use the model to explain
otherwise puzzling cycles in venture capital investment concentration. The structure of predator-
prey models is clearly presented in standard textbooks on differential equations, such as Boyce and
de Prima (2005). Such models have been applied to other areas of economics, including renewable
natural resources (Brander and Taylor, 1998; Pezzey and Anderies, 2003), the economics of the
environment and optimal harvesting rates (Hoekstra and van den Bergh, 2005), and labor
economics and union bargaining (Kremer and Olken, 2006). Our model is novel in expanding the
application of the Lotka-Volterra structure to a new area, namely venture capital investment. It
generates interesting and plausible dynamic behavior, and we hope that it offers a new and useful
perspective on entrepreneurial finance more broadly. Specifically we suggest that the observed
cycle in VC investment concentration by industry might be viewed as arising from the transitional
dynamics associated with the Lotka-Volterra model.
Section 2 provides a brief description of the empirical regularities that we wish to explain.
Section 3 sets out our formal model and Section 4 provides an analysis of the steady state and
transitional dynamic properties of the model. Section 5 is devoted to simulation results showing that

6
the model is consistent with the major stylized facts regarding venture capital dynamics. Section 6
contains concluding remarks. Appendix 1 provides a detailed discussion of the data underlying our
reported stylized facts. Appendix 2 provides a formal statement and proof of some of the more
technical results in the paper.
2. Data Description
We highlight three important empirical regularities regarding venture capital. First, Figure 1
shows the evolution of quarterly venture capital investment in the United States from the first
quarter of 1995 through the first quarter of 2007. The figure also shows total investment and
investment in the three major recipient industries of venture capital (Biotech and Medical Devices,
Software, and Telecommunications and Networking).
Figure 1: Quarterly VC Investment By Industry and Total: Q1, 1995 – Q1, 2007.
0
5
10
15
20
25
30
1995
-1
1995
-4
1996
-3
1997
-2
1998
-1
1998
-4
1999
-3
2000
-2
2001
-1
2001
-4
2002
-3
2003
-2
2004
-1
2004
-4
2005
-3
2006
-2
2007
-1
Quarter
US
VC
Inv
estm
ent i
n $B
Biotech/MDSoftwareTelecom/NWTotal
Source: PWCMoneytree.com, accessed May 2007
Figure 1 shows a dramatic boom and bust pattern. Venture capital investment peaked in the
first quarter of 2000 at about $28.4 billion. By the first quarter of 2003 venture capital investment
had fallen to about $4.3 billion – a drop of about 85% and similar to the $4.1 billion reported in the
first quarter of 1998. The number of investments or “deals” (not shown) did not show quite as
dramatic a rise and fall, implying that the peak period for venture capital investment was

7
characterized by higher average deal sizes as well as more deals. Even so, the pattern of deals
displays a very marked boom and bust in itself.
The three specific industries shown in Figure 1 together received a large share of total
venture capital investment, about 60% over the full period shown. This reflects the second major
empirical regularity – the striking concentration of venture capital in a few industries. Table 1
illustrates this fact by showing the share of venture capital investment received by each sector in
20026 and the corresponding share of GDP by sector.
Table 1: Venture Capital Shares and GDP shares by industry (2002) (VC investment and GDP are in $billions)
Industry VC Invest VC
Share GDP GDP share
VC Share to GDP Share
1 Biotechnology & Med. Equip. 3.18 14.6% 227 2.2% 6.73 2 Business Prod. & Serv. 0.52 2.4% 986 9.4% 0.25 3 Computers and Peripherals 0.45 2.1% 99 0.9% 2.19 4 Consumer Prod. & Serv. 0.24 1.1% 383 3.7% 0.30 5 Electronics/Instrumentation 0.30 1.4% 116 1.1% 1.24 6 Financial Services 0.35 1.6% 2126 20.3% 0.08 7 Healthcare Services 2.22 10.2% 702 6.7% 1.52 8 IT Services 1.06 4.9% 43 0.4% 11.88 9 Industrial/Energy 0.72 3.3% 1860 17.7% 0.19
10 Media & Entertainment 0.74 3.4% 119 1.1% 2.98 11 Retailing/Distribution 0.16 0.7% 1333 12.7% 0.06 12 Semiconductors 1.55 7.1% 61 0.6% 12.22 13 Software 5.21 23.9% 313 3.0% 7.99 14 Telecomm. & Networking 5.10 23.4% 321 3.1% 7.63 15 Undisclosed/Other 0.02 0.1% 1792 17.1% 0.01
Totals 21.84 100.0% 10481.00 100.0% 1.00 Sources: Venture capital data is from PWC Moneytree. GDP data is obtained from 2002 census-based GDP information available at www.census.gov. Details are in appendix 1.
Venture capital intensity is very high for biotechnology (including medical equipment), IT
services, semiconductors, software, and telecommunications (including networking). For these
industries the ratio of the venture capital share to the GDP share exceeds 6. Major traditional
industries, on the other hand, received much less than their GDP-based “share” of venture capital.
Admittedly, this partially reflects the fact that established industries have more access to other
6 We use 2002 as it is the most recent year for which sufficiently disaggregated GDP data is available. Another disaggregated GDP census will be done for the 2007 year.
8
forms of finance, as is consistent with their risk and information characteristics. Even so, the high
concentration of venture capital in certain industries is noteworthy.
What is much less well-known than the overall boom and bust in venture capital investment
- and this is our third important empirical regularity - is that the relative importance of the different
sectors as recipients of venture capital exhibits a marked cyclical pattern. It is hard to see the
relative cycle across industries in Figure 1 given the dominant visual effect of the aggregate cycle.
However, the relative cycle is evident in Figure 2, which shows the share of venture capital
investment received by the three large recipient industries.
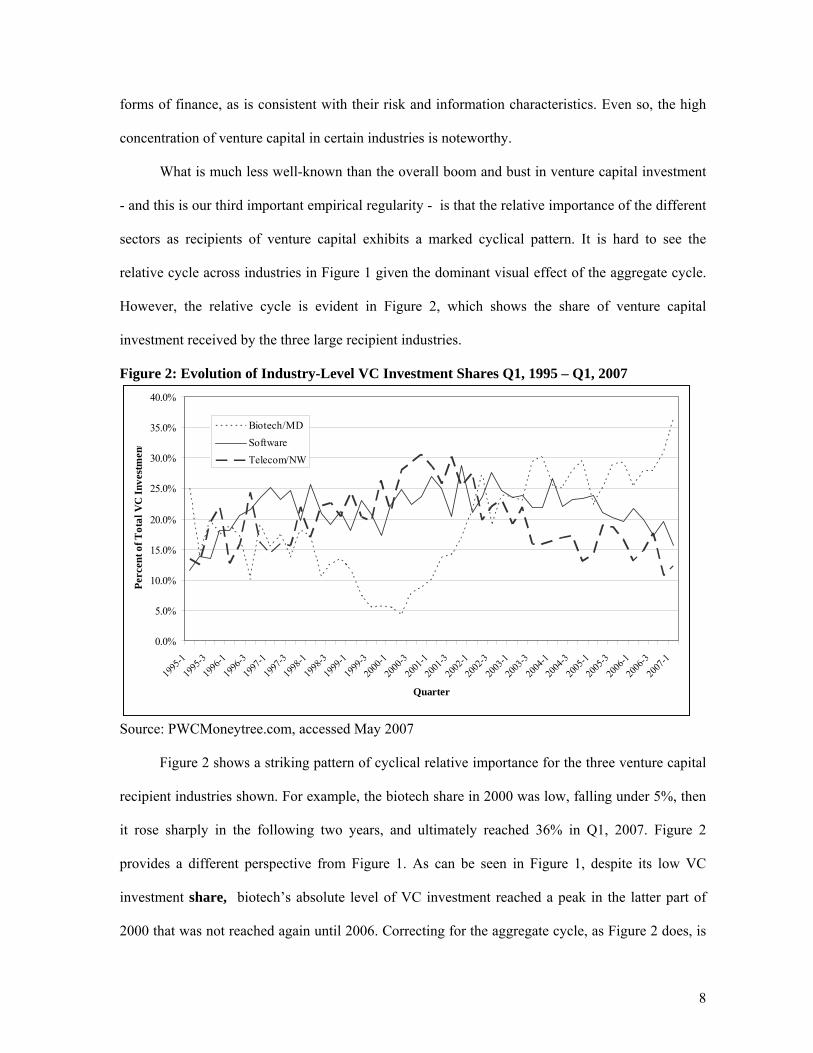
Figure 2: Evolution of Industry-Level VC Investment Shares Q1, 1995 – Q1, 2007
0.0%
5.0%
10.0%
15.0%
20.0%
25.0%
30.0%
35.0%
40.0%
1995
-1
1995
-3
1996
-1
1996
-3
1997
-1
1997
-3
1998
-1
1998
-3
1999
-1
1999
-3
2000
-1
2000
-3
2001
-1
2001
-3
2002
-1
2002
-3
2003
-1
2003
-3
2004
-1
2004
-3
2005
-1
2005
-3
2006
-1
2006
-3
2007
-1
Quarter
Perc
ent o
f Tot
al V
C In
vest
men
t
Biotech/MDSoftwareTelecom/NW
Source: PWCMoneytree.com, accessed May 2007 Figure 2 shows a striking pattern of cyclical relative importance for the three venture capital
recipient industries shown. For example, the biotech share in 2000 was low, falling under 5%, then
it rose sharply in the following two years, and ultimately reached 36% in Q1, 2007. Figure 2
provides a different perspective from Figure 1. As can be seen in Figure 1, despite its low VC
investment share, biotech’s absolute level of VC investment reached a peak in the latter part of
2000 that was not reached again until 2006. Correcting for the aggregate cycle, as Figure 2 does, is

9
an important part of understanding VC investment dynamics.
The three stylized facts illustrated above may be attributable to exogenous factors such as,
for example, the boom and bust cycle that characterized high technology stock prices over the past
decade. However, in the model that follows we suggest that these empirical regularities might arise
even without changes in exogenous factors, as they may also result in part from the endogenous
dynamics of industry level venture capital investment
3. The Model
The starting point of our formal analysis is the decision problem faced by venture capitalists.
A representative VC is assumed to be risk neutral and is assumed to maximize the expected present
value of profits associated with current investment decisions. At the beginning of any given time
period, the choice to be made by the VC is the amount of investment, vi, to be allocated to each
industry i during that period. A VC might specialize fully in one industry but, more generally,
might have investments in a range of industries. We write this aggregate expected present value for
a given venture capitalist as
π = Σπi (vi;xi,Pi,Zi) (1)
where πi is the venture capitalist’s (expected present value of) profit from its investment, vi, in
industry i. This industry-specific profit, πi, depends in part on the industry-specific investment
level, vi. It also depends in part on the venture capitalist’s prior experience in this industry, denoted
xi, and on the pool of investment projects available in industry i, denoted Pi.
Variable Zi represents a vector of other exogenous influence on profits, such as interest rates,
demand conditions, etc. The VC’s decision problem is implicitly a dynamic problem as the decision
of how much to invest must be repeated each period. Maximization of (1) is therefore repeated each
period. For our purposes, it is sufficient to characterize formally the decision for one particular time
period, recognizing that the VC looks forward and determines an expected present value associated
with current decisions. Maximization of (1) with respect to the industry-specific investments v1, v2,

10
...vn implies that the firm’s optimal investment in any one industry will depend on the
predetermined or exogenous variables xi and Pi. Thus we can write
vi = vi(xi,Pi,Zi) . (2)
Our assumption of risk neutrality implies that there is no risk aversion motive that would, in
itself, induce diversification across industries. In addition we assume that experience in industry i
improves profitability only in industry i; it does not improve profitability in other industries. Thus
there is no “economy of scope” that would in itself give rise to cross-industry diversification. A
venture capitalist might still have a diversified portfolio, but this would be a reflection of the
venture capitalist’s opportunities, cost of raising capital, experience, and value-added capability in
each industry taken independently. Abstracting from risk aversion and economies of scope across
industries is a significant abstraction, but it allows us to focus as clearly as possible on the reality
that high levels of specialization are important in venture capital finance.
To some extent the degree of specialization depends on whether the unit of analysis is the
venture capital firm or the venture capital fund. Typically a given venture capital firm might have
several funds, sometimes in different industries or sectors. Thus funds are more specialized than
firms. Typically each fund within a firm is managed independently with particular dedicated fund
managers. For our analysis it is probably appropriate to think of the unit of analysis as the fund
rather than the firm but this is not essential and we do not refer to this distinction further.
For the U.S. Hochberg et. al. (2005) report that 46.2% of venture capital funds focus on
computer-related companies, 18.9% on “non-high-technology,” 15.5% on communications and
media, and 9.2% on medical, health, and life sciences. Venture capital firms like Hummer
Windblad, and Tallwood – which focus exclusively on software and semiconductors, respectively –
are extremely specialized, while other VC firms have a more diversified approach. In any case, we
abstract from portfolio diversification issues. Incorporating such effects would not offset the issues
we emphasize here, but it would cloud the analysis by introducing more algebraic complication.
11
Our focus on learning is implemented by assuming that a given project in industry i will be
more profitable to the VC, other things equal, if the VC has more experience in that industry. VCs
are therefore more inclined to invest in industry i if they have more experience with that industry:
dvi/dxi > 0. At the time vi is determined, xi is predetermined or exogenous to the current decision.
Another very important consideration relates to the supply of available projects in the
potential investment pool. The pool of possible projects is driven in large part by underlying
scientific progress. At any one time we can imagine that there is a pool of not yet fully exploited
technologies applicable to a particular industry. The larger the pool, the better chance the firm has
of finding profitable projects to invest in. Venture capitalists are more inclined to invest if r if the
pool of investments is larger. Accordingly, dvi/dPi > 0.
The data that we discussed in Section 2 relates to industry-level investment dynamics, not to
investment dynamics at the level of the individual VC fund. Accordingly, we now focus on
aggregate investment in a given industry, which is the sum of investments of the individual funds.
We denote this aggregate investment as Vi and we denote aggregate experience as Xi. We assume
that this aggregation allows investment in industry i to be written as
Vi = Vi(Xi, Pi,, Zi) (3)
where dVi/dXi > 0 and dVi/dPi > 0.
Equation (3) has been derived on the assumption that, at any given time, risk neutral VCs
seek to maximize the present value of their investments. This allows VCs to anticipate the effect of
current experience on future profits. However, such an investment rule could arise from myopic
maximization of profits over some relatively short time horizon, or it could arise from some
objective other than strict profit maximization. The basic point is that a large range of plausible
descriptions of venture capitalist behavior would give rise to the result that industry-level
investment would be increasing in prior experience in industry i and in the pool of available
projects. It is not necessary for us to take a firm position of whether VCs undertake full dynamic

12
optimization or whether they adopt a more short-run horizon.7 It is challenging (albeit not
impossible) to think of any reasonable decision process that would not have the basic properties we
assume. Therefore we view our approach as relatively general as far as assumptions about venture
capitalist motivation and foresight are concerned.
It is helpful to assume a specific functional form for equation (3). This form is intended to be
illustrative rather than universal. Other plausible functional forms would have similar properties.
Furthermore, we now focus on one industry at a time and therefore drop the subscript i, so as keep
notation as simple as possible. Also, while noting that exogenous factors captured in Z (such as
interest rates, etc.) are relevant to profitability, they are not the focus of our analysis. We therefore
drop Z from further consideration. We suggest a Cobb-Douglas form for investment. Accordingly,
investment V in industry i is given by
V = αXβP. (4)
Equation (4) indicates that investment opportunities are essential if investment is to occur. If
there are no opportunities (i.e. if P = 0) then investment is zero, which is a desirable property.8
There are constant returns to opportunities in that if opportunities double, so does investment.
However, there are decreasing returns to experience as reflected by β, which we assume is less than
1 but strictly positive. The stock of relevant experience depreciates over time and at some point
previous experience with earlier technology might become irrelevant altogether. The depreciation
rate is denoted δ. The equation of motion for the stock of relevant experience is therefore
dX/dt = V – δX (5)
= αXβP – δX
The stock of exploitable opportunities, P, also evolves over time. As venture capitalists
invest in a specific venture, that particular opportunity is taken out of the pool of unexploited 7 Klepper (1996) analyzes a related context in which firms maximize short-term profits rather than undertake full dynamic maximization. A useful argument in favor of this assumption is provided on p. 580. 8 Investment is also zero if experience is zero, which we view as undesirable. However, the model is essentially the same, with more complicated algebra, if we use (1+X) rather than just X in equation (4), which allows for positive investment even if venture capitalists have no experience in this industry.

13
opportunities.9 We can think of venture capitalists as “predators” and investment opportunities as
“prey”. This predator-prey effect implies that the pool of opportunities is decreasing in V. However,
this pool is also subject to natural proportional growth at rate ρ reflecting underlying scientific and
technological progress. The combination of depletion due to current investment and natural growth
at proportional rate ρ leads to the following equation of motion for the pool of resources.
dP/dt = ρP − V (6)
= ρP − αXβP
The stock of experience and the pool of investment opportunities can therefore be thought of as
two state variables in a 2-equation dynamic system with “equations of motion” given by (5) and (6).
Even this simplified representation of venture capital investment can generate interesting
dynamic behavior that is consistent with observed patterns. We analyze this system formally in the
next section, but we first illustrate the evolution of the system for plausible parameter values.
Specifically, if we normalize the two state variables (experience and opportunities) to start at 50
and 100 respectively, if parameter α = .001, if β = .9, if opportunity growth, ρ, is 5% per period,
and if depreciation, δ, is also 5% per period, the pattern shown in Figure 3 arises.
Figure 3: Venture Capital Dynamics at the Industry Level
0
20
40
60
80
100
120
140
0 9 18 27 36 45 54 63 72 81 90 99 108
117
126
135
144
153
162
171
180
189
198
Period
Exp
erienc
e an
d Opp
ortu
nite
0
1
2
3
4
5
6
7
8
Inve
stm
ent
ExperienceOpportunitesInvestment
9 We recognize that venture-funded firms often have several rounds of financing and more than one VC investor at any given round. Thus one firm has several “opportunities” associated with it. Each investment “uses up” one of these opportunities.

14
As can be seen from Figure 3, this set of parameter values generates a slightly damped pattern for
the two state variables (relevant experience and available opportunities) and for investment. Given
the difference in scale between investment and the state variables, we have illustrated investment on
a secondary vertical axis so as to see its variation clearly.
4. Analytical Properties of Venture Capital Dynamics
4.1 Steady State Analysis
In this section we undertake a formal analysis of the dynamic system set out in Section 3. It
is useful to restate the two equations of motion given by (5) and (6).
dX/dt = αXβP – δX (5')
dP/dt = ρP − αXβP (6')
The parameters are α, β, δ, and ρ. All are strictly positive, and β is taken to be less than 1. State
variables X and P are bounded from below by 0. The formal conditions we impose are as follows.
(C1) α, β, δ, and ρ > 0
(C2) β < 1
(C3) X, P ≥ 0
The dynamic system given by (5') and (6') has two steady states in state variables X (relevant
experience) and P (the pool of available opportunities). It is clear by inspection of (5') and (6') that
one steady state is the trivial steady state at (X,P) = (0,0). The other solution is readily obtained by
the following algebraic steps.
dP/dt = ρP − αXβP = 0
=> ρ = αXβ
=> X* = (ρ/α)1/β (7)
Setting dX/dt = 0 implies that αXβP – δX = 0, which in turn implies that P = (δ/α)X1-β. Substituting
X* = (ρ/α)1/β (from (7)) into this equation yields P* = (δ/α) (ρ/α)(1-β)/β , or
P* = (δ/ρ)(ρ/α)1/β (8)

15
It follows from condition (C1) that that X* and P* are both positive, so this is an interior solution.
If state variables X and P are in steady state, then equation (4) implies that investment V is
also in steady state. From (4), (7), and (8) (interior) steady state investment V is given by
V* = δ(ρ/α)1/β. (9)
The comparative steady state effects of changes in the exogenous parameters on investment are
obtained by differentiation of solution (9) for steady state investment. Specifically, the interior
steady state level of investment increases if i) experience depreciation rate δ increases, ii)
opportunity growth rate ρ increases, iii) investment parameter α decreases, or iv) the returns to
experience parameter β decreases.
Some comparative static properties of the steady state investment level are perhaps
surprising but they can be readily understood. Note first that in the steady state, the level of venture
capital investment V must exactly equal experience depreciation, δX. Looking back at (5'), one can
see that this is necessary for experience X to remain constant, a condition for steady state.
Therefore, an increase in δ must lead either to a decrease in the steady state level of experience X*,
or to an increase in the steady state level of investment, V*, or both. From (7) we know that X* is
independent of δ, and hence an increase in δ must be entirely compensated in steady state by an
increase in venture capital investment V*. The comparative steady state effect of increases in ρ is
very intuitive, as a higher natural growth rate of opportunities gives rise to a higher steady state
levels of experience opportunities. Investment is therefore also higher, as implied by (4).
The effect of changes in α is more surprising. Smaller values of α have the direct effect
(from (4)) of reducing investment. However, the indirect effects operating through the new steady
state values of P and X more than offset the direct effect, implying that steady state investment
increases when α decreases. The reasoning regarding changes in β is similar.
4.2 Transitional Dynamics
We would not normally expect conditions to remain stable long enough for a non-trivial
steady state to be closely approximated. We are therefore primarily interested in transitional

16
dynamics. We have in mind a system that starts out at initial conditions other than a steady state and
evolves toward the steady state until parameters change due to some exogenous shock, resulting in
a new steady state and a new trajectory of approach. The main characterization of the (local)
dynamic behavior of the system is reported in the following statements.
i) Venture capital dynamics in the neighborhood of the interior steady state may exhibit either
monotonic or cyclical behavior.
ii) Cyclical behavior arises if and only if
δ < 4ρβ/(1-β)2 . (10)
iii) For both cyclical and monotonic cases the system exhibits local convergence toward the interior
steady state. This steady state is therefore stable.
These statements are proven in Appendix 2. The associated dynamics can be illustrated using
a phase diagram, as shown in Figure 4. The illustrated trajectory starts in the lower right portion of
the phase plane and cycles toward the interior steady state. These dynamics apply only in the
strictly positive quadrant (i.e. where experience and investment opportunities are strictly positive)
and are “local” in the sense that they apply in the neighborhood of the interior steady state.
Figure 4: Cyclical Dynamics
X (Experience)
P
dP/dt = 0
dX/dt = 0
17
As can be seen from expression (10), lower values of experience depreciation make cyclical
behavior more likely. In other words, if learning by doing is important in the sense that experience
does not depreciate rapidly, then cycling is more likely. Similarly, inspection of expression (10)
combined with conditions (C1) and (C2) also indicates that cyclical patterns of venture capital
investment are favored if β is large (i.e. by weaker decreasing returns of investment to experience)
or if ρ is large (i.e. by more rapid proportional growth of opportunities).
The effect of δ can be understood by noting that if δ is small then experience accumulates
relatively rapidly, leading to high investment and rapid depletion of the pool of opportunities. This
depletion then leads to a small pool of remaining unexploited opportunities, which leads to low
investment, allowing the pool of opportunities to regenerate and giving rise to a cycle. If δ is large
then experience accumulates less rapidly and cycling is less inclined to arise.
Parameter β, which must lie between 0 and 1, also has an interesting effect. Higher levels of
β imply, other things equal, higher investment and more depletion of P, leading subsequently to low
investment and the resulting lower depletion rates as the system cycles toward a steady state. Lower
levels of β make this over-shooting less likely. The growth rate of opportunities, ρ, also has a
surprising effect. High growth rates do not lead to monotonic or explosive growth of opportunities.
Instead they have a strong indirect effect on investment, causing investment to grow rapidly,
inducing depletion of opportunities and, ultimately, a convergent cycle. The subtlety of these
effects illustrates the interesting and often surprising nature of interactive dynamics.
Our discussion so far applies to local behavior of the system given by (5') and (6') in the
neighborhood of the interior steady state. Global behavior of the linearized system is similar except
that we have to be concerned about hitting the horizontal axis (P=0), in which case the system will
converge toward the trivial steady state at the origin. We do not view this case as economically
meaningful, but we mention it for completeness.
The dynamics of the linearized system will approximate the dynamics of the full non-linear
system very closely in the neighborhood of the steady states (and are precisely correct

18
asymptotically). For points well away from the steady state the approximation is less precise.
However, our simulations of the full system indicate that the linearized system provides a
qualitatively correct and close quantitative approximation to the full non-linear system for a wide
range of possible starting points in the phase plane.
5. Simulations
We now demonstrate that the model described in Sections 3 and 4 is consistent with the three
major empirical facts illustrated in Section 2. The first stylized fact documented in Section 2 was
the aggregate venture capital cycle of the past 12 years. In Figure 5 we simulate cycles for three
industries and then add up the total investment to generate a cycle for total VC investment. The
industries are identical except that they start with different levels of associated VC experience. The
base case parameters are α = .001, β = 0.9, ρ = .05 and δ = .05. The two state variables - experience
and opportunities - are indexed to start at 50 and 100 respectively. This is the medium initial
experience case. The dashed line shows the pattern for an industry with low initial experience of 25.
The dotted line shows the “high” initial experience case in which initial experience is 100.
Figure 5: Total Investment and Effects of Different Initial Experience
0
5
10
15
20
25
0 20 40 60 80 100 120 140 160 180 200
Period
Inve
stm
ent
LowMedium (base)HighTotal
Figure 5 exhibits some very interesting properties. First, if we add up the investment levels
shown in Figure 5, it is clear that a strong aggregate cycle in venture capital investment emerges.

19
This is consistent with our first stylized fact in Section 2. In addition, Figure 5 shows that simple
and modest differences in the amount of initial relevant experience are sufficient to generate large
differences in venture capital investment across industries at any given point in time, which is
consistent with the second stylized fact illustrated in Section 2.
Figure 5 also illustrates the effects of differential experience. While high initial experience
gives rise to higher initial investment, these high investment levels are relatively short-lived. The
high experience sector attracts higher investment levels than the low experience sector only for a
short time. This is caused by the fact that the sector with high initial experience attracts high levels
of initial investment, but these high investment levels deplete the stock of available opportunities as
venture capitalists quickly “use up” many of the available opportunities.
One measure of the severity of the transition is the “standardized amplitude” of the cycle, as
given by the ratio of amplitude to frequency. In this case, lower initial experience is associated with
a steeper transition as measured by the standardized amplitude. Initial experience levels of 25, 50,
and 100 lead to standardized amplitudes of about 690, 270, and 250, respectively. All three
trajectories gradually approach the same steady state, but the rate of approach is slow enough that
the behavior of the system over relevant time horizons is dominated by cyclical (or oscillating)
adjustment.
Figure 6 illustrates the share of total investment for each of the three industries shown in
Figure 5. The cycling of industry shares is consistent with the third stylized fact of Section 2. It is
noteworthy that using only variation in the initial experiences of the venture capitalists, and not
exploiting any flexibility in other parameter values, it is possible to generate qualitatively similar
patterns to the actual venture capital investment. By using the available flexibility with other
parameters it is of course possible to replicate the actual patterns of investment even more closely.

20
Figure 6: Venture Capital Investment Shares
0.0%
10.0%
20.0%
30.0%
40.0%
50.0%
60.0%
70.0%
0 10 20 30 40 50 60 70 80 90 100
110
120
130
140
150
160
170
180
190
200
Period
Shar
e of
Inve
stm
ent
Low ExperienceHigh ExperienceMedium Experience
Our actual data, as shown in Figures 1 and 2, covers only 12 years, so it is difficult to draw
inferences about long run dynamics. Regrettably, reliable data before 1995 is not available. Still,
careful inspection of Figure 2 suggests that the relative share of each of the three industries
considered (Biotech, Software, and Telecom) has gone through approximately two full cycles over
this 12 year period. Our simulation in Figure 6, covering 200 “periods” covers approximately 2½
full cycles for each industry. Therefore, our simulation would approximate the data in Figures 1 and
2 if a simulation “period” were approximately one month.
One can also simulate (not shown) cross-industry differences in the growth rate of
opportunities. The standardized amplitude of the cycle is highest for industries with the highest
such growth rates. This suggests that industries like biotech, software, and telecommunications,
which presumably have high opportunity growth rates, would have stronger cycles in both absolute
and relative terms than other sectors. This is what we observe. In simulations, the high growth rate
industry has persistently high relative investments and the medium growth rate industry is
persistently intermediate, demonstrating the persistence effects emphasized in the introduction to
this paper. This is also consistent with the 2nd stylized fact in Section 2.

21
6. Discussion and Concluding Remarks:
The primary contribution of this paper is to present a model that can explain some of the
major characteristics of venture capital investment dynamics. This model can explain both high
investment concentration by industry and “boom and bust” industry-level investment dynamics
based primarily on the role of experience or learning by doing by venture capitalists. VCs favor
investing in industries where they have significant experience. However, the resulting high levels of
investment “use up” the available unexploited opportunities at a rapid rate and therefore tend to
deplete the pool of unexploited opportunities. This depletion effect tends to reduce subsequent
investment, allowing the pool of opportunities to be replenished through natural growth of
opportunities due to underlying scientific progress.
The dynamic interaction between experience and the pool of investment opportunities can,
for plausible parameter values, give rise to cyclical investment dynamics for a particular industry
and for venture capital investment as a whole. However, those industries with a faster natural
growth rate of opportunities will tend to have consistently higher venture capital investment rates
than other industries. While venture capital investment dynamics are also influenced by other
factors, we suggest that endogenous dynamics of the type demonstrated here are worthy of
emphasis in discussions of venture capital investment patterns.
One important insight of our analysis is that venture capital investment dynamics have
elements in common with classic predator-prey systems. Investment opportunities in a given
industry are like a particular species of prey. These opportunities are subject to natural growth but
can be depleted by the actions of a “predator”. In this case venture capitalists are the predators who,
when they make an investment, take that opportunity out of the pool of available investments and
therefore tend to deplete the pool. The predator-prey view of investment could provide at least a
partial explanation of the cycles that are often observed in investment behavior.
It would be valuable to distinguish empirically between endogenous dynamics of the
predator-prey type and exogenous shocks as an explanation of cycles. This is challenging, but if
22
models with endogenous dynamics were to perform well in a variety of investment contexts this
would increase our confidence in the relevance of the approach.
More sophisticated treatment of some of the simplifications we adopt, while beyond the
scope of the current paper, would be valuable. For example, we assume that VCs deplete the pool
of available opportunities when they make investments. Alternatively, venture capital investment
might induce a positive supply response: research that creates opportunities might be encouraged by
venture capital. This would give rise to a dynamic structure in which venture capital might be a
necessary catalyst for development of industry clusters which in turn generate more funds for
further venture capital investment. Such a structure could be captured by replacing (6) with the
equation of motion dP/dt = ρP + γI (with ρ > 0 and γ > 0) over some range. Such positive
reinforcement would be unlikely to go on forever and presumably predatory effects would dominate
eventually (i.e. γ would turn negative), but a rich array of dynamic patterns is possible.
A second extension would be to explicitly consider exogenous uncertainty. We suppress the
role of uncertainty by assuming risk neutrality and by interpreting financial flows as expected
values. It would be possible to introduce uncertainty explicitly into equations of motion (5) and (6).
This might capture random breakthroughs in research that cause the pool of opportunities to
increase by more than the normal rate, or it might capture the effect of exogenous random
fluctuations in interest rates that affect investment. Formal analysis of such systems is challenging,
but they can be easily simulated. They behave much like the deterministic versions. However
random perturbations ensure the system never settles down to a steady state.
Another important extension would be to explicitly consider VC investment portfolio issues.
This could be done by incorporating risk aversion by VCs, having an objective function that is
concave in profit instead of being equal to profit, and by explicitly introducing sector specific
uncertainty. One could also introduce cross-industry experience effects. In any case, various
extensions of our modeling approach can address a number of interesting and empirically relevant
considerations.

23
Appendix 1: Data Development For Table 1
This appendix describes the details underlying Table 1. The venture capital investment data was
obtained from PWC Moneytree, which tracks U.S. venture capital investment by industry for 16
industries (and a residual 17th category). Unfortunately, these industries do not match the North
American Industry Classification (NAIC) system used in GDP determination. Therefore it was
necessary to do a concordance between the PWC Moneytree industries and the NAIC system used
for GDP. We reduced the set of PWC Moneytree industries from 16 to 14 by combining biotech
with medical devices and equipment and by combining telecommunications with networking
products and services. We then determined the appropriate NAIC codes that should be associated
with each PWC industry, closely following the PWC industry definitions. The resulting
concordance is shown in Table A1. As can be seen from the table, the PWC definitions correspond
to various levels of aggregation within the NAIC system. We then obtained the relevant GDP data
and constructed GDP shares for the PWC industries. GDP data by NAIC classifications was
obtained primarily from the U.S. Census as available at www.census.gov

24
Table A1: PWC-NAIC Concordance
PWC Industry Sub-industry NAIC code Biotechnology & Medical Devices Pharmaceutical & Medicine Manufacturing 3254 Synthetics, Agricultural Chemicals 3252, 3253 R&D Services in Life Sciences, etc. 54171 Medical. Equip. & Supplies 3391 Bus. Products & Services Prof., Sci. & Tech. Serv. (excl. Software Serv.) 54 – (5415) Management of Enterprises 55 Admin. & Support Serv. 56 Computers & Peripherals Computer & Peripheral Man. 3341 Computer Whol. 4234 Consumer Products & Services Accom. & Food Serv. 72 Other Serv. (Auto Serv., Personal Serv., etc.) 81 Food, Clothing, Accessory Manuf. 31 Furniture 337 Electronics & Instrumentation Navigational, Measuring, Electronic Control Inst. Manuf. 3345 Electrical Equipment Manuf. 335 Financial Services Finance & Insurance 52 Real Estate & Rental & Leasing 53 Healthcare Services Health Care & Social Assist. 62 IT Services Internet Publication & Broadcasting 516 Internet Providers, Data-Processing., etc. 518 Industrial & Energy Ag. Forestry, Fishing, Hunting 11 Mining 21 Utilities 22 Construction 23 Wood Products, Paper, & Printing 321,322, 323 Petroleum & Coal Prod. 324 Plastics & Rubber 326 Nonmetal mineral products (glass, clay, concrete, etc.) 327 Metal & Machine Manufacturing 331, 332, 333 Trans. Equip. Manufacturing 336 Transportation 48 Warehousing & Post 49 Media & Entertainment Arts, Entertainment, & Recreation 71 Motion Picture & Sound Recording 512 Broadcasting 515 Retailing & Distribution Wholesale Trade (excl. computers) 42 - (4234) Retail Trade 44 , 45 Semiconductors Semiconductor & other related manuf. 3344 Software Software Publishers 5112 Software Services 5415 Telecomm. & Networking Communication. Equip. Manuf. 3342 Telecommunications 517 Networking Equip. (fiber optics, etc) 3346, 3359

25
Appendix 2: Transitional Dynamics (Section 4.2).
This appendix proves the characterization of transitional dynamics set out in Section 4.2. We define
u as the vector of deviations from steady state (X*, P*).
u = (uX, uP) = (X-X*,P-P*) (A1)
Note that du/dt = (dX/dt, dP/dt) = (αXβP - δX, ρP − αXβP). Using a Taylor series expansion for
du/dt around (X*,P*), it can be shown (as in Boyce and DiPrima (2005, pp. 506-507)) that
(du/dt)' = J(X*,P*)u' + R(X,P)' (A2)
where (du/dt)' is the transpose of du/dt and is therefore a column vector. J is the Jacobian matrix of
first order partial derivatives of dX/dt and dP/dt with respect to X and P, and R(X,P) is a remainder
of higher order terms that can be ignored near u = 0. J is evaluated at (X*, P*). Denoting the
components of J in the normal way (J11, etc.), we can re-write equation (A2) as
(du/dt)' = ⎥⎦
⎤⎢⎣
⎡⎥⎦
⎤⎢⎣
⎡p
x
2221
1211
uu
JJJJ
. (A3)
Since du/dt = (dX/dt, dP/dt) and J(X*,P*)u' is a linear approximation of (αXβP - δX, ρP − αXβP)
around the steady state, equation (A3) is the linearized version of the system of differential
equations defined in (5') and (6') in the main text. A system of differential equations as given by
equation (A3) has a general solution of the form
u(t) = c1υ1eλ1t + c2 υ2eλ2t (A4)
where c1 and c2 are constants, λ1 and λ2 are eigenvalues of coefficient matrix J, and υ1 and υ2 are
corresponding eigenvectors. The qualitative properties of the system depend on whether λ1 and λ2
are real or complex. If λ1 and λ2 are complex numbers, then cyclical dynamics emerge.
The eigenvalues are the solutions of the matrix equation J – ID·υ = 0 where ID is the identity
matrix and υ is the vector of eigenvalues. Therefore, the eigenvalues can be obtained as values of v
for which the determinant |J – ID·υ| is zero. The equation obtained by setting this determinant to
zero is referred to as the characteristic equation. The elements of J can be obtained by taking partial
derivatives of (5') and (6') with respect to X and P.

26
J11 = αβXβ-1P – δ; J12 = αXβ; J21 = -αβXβ-1P; J22 = ρ – αXβ (A5)
For the trivial steady state at (X,P) = (0,0), the Jacobian matrix becomes
J = ⎥⎦
⎤⎢⎣
⎡− 0 ρ
αδ (A6)
For this simple case, with a zero off-diagonal element, the eigenvalues are simply the diagonal
elements: –δ and ρ . The first of these eigenvalues is a negative real number and the second is a
positive real number (using condition (C1)). This implies that (0,0) is an unstable steady state,
which means that almost all trajectories starting near (0,0) lead away from it. This steady state can
be approached only if P = 0, in which case X declines toward 0, which is the lower bound for X.
The more interesting steady state is the interior steady state (X*,P*). Substituting equations
(7) and (8) into (A5), yields the following Jacobian matrix.
J = ⎥⎦
⎤⎢⎣
⎡0 - 1)-(
βδρβδ
(A7)
Subtracting ID·v from J and taking the determinant generates the following characteristic equation:
υ2 + υδ(1-β) + ρβδ = 0 (A8)
Depending on the values of parameters α, β, ρ, and δ the eigenvalues may be real or complex. The
main results concerning the local behavior of the linearized system are reported in Proposition 1.
The solutions to equation (A8) are the standard solution for a quadratic equation.:
υ = ((β-1)δ ± (δ2(1-β)2 – 4ρβδ)1/2)/2 (A9)
The solutions are complex numbers if the discriminant, δ2(1-β)2 – 4ρβδ, is negative, which occurs if
condition (10) holds. The real part of the complex solutions can be expressed as ((β-1)δ)/2, which is
negative by condition C2. Accordingly, convergent cyclical behaviour arises in this case. If (10)
does not hold then the solutions are real numbers. Since 4ρβδ > 0, we must have (δ2(1-β)2 – 4ρβδ)1/2
< │(β-1)δ│. Using this fact in equation (A9), and recalling that β < 1 (by C2) shows that both real
roots must be negative. This implies monotonic convergence toward the interior steady state. Thus
the system converges to the interior steady state regardless of whether or not (10) holds.

27
Bibliography
Amit, Raphael, James A. Brander, and Christoff Zott (1998), “Why do Venture Capital Firms Exist? Theory and Canadian Evidence,” Journal of Business Venturing, 13, 441-466. Banerjee, Abhijit (1992), “A Simple Model of Herd Behavior,” Quarterly Journal of Economics, CVII, 797-817. Bikhchandani, Sushil, David Hirshleifer, and Ivo Welch (1992), “A Theory of Fads, Fashion, Custom, and Cultural Change as Informational Cascades,” Journal of Political Economy, 100, 992-1026. Bottazzi, Laura, Marco Da Rin, and Thomas Hellmann (2004), “The Changing Face of the European Venture Capital Industry: Facts and Analysis,” The Journal of Private Equity, 26-53. Boyce, William E. and Richard C. de Prima (2005) Elementary Differential Equations and Boundary Value Problems, 8th edition, Hoboken, NJ: John Wiley and Sons. Brander, James A., Raphael Amit and Werner Antweiler (2002), “Venture Capital Syndication: Improved Venture Selection Versus the Value-Added Hypothesis,” Journal of Economics and Management Strategy, 11, 423-451. Brander, James A. and M. Scott Taylor (1998), “The Simple Economics of Easter Island: a Ricardo-Malthus Model of Renewable Resource Use,” American Economic Review, 88(1), 119–138. Cumming, Douglas (2005), “Agency Costs, Institutions, Learning, and Taxation in Venture Capital Contracting,” Journal of Business Venturing, 20, 573-622. Dosi, Giovanni (1988), “Sources, Procedures and Microeconomic Effects of Innovation,” Journal of Economic Literature, 26, 1120-1171. Ehrlich, Sanford, Alex De Noble, Tracy Moore, and Richard Weaver (1994), “After the Cash Arrives: A Comparative Study of Venture Capital and Private Investor Involvement in Entrepreneurial Firms,” Journal of Business Venturing, 9, 67-82. Fulghieri, Paolo, and Merih Sevilir (2005), “Size and Focus of a Venture Capitalist’s Portfolio,” Working Paper, UNC. Gans, Joshua, David Hsu, and Scott Stern (2002), “When Does Start-Up Innovation Spur the Gale of Creative Destruction?,” Rand Journal of Economics, 33, 571-586. Gans, Joshua, and Scott Stern (2003), “When Does Funding Research by Smaller Firms Bear Fruit?: Evidence from the SBIR Program,” Economics of Innovation and New Technology, 12(4), 361-384. Gompers, Paul, Anna Kovner, Josh Lerner, and David Scharfstein (2005), “Venture Capital Investment Cycles: The Impact of Public Markets,” Journal of Financial Economics, forthcoming. Gompers, Paul and Joshua Lerner (1999), The Venture Capital Cycle (Cambridge, MA.: MIT Press).

28
Gorman, Michael, and William Sahlman (1989), “What Do Venture Capitalists Do?,” Journal of Business Venturing, 4, 231-248. Hellmann, Thomas, and Manju Puri (2000), “The Interaction Between Product Market and Financing Strategy: The Role of Venture Capital,” Review of Financial Studies, 13, 959-984. Hellmann, Thomas and Manju Puri (2002), “Venture capital and the Professionalization of start-up Firms: empirical evidence” Journal of Finance, 57, 1, 169-197. Hochberg, Yael (2005), “Venture Capital and Corporate Governance in the Newly Public Firm,” working paper, Northwestern University. Hochberg, Yael, Alexander Ljungqvist, and Yang Lu (2005), “Venture Capital Networks and Investment Performance,” Journal of Finance, forthcoming. Hoekstra, Jeljer and Jeroen van den Bergh (2005), “Harvesting and Conservation in a Predator-Prey System,” Journal of Economic Dynamic and Control, 29, 1097-1120. Hsu, David (2004), “What Do Entrepreneurs Pay for Venture Capital Affiliation?,” Journal of Finance, LIX, 1805-1844. Hsu, David (2006a), “Venture Capitalists and Cooperative Startup Commercialization Strategy,” Management Science, 52, 204-219. Hsu, David (2006b), “Experienced Entrepreneurial Founders, Organizational Capital, and Venture Capital Funding,” working paper, University of Pennsylvania. Inderst, Roman and Holger Müller (2004), “The Effect of Capital Market Characteristics on the Value of Start-Up Firms,” Journal of Financial Economics 72, 319-356. Jeng, Leslie, and Philippe Wells (2000), “The Determinants of Venture Capital Funding: Evidence Across Countries,” Journal of Corporate Finance, 6, 241-289. Kanniainen, Vesa, and Christian Keuschnigg (2003), “The Optimal Portfolio of Start-up Firms in Venture Capital Finance,” Journal of Corporate Finance, 9, 521-53. Kaplan, Steve and Antoinette Schoar (2005), “Private Equity Performance: Returns, Persistence and Capital Flows,” Journal of Finance. Kaplan, Steve, Frederic Martel, and Per Strömberg (2006), “How Do Legal Differences and Experience Affect Financial Contracts?,” working paper, University of Chicago. Kaplan, Steve and Per Strömberg (2003), “Financial Contracting Meets the Real World: An Empirical Analysis of Venture Capital Contracts,” Review of Economic Studies 70, 281-315. Klepper, Steven (1996), “Entry, Exit, Growth, and Innovation over the Product Life Cycle”, American Economic Review, 86, 562-583. Kremer, Michael and Benjamin Olken (2006), “A Biological Model of Unions,” working paper, Harvard University.
29
Jeng, Leslie, and Philippe Wells (2000), “The Determinants of Venture Capital Funding: Evidence Across Countries,” Journal of Corporate Finance, 6, 241-289. Lindsey, Laura (2002), “The Venture Capital Keiretsu Effect: An Empirical Analysis of Strategic Alliances Among Portfolio Firms,” working paper, Arizona State University. Megginson, William (2004), “Toward a Global Model of Venture Capital?” Journal of Applied Corporate Finance, 16, 89-107. Megginson, William, and Kathleen Weiss (1991), “Venture Capitalist Affiliation in Initial Public Offerings,” Journal of Finance, XLVI, 879-903. Pezzey, John C.V. and John M. Anderies (2003), “The Effect of Subsistence on Collapse and Institutional Adaption in Population-Resources Societies,” Journal of Development Economics, 72, 299-320. Scharfstein, David, and Jeremy Stein (1990), “Herd Behavior and Investment,” American Economic Review, 80, 465-479. Schertler, Andrea (2003), “Driving Forces of Venture Capital Investments in Europe: A Dynamic Panel Data Analysis,” Kiel Working Paper No. 1172. Sorensen, Morten (2005), “How Smart is Smart Money? An Empirical Two-Sided Matching Model of Venture Capital,” Journal of Finance, forthcoming. Sorenson, Olav, and Toby Stuart (2001), “Syndication Networks and the Spatial Distribution of Venture Capital Investments,” American Journal of Sociology, 106, 1546-1588. Wright, Mike, Harry J. Sapienza and Lowell W. Busenitz (2003) (eds.) Venture Capital, (Camberley, UK: Edward Elgar Publishing). Wüstenhagen, Rolf, and Tarja Teppo (2005) “Do Venture Capitalists Really Invest in Good Industries? Risk-Return Perceptions and Path Dependence in the Emerging European Energy VC Market,” International Journal of Technology Management, forthcoming.