vehicle management - fleetboard · what is vehicle management? ... accessing fleetboard vehicle...
TRANSCRIPT

Vehicle ManagementApplication
Daimler FleetBoard

Copyright © 2008 Daimler FleetBoard GmbH. No part of this documentation may be copied or reprodu-ced without written permission
Daimler FleetBoard GmbH HPC Z400 D-70546 Stuttgart http://www.fleetboard.com
. . . . . . . . . . . . . . . . . . . . . . . . . . . . . . . . . . . . . . . . . . . . . . . . . . . . . . . . . . . . . . . . . . . . . . . . . . . . . . . . . . . .
. . . . . . . . . . . . . . . . . . . . . . . . . . . . . . . . . . . . . . . . . . . . . . . . . . . . . . . . . . . . . . . . . . . . . . . . . . . . . . . . . . . .
Alle im Text erwähnten Firmen-, Marken- und Produktnamen sind Marken oder eingetragene Marken ihrer jeweiligen Inhaber und unterliegen dem Markenschutz.
. . . . . . . . . . . . . . . . . . . . . . . . . . . . . . . . . . . . . . . . . . . . . . . . . . . . . . . . . . . . . . . . . . . . . . . . . . . . . . . . . . . .
. . . . . . . . . . . . . . . . . . . . . . . . . . . . . . . . . . . . . . . . . . . . . . . . . . . . . . . . . . . . . . . . . . . . . . . . . . . . . . . . . . . .
Impressum
Diese Dokumentation wurde von der ExperTeach GmbH in Zusammenarbeit mit der Daimler FleetBoard GmbH erstellt.
Status: August 2008
Imprint/Contact

Table of Contents
Table of Contents
Table of Contents
Before you begin ...
Preface ................................................................................ XII
What Is Vehicle Management? ............................................. XII
Further FleetBoard Services ................................................ XIII
Accessing FleetBoard Vehicle Management .................. XIII
System Requirements ........................................................... XIII
Necessary Browser Settings ................................................ XIII
About this Documentation ............................................... XIV
Notation and Symbols ........................................................... XIV
Important Text Segments ...................................................... XV
Additional Documentation .................................................... XV
Contacting FleetBoard Support ........................................ XV
1 Navigating the Interface
1.1 Starting FleetBoard ................................................ 1–2
1.2 The FleetBoard Services ........................................ 1–3
1.3 User Interface Structure ....................................... 1–7
1.3.1 Navigation bar .................................................................. 1–7
1.3.2 Buttons .............................................................................. 1–8
1.3.2.1 The Services Button .................................................... 1–8
1.3.2.2 The Messaging Button ................................................ 1–8
1.3.2.3 The Mapping Button .................................................... 1–9
1.3.2.4 The Print Button .......................................................... 1–9
1.3.2.5 The Export Button ........................................................ 1–9
1.3.2.6 The Support Button ..................................................... 1–9
1.3.2.7 The Help Button ........................................................... 1–9
1.3.3 Text Section ...................................................................... 1–9
1.4 General Information on How to Use FleetBoard 1–10
1.4.1 The Information Pages ................................................. 1–10
Vehicle Management III

Table of Contents
1.4.2 The Overview Tables .................................................... 1–11
1.4.2.1 How to Filter the Data in the Overview Tables .... 1–11
1.4.2.2 How to Undo the Filtering Function in the Overview Tables ........................................................ 1–14
1.4.2.3 How to Sort the Data in the Overview Tables ....... 1–14
1.4.2.4 How to Navigate between Data Sets ...................... 1–15
1.4.2.5 How to Go to the Detail View of an Individual Data Set ....................................................................... 1–16
1.4.3 The Detail View of an Individual Data Set ................ 1–16
1.4.4 Exporting Data ............................................................... 1–16
1.4.4.1 How to Export Data from FleetBoard ..................... 1–16
1.4.4.2 How to Proceed in the Case of Export Errors ....... 1–18
2 Messages
2.1 General Information on Messaging ...................... 2–2
2.2 Inbox Mail List ...................................................... 2–3
2.2.1 Inbox Mail List, Overview Table ................................... 2–4
2.2.1.1 How to Filter the Inbox Mail List ............................. 2–5
2.2.2 Inbox Mail List, Detail View .......................................... 2–5
2.2.2.1 Home, Event, and Service Call .................................. 2–5
2.3 Outbox Mail List .................................................... 2–7
2.3.1 Outbox Mail List, Overview Table ................................ 2–7
2.3.1.1 How to Filter the Outbox Mail List ........................... 2–8
2.3.2 Outbox Mail List, Detail View ....................................... 2–8
2.4 Send Freetext Message ........................................ 2–10
2.5 Forwarding Received Messages ......................... 2–12
3 Trip Records
3.1 General Information on Trip Records .................. 3–2
3.2 Positions ................................................................ 3–3
3.2.1 Positions, Overview Table ............................................. 3–3
IV Vehicle Management

Table of Contents
3.2.1.1 How to Filter Position Messages ............................... 3–4
3.2.2 Positions, Detail View ..................................................... 3–4
3.3 Single Trips ............................................................ 3–6
3.3.1 Single Trips, Overview Table ......................................... 3–6
3.3.1.1 How to Filter Single Trips .......................................... 3–7
3.3.2 Single Trips, Detail View ................................................ 3–8
3.4 Trip Records, Vehicle Query Form ..................... 3–10
4 Performance Analysis
4.1 General Information on the Performance Analysis .................................................................. 4–2
4.2 Information on How to Use the Performance Analysis .................................................................. 4–3
4.2.1 Navigating the Performance Analysis ......................... 4–3
4.3 Performance Analysis for MB Vehicles ............... 4–4
4.3.1 Evaluations in Performance Analysis MB ................... 4–4
4.3.2 Overview Tables in Performance Analysis MB .......... 4–4
4.3.2.1 Filtering ......................................................................... 4–4
4.3.2.2 Contents ........................................................................ 4–6
4.3.3 Detail View in Performance Analysis MB ................ 4–10
4.3.4 Vehicle Analysis, Predefined Period(s) ..................... 4–19
4.3.4.1 Overview Table Analysis for Predefined Time Period(s) ..................................................................... 4–19
4.3.5 Predefined Period(s) – Graphical Evaluation of the Overview
Table ............................................................................... 4–22
4.3.5.1 The Driving Style Diagram – Predefined Period(s) / Trip(s)
Summary .................................................................... 4–22
4.3.5.2 The Degree of Difficulty Diagram – Predefined Period(s) /
Trip(s) Summary ....................................................... 4–24
4.3.5.3 The Total Distance Diagram – Predefined Period(s) /
Trip(s) Summary ....................................................... 4–25
Vehicle Management V

Table of Contents
4.3.5.4 The Average Weight Diagram – Predefined Period(s) /
Trip(s) Summary ....................................................... 4–26
4.3.5.5 The Average Speed Diagram – Predefined Period(s) /
Trip(s) Summary ....................................................... 4–27
4.3.5.6 The Average Overall Consumption Diagram – Predefined
Period(s) / Trip(s) Summary ................................... 4–28
4.3.5.7 The Average Drive Consumption Diagram – Predefined Period(s) / Trip(s) Summary ................................... 4–29
4.3.6 Predefined Period(s) – Detail View ............................ 4–30
4.3.7 Predefined Period(s) – Graphical Evaluation of the Detail
View ................................................................................ 4–31
4.3.7.1 The Speed Diagram ................................................... 4–31
4.3.7.2 The Main Brake Diagram ......................................... 4–32
4.3.7.3 The Retarder Diagram .............................................. 4–34
4.3.7.4 The Engine Operation M/n (Not Highest Gear) Diagram ...................................................................... 4–35
4.3.7.5 The Engine Operation M/n (Highest Gear) Diagram ...................................................................... 4–36
4.3.7.6 The Engine Operation M/n (All Gears) Diagram . 4–38
4.3.8 Vehicle Analysis, Period Breakdown ......................... 4–40
4.3.8.1 Overview Table Period Breakdown ........................ 4–40
4.3.9 Period Breakdown – Graphical Evaluation of the Overview
Table ............................................................................... 4–45
4.3.9.1 The Driving Style Diagram – Period Breakdown . 4–45
4.3.9.2 The Degree of Difficulty Diagram – Period Breakdown ................................................................. 4–46
4.3.9.3 The Total Distance Diagram – Period Breakdown 4–47
4.3.9.4 The Average Weight Diagram – Period Breakdown ................................................................. 4–48
4.3.9.5 The Average Speed Diagram – Period Breakdown 4–49
VI Vehicle Management

Table of Contents
4.3.9.6 The Total Consumption Diagram – Period Breakdown ................................................................. 4–50
4.3.10 The Drive Consumption Diagram – Period Breakdown ..................................................................... 4–51
4.3.11 Period Breakdown – Detail View ............................... 4–52
4.3.12 Period Breakdown – Graphical Evaluation of the Detail View ................................................................................ 4–53
4.3.13 Vehicle Analysis, Trip(s) Summary ........................... 4–54
4.3.13.1 What Is a Trip? .......................................................... 4–54
4.3.13.2 Overview Table Trip(s) Summary .......................... 4–54
4.3.14 Trip(s) Summary – Graphical Evaluation of the Overview Table ............................................................................... 4–57
4.3.15 Trip(s) Summary – Detail View .................................. 4–57
4.3.16 Trip(s) Summary – Graphical Evaluation of the Detail View .................................................................... 4–58
4.3.17 Driver Analysis, Predefined Period(s) ....................... 4–58
4.3.18 Driver Analysis, Period Breakdown .......................... 4–60
4.3.19 Driver Analysis – Trip(s) Summary .......................... 4–61
4.4 Performance Analysis Universal ........................ 4–62
4.4.1 Evaluation in Performance Analysis Universal ....... 4–62
4.4.2 The Various Types of Analyses .................................. 4–63
4.4.3 The Overview Tables in Performance Analysis Universal ........................................................................ 4–66
4.4.3.1 Filtering ...................................................................... 4–66
4.4.3.2 Contents ..................................................................... 4–69
4.4.4 Graphical Evaluation of the Overview Tables .......... 4–74
4.4.4.1 Diagram Driving Style ............................................. 4–74
4.4.4.2 Diagram Total Distance ........................................... 4–75
4.4.4.3 Diagram Idling Time (Engine On) .......................... 4–76
4.4.4.4 Diagram Number of Overrevs ................................. 4–78
Vehicle Management VII

Table of Contents
4.4.4.5 Diagram Overrev Time ............................................. 4–79
4.4.4.6 Diagram Economic Driving Style ........................... 4–81
4.4.4.7 Diagram Speeding ..................................................... 4–82
4.4.4.8 Diagram Number of Harsh Brakes ......................... 4–83
4.4.4.9 Diagram Average Total Consumption ................... 4–85
4.4.5 Detail Views ................................................................... 4–86
4.4.6 Graphical Evaluation of the Detail Views ................. 4–91
4.4.6.1 Diagram Economic Driving ..................................... 4–91
4.4.6.2 Diagram Harsh Brakes ............................................. 4–92
4.5 Performance Analysis, Vehicle Query ............... 4–94
5 Maintenance
5.1 General Information on the Service ..................... 5–2
5.2 Prognosis List ........................................................ 5–3
5.2.1 Prognosis List, Overview Table .................................... 5–3
5.2.1.1 How to Use Filters in the Prognosis List ................. 5–6
5.2.2 Prognosis List, Detail View ........................................... 5–6
5.3 Status Check .......................................................... 5–9
5.3.1 Status Check, Overview Table ...................................... 5–9
5.3.1.1 How to Use Filters in the Status List ..................... 5–10
5.3.2 Status Check, Detail View ........................................... 5–11
5.4 Vehicle Query ...................................................... 5–13
5.5 Statutory Test Dates ............................................ 5–15
6 Telediagnostics
6.1 General Information on Telediagnostics ............. 6–2
6.2 Current Faults ....................................................... 6–3
6.2.1 Current Faults, Overview Table .................................. 6–3
6.2.2 How to Use Filters in Current Faults .......................... 6–4
6.2.3 Current Faults, Detail View ........................................... 6–5
6.3 Stored Faults .......................................................... 6–6
VIII Vehicle Management

Table of Contents
6.3.1 Stored Faults, Overview Table ...................................... 6–7
6.3.2 How to Filter the Stored Faults List ............................. 6–8
6.3.3 Stored Faults, Detail View .............................................. 6–8
6.4 Control Unit List .................................................. 6–10
6.4.1 Control Unit List, Overview Table ............................. 6–10
6.4.2 How to Use Filters in the Control Unit List .............. 6–11
6.4.3 Control Unit List, Detail View .................................... 6–11
6.5 Technical Data ..................................................... 6–15
6.5.1 General Information on Technical Data .................... 6–15
6.5.2 Individual Query ........................................................... 6–17
6.5.2.1 How to Define an Individual Query ....................... 6–17
6.5.2.2 Viewing the Results of an Individual Query ........ 6–19
6.5.3 Predefined Query .......................................................... 6–19
6.5.3.1 Predefined Query – Overview Tables .................... 6–19
6.5.3.2 Predefined Query – Detail View ............................. 6–20
6.6 Telediagnostics, Vehicle Query .......................... 6–23
Index
Vehicle Management IX

Table of Contents
X Vehicle Management

Before you begin ...
Before you begin ...
Before you begin ...
Preface......................................................................................... XII
Accessing FleetBoard Vehicle Management............................ XIII
About this Documentation ........................................................ XIV
Contacting FleetBoard Support.................................................. XV
Vehicle Management XI

Before you begin ...
Preface
FleetBoard from Mercedes-Benz is an Internet service mak-ing use of the latest in telematics system technology. It pro-vides effective and efficient fleet management, focusing on both technical issues and logistics.
The FleetBoard hardware consists of a GPS receiver, a GSM modem, an on-board computer, and an interface to the vehi-cle electronics. Data is collected from the vehicle systems and then sent back to the central FleetBoard server via mobile radiocommunications (GSM/GPRS).
What Is Vehicle Management?
FleetBoard Vehicle Management comprises individual serv-ices, which contain evaluations and functions used for mod-ern fleet management. The data behind it is provided by way of Telligent technology. FleetBoard Vehicle Management provides in-depth knowledge by way of the fol-lowing services and information:
• Messaging: communication between the dispatch office and the driver.
• Trip Records: evaluation of trip data, such as driving and pause times, positions, current driving times.
• Performance Analysis: evaluation of the gear usage, braking technique and driving style of the driver, degree of difficulty of the transport, and the resulting consump-tion values.
• Service: evaluation of the condition of your vehicles and vehicle maintenance scheduling.
• Telediagnostics: technical data for vehicle condition diagnosis.
XII Vehicle Management

Before you begin ...
Further FleetBoard Services
Mapping and Logistics are further FleetBoard modules. Mapping allows you to view the position of vehicles in the form of a digital road map. Logistics allows for an efficient planning of trips and helps you manage your orders.
Accessing FleetBoard Vehicle Management
System Requirements
To access FleetBoard, you require:
• A computer with Internet access.
The speed with which you can access the FleetBoard data is influenced by the performance of your computer and the transmission rate of your Internet connection.
• An Internet browser.
Microsoft Internet Explorer, version 6.0 and higher, or Mozilla Firefox, version 2.0 and higher, are recom-mended.
Necessary Browser Settings
Several settings in your Internet browser are necessary to work with FleetBoard. That means you have to activate Java and JavaScript in your Internet browser to access all Fleet-Board functions purchased by you in an optimal manner. This is a special programming or script language, which is required for numerous FleetBoard functions.
Note: For technical reasons, you should always use the latest browser version.
Vehicle Management XIII

Before you begin ...
Depending on the browser in use, the following settings must be made:
In Internet Explorer:
1. From the Tools menu, select Internet Options.
2. Click on the Security tab.
3. Click on the Custom Level button.
4. Under Cookies, enable the acceptance of cookies.
5. Under Scripting, activate the options Active scripting and Scripting of Java applets.
About this Documentation
The documentation at hand refers to version FBSC 1.4.1 of the FleetBoard Vehicle Management module.
Notation and Symbols
The following document conventions are used:
• References to other manuals, chapters, and sections are displayed on the screen in blue.
Example:Refer to Section Necessary Browser Settings.
• Navigation paths, buttons, text fields within the Internet interface, system messages, etc. are presented in italics.
Example:Click the Help button.
• Individual parts of a navigation path are separated from each other with ">".
Example:Select Messaging > Inbox Mail List.
XIV Vehicle Management

Before you begin ...
Important Text Segments
Important text passages are accentuated by icons in the margin which have the following meanings:
Additional Documentation
You can find further information in the manuals on the Logistics service, on Time Management, on Administration, and on Mapping, as well as in the online help provided with these services.
Contacting FleetBoard Support
If you have further questions or need information about our products, you can contact FleetBoard support under the fol-lowing phone number:
+49/711/17-91999
FleetBoard Support is available from Monday to Friday from 08:00 a.m. to 06:00 p.m., as well as on Saturdays from 08:00 a.m. to 04:00 p.m.
Note: Contains important general or additional information on a specific topic.
Prerequisite: Defines requirements which have to be fulfilled before you can carry out the next steps.
Vehicle Management XV

Before you begin ...
XVI Vehicle Management

Navigating the Interface
1 Navigating the Interface
Chapter 1Navigating the Interface
Starting FleetBoard..................................................................... 1-2
The FleetBoard Services............................................................. 1-3
User Interface Structure ............................................................ 1-7
General Information on How to Use FleetBoard ........................ 1-10
Vehicle Management 1-1

Navigating the Interface
1.1 Starting FleetBoard
To start FleetBoard, proceed as follows:
1. Enter the address www.fleetboard.com into the address line of your browser.
This will call the FleetBoard homepage. Here, you can find information on the FleetBoard product group.
2. To log in at FleetBoard, enter your Fleet, your User Name, and your Password. You will receive this data from your fleet administrator.
3. Click Login.
You are led to the service portal. There, you can start the individual FleetBoard services.
Note: You can create a bookmark or favourite for this page in your browser.
1-2 Vehicle Management

Navigating the Interface
1.2 The FleetBoard Services
When starting FleetBoard Vehicle Management, you are ini-tially led to the service portal.
There, you can start the individual FleetBoard services.
Vehicle Management comprises the following services:
Messaging
Here, the messages which the driver has sent to the dis-patch office or vice versa are displayed and collected. For further information, refer to Section Messages, Page 2–1.
Trip Records
Provides you with a simple log book of your vehicles. For instance, driving and stop times, drive consumption and idle consumption, the current position of the vehicles, as well as the working and standby time of the drivers are eval-uated. For further information, refer to Section Trip Records, Page 3–1.
Note: You are only permitted to start the services you have ordered. Services which you have not ordered are faded out in the service portal.
Vehicle Management 1-3

Navigating the Interface
Performance Analysis
The Performance Analysis provides analyses on the fuel consumption and the wear level of your vehicles. The evalu-ations can be made either by vehicle or by driver. Thus, it is an efficient instrument for reducing fuel costs and wear. For further information, refer to Section Performance Analysis, Page 4–1.
Service
FleetBoard takes the data from the Telligent service system and indicates when the next maintenance work for the indi-vidual positions will be due, as well as the current technical condition of the vehicles of your fleet. For further informa-tion, refer to Section Maintenance, Page 5–1.
Telediagnostics
The Telediagnostics service will only be activated for you on request.
Here, you can find technical data, such as wear ratings, fill-ing levels, pressures, etc. This information is available for the service technicians in the workshops, e. g. in the event of errors. For further information, refer to Section Telediag-nostics, Page 6–1.
Logistics
By clicking the Logistics button, you will get to the independ-ent Logistics service.
Service for the complete support of the Logistics process. In combination with the FleetBoard driver workstation, i.e. the corresponding hardware in the truck, it permits direct com-munication between the vehicle and the central server and, thus, permits the efficient planning of trips and order man-agement. For further information, refer to the Logistics manual.
1-4 Vehicle Management

Navigating the Interface
Cooling Data
The Cooling Data Management service is a FleetBoard telematics service to monitor the storage temperature in trailers. To use this service, the trailer has to be equipped with a cooling engine, a temperature scanner, and a telematics unit. For more information, please refer to the documentation on Cooling Data Management.
Mapping
Shows the position of your vehicles on a map. For further information, please refer to the Mapping documentation.
Routing
Calculates the route for a trip from the start and destination location.
Menu Items
In addition, menu items are available in the service portal:
• Manuals
Under Manuals, you will find information on the FleetBoard user documentation. You can display this documentation directly in your browser or download it to your computer:
• To display a manual directly in your browser, left-click the corresponding link.
Menu Items
Vehicle Management 1-5

Navigating the Interface
• To download a manual to your computer, right-click the link. Select Save Target As and indicate where you want to store the file.
• Forms
Here, you will find important forms, such as the Vehicle Activation Form.
• Logout
Use this menu item if you wish to log out. You will then return to the FleetBoard home page. To gain access to FleetBoard again, you will have to log in once more.
Note: The documentation is available as PDF files. To be able to read and print it, you must have Acrobat Reader installed on your PC.
1-6 Vehicle Management
Navigating the Interface
1.3 User Interface Structure
The Vehicle Management interface is divided into three sec-tions:
• Navigation bar
• Buttons
• Text Section
1.3.1 Navigation bar
On the navigation bar, the following information is dis-played from the top downwards:
• Fleet name
• Selected service
• Menu items for the selected service
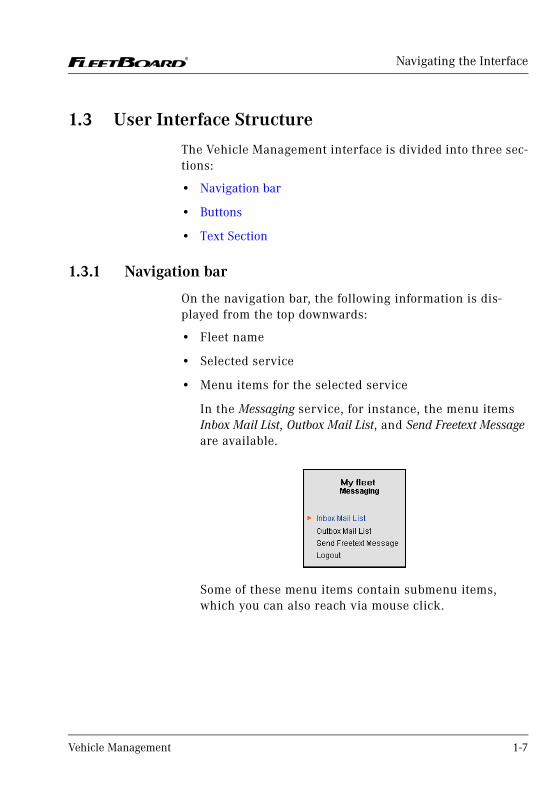
In the Messaging service, for instance, the menu items Inbox Mail List, Outbox Mail List, and Send Freetext Message are available.
Some of these menu items contain submenu items, which you can also reach via mouse click.
Vehicle Management 1-7

Navigating the Interface
The position of the orange arrow tells you which menu you are currently in.
In our example, the user is working in the Messaging service under Inbox Mail List.
1.3.2 Buttons
The upper part of the interface comprises seven buttons, which have the following meaning.
1.3.2.1 The Services Button
1.3.2.2 The Messaging Button
Takes you to the service portal.
Takes you to the inbox mail list of the Messaging service.
The button is displayed in red when a new service call or alarm is received. The button is displayed in green when a new home call or event call is received. As soon as you go to your inbox mail list and read the new message, the button will be displayed in grey again.
1-8 Vehicle Management

Navigating the Interface
1.3.2.3 The Mapping Button
1.3.2.4 The Print Button
1.3.2.5 The Export Button
1.3.2.6 The Support Button
1.3.2.7 The Help Button
1.3.3 Text Section
In the text section, information is displayed which you have selected via the navigation bar or via the buttons.
You can start the Mapping service via this button.
Creates a print preview.
Via this button, you can export data from FleetBoard. Please refer to Section Exporting Data, Page 1–16.
If you click the Support button, you go to another window. Here, you can find the telephone number of FleetBoard Support. In addition, you can send an e-mail to FleetBoard Support directly from this page.
If you click the Help button, the online help will be activated.
Vehicle Management 1-9

Navigating the Interface
1.4 General Information on How to Use FleetBoard
The general procedure when working in FleetBoard Vehicle Management is:
1. Select a service. First, you get to an information page.
2. Select a menu item. You get to an overview table.
3. Set filters.
4. Click View.
5. The overview table now displays the data you have selected via the filters.
6. Click the magnifying glass symbol to go to the detail view for individual data sets. .
1.4.1 The Information Pages
If you select a service, you are initially led to a page with general and up-to-date information on this service. Use the menu items of the navigation bar to navigate within the selected service.
1-10 Vehicle Management

Navigating the Interface
1.4.2 The Overview Tables
If you select a menu item, you are initially led to an over-view table.
• The top section allows you to set filters. In this way, you can determine which data is to be displayed in the table beneath.
• In the bottom section of the page, the most recent data of all the vehicles of your fleet is displayed in the form of a table.
1.4.2.1 How to Filter the Data in the Overview Tables
By default, the most recent data sets of all vehicles are dis-played. The tables can, therefore, become very complex. Moreover, you may sometimes want to display only data for
Data section
Filter section
Vehicle Management 1-11

Navigating the Interface
a specific vehicle or a specific time range. For this purpose, you have to filter the overview tables. You can set the filters in the top section of each overview table.
Filtering Drivers, Vehicles, and Telematics Groups
Most overview tables allow you to filter vehicles, drivers, and telematics groups and, thus, reduce the number of data sets to be displayed.
• Vehicle means the tractor unit. It is identified by means of the vehicle name.
• The driver is identified by means of his FleetBoard DriverCard, the DTCO-ID, or the driver name. If the option Show ID for Driver Name has been checked in Cus-tomer Administration under Fleet > Master Data, the number of the FleetBoard DriverCard and the DTCO-ID will always be displayed in the filters.
• During the installation process, your vehicles will be assigned to telematics groups. Mercedes-Benz vehicles will be assigned to the MB telematics group, while other vehicles will be assigned to the all-makes telematics group. For technical reasons, all-makes vehicles can transfer less data than Mercedes-Benz vehicles. By
Identification of the Driver by Means of Display in Filters
FleetBoard DriverCard No. 12345
DTCO-ID 5000000
FleetBoard DriverCard and DTCO-ID
1-12 Vehicle Management
Navigating the Interface
means of the telematics groups filter, you can differenti-ate between Mercedes Benz vehicles and other vehicles.
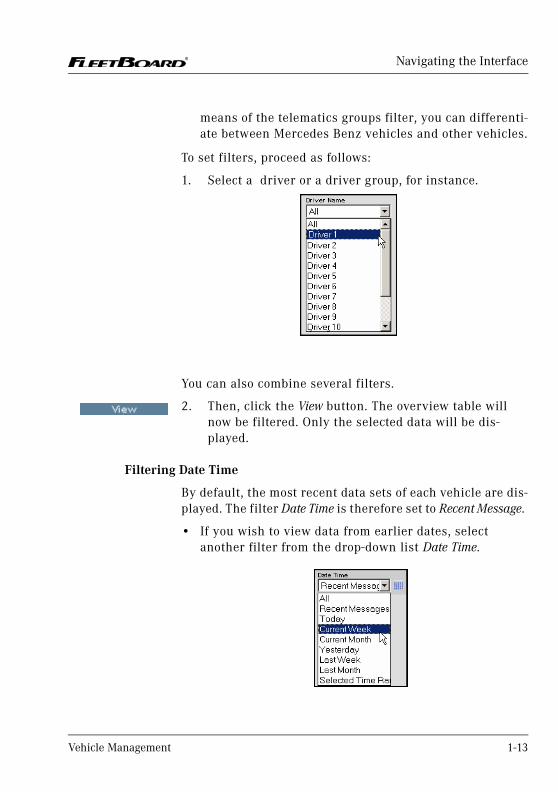
To set filters, proceed as follows:
1. Select a driver or a driver group, for instance.
You can also combine several filters.
2. Then, click the View button. The overview table will now be filtered. Only the selected data will be dis-played.
Filtering Date Time
By default, the most recent data sets of each vehicle are dis-played. The filter Date Time is therefore set to Recent Message.
• If you wish to view data from earlier dates, select another filter from the drop-down list Date Time.
Vehicle Management 1-13

Navigating the Interface
Then, click the View button. Only data from the selected time range will be displayed.
• You can also enter a freely selected time range. To do so, click the calendar symbol .
Enter a Start Date and an End Date.
Click View. Only data from the selected time range will be displayed.
1.4.2.2 How to Undo the Filtering Function in the Overview Tables
Click Reset. By default, the most recent data sets of each vehicle are displayed.
1.4.2.3 How to Sort the Data in the Overview Tables
Click the terms in the header line of the table.
The table is now sorted by the contents of the column in which you have clicked the header line.
Note: It is not possible to set both the filters Vehicle and Date Time to All at the same time. One of the two filters has to be set and, thus, must limit the amount of data displayed.
1-14 Vehicle Management

Navigating the Interface
The sorting order (forward or backward) is indicated by an arrow symbol.
1.4.2.4 How to Navigate between Data Sets
The overview tables show a maximum of 12 data sets. If more data sets are available, you have to navigate between several pages with overview tables. The following symbols are available for navigation:
Backward sorting: the vehicle with the highest number is displayed on top.
Icon Meaning
Go to the first page of the overview table
Previous page
Here, you can select a page with specific data sets (1-12 or 13-24 etc.). Subsequently, click to go to the page.
Next page
Go to the last page of the overview table.
Vehicle Management 1-15

Navigating the Interface
1.4.2.5 How to Go to the Detail View of an Individual Data Set
Click the magnifying glass symbol .
You are led to the detail view of the data set.
1.4.3 The Detail View of an Individual Data Set
In the detail view, detailed data is displayed for each data set.
You can go back to the overview table by clicking the back button.
1.4.4 Exporting Data
You can export data from FleetBoard in order to import it into other programs and to evaluate it there.
1.4.4.1 How to Export Data from FleetBoard
To export data from FleetBoard and to import it, for instance, into Microsoft Excel, proceed as follows:
1. On the FleetBoard page from where you wish to export the data, click the Export button.
2. If you are working with the Microsoft Internet Explorer, the Download File dialogue box will be opened.
3. In this dialogue box, you have to confirm that you wish to store the file on your computer.
4. Save the file. The .csv format is used automatically.
1-16 Vehicle Management

Navigating the Interface
You can now open the file in Microsoft Excel, for instance, and edit it there.
1. Start Microsoft Excel.
2. Via File > Open, open the file you have just exported from FleetBoard. Follow the instructions of the Text Import Wizard to separate the columns correctly.
The file can now be saved and processed in Microsoft Excel.
Vehicle Management 1-17

Navigating the Interface
1.4.4.2 How to Proceed in the Case of Export Errors
All contents are displayed in an individual cell.
Probably, Excel has not separated the columns correctly.
To display the contents correctly, proceed as follows:
1. In Excel, select Data > Text to Columns.
2. Follow the instructions of the Text Import Wizard to separate the columns correctly.
Numbers are displayed incorrectly.
Sometimes, numbers are displayed incorrectly in Excel.
To correct this error, proceed as follows:
1. Select the column in question.
2. In the Format menu, select Cells.
3. As category, select Number and choose 0 decimal places. Click OK.
The numbers will now be displayed correctly.
1-18 Vehicle Management

Navigating the Interface
The columns cannot be added up.
The cells of the column are probably formatted as text.
To correct this error, proceed as follows:
1. Select the column in question.
2. In the Format menu, select Cells.
3. As category, select Number and choose 2 decimal places. Click OK.
4. Allocate the new format to each cell. To do so, select each cell and press F2 and Enter.
It should now be possible to add up the values of the col-umn.
Note: If you are using an English version of Microsoft Excel, you should replace the commas of the decimal numbers by points and format the content as numbers in the way described above. Only then will you be able to add up the columns.
Vehicle Management 1-19

Navigating the Interface
1-20 Vehicle Management

Messages
2 Messages
Chapter 2Messages
General Information on Messaging........................................... 2-2
Inbox Mail List ............................................................................ 2-3
Outbox Mail List ......................................................................... 2-7
Send Freetext Message ............................................................. 2-10
Forwarding Received Messages ............................................... 2-12
Vehicle Management 2-1

Messages
2.1 General Information on Messaging
In FleetBoard Vehicle Management, the Messaging service provides information on messages exchanged between the dispatch office and the driver. In detail, the following mes-sages can be displayed:
• Inbox Mail List
Messages which the dispatch office has received from the drivers.
• Outbox Mail List
Messages which have been sent by the dispatch office to other vehicles via the Send Freetext Message button.
Along with the message, you will receive further useful information on the current vehicle position, error code, etc.
Note: The Mapping service displays the vehicle position at the time a message is sent in a digital road map. You can open Mapping by clicking the Mapping button.
For further information, please refer to the Mapping documentation.
2-2 Vehicle Management

Messages
2.2 Inbox Mail List
The Inbox Mail List provides an overview of all messages received from your fleet. The following message types are possible:
• Home Calls/Event Calls/Service Calls
The messages are sent by the drivers by means of the three buttons installed in the vehicle. These buttons ena-ble the driver to transmit various messages automati-cally. The Service Call button is meant to be used by the driver to indicate a breakdown.
You can homogeneously define the meaning of the calls for the fleet under Administration > Fleet > Messages. The message stored here will then be displayed in the inbox.
• Alarm
An alarm is either triggered by the electronic anti-theft system or when the data memory of the vehicle is full. When the data memory is full, you receive a message asking you to start a vehicle update and, thus, to empty the data memory.
These messages are then displayed in the FleetBoard inbox. They can also be forwarded to you as an SMS to your mobile phone or as an e-mail to your mail program. This way, the messages reach you independent of whether or not you are currently working at your desk. In the Customer Administra-tion module, your fleet administrator can determine tele-phone numbers or addresses for message forwarding.
You can check for incoming messages at one glance by click-ing the Messaging button in the top line of the navigation bar.
• Button is displayed in grey: There are no new messages.
• Button is displayed in green: A home or event call has been received.
Vehicle Management 2-3

Messages
• Button is displayed in red: A new service call or alarm has been received.
2.2.1 Inbox Mail List, Overview Table
The Inbox Mail List, Overview Table page gives you an over-view of all messages which have been received. They are displayed in columns and can be sorted and filtered accord-ing to various criteria.
• In the Vehicle column, all vehicles are listed.
• Telematic Group specifies the telematics group the vehicle is assigned to.
• The Vehicle Group column indicates the group to which a vehicle is assigned.
• The Date Time column indicates the date and time the message was sent.
• The Driver column specifies the name of the driver. The entry „-“. means not available, i.e. FleetBoard was not able to identify a driver. This will be the case if you use telematics platform 1004 or if you have not assigned a driver card (FleetBoard DriverCardor DTCO driver card) to a driver.
2-4 Vehicle Management

Messages
• The Message Type column contains the type (home call, event call, service call, alarm) of the messages recently received, as well as the first characters of the message defined under Administration > Fleet > Messages.
2.2.1.1 How to Filter the Inbox Mail List
By means of the drop-down list in the top section of the win-dow, you can filter the table in order to display only selected data sets.
If you wish to view only messages of the Service Call type, select Service Call from the drop-down list.
Then, click the View button.
2.2.2 Inbox Mail List, Detail View
2.2.2.1 Home, Event, and Service Call
• In the top section of the page, the data listed on the page Inbox Mail List, Overview Table is displayed more clearly.
Vehicle Management 2-5

Messages
• In the bottom section of the page, the following details are given:
• The Mileage of the vehicle at the time of the message.
• The Position of the vehicle at the time the message was sent.
• The parameter PA_Fzg_Erstzulassungsdatum specifies the date the vehicle was registered for the first time. This parameters is only displayed for service calls or home calls.
• The Operating Time of the vehicle in hours at the time of the message.
• Latitude: Geographical latitude of the vehicle position at the time the message was received.
• Name of the Trailer, if available.
• Longitude: Geographical longitude of the vehicle posi-tion at the time the message was received.
• PA_Fzg_Sprache designates the language selected in the Telligent maintenance system, informing you of the language in which you can communicate with the driver. This parameters is only displayed for service calls or home calls.
• In the case of a service call: further vehicle data. You can find a description of this data in Section Technical Data, Page 6–15.
Note: Only vehicles belonging to the MB telematics group are able to supply data for trailers, language, and vehicle registration date. For technical reasons, vehicles belonging to other telematics groups are not able to supply this data. For this reason, “-“ will be displayed instead of a value for these vehicles.
2-6 Vehicle Management

Messages
2.3 Outbox Mail List
The Outbox Mail List provides an overview of all messages you have sent to your fleet using the Send Freetext Message option.
2.3.1 Outbox Mail List, Overview Table
The overview table displays the messages sent to the fleet.
• The columns Vehicle, Telematic Group, and Vehicle Group correspond to the identical columns in the Inbox Mail List.
• The Date Time column indicates the date and time the message was sent.
• The Subject column specifies the first 20 characters of the message title.
• The entry in the Confirmation column tells you whether a message has already been read and confirmed.
Vehicle Management 2-7

Messages
• Reply not Requested means that the checkbox Request for Read Confirmation was not checked when the mes-sage was sent.
• Reply Requested means that the checkbox was acti-vated, but the confirmation has not yet been sent by the vehicle.
• Message Read means that the message has been read and the confirmation has been sent by the vehicle.
2.3.1.1 How to Filter the Outbox Mail List
Use the drop-down lists in the top section of the page to fil-ter the table and to view only those data sets you are inter-ested in.
For example, if you wish to view all messages you have sent to a specific vehicle, select this vehicle under Vehicle/Group Name.
Then, click the View button.
2.3.2 Outbox Mail List, Detail View
The top section of the Outbox Mail List, Detail View page dis-plays the data listed on the page Outbox Mail List, Overview Table.
2-8 Vehicle Management

Messages
The bottom section of the page indicates the sender and the contents of the sent message.
Vehicle Management 2-9

Messages
2.4 Send Freetext Message
Under Send Freetext Message, you can write and send mes-sages.
1. Under Addressee, indicate whether you wish to send the message to a specific vehicle, to a vehicle group, or to the entire fleet.
2. Enter the title of the message next to Title. The first 20 characters of this title are displayed in the overview table of the outbox mail list in the Title column.
3. Use the Text field to write your message. The text length is limited to 140 characters. The number of characters remaining is displayed below the text field on the right-hand side.
4. Check the checkbox next to Request for Read Confirma-tion if you wish to receive a confirmation as soon as the recipient has read your message.
After you have made all your entries, the window may look like this:
Note: You can only send free text messages to vehicles belonging to the MB telematics group. Therefore, only vehicles belonging to this telematics group are displayed under Addressee > Vehicle. Accordingly, only vehicle groups containing vehicles of the MB telematics group are displayed under Addressee > Vehicle Group.
2-10 Vehicle Management

Messages
5. To send the message, click the Submit button.
You will receive a message asking you whether you really want to send the message.
6. Click Yes to confirm that you really want to send the message.
The message will now be sent.
Note: You can only send free text messages to vehicles belonging to the MB telematics group. If one of your addressees is a vehicle belonging to the all-makes telematics group, you will receive a message informing you that no SMS can be sent to the all-makes vehicle.
Vehicle Management 2-11

Messages
2.5 Forwarding Received Messages
By default, all messages sent by the drivers are received by the FleetBoard system. That means that you can track new messages only from your FleetBoard computer. But you can also have all incoming messages forwarded to your mobile phone via SMS or to your mail address via e-mail. This way, new messages will reach you even if you are not currently working in FleetBoard Vehicle Management.
Your fleet administrator will set up your forwarding details for you in the FleetBoard Customer Administration module. You will find further information in the documentation on FleetBoard Customer Administration.
2-12 Vehicle Management

Trip Records
3 Trip Records
Chapter 3Trip Records
General Information on Trip Records ....................................... 3-2
Positions...................................................................................... 3-3
Single Trips ................................................................................. 3-6
Trip Records, Vehicle Query Form........................................... 3-10
Vehicle Management 3-1

Trip Records
3.1 General Information on Trip Records
The Trip Records service provides an overview of the driving and stop times of your vehicles. The Trip Records service of FleetBoard automatically records the relevant transport sec-tions (driving times and pauses).
A trip is defined as follows:
• A trip starts when the vehicle moves for more than 2 minutes. This delay was defined on purpose to prevent short shunting manoeuvres from being erroneously interpreted as a trip.
• A drive ends when the vehicle stops for more than 5 min-utes (speed = 0 mph). In this instance, a pause starts.
• A trip is automatically terminated if the ignition is turned off.
Note: A trip is not displayed in FleetBoard until the following pause has been terminated.
Example: The driver pauses from Friday evening over the weekend. On Monday he starts off again. It is only then that the data can be transmitted from the vehicle and that the trip made on Friday is displayed in FleetBoard. The time of transmission depends on the settings in the scheduled tasks (see the Customer Administration documentation for further information). If requested, the parameters for the detection of trips and pauses can be modified by FleetBoard Support.
3-2 Vehicle Management
Trip Records
3.2 Positions
With Positions, you can locate the vehicles of your fleet. This is either done by means of the scheduled tasks sent auto-matically according to the configurations made in the Customer Administration module or via manual vehicle queries.
3.2.1 Positions, Overview Table
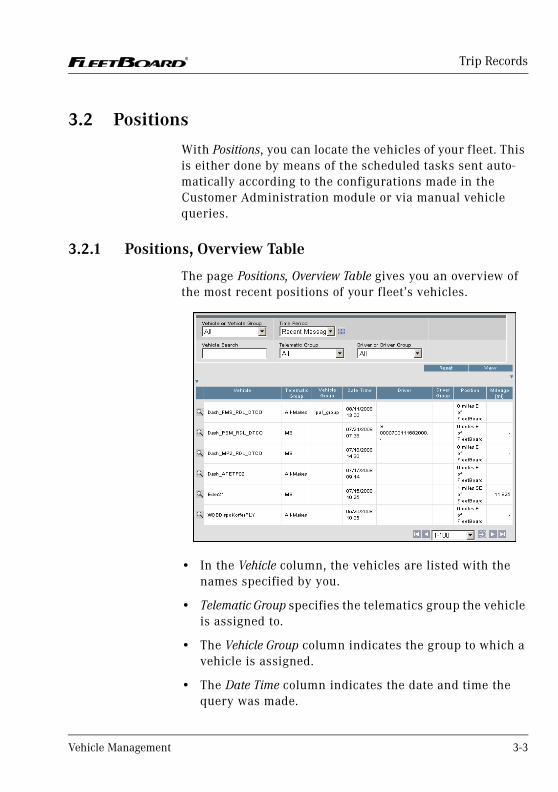
The page Positions, Overview Table gives you an overview of the most recent positions of your fleet’s vehicles.
• In the Vehicle column, the vehicles are listed with the names specified by you.
• Telematic Group specifies the telematics group the vehicle is assigned to.
• The Vehicle Group column indicates the group to which a vehicle is assigned.
• The Date Time column indicates the date and time the query was made.
Vehicle Management 3-3

Trip Records
• The Driver column specifies the name of the driver.
• The Position column contains the position of the vehicle at the time of the query.
• Mileage specifies the mileage of the vehicle at the read-out time of the query.
3.2.1.1 How to Filter Position Messages
By means of the drop-down list in the top section of the win-dow, you can filter the table in order to display only selected data sets (e.g. those of a specific vehicle). The available fil-ters are Vehicle, Driver, Telematic Group, and Time Period.
By clicking the magnifying glass symbol , you can go to the detail view.
3.2.2 Positions, Detail View
The page Positions, Detail View provides an overview of the exact condition of the vehicle at the readout time of the query.
In the top section of the page, the data displayed in the over-view table is shown again.
Note: A driver ID or a driver name will only be displayed if the DCTP telematics platform is used together with a FleetBoard driver card or a DTCO driver card.
3-4 Vehicle Management

Trip Records
In the bottom section of the page, the following information is given:
• The GPS Date Time indicates the time when the last suc-cessful GPS locating took place. This value normally cor-responds to the time the displayed position request was made. Due to locating interferences, however, it may also have been created at an earlier point of time.
• The condition of the Ignition (on/off).
• The FB-GSM-Number is the telephone number of the vehi-cle.
• Latidude: geographical latitude of the vehicle position.
• The condition of the Engine (on/off).
• Longitude: geographical longitude of the vehicle position.
• The Speed [km/h] of the vehicle at the readout time of the query.
• The direction the vehicle was heading towards, stated in degrees under Heading [°].
• Name of the Trailer, if available.
Vehicle Management 3-5

Trip Records
3.3 Single Trips
Under Single Trips, you can find an overview of all trips and pauses of your fleet, as well as the option to evaluate the average speed, the average duration, and the total duration of specific trips.
3.3.1 Single Trips, Overview Table
The page Single Trips, Overview Table displays all recorded trips and pauses of your fleet in the form of a table.
• In the Vehicle column, the vehicles are listed with the names specified by you.
• Telematic Group specifies the telematics group the vehicle is assigned to.
• The Vehicle Group column indicates the group to which a vehicle is assigned.
• The Driver column specifies the name of the driver.
3-6 Vehicle Management

Trip Records
• The Status column indicates whether the trip section dis-played is a trip or a pause.
• The columns Start and End indicate the start and end time of each trip or pause.
• The Duration column specifies the duration of a trip or pause.
• The Distance column shows the distance covered in miles during a trip or pause.
• The Weight [t] column contains the weight of the vehicle including freight at the readout time of the query.
• Total consumption indicates the total consumption for the individual trip or pause.
• Fuel Level [%] at the time of the query.
In the bottom lines of the table, average values and sums are displayed for distance, duration, and consumption. Moreover, the total duration and total consumption for all trips and pauses are specified.
3.3.1.1 How to Filter Single Trips
To view only selected data sets (e.g. those of a specific vehi-cle), filter the data.
• The available filters are the drop-down lists Vehicle, Driver, Telematic Group, Date Time, and Status.
Note: A driver ID or a driver name will only be displayed if the DCTP telematics platform is used together with a FleetBoard driver card or a DTCO driver card.
Vehicle Management 3-7

Trip Records
• To filter for Distance, Driving Duration, Total Consumption, and Weight, you have to enter value ranges.
Click View. The desired data sets will be displayed.
3.3.2 Single Trips, Detail View
The page Single Trips, Detail View provides an overview of fur-ther details regarding the state of the vehicle at the readout time of the query.
In the top section of the page, the data displayed in the over-view table is shown again.
In the bottom section of the page, the following information is given:
• The entry under Average Speed indicates the average speed of the vehicle within this trip or pause.
• Position indicates the position of the vehicle at the time of the query.
• TCO Chart Changes indicates the number of TCO chart changes within this trip or pause.
3-8 Vehicle Management

Trip Records
• Latitude is the geographical latitude of the vehicle posi-tion at the time of the query.
• Odometer Reading of the vehicle at the time of the query.
• Longitude is the geographical longitude of the vehicle position at the time of the query.
• Trailer states the name of the trailer.
Vehicle Management 3-9

Trip Records
3.4 Trip Records, Vehicle Query Form
The Vehicle Query Form allows you to start a query for a vehi-cle or vehicle group at any time by sending an appropriate message.
1. In the top section of the page, select Request Type. Que-ries regarding the Positions and the Single Trips are available. The results of the queries correspond to those described on the previous pages.
2. Subsequently, specify the Addressee to whom you want to send the data. You can select either an individual Vehicle or a complete Vehicle Group.
3. Click Submit.
A message will be displayed asking you whether you really want to send the query.
4. Click Yes to submit the query.
3-10 Vehicle Management

Performance Analysis
4 Performance Analysis
Chapter 4Performance Analysis
General Information on the Performance Analysis ................. 4-2
Information on How to Use the Performance Analysis ............ 4-3
Performance Analysis for MB Vehicles ..................................... 4-4
Performance Analysis Universal ............................................. 4-62
Performance Analysis, Vehicle Query..................................... 4-94
Vehicle Management 4-1

Performance Analysis
4.1 General Information on the Performance Analysis
The Performance Analysis allows you to evaluate character-istic trip data of your vehicles. It takes the difficulties of the trip into account and enables you to gather information on the driving features of the vehicle, as well as the driving style of the particular driver.
In this way, the Performance Analysis makes your vehicle pool more transparent. You are able to monitor characteris-tic trip data of your vehicles, make out weak points, and react to them.
The Performance Analysis, thus, provides useful informa-tion for a trip recalculation and assists you in particular to reduce the fuel consumption of your fleet. Moreover, it helps you to minimise the wear level of your vehicles.
MB Vehicles and All-Makes Vehicles
Mercedes-Benz vehicles and vehicles of other makes send different data sets to FleetBoard. Because of that, FleetBoard distinguishes the Performance Analysis for Mer-cedes-Benz vehicles and the Universal Performance Analy-sis for so-called all-makes vehicles (i.e. vehicles of all other makes). If your fleet consists of Mercedes-Benz vehicles and vehicles of other makes and if you wish to compare the val-ues obtained for all vehicles, you can have your Mercedes-Benz vehicles configured by FleetBoard support in such a way that they additionally provide data for the Universal Performance Analysis. Within the Universal Performance Analysis, you can then compare all vehicles with each other.
4-2 Vehicle Management

Performance Analysis
4.2 Information on How to Use the Performance Analysis
The Performance Analysis allows you to request data in a targeted manner. The procedure to be applied is:
1. Set filters.
2. Click View.
3. You are led to the overview table which gives you an overview of the data of the selected vehicles.
4. Click the magnifying glass symbol to go to the detail view for individual data sets.
4.2.1 Navigating the Performance Analysis
The following options are available for the navigation between the data sets:
You can find further general navigation options in Section How to Navigate between Data Sets, Page 1–15.
Symbol Meaning
Leads you to the detail view of the data set.
Leads you to the graphical display of the analysis.
Takes you back to the overview table.
Vehicle Management 4-3

Performance Analysis
4.3 Performance Analysis for MB Vehicles
MB vehicles provide other and more data sets than vehicles of other makes. These data sets are evaluated in the per-formance analysis for MB vehicles.
4.3.1 Evaluations in Performance Analysis MB
FleetBoard evaluates the driving style of the driver, the degree of difficulty of the trips, and the driving features of the vehicle with the help of a grading system. The evalua-tion is done via a scale between 1 and 10.
The grades have the following meaning:
For example, in the evaluation of the degree of difficulty, 1 stands for easy and 10 stands for difficult. In the evaluation of the average slope gradient, 1 means low and 10 means high.
4.3.2 Overview Tables in Performance Analysis MB
Overview tables offer comprehensive filter options and give a first overview of the evaluation of the performance analy-sis.
4.3.2.1 Filtering
The following filtering options are available:
1 2 3 4 5 6 7 8 9 10
very bad average very good
4-4 Vehicle Management

Performance Analysis
Filter Meaning
Filters for evaluations of the driving style. By default, data sets with evaluations from 1 to 10 are displayed. Here, you can search for vehicles with a very bad (1-3), average (4-6), or very good (7-10) grade.
Filters for evaluations of the degree of difficulty. By default, data sets with evaluations from 1 to 10 are displayed. Here, you can search for vehicles with a very low (1-3), average (4-6), or very high (7-10) degree of difficulty.
Corresponds to the average overall consumption in l/100 km.
By default, data sets with an average fuel consumption between 0-50 l/100 km are displayed. You can search for vehicles with a very high or very low average fuel consumption.
Average Speed in km/h.
By default, data sets with an average speed between 0-100 km/h are displayed. You can search for vehicles with a very high or very low average speed.
Average weight in t including freight.
By default, data sets with an average weight between 0-50 tons are displayed. You can search for vehicles with a very high or very low average weight.
Vehicle Management 4-5

Performance Analysis
You can find further filtering options under
• Vehicle Analysis, Predefined Period(s), Page 4–19
• Vehicle Analysis, Period Breakdown, Page 4–40
4.3.2.2 Contents
The overview table may look as follows:
The individual columns of the table have the following meaning:
Column Meaning
Vehicle Vehicle names of the selected vehicle group.
Vehicle Group Name of the vehicle group.
Telematic Group Designation of the telematics group to which the vehicle is assigned.
4-6 Vehicle Management

Performance Analysis
Driving Style [Grade]
Evaluation of the driving style.
An average value is calculated for the selected period. The evaluation is indicated by values between 1 (very bad) and 10 (very good):
The overall evaluation of the driving style comprises the following items:
• Preventive driving in relation to the fuel consumption and the use of the brakes. The less fuel is consumed and the more careful the brakes are applied, the better the evaluation of the driving style.
• Engine operation relating to the vehicle style map: The gear changing behaviour of the driver influences the evaluation.
• Accelerator pedal movement: The less frequently the accelerator pedal is moved between two thresholds and the less strain is, thus, put on the engine, the better the evaluation of the driving style.
• Uniform vehicle speed: The fewer speed changes are counted, the steadier and more fuel-saving the driver’s driving style. In this case, the evaluation of Uniform Speed will lead to a positive result.
• Number of stops: The fewer stops are counted, the better the driving style.
• Deceleration: Represents the use of the brake during a trip. You can achieve a good evaluation if the brake pedal is handled “carefully”, i.e., for example, if you avoid applying full braking pressure where it is not absolutely necessary.
Column Meaning
Vehicle Management 4-7

Performance Analysis
Degree of Difficulty [Grade]
Evaluation of the degree of difficulty.
The evaluation is indicated by values between 1 (very easy) and 10(very difficult):
The overall evaluation of the degree of difficulty comprises the following items:
• Average slope: Is calculated from the gradient surmounted during a trip. The higher the average slope, the more difficult the trip.
• Number of stops: The more stops are counted, the more difficult the trip.
• Weight: The higher the gross weight, the higher the degree of difficulty.
Total Distance [km] Total distance covered in the selected time range.
Average Weight [t] Average weight of the vehicle including freight, or, if applicable, average value of all vehicles of the selected group.
Average Speed [km/h]
Average speed of the vehicle, or, if applicable, average value of all vehicles of the selected group.
Average Overall Consumption [l/100km]
Average overall fuel consumption of the corresponding vehicle, or, if applicable, average value of all vehicles of the selected group. Includes the drive consumption and the idle consumption.
Average Drive Consumption [l/100 km]
Average fuel consumption of the vehicle, or, if applicable, average value of all vehicles of the selected group.
Number of Vehicles Only available under Vehicle Analysis/Period Breakdown. If you have selected an analysis for a vehicle group, the number of vehicles in the corresponding group is displayed in this column.
Column Meaning
4-8 Vehicle Management

Performance Analysis
The last two lines of the table summarise the results of the analysis:
By clicking the magnifying glass symbol , you can go to the detail view.
Number of Drivers Only available under Driver Analysis/Period Breakdown. If you have selected an analysis for a driver group, the number of drivers in the corresponding group is displayed in this column.
Column Meaning
Line Meaning
Total The total distance covered by all vehicles of the selected group is displayed.
Ø Average values for driving style, degree of difficulty, distance, weight, speed, overall consumption, and drive consumption.
Vehicle Management 4-9

Performance Analysis
4.3.3 Detail View in Performance Analysis MB
The table on the top displays data which you have already seen under Predefined Period(s), Overview Table – Contents. The bottom section displays more details.
4-10 Vehicle Management
Performance Analysis
Driving Style
The overall evaluation of the driving style consists of partial evaluations of the fuel-related and the brake-related driving style:
Consumption-Related Partial
Evaluation
Meaning
Preventive Driving Style
Preventive Driving is calculated from the relation of the distance the service brake was used and the overall distance covered.
The lower the percentage, the better the evaluation. A positive evaluation signifies an economical use of the service brake and, thus, a fuel-saving driving style. It can be achieved by releasing the accelerator pedal in good time when there are obstacles. Obstacles are for example: red traffic lights, green lights which have lasted for a long time, slower road users, junctions.
Pedal Movements [Grade]
Evaluates how often the pedal was moved between two thresholds.
The fewer pedal movements have been made, the lower are the various strains and workloads on the engine and the more favourable is the evaluation.
Stops [Grade] Specifies the number of times the vehicle stopped during the trip or during the selected time period (speed = 0).
A positive evaluation means that the vehicle was stopped only a few times.
Engine Operation M/n (Not Highest Gear) [Grade]
The value refers to the M/n style map for all gears except the highest gear.
A positive evaluation indicates that the driver used an appropriate gear. The longer appropriate gears were used, the better the evaluation.
Vehicle Management 4-11

Performance Analysis
Uniform Speed [Grade]
Evaluates how often the vehicle has changed speed.
The fewer speed changes are counted, the steadier and more fuel-saving is the driver’s driving style and the more favourable is the evaluation.
Consumption-Related Partial
Evaluation
Meaning
Brake-Related Partial
Evaluation
Meaning
Preventive Driving Style
Preventive Driving is calculated from the relation of the distance the service brake was used and the overall distance covered.
The lower the percentage, the better the evaluation. A positive evaluation signifies an economical use of the service brake and, thus, a fuel-saving driving style. It can be achieved by releasing the accelerator pedal in good time when there are obstacles. Obstacles are for example: red traffic lights, green lights which have lasted for a long time, slower road users, junctions.
Deceleration [Grade]
Represents the use of the brake during a trip.
You can achieve a good evaluation if the brake pedal is handled “carefully”, i.e. if you avoid applying full braking pressure where it is not absolutely necessary.
4-12 Vehicle Management

Performance Analysis
Degree of Difficulty
The overall evaluation of the degree of difficulty consists of the following partial evaluations:
Evaluation of the Degree of Difficulty
Meaning
Average Slope [Grade]
The Average Slope gives you an impression of the characteristics of the trip.
A mountainous route corresponds to a rather difficult trip and is assessed with a high value for the average slope (e.g. 10, very mountainous route profile). A rather flat route corresponds to an easy trip and is assessed with a low value (e.g. 1, flat route).
This evaluation is also taken into account in the overall evaluation of the degree of difficulty.
Average Weight [Grade]
Evaluation of the average weight of the vehicle including freight, or, if applicable, average value of all vehicles of the selected group.
A low average weight corresponds to a rather easy trip and is evaluated with a low grade. A high average weight corresponds to a rather difficult trip and is evaluated with a high grade.
This evaluation is also taken into account in the overall evaluation of the degree of difficulty.
Stops [Grade] Specifies the number of times the vehicle stopped during the trip or during the selected time period (speed = 0).
Few stops correspond to an easy trip and are evaluated with a low grade. Many stops correspond to a difficult trip and are evaluated with a high grade.
This evaluation is also taken into account in the overall evaluation of the degree of difficulty.
Vehicle Management 4-13

Performance Analysis
Additional Consumption Values
Further Performance Features
Consumption Value
Meaning
Overall Consumption [l]
The overall consumption includes the drive consumption and the idle consumption.
Drive Consumption [l]
The Drive Consumption [l] indicates the total amount of fuel consumed while driving.
Idle Consumption [l]
Corresponds to the idle fuel consumption of the vehicle.
Value Meaning
Total Distance [km] Corresponds to the total distance covered by the vehicle so far.
Moving Time [hour:min], Idling Time (Engine On) [hour:min], Idling Time (Engine Off) [hour:min]
The values indicate details regarding driving and standing times during the trip.
Braking Distance/Total Distance [%]
Indicates the usage of the service brake during the total distance in per cent.
The lower the percentage, the more preventive the driving style. An economical use of the service brake and, thus, a fuel-saving driving style can be achieved by releasing the accelerator pedal in good time when there are obstacles. Obstacles are for example: red traffic lights, green lights which have lasted for a long time, slower road users, junctions.
4-14 Vehicle Management

Performance Analysis
Braking Distance w/o Brake Wear / Total Distance [%]
Specifies the share of the total distance which the vehicle has travelled without brake wear (engine brake, constant throttle valve, three retarder stages).
The purposeful use of brakes without wear serves to achieve wear minimisation and an economic driving style.
Power Take Off 1 [min] , Power Take Off 2 [min], Power Take Off 3 [min]
Indicates the time in minutes with the power take-off switched on.
Number of Stops Specifies the number of times the vehicle stopped during the trip or during the selected time period (speed = 0 km/h).
Percentage Speed >85km/h / Total Distance
Corresponds to the percentage of the route driven faster than 85 km/h.
This means you can make out whether the vehicle was continuously driven at maximum speed or whether a economic driving style was chosen.
Total Coasting Distance [km]
Refers to the distance (in km) covered while coasting, i.e. the distance covered during the trip without the aid of the engine.
Coasting Distance/Total Distance [%]
Indicates the percentage of the distance covered while coasting.
Value Meaning
Vehicle Management 4-15
Performance Analysis
Diagrams
Cruise Control / Total Distance [%]
Specifies the share of the total distance travelled with cruise control.
Each braking procedure requires renewed acceleration and a higher fuel consupmtion. It is, therefore, often more economical to use a more uniform driving style with an average speed which is as high as possible and oriented towards the traffic situation.
This value is not considered in the evaluation of the driving style and of economic driving.
Value Meaning
Diagram Meaning
Speed Classification FleetBoard utilises 7 speed categories. FleetBoard measures which section of a trip has been covered in which speed category.
The speed classification allows you to make out whether a truck was continuously driven at maximum speed.
By clicking the diagram symbol, you can go to a graphical evaluation of the speed classification (Section The Speed Diagram, Page 4–31).
Braking Distance [km]
Refers to the distance covered (in km) with the service brake applied.
The braking distance influences the evaluation of the driving style. A good evaluation is achieved by handling the brake pedal “carefully” and in a preventive way.
By clicking the diagram symbol, you are led to a graphical evaluation of the use of the service brake (Section The Main Brake Diagram, Page 4–32).
4-16 Vehicle Management

Performance Analysis
Retarder Braking Distance [km]
Distance covered with the retarder applied.
An ideal distribution of the different brake types is: The percentage of the engine brake is high, the percentage of the retarder stages is low.
By clicking the diagram symbol, you can go to a graphical evaluation of the retarder braking distance (Section The Retarder Diagram, Page 4–34).
Engine Operation M/n (Not Highest Gear)
The value refers to the M/n map for all gears except the highest gear.
A good evaluation indicates that the driver used an appropriate gear. The longer appropriate gears were used, the better the evaluation.
This evaluation is also taken into account in the overall evaluation of the driving style.
Highest Gear Torque By clicking the diagram symbol, you can go to a graphical evaluation of the behaviour of the vehicle in the highest gear.
The engine speed in the highest gear cannot be influenced by the driver. This evaluation, therefore, merely gives hints regarding the behaviour of the vehicle and is not included in the evaluation of the driving style (Section The Engine Operation M/n (Highest Gear) Diagram, Page 4–36).
Diagram Meaning
Vehicle Management 4-17
Performance Analysis
Total Torque Classification
By clicking the diagram symbol, you can go to a graphical evaluation of the behaviour of the vehicle in all gears, i.e. including the highest gear.
It is, therefore, a combination of Highest Gear Torque and Engine Operation M/n (Not Highest Gear). The engine speed in the highest gear cannot be influenced by the driver. This evaluation, therefore, merely gives hints regarding the behaviour of the vehicle and is not included in the evaluation of the driving style (Section The Engine Operation M/n (All Gears) Diagram, Page 4–38).
Diagram Meaning
4-18 Vehicle Management

Performance Analysis
4.3.4 Vehicle Analysis, Predefined Period(s)
Provides an analysis for the vehicles of a specific vehicle group or for all vehicles of your vehicle pool. The evaluation is made for the time range you select (a whole year, half a year, a quarter, a month, a calendar week). The values dis-played are average values achieved by the vehicle within the selected period. The results of the analysis enable you to compare the individual vehicles over the selected time range. This enables you to identify any areas for investiga-tion (e.g. a very high fuel consumption).
4.3.4.1 Overview Table Analysis for Predefined Time Period(s)
Overview tables offer comprehensive filter options and give a first overview of the evaluation of the performance analy-sis.
How to Filter Data Sets
The following special filters are available in addition to the general filters:
Filter Meaning
Filters for the data sets of vehicles of a specific vehicle group. By default, the vehicles of all vehicle groups are evaluated.
Filters for data sets of a specific year. By default, data sets of the current year are displayed.
Filters for a period, over which an average value of the analysed values is to be calculated. By default, an average value is calculated for all evaluations of the current year. You can, however, also view the average values for half a year, a quarter, a month, or a calendar week.
Vehicle Management 4-19

Performance Analysis
You will find a description of the general filters in Section Filtering, Page 4–4.
The drop-down list Calendar Week will be displayed.
Use this drop-down list to filter the data sets for a specific calendar week.
To search for data sets for a specific vehicle, enter the name of the vehicle here. Please check for upper and lower case.
Filters vehicles according to a specific telematics group.
Filter Meaning
4-20 Vehicle Management

Performance Analysis
Predefined Period(s), Overview Table – Contents
Each vehicle of the vehicle group is displayed in an individ-ual line of the overview table:
• Degree of Difficulty, Driving Style, Average Weight, Average Speed, Average Overall Consumption, and Aver-age Drive Consumption: The average value for the selected period is displayed for each vehicle.
• Total distance: The total distance covered by each vehi-cle in the selected period is displayed.
• The average values and totals (in the bottom section of the table) are calculated in the following manner:
• Degree of Difficulty, Driving Style, Average Weight, Average Speed, Total Distance, Average Overall Con-sumption, and Average Drive Consumption: Average values of all selected vehicles are shown.
• Total distance: The sum of the total distances of all selected vehicles is displayed.
Vehicle Management 4-21

Performance Analysis
You can find the meaning of the values and their set-up in Section Overview Tables in Performance Analysis MB, Page 4–4.
By clicking the diagram symbol of a value, you can go to a graphical evaluation for this value.
4.3.5 Predefined Period(s) – Graphical Evaluation of the Over-view Table
The graphical evaluation of the Vehicle Analysis and the Driver Analysis for Predefined Period(s) and the Trip(s) Summary provide identical diagrams (only the values are different, of course). These diagrams are, therefore, described together at the example of the Predefined Period(s).
4.3.5.1 The Driving Style Diagram – Predefined Period(s) / Trip(s) Summary
The Driving Style diagram provides an overview of the aver-age driving style evaluation for individual vehicles/drivers. This allows the comparison of driving styles and the identi-fication of irregularities.
Note: Comparing driving styles makes no sense unless the degree of difficulty of the trips was similar in the period of comparison. This is why the degree of difficulty is indicated in the diagram, as well.
4-22 Vehicle Management

Performance Analysis
• The X-axis of the diagram indicates the vehicle names.
• The Y-axis of the diagram shows the evaluation of the driving style (10: very good, 1: unsatisfactory) and the degree of difficulty (10: very high, 1: very low).
• The blue line indicates the average evaluation of the driving style of the selected vehicle group.
• The yellow line indicates the average degree of diffi-culty.
Vehicle Management 4-23

Performance Analysis
4.3.5.2 The Degree of Difficulty Diagram – Predefined Period(s) / Trip(s) Summary
The Degree of Difficulty diagram provides an overview of the average difficulty of the selected vehicle group. Moreover, this diagram shows the evaluation of the driving style. This diagram, therefore, allows you to compare the individual driving styles while considering the degree of difficulty.
• The X-axis of the diagram indicates the vehicle names.
• The Y-axis of the diagram shows the evaluation of the driving style (10: very good, 1: unsatisfactory) and the degree of difficulty (10: very high, 1: very low).
• The blue line indicates the average evaluation of the degree of difficulty of the selected vehicle group.
• The yellow line indicates the average evaluation of the driving style.
4-24 Vehicle Management

Performance Analysis
4.3.5.3 The Total Distance Diagram – Predefined Period(s) / Trip(s) Summary
The diagram displays the total distance covered by the vehi-cles.
• The x-axis indicates the vehicle names.
• The y-axis indicates the distance covered in km.
• The blue line displays the average distance covered by all vehicles.
Vehicle Management 4-25
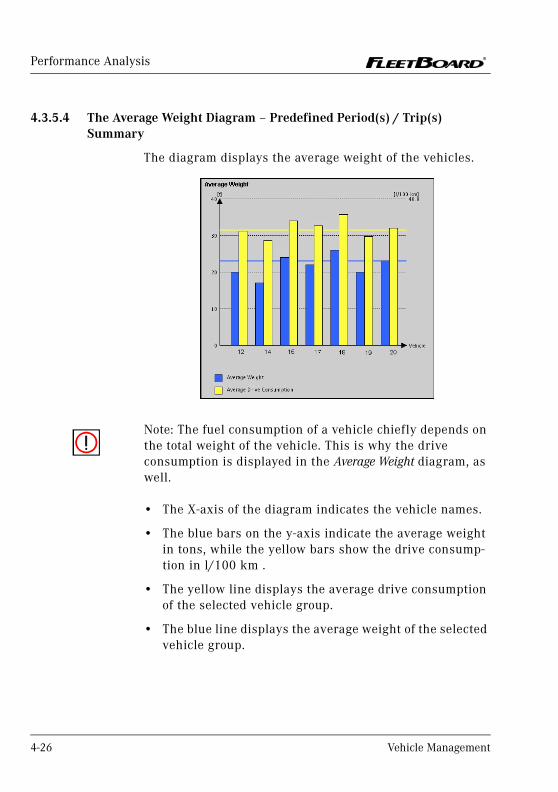
Performance Analysis
4.3.5.4 The Average Weight Diagram – Predefined Period(s) / Trip(s) Summary
The diagram displays the average weight of the vehicles.
• The X-axis of the diagram indicates the vehicle names.
• The blue bars on the y-axis indicate the average weight in tons, while the yellow bars show the drive consump-tion in l/100 km .
• The yellow line displays the average drive consumption of the selected vehicle group.
• The blue line displays the average weight of the selected vehicle group.
Note: The fuel consumption of a vehicle chiefly depends on the total weight of the vehicle. This is why the drive consumption is displayed in the Average Weight diagram, as well.
4-26 Vehicle Management

Performance Analysis
4.3.5.5 The Average Speed Diagram – Predefined Period(s) / Trip(s) Summary
The diagram displays the average speed of the vehicles.
• The X-axis of the diagram indicates the vehicle names.
• The y-axis indicates the average speed in km/h (blue bars).
• The blue line indicates the average speed of the vehicles of the selected group.
Vehicle Management 4-27

Performance Analysis
4.3.5.6 The Average Overall Consumption Diagram – Predefined Period(s) / Trip(s) Summary
The diagram graphically displays the overall fuel consump-tion of the vehicle. The overall consumption includes the drive consumption and the idle consumption.
• The X-axis of the diagram indicates the vehicle names.
• The blue bars on the y-axis indicate the overall con-sumption in l/100 km (blue bars), while the yellow bars show the average weight in t.
• The blue line indicates the average overall consumption of all vehicles of the selected group.
• The yellow line indicates the average weight of all vehi-cles of the selected group.
Note: The fuel consumption of a vehicle chiefly depends on the total weight of the vehicle. This is why the average weight is displayed in the Average Overall Consumption diagram, as well.
4-28 Vehicle Management

Performance Analysis
4.3.5.7 The Average Drive Consumption Diagram – Predefined Period(s) / Trip(s) Summary
The diagram displays the drive consumption of the vehicles.
• The X-axis of the diagram indicates the vehicle names.
• The yellow bars on the y-axis indicate the average weight in tons, while the blue bars show the drive con-sumption in l/100 km.
• The blue line indicates the average drive consumption of all vehicles of the selected group.
• The yellow line indicates the average weight of all vehi-cles of the selected group.
Note: The fuel consumption of a vehicle chiefly depends on the weight. This is why the average weight is displayed in the Average Drive Consumption diagram, as well.
Vehicle Management 4-29

Performance Analysis
4.3.6 Predefined Period(s) – Detail View
Here, you will find detailed analysis data for the selected vehicle.
You can find the meaning of the values and their calculation in Section Detail View in Performance Analysis MB, Page 4–10.
By clicking the diagram symbol of a value, you can go to a graphical evaluation for this value.
Which Driver or Trailer Was Involved?
You can use the Driver or Trailer drop-down lists to check whether a vehicle was driven by different drivers during the evaluation period or whether different trailers were hitched on.
4-30 Vehicle Management

Performance Analysis
The same applies to the Driver Analysis. Here you can addi-tionally check vehicles or trailers.
4.3.7 Predefined Period(s) – Graphical Evaluation of the Detail View
4.3.7.1 The Speed Diagram
Provides a graphical overview of the speed categories within which the vehicles have moved. FleetBoard utilises 7 speed categories: up to 15 km/h, up to 45 km/h, etc.
The chart illustrates the speeds driven at during the trip. The x-axis shows 7 speed categories. The y-axis shows the share (in %) of the total distance covered within each speed category.
In our example, the speed driven at during the trip was mainly within the speed category between 75 and 85.
Vehicle Management 4-31

Performance Analysis
In the table, the contents of the chart are specified in num-bers:
• The first line states the seven speed categories (up to 15 km/h, up to 45 km/h, etc.).
• The second line of the table specifies the distance cov-ered in km within each speed category.
• The third line of the table displays the contents of the second line in per cent.
4.3.7.2 The Main Brake Diagram
The diagram displays the distance the main brake (service brake) was applied during the trip.
• The x-axis shows the braking power of the service brake in % (Braking Force Class).
• The y-axis shows the share (in %) of the total distance covered with the service brake applied.
• The blue line displays the average use of the service brake.
4-32 Vehicle Management

Performance Analysis
Ideally, the service brake should be applied only for short distances and with low braking power. In this case, the dis-tribution will be as shown in our example of the chart.
In the table, the contents of the chart are specified in num-bers:
• The first line specifies the distance covered in km within each braking force class.
• The second line gives information on the share (in %) of the total distance travelled in the corresponding brake classification. This allows you to examine how much braking power the driver applied to the service brake.
If the service brake is used quite frequently, particularly in high braking force classes, this does neither indicate a fuel-saving driving style nor a careful handling of the brakes. Such a driving style ought to be questioned.
Vehicle Management 4-33

Performance Analysis
4.3.7.3 The Retarder Diagram
The diagram displays the distance the retarder was applied during the trip.
• The X-axis shows the retarder settigs (1 to 5).
• The y-axis shows the share (in %) of the total distance covered with the corresponding brake type applied.
• The blue line displays the average distance covered with the retarder class applied.
In the table, the contents of the chart are specified in num-bers:
• The first line specifies for how many km the brake type was used.
• The second line of the table displays the contents of the first line in per cent.
Our example displays an ideal distribution of the retarder settings.
4-34 Vehicle Management

Performance Analysis
4.3.7.4 The Engine Operation M/n (Not Highest Gear) Diagram
This page provides an overview of the temporal distribution of the use of all gears except the highest gear within the M/n style map. M is the torque and n the engine speed. Not High-est Gear refers to all gears except the highest one. This page gives you an impression of the gear changing behaviour of the driver.
The chart can be interpreted in the following way:
• The x-axis displays the RPM range, divided into 6 sec-tions. The engine speed is stated in RPM.
• The y-axis displays the engine torque in %. 100% stands for full speed.
• The coloured section displays how many seconds the truck moved at a specific engine torque and within a specific RPM range during the trip.
The above example illustrates that during the selected time range, the truck was operated for 14,511 seconds at an engine torque between 40 and 55% and an RPM range between 1200 and 1400/minute.
Note: The values for the application of the different retarder settings depend on the settings made by the driver in the vehicle (operating lever at the steering column).
Vehicle Management 4-35
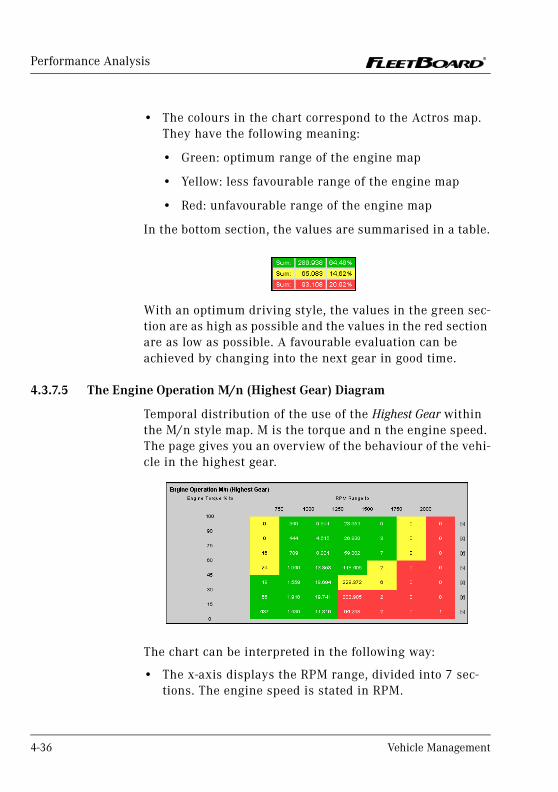
Performance Analysis
• The colours in the chart correspond to the Actros map. They have the following meaning:
• Green: optimum range of the engine map
• Yellow: less favourable range of the engine map
• Red: unfavourable range of the engine map
In the bottom section, the values are summarised in a table.
With an optimum driving style, the values in the green sec-tion are as high as possible and the values in the red section are as low as possible. A favourable evaluation can be achieved by changing into the next gear in good time.
4.3.7.5 The Engine Operation M/n (Highest Gear) Diagram
Temporal distribution of the use of the Highest Gear within the M/n style map. M is the torque and n the engine speed. The page gives you an overview of the behaviour of the vehi-cle in the highest gear.
The chart can be interpreted in the following way:
• The x-axis displays the RPM range, divided into 7 sec-tions. The engine speed is stated in RPM.
4-36 Vehicle Management

Performance Analysis
• The y-axis displays the engine torque in %. 100% stands for full speed.
• The coloured section displays how many seconds during the selected period the truck moved in the highest gear at a specific engine torque and within a specific RPM range.
The above example illustrates that the truck was oper-ated for 18,694 seconds at an engine torque between 30 and 45% and an RPM range between 1000 and 1250/minute.
• The colours in the chart correspond to the Actros map. They have the following meaning:
• Green: optimum range of the engine map
• Yellow: less favourable range of the engine map
• Red: unfavourable range of the engine map
In the bottom section, the values are summarised in a table.
With optimum behaviour of the vehicle in the highest gear, the values in the green section are as high as possible and the values in the red section are as low as possible. The driver can influence this evaluation only by limiting the maximum speed. If the vehicle moves mainly in the red range, it does not fulfil the optimum prerequisites for the transporting purpose.
Vehicle Management 4-37

Performance Analysis
4.3.7.6 The Engine Operation M/n (All Gears) Diagram
This page provides an overview of the temporal distribution of All Gears within the M/n style map. M is the torque and n the engine speed. This page combines the results of The Engine Operation M/n (Highest Gear) Diagram and The Engine Operation M/n (Not Highest Gear) Diagram.
The chart can be interpreted in the following way:
• The x-axis displays the RPM range, divided into 6 sec-tions. The engine speed is stated in RPM.
• The y-axis displays the engine torque in %. 100% stands for full speed.
• The coloured section displays how many seconds during the trip the truck moved using all gears at a specific engine torque and within a specific speed range.
The above example illustrates that the truck was oper-ated for 400 seconds at an engine torque between 0 and 15% and with more RPM than 2000/minute.
• The colours in the chart correspond to the Actros map. They have the following meaning:
• Green: optimum range of the engine map
• Yellow: less favourable range of the engine map
• Red: unfavourable range of the engine map
4-38 Vehicle Management

Performance Analysis
In the bottom section, the values are summarised in a table.
With optimum behaviour of the vehicle in the highest gear and optimum gear changing behaviour of the driver, the val-ues in the green section are as high as possible and the val-ues in the red section are as low as possible.
Vehicle Management 4-39

Performance Analysis
4.3.8 Vehicle Analysis, Period Breakdown
Provides an analysis for individual vehicles or for all vehi-cles of your vehicle fleet. You can enter an interval for the evaluation. Accordingly, the data will be displayed in the form of weekly, monthly, quarterly, biannual, or annual average values. The results of the analysis enable you to compare the data from the selected time intervals. Conse-quently, you can see at a glance whether a poor evaluation for the driving style of a particular vehicle was just an exception during one week, or if the vehicle was continu-ously given poor evaluations for the driving style.
4.3.8.1 Overview Table Period Breakdown
Overview tables offer comprehensive filter options and give a first overview of the evaluation of the performance analy-sis.
You will find further information under:
• How to Filter Data Sets
• Period Breakdown, Overview Table – Contents
How to Filter Data Sets
The following special filters are available in addition to the general filters:
Note: A detail view is only available after selecting an individual vehicle.
Filter Meaning
Filters for the data sets of individual vehicles or for the data sets of vehicles belonging to a specific vehicle group. By default, the vehicles of all vehicle groups are evaluated.
4-40 Vehicle Management

Performance Analysis
You will find a description of the general filters in Section Evaluations in Performance Analysis MB, Page 4–4.
Enter the years of which you want data sets to be displayed.
Define the intervals for which the data sets are to be displayed: annual, biannual, quarterly, monthly, or weekly.
To search for data sets for a specific vehicle, enter the name of the vehicle here. Please check for upper- and lower case-spelling.
Filters vehicles according to a specific telematics group.
Filter Meaning
Vehicle Management 4-41

Performance Analysis
Period Breakdown, Overview Table – Contents
In the overview table, the data sets for each evaluated inter-val are displayed in a separate line. For example, if you have started an analysis with monthly evaluation, a separate line containing average values or sums will be displayed for each month.
The overview table may look as follows:
Individual Vehicle
If you have started an analysis for an individual vehicle, the values displayed refer to this vehicle.
• Degree of Difficulty, Driving Style, Average Weight, Average Speed, Average Overall Consumption, and Aver-age Drive Consumption: The average values of the indi-vidual vehicle are displayed for every interval.
• Total Distance: The total distance covered by the selected vehicle in the corresponding interval is dis-played.
4-42 Vehicle Management

Performance Analysis
• Sum and Average Values (the last two lines of the table):
• Degree of Difficulty, Driving Style, Average Weight, Average Speed, Total Distance, Average Overall Con-sumption, and Average Drive Consumption: Average values of all intervals are displayed for the selected vehicle.
• Total distance: Sum of the distances covered by the vehicle in all displayed intervals.
Vehicle Group
If you have started an analysis for a Vehicle Group, the val-ues displayed refer to this vehicle group.
• Degree of Difficulty, Driving Style, Average Weight, Average Speed, Average Overall Consumption, and Aver-age Drive Consumption: The average value calculated from all values of all vehicles is displayed.
• Total Distance: The total distance covered by all vehicles in the corresponding interval is displayed.
• Sum and Average Values (the last two lines of the table):
• Degree of Difficulty, Driving Style, Average Weight, Average Speed, Total Distance, Average Overall Con-sumption, and Average Drive Consumption: Average values of all vehicles are shown.
• Total Distance: Sum of the distances covered by all vehicles in all displayed intervals.
You can find the meaning of the values and their calculation in Section Overview Tables in Performance Analysis MB, Page 4–4.
By clicking the magnifying glass symbol , you can go to the detail view.
Vehicle Management 4-43

Performance Analysis
By clicking the diagram symbol of a value, you can go to a graphical evaluation of this value.
Prerequisite: You can only reach the detail view for an individual vehicle from the overview table for the vehicle in question.
4-44 Vehicle Management

Performance Analysis
4.3.9 Period Breakdown – Graphical Evaluation of the Overview Table
The Period Breakdown diagrams of the Driver Analysis and the Vehicle Analysis are set up identically (they indicate different values, of course). For this reason, they are described together at the example of the Vehicle Analysis.
• Driver Analysis, Predefined Period(s)
4.3.9.1 The Driving Style Diagram – Period Breakdown
The diagram displays the average evaluation of the driving style and the degree of difficulty for the vehicle or driver.
• The x-axis of the diagram indicates the time.
Note: Comparing driving styles makes no sense unless the degree of difficulty is taken into account. This is why both parameters are always displayed together in a diagram.
Vehicle Management 4-45

Performance Analysis
• The y-axis indicates the evaluation of the driving style and the degree of difficulty.
• The yellow line indicates the average degree of diffi-culty.
• The blue line displays the average evaluation of the driv-ing style.
4.3.9.2 The Degree of Difficulty Diagram – Period Breakdown
The diagram displays the evaluation of the driving style and the degree of difficulty for the vehicle or driver.
• The x-axis of the diagram indicates the time.
Note: Comparing driving styles over a time range makes no sense unless the degree of difficulty is taken into account. This is why both parameters are always displayed together in a diagram.
4-46 Vehicle Management

Performance Analysis
• The y-axis indicates the evaluation of the driving style and the degree of difficulty.
• The yellow line displays the average evaluation of the driving style.
• The blue line displays the average evaluation of the degree of difficulty.
4.3.9.3 The Total Distance Diagram – Period Breakdown
• If you have made an analysis for an individual vehicle or an individual driver:
The diagram graphically displays the distance covered by the vehicle in the individual intervals.
• The x-axis indicates the time.
• The y-axis indicates the distance covered in km.
• The blue line indicates the average distance covered by the vehicle in the corresponding time range.
• If you have made an analysis for all vehicles or all driv-ers:
Vehicle Management 4-47

Performance Analysis
The diagram graphically displays the distance covered by all vehicles in the individual intervals.
• The x-axis indicates the time.
• The y-axis indicates the distance covered in km.
• The yellow line marks the average value of the dis-tance covered by all vehicles.
4.3.9.4 The Average Weight Diagram – Period Breakdown
The fuel consumption of a vehicle chiefly depends on the total weight of the vehicle. This is why the fuel consumption is displayed in the Average Weight diagram, as well.
The diagram graphically displays the average weight of the vehicle or the vehicle group in the individual intervals.
• The x-axis of the diagram indicates the time.
• The blue bars on the y-axis indicate the average weight in tons, while the yellow bars show the drive consump-tion in l/100 km .
4-48 Vehicle Management

Performance Analysis
• The yellow line marks the average drive consumption of the vehicle/of all vehicles in the corresponding time range.
• The blue line marks the average weight of the vehicle/of all vehicles in the corresponding intervals.
4.3.9.5 The Average Speed Diagram – Period Breakdown
The diagram graphically displays the average speed of the vehicle or vehicle group.
• The x-axis of the diagram indicates the time.
• The y-axis indicates the average speed in km/h.
• The blue line indicates the average speed of the vehicle in the corresponding time range.
Vehicle Management 4-49

Performance Analysis
4.3.9.6 The Total Consumption Diagram – Period Breakdown
The fuel consumption of a vehicle chiefly depends on the total weight of the vehicle. This is why the average weight is displayed in the Average Overall Consumption diagram, as well.
• If you have made an analysis for an individual vehicle or an individual driver:
The diagram graphically displays the total fuel consump-tion (sum of the drive consumption and the idle con-sumption) of the vehicle.
• The x-axis of the diagram indicates the time.
• The y-axis displays the overall fuel consumption in l/100 km as well as the average weight.
• If you have made an analysis for an all vehicles or all drivers:
The diagram graphically displays the overall fuel con-sumption of all vehicles.
4-50 Vehicle Management

Performance Analysis
• The x-axis of the diagram indicates the time.
• The y-axis displays the total fuel consumption in l/100 km as well as the weight.
• The blue line marks the average overall consumption of all vehicles in the corresponding time range.
• The yellow line marks the average weight of all vehi-cles in the corresponding time range.
4.3.10 The Drive Consumption Diagram – Period Breakdown
The fuel consumption of a vehicle chiefly depends on the total weight of the vehicle. This is why the average weight is displayed in the Average Drive Consumption diagram, as well.
The diagram graphically displays the drive consumption of the vehicle or vehicle group.
• The x-axis of the diagram indicates the time.
Vehicle Management 4-51

Performance Analysis
• The blue bars on the y-axis indicate the average weight in tons, while the yellow bars show the drive consump-tion in l/100 km .
• The yellow line marks the average drive consumption of the vehicle/of the vehicle group in the corresponding time range.
• The blue line marks the average weight of the vehicle/of all vehicles in the corresponding intervals.
4.3.11 Period Breakdown – Detail View
Here, you will find detailed analysis data for the selected time range.
• Engine Operation M/n (Not Highest Gear), Average Slope, Preventive Driving Style: The average values of the vehicle are displayed.
• Braking Distance, Braking Distance/Total Distance, Number of Stops, Overall Consumption, Drive Consump-tion, Idle Consumption, Moving Time, Stop Time (Engine On), Stop Time (Engine Off), Retarder Braking Distance, Total Coasting Distance, Coasting Distance/Total Dis-tance, Percentage Speed > 85km/h: The values displayed are the total values of the vehicle within the selected time range.
You can find the meaning of the values and their calculation in Section Detail View in Performance Analysis MB, Page 4–10.
Note: A detail view is only available after you have created an overview table for an individual vehicle with the help of the filters.
4-52 Vehicle Management

Performance Analysis
Which Driver or Trailer Was Involved?
You can use the Driver or Trailer drop-down lists to check whether a vehicle was driven by different drivers during the evaluation period or whether different trailers were hitched on.
The same applies to the Driver Analysis. Here you can addi-tionally check vehicles or trailers.
4.3.12 Period Breakdown – Graphical Evaluation of the Detail View
The diagrams correspond to the diagrams for the Prede-fined Period(s): Engine Operation M/n (Not Highest Gear), Braking Distance, Speed Classification, Retarder Braking Distance, Engine Operation M/n, Engine Operation M/n (Highest Gear), and Engine Operation M/n (All Gears) are graphically displayed for the selected vehicle and the selected time period. Please refer to the following sections:
• The Main Brake Diagram, Page 4–32
• The Speed Diagram, Page 4–31
• The Retarder Diagram, Page 4–34
• The Engine Operation M/n (Not Highest Gear) Diagram, Page 4–35
• The Engine Operation M/n (Highest Gear) Diagram, Page 4–36
• The Engine Operation M/n (All Gears) Diagram, Page 4–38
Vehicle Management 4-53

Performance Analysis
4.3.13 Vehicle Analysis, Trip(s) Summary
You can start an analysis for every single trip of your vehi-cles. In this way, you can make out irregularities with regard to high fuel consumption and poor driving style and investigate the causes.
4.3.13.1 What Is a Trip?
A trip, as defined under Performance Analysis, starts with the turning on of the ignition and the inserting of a TCO chart and ends with the removing of the TCO chart and the turning off of the ignition. In the case of vehicles with digital tachographs, a trip starts or ends with inserting or removing the DTCO driver card or FleetBoard driver card.
Internally, the FleetBoard System does not complete a trip before the TCO chart for the next trip has been entered. Only then can the completed trip be transmitted to the FleetBoard Server.
Ignition off at the end of a trip is very important for the full transmission of all data collected in the system to the FleetBoard Server. When there is a TCO chart change with-out ignition off, the data remaining in the system is assigned to the new trip.
If no chart change takes place for more than 24 hours, the trip can be completed automatically.
4.3.13.2 Overview Table Trip(s) Summary
Overview tables offer comprehensive filter options and give a first overview of the evaluation of the performance analy-sis.
4-54 Vehicle Management

Performance Analysis
How to Filter Data Sets
You will find a description of the general filters in Section Evaluations in Performance Analysis MB, Page 4–4.
Trip(s) Summary, Overview Table – Contents
In the overview table, the data sets for each trip selected by means of the filters are displayed in a separate line. You can start an analysis for every single trip of your vehicles and, thus, identify any areas for investigation.
The overview table may look as follows:
• In addition to the evaluation of the vehicle data, the start time and end time of the trip are displayed.
• Degree of Difficulty, Driving Style, Average Weight, Average Speed, Average Overall Consumption, and Aver-
Vehicle Management 4-55

Performance Analysis
age Drive Consumption: For each trip, the average value is displayed.
• Total Distance: The total distance covered during the corresponding trip is displayed.
• Sum and Average Values:
• Degree of Difficulty, Driving Style, Average Weight, Average Speed, Total Distance, Average Overall Con-sumption, and Average Drive Consumption: Average values are shown for all trips displayed in the table.
• Total Distance: the sum of the distances covered in all displayed trips is additionally shown.
You can find the meaning of the values and their composi-tion in Section Overview Tables in Performance Analysis MB, Page 4–4.
By clicking the magnifying glass symbol , you can go to the detail view.
4-56 Vehicle Management

Performance Analysis
4.3.14 Trip(s) Summary – Graphical Evaluation of the Overview Table
The graphical evaluation of the overview table under Trip(s) Summary corresponds to the one under Predefined Period(s). The x-axis shows the analysed vehicles, while the y-axis shows the analysis value for the selected trips. For more information, please refer to the following sections:
• The Driving Style Diagram – Predefined Period(s) / Trip(s) Summary, Page 4–22
• The Degree of Difficulty Diagram – Predefined Period(s) / Trip(s) Summary, Page 4–24
• The Total Distance Diagram – Predefined Period(s) / Trip(s) Summary, Page 4–25
• The Average Weight Diagram – Predefined Period(s) / Trip(s) Summary, Page 4–26
• The Average Speed Diagram – Predefined Period(s) / Trip(s) Summary, Page 4–27
• The Average Overall Consumption Diagram – Predefined Period(s) / Trip(s) Summary, Page 4–28
• The Average Drive Consumption Diagram – Predefined Period(s) / Trip(s) Summary, Page 4–29
4.3.15 Trip(s) Summary – Detail View
Here, you will find detailed analysis data for the selected trip.
Note: Driver and trailer (if available) are displayed in the two drop-down lists. They cannot be modified within a trip. Because of that, you will only find a single entry.
Vehicle Management 4-57

Performance Analysis
You can find the meaning of the values and their calculation in Section Detail View in Performance Analysis MB, Page 4–10.
4.3.16 Trip(s) Summary – Graphical Evaluation of the Detail View
The graphical evaluation of the detail view under Trip(s) Summary corresponds to the one under Predefined Period(s). The only difference is that the data do not refer to a specific time period, but to the selected trip. For more information, please refer to the following sections:
• The Engine Operation M/n (Not Highest Gear) Diagram, Page 4–35
• The Main Brake Diagram, Page 4–32
• The Speed Diagram, Page 4–31
• The Retarder Diagram, Page 4–34
• The Engine Operation M/n (Highest Gear) Diagram, Page 4–36
• The Engine Operation M/n (All Gears) Diagram, Page 4–38
4.3.17 Driver Analysis, Predefined Period(s)
Allows you to evaluate the driving style, degree of difficulty, and driving behaviour with respect to the driver. Thus, you can identify drivers with a fuel-saving driving style and those with a non-fuel-saving driving style. This allows you to train and support your staff according to their individual needs.
The Driver Analysis is started and evaluated just like the corresponding Vehicle Analyses. Please refer to the descrip-tion of the Vehicle Analysis in Section Vehicle Analysis, Pre-defined Period(s), Page 4–19.
4-58 Vehicle Management

Performance Analysis
The driver analysis for predefined periods provides an anal-ysis for the drivers of a specific vehicle group or for all driv-ers of your vehicle pool. The evaluation is made for the time range you select (a whole year, half a year, a quarter, a month, a calendar week).
Just like in the Vehicle Analysis, you are initially led to an overview table containing the analyses for all selected driv-ers. For each driver, a separate line is displayed. The values displayed are average values achieved by the driver within the selected period. The results of the analysis enable you to compare the individual drivers over the selected time range. This enables you to identify any areas for investigation (e.g. a very high fuel consumption).
Subsequently, you can go to the detail view for an individual driver. There, you will find more detailed data.
The Driver Analysis, Predefined Period(s) is started and evaluated analogously to the Vehicle Analysis, Predefined Period(s).
You will find further information under:
• Overview Table Analysis for Predefined Time Period(s), Page 4–19
• Predefined Period(s), Overview Table – Contents, Page 4–21
• Predefined Period(s) – Graphical Evaluation of the Overview Table, Page 4–22
• Predefined Period(s) – Detail View, Page 4–30
Note: If a driver drove too many trucks in the selected time range, you cannot filter for vehicles in the detail view. The resulting amount of data would be too small to provide an informative analysis.
Vehicle Management 4-59

Performance Analysis
4.3.18 Driver Analysis, Period Breakdown
Provides an analysis for individual drivers or for all drivers of your vehicle pool. You can enter an interval for the evalu-ation. Accordingly, the data will be displayed in the form of weekly, monthly, quarterly, biannual, or annual average val-ues.
Just like in the Vehicle Analysis, you are initially led to an overview table with an individual line for each time inter-val. The results of the analysis enable you to compare the data from the selected time intervals. Consequently, you can see at a glance whether a poor evaluation for the driving style of a particular driver was just an exception during one week, or if the driver was continuously given poor evalua-tions for the driving style.
Subsequently, you can go to the detail view for an individual driver. There, you will find more detailed data.
The Driver Analysis, Period Breakdown is started and eval-uated analogously to the one of the Vehicle Analysis, Period Breakdown.
You can find further information under:
• Overview Table Period Breakdown, Page 4–40
• Period Breakdown, Overview Table – Contents, Page 4–42
• Period Breakdown – Detail View, Page 4–52
• Period Breakdown – Graphical Evaluation of the Overview Table, Page 4–45
Note: If a driver drove too many trucks in the selected time range, you cannot filter for vehicles in the detail view. The resulting amount of data would be too small to provide an informative analysis.
4-60 Vehicle Management

Performance Analysis
4.3.19 Driver Analysis – Trip(s) Summary
You can start an analysis for every single trip of your driv-ers.
Just like in the Vehicle Analysis, you are initially led to an overview table with an individual line for each trip of the selected drivers. The results of the analysis enable you to compare the individual trips. In this way, you can make out irregularities with regard to high fuel consumption and poor driving style and investigate the causes.
Subsequently, you can go to the detail view for an individual driver. There, you will find more detailed data.
The Driver Analysis, Trip(s) Summary, is started and evalu-ated analogously to the Vehicle Analysis, Trip(s) Summary.
You will find further information under:
• Overview Table Trip(s) Summary, Page 4–54
• Trip(s) Summary, Overview Table – Contents, Page 4–55
• Trip(s) Summary – Detail View, Page 4–57
• Trip(s) Summary – Graphical Evaluation of the Detail View, Page 4–58
Vehicle Management 4-61

Performance Analysis
4.4 Performance Analysis Universal
Both MB vehicles and vehicles of other makes are able to provide data sets for performance analysis. Non-MB vehi-cles always send their data sets to the Universal Perform-ance Analysis. For MB vehicles, you are free to decide whether these data sets will only be provided for MB Per-formance Analysis or also for Universal Performance Analy-sis. If you have a mixed vehicle fleet and wish to compare data sets of vehicles of different makes, you should have your MB vehicles configured by FleetBoard Support in such a way that they are also able to provide data for Universal Performance Analysis.
4.4.1 Evaluation in Performance Analysis Universal
FleetBoard evaluates the driving style of a driver, the stop time (engine on), the number and time of overrevs, eco-nomic driving, speeding, and the count of harsh brakes according to a point system. The evaluation is done via a scale between 1 and 100 points.
The points have the following meaning:
Points 1 - 70 71 - 85 86 - 100
Colour red black green
Evaluation poor result average result good result
4-62 Vehicle Management

Performance Analysis
4.4.2 The Various Types of Analyses
Vehicle Analysis
Provides a vehicle-related evaluation of the performance analysis.
Driver Analysis
Provides a driver-related evaluation of the performance analysis.
Example of Application:
You can identify drivers with a fuel-saving driving style and those with a non-fuel-saving driving style. This allows you to train and support your staff according to their individual needs.
Vehicle Analysis Contains
Predefined period(s)
Period Breakdown
Trip(s) summary
Driver Analysis Contains
Predefined period(s)
Period Breakdown
Trip(s) summary
Vehicle Management 4-63

Performance Analysis
Predefined Period(s)
Provides an analysis for the drivers/vehicles of a specific vehicle group or for all drivers/vehicles of your vehicle pool. The evaluation is made for the time range you select (a whole year, half a year, a quarter, a month, a calendar week).
The values displayed are average values achieved by the corresponding vehicle or driver within the selected period.
Example of Application:
Comparison of different vehicles and drivers over a selected period of time. This enables you to identify any areas for investigation (e.g. a very high fuel consumption).
Period Breakdown
Provides an analysis for individual drivers/vehicles or for all drivers/vehicles of your vehicle pool. You can enter an interval for the evaluation. Accordingly, the data will be dis-played in the form of weekly, monthly, quarterly, biannual, or annual average and total values.
Example of Application:
The results of the analysis enable you to compare the data from the selected time intervals. In the case of a weekly evaluation, you can see at a glance whether a poor evalua-tion for the driving style of a particular driver was just an exception during one week, or if the driver was continu-ously given poor evaluations for the driving style.
4-64 Vehicle Management

Performance Analysis
Trip(s) Summary
Analyses for each individual trip of your vehicles/drivers.
Example of Application:
In this way, you can make out irregularities with regard to high fuel consumption and poor driving style and investi-gate the causes.
Note: Only when a trip has been completed can the data sets be transmitted to the FleetBoard Server. Subsequently, you can query the data sets of the completed trip.
A trip can be completed, as follows:
• FleetBoard completes a trip if the driver changes, i.e. if the FleetBoard DriverCard is inserted into or removed from the on-board computer.
• If the FleetBoard DriverCard is inserted longer than 24 hours in the on-board computer, the trip is completed automatically.
• If no FleetBoard DriverCard has been inserted into the on-board computer, the trip is daily completed at 00:00 a.m. The point of time when the trip is completed is configured by FleetBoard Support.
Vehicle Management 4-65

Performance Analysis
4.4.3 The Overview Tables in Performance Analysis Universal
The overview table may look as follows:
Overview tables offer comprehensive filter options and give a first overview of the evaluation of the performance analy-sis.
4.4.3.1 Filtering
To find precisely those data sets you are interested in in an easy way, the following filters are provided in the overview tables:
Filter Meaning
Vehicle/Vehicle Group/Driver
Filters data sets of vehicles, vehicle groups, or drivers.
4-66 Vehicle Management

Performance Analysis
Only available under period breakdown: year from/to and interval
Here, you can specify for which year(s) you wish to display data sets and for which intervals: annually, biannually, quarterly, monthly, or weekly.
Only available under period breakdown: Year
Filters for data sets of a specific year. By default, data sets of the current year are displayed.
Only available under period breakdown and trip(s) summary: Period
Filters for a period, over which an average value of the analysed values is to be calculated.
• Predefined period(s): By default, an average value is calculated for all evaluations of the current year.
• Trip(s) summary: By default, only the data sets of the last vehicle set or the last driver set are displayed.
Only available under period breakdown and trip(s) summary.
The drop-down list Calendar Week will be displayed.
Use this drop-down list to filter the data sets for a specific calendar week.
Vehicle Search
Filters the data sets of the vehicle of which you have entered the name here.
Filter Meaning
Vehicle Management 4-67

Performance Analysis
Driving Style [Points]
Filters vehicles or drivers with very good (86 to 100 points), average (71 to 85 points), or very poor (1 to 70 points) evaluation of the driving style.
Idling Time (Engine On) [Points]
Filters vehicles and drivers with long (1 to 70 points), average (71 to 85 points), or short (86 to 100 points) stop time with engine on.
Number of Overrevs [Points]
Filters vehicles and drivers with numerous (1 to 70 points), average (71 to 85 points), or few (86 to 100 points) overrevs.
Overrev Time [Points]
Filters vehicles and drivers with long (1 to 70 points), average (71 to 85 points), or short (86 to 100 points) overrev times.
Economic Driving [Points
Filters vehicles and drivers with poor (1 to 70 points), average (71 to -85 points), or good (86 to 100 points) evaluation of economic driving.
Speeding [Points]
Filters vehicles and drivers with numerous (1 to 70 points), average (71 to -85 points), or few (86 to 100 points) speeding records.
Harsh Brakes [Points]
Filters vehicles and drivers with numerous (1 to 70 points), average (71 to -85 points), or few (86 to 100 points) harsh brakes.
Filter Meaning
4-68 Vehicle Management
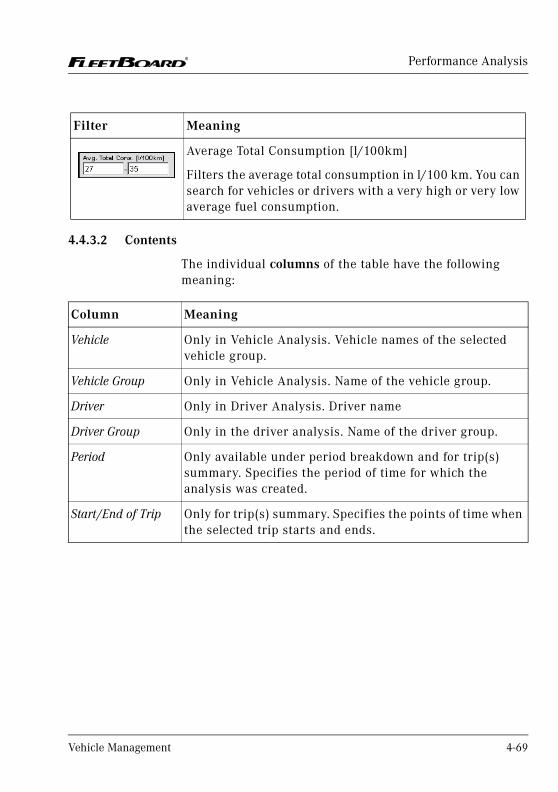
Performance Analysis
4.4.3.2 Contents
The individual columns of the table have the following meaning:
Average Total Consumption [l/100km]
Filters the average total consumption in l/100 km. You can search for vehicles or drivers with a very high or very low average fuel consumption.
Filter Meaning
Column Meaning
Vehicle Only in Vehicle Analysis. Vehicle names of the selected vehicle group.
Vehicle Group Only in Vehicle Analysis. Name of the vehicle group.
Driver Only in Driver Analysis. Driver name
Driver Group Only in the driver analysis. Name of the driver group.
Period Only available under period breakdown and for trip(s) summary. Specifies the period of time for which the analysis was created.
Start/End of Trip Only for trip(s) summary. Specifies the points of time when the selected trip starts and ends.
Vehicle Management 4-69

Performance Analysis
Driving Style [Points]
Evaluation of the driving style.
An average value is calculated for the selected period. The evaluation is made by means of points between 1 (very bad) and 100 (very good):
The overall evaluation of the driving style comprises the following items:
• Number of overrevs
• Time overrevs
• Number of harsh brakes
• Speeding
• Economic driving
• Idling time (engine on)
In general, the following applies: The evaluation of the driver improves the more fuel he saves by means of an economic driving style, the less the engine is strained by overrevs, and the more carefully the brakes are used.
Driv. Distance [km] Total distance covered in the selected time range.
Stop time (engine on) [points]
Evaluation of the idling time with the engine on.
The evaluation is obtained from the relation between idling time (engine on) / operating time [%]. The shorter the idling time with the engine on, the better the evaluation. For the purpose of evaluations points from 1 (very long idling time with engine on) and 100 (very short idling time with engine on) are assigned. A idling stop time with engine on leads to a low fuel consumption and, thus, to a positive evaluation of the driving style.
Column Meaning
4-70 Vehicle Management

Performance Analysis
Number of Overrevs [Points]
Evaluation of the number of overrevs (exceeding the optimum RPM range) in pull operation (i.e. using the accelerator pedal).
The less overrevs, the better the evaluation. The evaluation is made by means of points between 1 (very frequent overrevs) and 100 (very few overrevs). Avoiding overrevs (exceeding the optimum RPM range) helps to reduce the fuel consumption and to reduce the strain on the engine. This evaluation is also taken into account in the overall evaluation of the driving style. A positive evaluation is reached by changing gears in good time and using the next higher gear.
Overrev Time [Points]
Evaluation of the overrev time (exceeding the optimum RPM range) in pull operation (i.e. using the accelerator pedal).
The shorter the overrev times, the better the evaluation.
The evaluation is made by means of points between 1 (very long overrev times) and 100 (very short overrev times).
Avoiding long overrev times (exceeding the optimum RPM range for a longer time) helps to reduce the fuel consumption and to reduce the strain on the engine. This evaluation is also taken into account in the overall evaluation of the driving style. A positive evaluation is reached by changing gears in good time and using the next higher gear.
Column Meaning
Vehicle Management 4-71

Performance Analysis
Economic Driving [Points]
Evaluation of economic driving.
The evaluation is made by means of points between 1 (very bad) and 100 (very good):
The evaluation of economic driving refers to the v/n style map (speed/RPM style map). It is evaluated whether the vehicle is driven with appropriate RPM at different speeds. A good evaluation indicates that the driver drove economically, i.e. used an appropriate gear. The longer appropriate gears were used, the better the evaluation. This evaluation is also taken into account in the overall evaluation of the driving style.
Speeding [Points] Evaluation of the time period during which the vehicle was driven with too high speed related to the total driving time.
The shorter the driving time with speeding, the better the evaluation.
The evaluation is made by means of points between 1 (very long driving time with speeding) and 100 (very short driving time with speeding).
By default, FleetBoard identifies a speed of > 85 km/h as speeding and records the corresponding time period.
The evaluation of speeding is then made in the relation of driving time with speeding / total driving time [%]. This evaluation speeding is also taken into account in the overall evaluation of the driving style.
Column Meaning
4-72 Vehicle Management

Performance Analysis
The last two lines of the table summarise the results of the analysis:
Harsh Brakes [Points]
Evaluation of the number of harsh brakes.
The fewer the harsh brakes, the better the evaluation. The evaluation is made by means of points between 1 (very many harsh brakes) and 100 (very few harsh brakes). As few harsh brakes as possible lead to a low fuel consumption and a driving style which reduces the wear and tear of the vehicle parts.
Average Total Consumption [l/100 km]
Overall fuel consumption of the corresponding vehicle/driver, or, if applicable, total fuel consumption of all vehicles of the selected group. Includes the drive consumption and the idle consumption.
Vehicle Count Only available under Vehicle Analysis/Period Breakdown. If you have selected an analysis for a vehicle group, the number of vehicles in the corresponding group is displayed in this column.
Number of Drivers Only available under Driver Analysis/Period Breakdown. If you have queried an analysis for a time interval, the number of drivers in the corresponding analysis interval is displayed.
Column Meaning
Line Meaning
Total The sum of the total distances of all selected vehicles/drivers in the selected analysis period is displayed.
Ø Average values for driving style, total distance, stop time (engine on), number and time of overrevs, economic driving, speeding, harsh brakes, and average total consumption.
Vehicle Management 4-73

Performance Analysis
By clicking the magnifying glass symbol , you can go to the detail view.
4.4.4 Graphical Evaluation of the Overview Tables
The graphical evaluation of the various analysis types pro-vides similar diagrams. These diagrams are therefore described together at the example of the Vehicle Analysis > Predefined Period(s).
4.4.4.1 Diagram Driving Style
Analysis of Predefined Period(s) and Analysis for Trip(s) Summaries
The Driving Style diagram provides an overview of the aver-age driving style evaluation for individual vehicles/drivers. This permits the comparison of evaluations and the identifi-cation of irregularities.
4-74 Vehicle Management

Performance Analysis
Period Breakdown
The Driving Style diagram provides an overview of the aver-age driving style evaluation for the selected time intervals. This allows you to compare the evaluations of driving styles during predefined time periods.
How to Read the Diagram
• The X-axis shows the vehicles/drivers (for predefined period(s) and trip(s) summary) or the evaluation inter-vals (period breakdown).
• The Y-axis indicates the evaluation of the driving style (100 points: excellent, 0 points: unsatisfactory).
• The blue line indicates the average evaluation of the driving style.
In general, the following applies: A good evaluation of the driving style indicates a behaviour of your drivers which saves fuel and goes easy on the engine.
4.4.4.2 Diagram Total Distance
Vehicle Management 4-75

Performance Analysis
Analysis of Predefined Period(s) and Analysis for Trip(s) Summaries
The Total Distance diagram provides an overview of the aver-age total distance for individual vehicles/drivers.
Period Breakdown
The Total Distance diagram provides an overview of the aver-age total distance for the selected time intervals.
How to Read the Diagram
• The X-axis shows the vehicles/drivers (for predefined period(s) and trip(s) summary) or the evaluation inter-vals (period breakdown).
• The Y-axis indicates the total distance in km.
• The blue line indicates the average total distance.
4.4.4.3 Diagram Idling Time (Engine On)
4-76 Vehicle Management

Performance Analysis
Analysis of Predefined Period(s) and Analysis for Trip(s) Summaries
The Idling Time (Engine On) diagram provides an overview of the idling time (engine on) evaluation for individual vehi-cles/drivers. This permits the comparison of evaluations and the identification of irregularities.
Period Breakdown
The Idling Time (Engine On) diagram provides an overview of the idling time (engine on) evaluation for the selected time intervals. This allows you to compare the evaluations dur-ing predefined time periods.
How to Read the Diagram
• The X-axis shows the vehicles/drivers (for predefined period(s) and trip(s) summary) or the evaluation inter-vals (period breakdown).
• The Y-axis indicates the evaluation of the idling time (engine on) (100 points: excellent, 0 points: unsatisfac-tory).
• The blue line indicates the average evaluation of the idling time (engine on).
In general, the following applies: The shorter the idling time (engine on), the better the evaluation and the lower the fuel consumption. This evaluation of the idling time (engine on) is also taken into account in the overall evaluation of the driving style.
Vehicle Management 4-77

Performance Analysis
4.4.4.4 Diagram Number of Overrevs
Analysis of Predefined Period(s) and Analysis for Trip(s) Summaries
The Total Distance diagram provides an overview of the aver-age total distance for individual vehicles/drivers. This ena-bles you to compare evaluations and identify irregularities.
Period Breakdown
The Number of Overrevs diagram provides an overview of the evaluation of the number of overrevs for the selected time intervals. This allows you to compare the evaluations dur-ing predefined time periods.
How to Read the Diagram
• The X-axis shows the vehicles/drivers (for predefined period(s) and trip(s) summary) or the evaluation inter-vals (period breakdown).
4-78 Vehicle Management
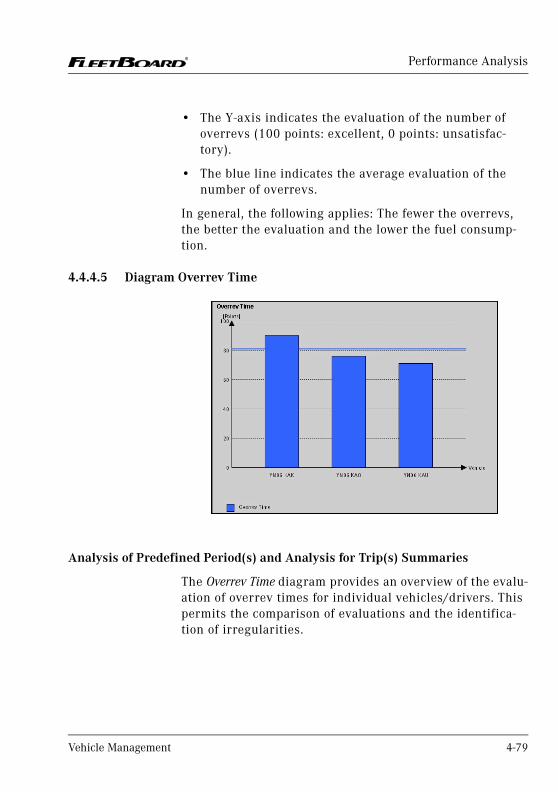
Performance Analysis
• The Y-axis indicates the evaluation of the number of overrevs (100 points: excellent, 0 points: unsatisfac-tory).
• The blue line indicates the average evaluation of the number of overrevs.
In general, the following applies: The fewer the overrevs, the better the evaluation and the lower the fuel consump-tion.
4.4.4.5 Diagram Overrev Time
Analysis of Predefined Period(s) and Analysis for Trip(s) Summaries
The Overrev Time diagram provides an overview of the evalu-ation of overrev times for individual vehicles/drivers. This permits the comparison of evaluations and the identifica-tion of irregularities.
Vehicle Management 4-79

Performance Analysis
Period Breakdown
The Overrev Time diagram provides an overview of the evalu-ation of the overrev times for the selected time intervals. This allows you to compare the evaluations during prede-fined time periods.
How to Read the Diagram
• The X-axis shows the vehicles/drivers (for predefined period(s) and trip(s) summary) or the evaluation inter-vals (period breakdown).
• The Y-axis indicates the evaluation of the overrev times (100 points: excellent, 0 points: unsatisfactory).
• The blue line indicates the average evaluation of the overrev times.
In general, the following applies: The shorter the overrev times, the better the evaluation and the lower the fuel con-sumption.
4-80 Vehicle Management

Performance Analysis
4.4.4.6 Diagram Economic Driving Style
Analysis of Predefined Period(s) and Analysis for Trip(s) Summaries
The Economic Driving Style diagram provides an overview of the average economic driving evaluation for individual vehicles/drivers. This permits the comparison of evalua-tions and the identification of irregularities.
Period Breakdown
The Economic Driving Style diagram provides an overview of the average economic driving evaluation for the selected time intervals. This allows you to compare the evaluations of economic driving during predefined time periods.
How to Read the Diagram
• The X-axis shows the vehicles/drivers (for predefined period(s) and trip(s) summary) or the evaluation inter-vals (period breakdown).
Vehicle Management 4-81

Performance Analysis
• The Y-axis indicates the evaluation of economic driving (100 points: excellent, 0 points: unsatisfactory).
• The blue line indicates the average evaluation of eco-nomic driving.
In general, the following applies: The diagram provides information on the gear shifting performed by your drivers. A positive evaluation indicates that your drivers shift gears in good time and, thus, save fuel and go easy on the engine. You can find a detailed evaluation of economic driving in the diagram Diagram Economic Driving, which you can reach via the detail pages.
4.4.4.7 Diagram Speeding
Analysis of Predefined Period(s) and Analysis for Trip(s) Summaries
The Speeding diagram provides an overview of the speeding evaluation for individual vehicles/drivers. This permits the comparison of evaluations and the identification of irregu-larities.
4-82 Vehicle Management
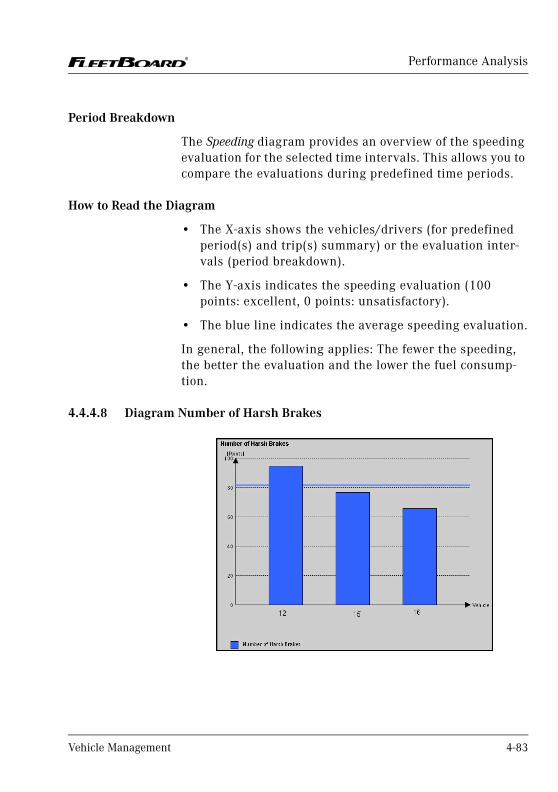
Performance Analysis
Period Breakdown
The Speeding diagram provides an overview of the speeding evaluation for the selected time intervals. This allows you to compare the evaluations during predefined time periods.
How to Read the Diagram
• The X-axis shows the vehicles/drivers (for predefined period(s) and trip(s) summary) or the evaluation inter-vals (period breakdown).
• The Y-axis indicates the speeding evaluation (100 points: excellent, 0 points: unsatisfactory).
• The blue line indicates the average speeding evaluation.
In general, the following applies: The fewer the speeding, the better the evaluation and the lower the fuel consump-tion.
4.4.4.8 Diagram Number of Harsh Brakes
Vehicle Management 4-83

Performance Analysis
Analysis of Predefined Period(s) and Analysis for Trip(s) Summaries
The Number of Harsh Brakes diagram provides an overview of the evaluation of harsh brakes for individual vehicles/driv-ers. This permits the comparison of evaluations and the identification of irregularities.
Period Breakdown
The Number of Harsh Brakes diagram provides an overview of the speeding evaluation for the selected time intervals. This allows you to compare the evaluations during prede-fined time periods.
How to Read the Diagram
• The X-axis shows the vehicles/drivers (for predefined period(s) and trip(s) summary) or the evaluation inter-vals (period breakdown).
• The Y-axis indicates the evaluation of harsh brakes (100 points: excellent, 0 points: unsatisfactory).
• The blue line indicates the average evaluation of harsh brakes.
In general, the following applies: The fewer the harsh brakes, the better the evaluation and the lower the fuel con-sumption and wear and tear.
4-84 Vehicle Management

Performance Analysis
4.4.4.9 Diagram Average Total Consumption
The diagram graphically displays the average total fuel con-sumption of the vehicle. The overall consumption includes the drive consumption and the idle consumption.
Analysis of Predefined Period(s) and Analysis for Trip(s) Summaries
The Average Total Consumption diagram provides an overview of the average total consumption for individual vehicles/drivers. This permits the comparison of evaluations and the identification of irregularities.
Period Breakdown
The Average Total Consumption diagram provides an overview of the evaluation of fuel consumption for the selected time intervals. This allows you to compare the evaluations dur-ing predefined time periods.
Vehicle Management 4-85

Performance Analysis
How to Read the Diagram
• The X-axis shows the vehicles/drivers (for predefined period(s) and trip(s) summary) or the evaluation inter-vals (period breakdown).
• The Y-axis displays the average total fuel consumption.
• The blue line indicates the average of all data sets.
4.4.5 Detail Views
Provides detailed information on the selected data set. Moreover, you can go from here over to the Economic Driving Style and Number of Harsh Brakes diagrams.
Upper Table
In addition to the data of the overview table, this table con-tains general on the selected data set. Amongst others:
• Average Total Consumption [l/100 km]
The total consumption includes the drive consumption and the idle consumption.
• Average Drive Consumption [l/100 km]
The Average Drive Consumption corresponds to the aver-age quantity of fuel used up for a total distance of 100 km.
Note: For period breakdown, the detail view is only available after you have created an overview table for an individual vehicle with the help of the filters.
4-86 Vehicle Management

Performance Analysis
• You can use the Driver or Trailer drop-down lists to check whether a vehicle was driven by different drivers during the evaluation period or whether different trailers were hitched on.
Middle Table
Explanation of the evaluation of the driving style. The over-all evaluation of the driving style comprises the following items:
• Number of Overrevs
• Overrev Time
• Number of Harsh Brakes
• Speeding
• Economic Driving
• Idling Time (Engine On)
In general, the following applies: The evaluation of the driver improves the more fuel he saves by means of an eco-nomic driving style, the less the engine is strained by over-revs, and the more carefully the brakes are used.
Vehicle Management 4-87

Performance Analysis
Lower Table
Further evaluations of the selected data set.
Additional Consumption
Values Meaning
Total Consumption [l]
Consists of drive consumption and idle consumption.
Idle Consumption [l] Corresponds to the total fuel consumption of the vehicle while standing.
Drive Consumption [l]
Corresponds to the total fuel consumption of the vehicle while driving.
PTO Consumption [l] Corresponds to the fuel consumption of the power take off while the vehicle is standing.
4-88 Vehicle Management

Performance Analysis
Further Performance
Features Meaning
Drive Distance [km] Corresponds to the total distance covered by the vehicle so far.
Moving Time [hour:min], IdlingTime (Engine On) [hour:min], Idling Time (Engine Off) [hour:min]
The values indicate details regarding driving and standing times during the trip.
The value Idling Time (Engine On) serves to determine the ratio Idling Time (Engine On) / Operating Time [%]. The evaluation of this ratio is also taken into account in the overall evaluation of the driving style. The lower the value Idling Time (Engine On), the more positive the evaluation of the driving style.
Time of PTO Uses [hour:min]
Indicates the time while the power take off was switched on.
Speeding Time [hour:min]
The time during which the vehicle is driven with a speed higher than 85 km/h.
This evaluation is also taken into account in the overall evaluation of the driving style. The shorter the speeding times, the better the evaluation of the driving style.
Overrev Time [hour:min]
Evaluation of the time during which the vehicle was driven with overrevs (exceeding the optimum RPM range) in pull operation (i.e. using the accelerator pedal).
This evaluation is also taken into account in the overall evaluation of the driving style. The fewer the overrevs, the better the evaluation of the driving style.
Vehicle Management 4-89

Performance Analysis
Number of Overrevs Number of overrevs (exceeding the optimum RPM range) in pull operation (i.e. using the accelerator pedal).
This evaluation is also taken into account in the overall evaluation of the driving style. The fewer the overrevs, the better the evaluation of the driving style.
Time Share Green Section [%]
Corresponds to the percentage of the green section within the style map Economic Driving (see Section Diagram Economic Driving, Page 4–91). A high value indicates that the vehicle was usually driven in the optimal RPM range, which means that the driver shifted to the next gear in good time.
The higher the value, the more economic the driving style and the better the overall evaluation of the driving style.
Number of Harsh Brakes
Specifies the number of harsh brakes performed by the vehicle. This evaluation is also taken into account in the overall evaluation of the driving style. The more harsh brakes, the worse the driving style.
Number of Stops Specifies the number of times the vehicle stopped during the trip or during the selected time period (speed = 0).
Number of PTO Uses Specifies how often the power take off was switched on.
Further Performance
Features Meaning
4-90 Vehicle Management

Performance Analysis
4.4.6 Graphical Evaluation of the Detail Views
4.4.6.1 Diagram Economic Driving
This page gives you an overview how long the vehicle has been driven at which speed and with which RPM. This means, it gives you an impression of the gear changing behaviour of the driver.
How to Read the Diagram
• The x-axis displays the RPM range, divided into 7 sec-tions. The engine speed is stated in RPM.
• The y-axis displays the speed.
• The coloured section displays how many seconds the truck moved at a specific engine torque and within a specific RPM range.
The above example illustrates that during the selected time range, the truck was driven for 6,200 seconds at a speed between 55 and 70 km/h and an RPM range between 1400 and 1600 / minute.
• The colours in the chart correspond to the style map of the vehicle. They have the following meaning:
• Green: optimum range of the engine map
Vehicle Management 4-91

Performance Analysis
• Yellow: less favourable range of the engine map
• Red: unfavourable range of the engine map
In the bottom section, the values are summarised in a table.
With an optimum driving style, the values in the green sec-tion are as high as possible and the values in the red section are as low as possible. A favourable evaluation can be achieved by changing into the next gear in good time.
4.4.6.2 Diagram Harsh Brakes
This page provides an overview how often the vehicle has made harsh brakes and how intensive the harsh brakes were. This means, it gives you an impression of the braking behaviour of the driver.
How to Read the Diagram
• The X-axis displays the various retardation classes. A deceleration class specifies by how many km/h per sec-
4-92 Vehicle Management

Performance Analysis
ond the vehicle is decelerated during the braking proc-ess. A low value assigned for the retardation class, thus, indicates a relatively smooth harsh brake, a high value an intensive harsh brake.
• The y-axis displays the number of braking procedures.
This means the diagram shows how many braking proce-dures the vehicle has performed with which intensity.
In the bottom section, the values are summarised in a table.
An optimum braking procedure is marked by as few harsh brakes as possible. This means that the driver employs an anticipatory driving style and decelerates the vehicle in good time ahead of red traffic lights or obstacles. If harsh brakes are necessary, they should be made in deceleration classes which are as low as possible.
Vehicle Management 4-93

Performance Analysis
4.5 Performance Analysis, Vehicle Query
Here, you can query vehicle trip data which has not yet been sent to FleetBoard automatically.
1. Specify the Addressee to whom you want to send the data. You can select either an individual Vehicle, or a complete Vehicle Group, or the entire fleet.
2. Click Send.
3. You will receive a message asking you whether you really want to start a query.
4. Click Yes to submit the query.
4-94 Vehicle Management

Maintenance
5 Maintenance
Chapter 5Maintenance
General Information on the Service .......................................... 5-2
Prognosis List ............................................................................. 5-3
Status Check ............................................................................... 5-9
Vehicle Query............................................................................ 5-13
Statutory Test Dates.................................................................. 5-15
Vehicle Management 5-1

Maintenance
5.1 General Information on the Service
The maintenance system of the vehicle (e.g. Telligent main-tenance system) determines the service intervals with ref-erence to wear and tear. FleetBoard takes over the data and indicates the service prognoses for the individual mainte-nance positions. In addition, the vehicle can be examined virtually by means of a status check. Information on many functions and conditions, which until now have been checked via visual inspection, becomes available at a click mouse click.
5-2 Vehicle Management

Maintenance
5.2 Prognosis List
The Prognosis List service determines the service intervals for your fleet with reference to the tear and wear. You can view the Prognosis List in an overview table for all your vehicles, and additionally display a detail view for each vehicle containing all service-related information.
5.2.1 Prognosis List, Overview Table
The page Prognosis List, Overview Table provides a convenient overview of the maintenance work to be carried out for your fleet.
Lines displayed in red colour indicate that a maintenance date for this vehicle has already been exceeded.
Note: Compared to MB vehicles, the Maintenance Prognosis service provides only very little information for all-makes vehicles.
Vehicle Management 5-3

Maintenance
• In the Vehicle column, the vehicles are listed with the names you specified.
• Telematic Group specifies the telematics group the vehicle is assigned to.
• The Vehicle Group column indicates the group to which the vehicle is assigned.
• The Date Time column contains the date and the time the prognosis was made.
• Mileage specifies the mileage of the vehicle at the read-out time of the query.
• The Next Maintenance Activity column contains the earli-est service job for the selected vehicle to be prognosti-cated by the maintenance system.
The following service activities are displayed:
• General maintenance
• Engine (only for MB vehicles)
• Time Maintenance (only for MB vehicles)
• Air Drier (only for MB vehicles)
• Retarder (only for MB vehicles)
• Transmission (only for MB vehicles)
• Rear Axles (only for MB vehicles)
• Main Service
• Emissions Test
• Safety Inspection
• Tachograph Inspection
• ADR (Inspection to European Agreement Concerning the International Carriage of Dangerous Goods by Road)
5-4 Vehicle Management

Maintenance
• The Date of Next Maintenance Activity column contains the prognosticated date when the next maintenance job is due. The following entries are possible:
• The column does not contain any data: The Telligent maintenance system cannot yet determine a mainte-nance date, which means that the next maintenance date is still far ahead.
• The Date of Next Maintenance Activity contains the entry Immediate Service: The maintenance work is immediately due.
• The Date of Next Maintenance Activity contains a date. It indicates the next prognosticated maintenance date. If an exclamation mark is used instead of the date, this means that the service position in question is already overdue. In this case, the date will be dis-played in red.
• The Distance to Next Maintenance Activity column contains the prognosticated number of kilometres the vehicle will run until this service job is due.
Average Values are calculated in the bottom lines of the table.
Note: For all vehicles, the due dates for main service, emissions tests, safety inspections, tachograph inspections, and ADR are specified only if you have entered this data under Statutory Test Dates. For all further maintenance activities for all-makes vehicles, merely the mileage up to the next maintenance interval is specified, but not the type of maintenance work. In the Maintenance Work column, thus, only the term General Maintenance is entered in all cases.
Vehicle Management 5-5

Maintenance
5.2.1.1 How to Use Filters in the Prognosis List
To view only selected data sets (e.g. those of a specific vehi-cle), filter the data.
For example, if you want to view only those vehicles for which a service job is prognosticated in the current month, select Current Month under Maintenance Due.
If you wish to know which vehicles have less than 2000 km to go until the next service job is due, enter the correspond-ing value under Next Maintenance.
Click View. The desired data sets will be displayed in the table.
5.2.2 Prognosis List, Detail View
The page Prognosis List, Detail View for an individual vehicle contains all service jobs for which the Telligent mainte-nance system is able to compute maintenance prognoses. The positions may change, depending on the equipment of the vehicle.
• In the top section of the page, the information of the overview table is shown again.
5-6 Vehicle Management

Maintenance
• In the bottom section of the page, you can find a table with detailed information on the service prognosis and the service interval for the various maintenance jobs. The entries are sorted according to the due date. The mainte-nance work which has to be done next is listed at the top of the table. The values Date of Next Maintenance and Renewal Distance refer to the calculated service progno-sis. The following entries are possible:
• The columns Date of Next Maintenance and Renewal Dis-tance do not contain any data: The Telligent mainte-nance system cannot yet determine a maintenance date, which means that the next maintenance date is still far ahead.
• The Date of Next Maintenance Activity contains the entry Immediate Service, the column Renewal Distance does not contain any value: The maintenance work is immediately due.
• The Date of Next Maintenance Activity contains a date. It indicates the next prognosticated maintenance date. If an exclamation mark is used instead of the date, this means that the service position in question is
Vehicle Management 5-7

Maintenance
already overdue. In this case, the date will be dis-played in red.
• The Renewal Distance column contains the prognosti-cated number of kilometres the vehicle will run until this maintenance work is due.
• The Mileage column refers to the current mileage of the vehicle.
• The Operating Time indicates the total operating time of the selected vehicle.
• The positions Oil Qualit, Fuel Quality, Oil Viscosity, and Transmission Oil Quality provide information on the serv-ice parameters set in the workshop. These parameters are used by the Telligent maintenance system as the basis to compute the service prognoses.
Note: For all-makes vehicles, merely the mileage up to the next maintenance work is specified, but not the type of maintenance work. In the Maintenance Work column, thus, only the term General Maintenance is entered in all cases.
5-8 Vehicle Management

Maintenance
5.3 Status Check
The Status Check provides important information on the current status of your fleet. Are the brake linings of your vehicle used up? Are the oil and coolant levels still OK? Is the wash water reservoir level still sufficient?
5.3.1 Status Check, Overview Table
The Status Check, Overview Table page gives you an overview of all vehicles of the selected vehicle group.
• In the Vehicle column, the vehicles are listed with the names specified by you.
• The Vehicle Group column indicates the group to which the vehicle is assigned.
Note: The Status Check service is not available for all-makes vehicles.
Vehicle Management 5-9

Maintenance
• The Date Time column indicates the date and time the query was made.
• The Faulty Bulb Count column indicates the number of faulty bulbs.
• The Current Maximum Brake Wear column indicates the value (in per cent) computed as the maximum brake wear by means of a check of all axles.
• Three values may occur in the Cooling Water Level Warning Count.
• OK: There is enough cooling water.
• Pre-warning: The coolant level is close to the critical limit and ought to be refilled.
• Warning: The coolant level has reached or exceeded the critical limit and has to be refilled immediately in order to avoid damage to the vehicle.
• The Oil Shortfall column specifies the amount of oil in the engine with reference to the maximum oil level. > MAX means that there is too much oil in the engine; < MAX indicates that there is not enough oil in the engine.
• The Air Filter Condition column indicates the condition of the air filter. The status can either be OK or Not OK.
5.3.1.1 How to Use Filters in the Status List
To view only selected data sets, use the filters.
For example, if you want to know which vehicles report a warning because their cooling water level is too low, select the corresponding entry:
5-10 Vehicle Management

Maintenance
Then, click the View button. The desired data sets will be displayed in the table.
Moreover, you can use the input fields to filter for:
• The number of faulty bulbs
• Current maximum brake wear
• Air filter
5.3.2 Status Check, Detail View
The page Status Check, Detail View for a selected vehicle pro-vides an overview of the condition of the vehicle at the rea-dout time of the query.
In the top section of the page, the information of the over-view table is shown again.
In the bottom section of the page, the following details are given:
• The eight positions which contain the term Brake Wear indicate the wear on brakes of the axles in per cent. If no value is indicated for Brake Wear as the degree of wear,
Vehicle Management 5-11

Maintenance
this means that no wear can be measured or that these brakes (axles) are not installed in the vehicle.
• The position Operating Time indicates the total operating time of the vehicle in hours.
• The value under Total Mileage indicates the current mile-age of the vehicle.
• The value Current Fuel Consumption corresponds to the cumulative fuel consumption of the commercial vehicle during its complete lifetime (in the case of older vehicles starting with the installation/activation of the function).
• The Oil Pressure is indicated in Bar and assumes values of 0 to 10.
• The values of the positions Power Steering Oil Level and Washing Water Reserve can assume the values OK or Not OK.
5-12 Vehicle Management

Maintenance
5.4 Vehicle Query
The Vehicle Query Form allows you to start a query for a vehi-cle or vehicle group at any time by sending an appropriate message.
1. On the following page, select Request Type. Queries regarding the Service Prognosis and the Status Check are available. The results of the queries correspond to those described on the previous pages.
2. Subsequently, specify the Addressee to whom you want to send the data. You can select either an individual Vehicle, or a complete Vehicle Group, or the entire fleet.
3. Click Submit.
4. You will receive a message asking you whether you really want to start a query.
Note: You can only carry out vehicle queries for vehicles belonging to the MB telematics group. Therefore, only vehicles belonging to this telematics group are displayed under Addressee > Vehicle. Accordingly, only vehicle groups containing vehicles of the MB telematics group are displayed under Addressee > Vehicle Group.
Vehicle Management 5-13

Maintenance
5. Click Yes to submit the query.
5-14 Vehicle Management

Maintenance
5.5 Statutory Test Dates
Enter the next statutory test dates for each vehicle of your fleet here. Click Save to import the data.
Only after entering the statutory test dates will these be evaluated in the Maintenance Prognosis.
Statutory test dates are:
• Main Service
• Emissions Test
• Safety Inspection
• Tachograph Inspection
• ADR
Vehicle Management 5-15

Maintenance
5-16 Vehicle Management

Telediagnostics
6 Telediagnostics
Chapter 6Telediagnostics
General Information on Telediagnostics ................................... 6-2
Current Faults............................................................................. 6-3
Stored Faults ............................................................................... 6-6
Control Unit List ....................................................................... 6-10
Technical Data........................................................................... 6-15
Telediagnostics, Vehicle Query ................................................ 6-23
Vehicle Management 6-1

Telediagnostics
6.1 General Information on Telediagnostics
The Telediagnostics service is highly specialised in terms of its contents and is primarily intended for service staff and workshops. A service technician will be able to interpret the technical data available in MB-Service. This information can be very useful in the event of errors and problems.
Note: The Telediagnostics service is not available for all-makes vehicles.
6-2 Vehicle Management

Telediagnostics
6.2 Current Faults
The Current Faults tab provides information whether all con-trol units, such as the Telligent maintenance system, the braking system, or the drive control of your vehicles work properly. If disturbances of the control units occur, you will be informed on the type and degree of the disturbance.
6.2.1 Current Faults, Overview Table
On this page, an overview of all vehicles of your fleet is pro-vided.
• In the Vehicle column, the vehicles are listed with the names you specified.
• The Vehicle Group column indicates the group to which the vehicle is assigned.
• The Date Time column indicates the date and time the query was made.
Vehicle Management 6-3

Telediagnostics
• If the Telligent maintenance system detects an error of a control unit of a vehicle at the readout time of the query, this error will be displayed as follows:
• Control Unit contains the abbreviation of the control unit with the most severe error. A table with the abbreviations of all control units is provided under Control Unit List, Detail View, Page 6–11.
• Current Faults Count contains the number of current malfunctions.
• Quality Rating specifies how severe the malfunction is.
6.2.2 How to Use Filters in Current Faults
To view only selected data sets, use the filters. Apart from the standard filters Vehicle, Mileage, Operating Time, and Time Period, the following filters are available:
• Control Units: Allows you to search for malfunctions in specific control units.
• Current Faults Count: Allows you to search e.g. for vehi-cles with many malfunctions.
• Quality Rating: Allows you to search e.g. for severe mal-functions with the value 2. To do so, make the following entry:
Quality rating Meaning
0 Minor error which should be removed later.
1 Error of medium severity which should be removed as soon as possible in a workshop.
2 Severe error, driving features may be restricted.
6-4 Vehicle Management

Telediagnostics
Click View.
The desired data sets will be displayed.
6.2.3 Current Faults, Detail View
Here, you will find detailed information regarding malfunc-tions in the vehicle.
• If the Telligent maintenance system detects an error during the readout of the query, the control unit report-ing the error is listed together with its specific abbrevia-tion in the Control Unit column. A list with the abbreviations of all control units is provided under Section Control Unit List, Detail View, Page 6–11.
• The Quality Rating column can assume three values:
Value Meaning
0 Minor error which should be removed later.
1 Error of medium severity which should be removed as soon as possible in a workshop.
Vehicle Management 6-5

Telediagnostics
• Path provides information on a specific line from a con-trol unit to a peripheral device. In Actros, the lines are numbered, which allows a service technician to identify the interfered line.
• The position Kind provides information on the kind of error occurred, such as short circuit, line interference in the path described above, etc. A service technician is able to identify the error type with the help of the number entered here.
• Time Count: Indicates for each control unit how many hours have passed since the error message was sent, and/or at which time the error message was sent.
If a control unit reports an error, the hour counter is immediately activated and starts to count upwards. If the control unit does not report an error within the next 125 hours, the error message is deleted (latent error).
• Environment Data contains measured data where the error occurred. A service technician will be able to inter-pret the data.
6.3 Stored Faults
The Stored Faults list provides an insight into all errors reported by your vehicle. The data in the Stored Faults list can only be deleted in a workshop.
2 Severe error, driving features may be restricted.
Value Meaning
6-6 Vehicle Management

Telediagnostics
You can have all queries stored in the memory of the Telligent maintenance system displayed for a vehicle group. In addition, it is possible to query all error queries started by an individual vehicle or all errors present in a vehicle at the readout time of a query.
6.3.1 Stored Faults, Overview Table
Provides an overview of all vehicles of your fleet.
• In the Vehicle column, the vehicles are listed with the names specified by you.
• The Vehicle Group column indicates the group to which the vehicle is assigned.
• The Date Time column indicates the date and time the query was made.
• Mileage contains the mileage of the vehicle at the readout time of the query.
• The Operating Time column contains the operating time of the engine in hours at the readout time of the query.
Vehicle Management 6-7

Telediagnostics
6.3.2 How to Filter the Stored Faults List
1. To view only selected data sets (e.g. those of a specific vehicle), filter the data with the help of the drop-down lists and fields. The filters Vehicle, Mileage, Operating Time, Control Unit, and Time Period are available.
2. Click View.
The desired data sets will be displayed.
6.3.3 Stored Faults, Detail View
The detail view of the Stored Faults list provides an over-view of all errors (current or already removed) which are stored in the list at the readout time of the query. When removing the error in the workshop, the error memory will be reset.
• The Control Unit column lists each control unit which has reported at least one error. Specific abbreviations are
6-8 Vehicle Management

Telediagnostics
used. You can find a list of the abbreviations used for the control units under Section Control Unit List, Page 6–11.
• In the Error Count column, the values 0 and 1 may occur. If 1 is displayed, the error occurred at the readout time of the query. If 0 is displayed, the error no longer existed at the readout time of the query.
• Three values may occur in the Quality Rating column, which are explained in the following table:
• Path provides information on a specific line from a con-trol unit to a peripheral device. In Actros, the lines are numbered, which allows a service technician to identify the interfered line.
• The position Time Count is a counter by hours. If a control unit reports an error, the hour counter is immediately activated and starts to count upwards. If the control unit does not report an error within the next 125 hours, the error message is deleted (latent error).
Note: If a control unit has already reported several errors, these are numbered in the Error Count column. Up to 15 errors can be stored, depending on the control unit.
Value Meaning
0 Minor error which should be removed later.
1 Error of medium severity which should be removed as soon as possible in a workshop.
2 Severe error, driving features may be restricted.
Vehicle Management 6-9

Telediagnostics
• The position Kind provides information on the kind of error occurred, such as short circuit, line interference in the path described above, etc. A service technician is able to identify the error type with the help of the number entered here.
• Environment Data contains measured data where the error occurred. A service technician will be able to inter-pret the data.
6.4 Control Unit List
The Control Unit List provides the complete information on the control units installed in your vehicle. You can, thus, see e.g. the version or part number and the year of manufac-ture at one glance.
6.4.1 Control Unit List, Overview Table
The overview table for the Control Unit List gives you an over-view of all vehicles of your fleet.
6-10 Vehicle Management

Telediagnostics
• In the Vehicle column, the vehicles are listed with the names specified by you.
• The Vehicle Group column indicates the group to which the vehicle is assigned.
• The Date Time column indicates the date and time the query was made.
• Mileage contains the mileage of the vehicle at the readout time of the query.
• The Operating Time column contains the operating time of the engine in hours at the readout time of the query.
• TP Version: software version of the installed telematics platform.
• Protocol Version: version of the FleetBoard transmission protocol.
• Control Unit Hardware: hardware version of the control unit interface KOM.
• Control Unit Software: software version of the control unit interface KOM.
6.4.2 How to Use Filters in the Control Unit List
1. To view only selected data sets, use the filters. The fil-ters Vehicle, Mileage, Operating Time, Time Period, Control Unit, and Protocol Version are available.
2. Click View.
The desired data sets will be displayed.
6.4.3 Control Unit List, Detail View
The detail view of the Control Unit List gives you an overview of all control units installed in the vehicle.
Vehicle Management 6-11

Telediagnostics
• The Control Unit column lists all control units installed in the vehicle together with their specific abbreviations. The abbreviations for the control units have the follow-ing meanings:
Abbreviation Meaning
ABS Anti-lock brake system
AG Automatic gear selection
ANE Trailer recognition
ART Intelligent autonomous cruise control
ASR Acceleration skid control
AUF Semitrailer recognition
BS Braking system
EAB Electronic trailer brake
6-12 Vehicle Management
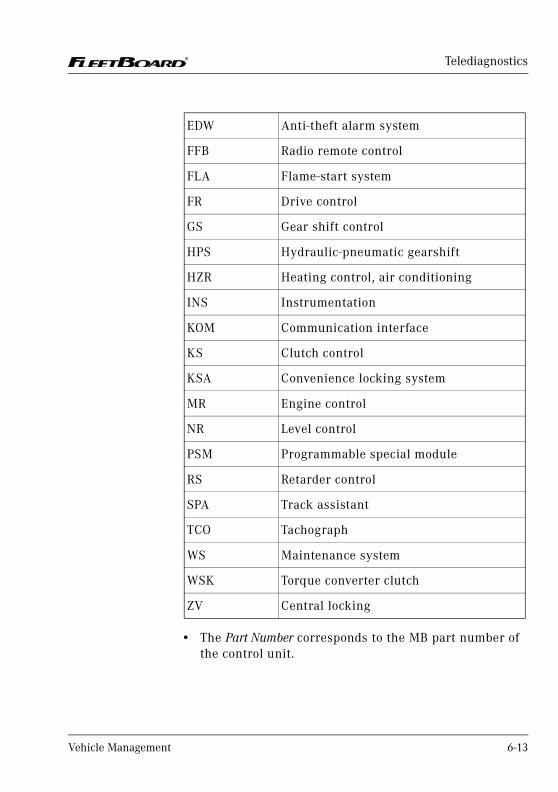
Telediagnostics
• The Part Number corresponds to the MB part number of the control unit.
EDW Anti-theft alarm system
FFB Radio remote control
FLA Flame-start system
FR Drive control
GS Gear shift control
HPS Hydraulic-pneumatic gearshift
HZR Heating control, air conditioning
INS Instrumentation
KOM Communication interface
KS Clutch control
KSA Convenience locking system
MR Engine control
NR Level control
PSM Programmable special module
RS Retarder control
SPA Track assistant
TCO Tachograph
WS Maintenance system
WSK Torque converter clutch
ZV Central locking
Vehicle Management 6-13

Telediagnostics
• Production Date indicates the date the control unit was manufactured. This defines the release status unambig-uously.
• The position Test Program Version provides information on the appropriate test program for a test and corresponds to the service release status.
• Hardware/Software Version provides information on the release status.
The service technicians in the workshops will be able to interpret the data.
6-14 Vehicle Management

Telediagnostics
6.5 Technical Data
6.5.1 General Information on Technical Data
You can query ready-made, complete data packages. You are offered the choice between General technical data and tech-nical data on Axles and Transmission, on the Braking System, and on the Engine and Cooling Circuit. You can find a more detailed explanation of these pre-defined data packages in Section Predefined Query – Detail View, Page 6–20.
In addition, you can define your own data packages and start an individual query. For information on how to do this, please refer to Section Individual Query, Page 6–17.
The technical data are divided into the following parameter groups:
Parameter groups Meaning
Alg General value
LL Data regarding the life cycle
MW Measurement values
PA Parameter
PR Prognosis data
Vehicle Management 6-15

Telediagnostics
FleetBoard uses abbreviations for the technical data. These have the following meaning:
Abbreviation Meaning
Akt Current
AWa General maintenance
B1HA Brake 1st rear axle
B1VA Brake 1st front axle
B2HA Brake 2nd rear axle
B2VA Brake 2nd front axle
Fzg Vehicle
Get Transmission
KraV Fuel consumption
Kue Cooling system
Kup Clutch
Luf Air filter
Mot Engine
Par Parameter
Ret Retarder
RTC Real time clock
Ütemp Excess temperature
VA Front axle
Ver PTO (power take-off gear)
6-16 Vehicle Management

Telediagnostics
6.5.2 Individual Query
Under Technical Data > Individual Query, you can group and define the technical data your vehicles are to transmit. You can then start an individual query to request the data you have defined.
6.5.2.1 How to Define an Individual Query
Under Technical Data > Individual Query > Define, you can define the technical data you want your vehicle to transmit. All FleetBoard users with their own login can configure their own data packages.
From the left list (Available Parameters), you can select the technical data you want to query. The right list (Parameters to be Requested) indicates the technical data which has already been selected.
Supposing you want to check the engine oil pressure and oil level of one of your vehicles.
1. From the left list under Parameters to be Requested, select the entry Alg_Mot_Oeldruck.
2. Click the double arrow pointing to the right to place the selected entry in the list to the right.
Vehicle Management 6-17

Telediagnostics
3. Carry out steps 2 and 3 for the parameter engine level Alg_Mot_Oelstand and, if required, for any further parameters you want to query.To remove an entry from the Parameters to be Requested list, select it and click .To change the sort order of the entries in the list, select an entry and click the or button. The sort order of the entries in the list affects the way the query results will be displayed later.
4. If all the entries you want to query are included in the Parameters to be Requested list in the window to the right, click the Save button to save the list.
You can now start a vehicle query to query the selected data package.
Note: You can also select several parameters simultaneously. To do so, hold down the Ctrl or the Shift key while selecting the desired parameters. Then, click the arrow button between the two lists to place all the selected entries in the list to the right.
If you wish to query all data, click All.
6-18 Vehicle Management

Telediagnostics
You will find further information under:
• Telediagnostics, Vehicle Query, Page 6–23
6.5.2.2 Viewing the Results of an Individual Query
Under Individual Query > Show, the result of the current indi-vidual queries will be displayed. The overview table and the detail views are similar to those of pre-defined queries.
You will find further information under:
• Predefined Query – Overview Tables, Page 6–19
• Predefined Query – Detail View, Page 6–20
6.5.3 Predefined Query
FleetBoard offers you predefined data packages which you can request from any vehicle. You can also make every vehi-cle send these predefined data packages automatically in regular intervals. Please refer to the documentation on the Customer Administration.
6.5.3.1 Predefined Query – Overview Tables
These tables are set up in the same way for each data pack-age.
Vehicle Management 6-19

Telediagnostics
• In the Vehicle column, the vehicle names of the selected group are listed.
• The Vehicle Group column indicates the vehicle group to which each vehicle belongs.
• The Date Time column contains the date and the time the query was made.
• The Mileage column contains the mileage of the vehicle at the readout time of the query.
• The Operating Time column contains the operating time of the engine in hours at the readout time of the query.
How to Filter the Technical Data
1. To view only selected data sets (e.g. those of a specific vehicle), filter the data with the help of the drop-down lists and input fields. The standard filters Vehicle, Mileage, Operating Time, and Date Time are available. Via Vehicle Search, you can directly search for data of a spe-cific vehicle. To do this, enter the vehicle name.
2. Click View.
6.5.3.2 Predefined Query – Detail View
Here you can find the results of the queries for a selected vehicle.
General Vehicle Data
Data which provides an overview of the general state of your vehicle, e.g. the temperature data.
Note: If “-” is displayed instead of a result for a query, this value is not available. Unless defined otherwise, queries checking the status of a vehicle system (e.g. washing water reserve or bulb check) yield the result 0 if no error has been detected and 1 if an error has been detected.
6-20 Vehicle Management

Telediagnostics
The meaning of the abbreviations in the parameters is given in the tables in Section General Information on Technical Data, Page 6–15.
You can determine for the complete fleet which data is dis-played here. For this purpose, please contact the FleetBoard Support.
Engine, Cooling
Selected data sets are offered which provide information on the condition of the engine and the cooling circuit of your vehicles.
The meaning of the abbreviations in the parameters is given in the tables in Section General Information on Technical Data, Page 6–15.
You can determine for the complete fleet which data is dis-played here. For this purpose, please contact the FleetBoard Support.
SCR NOX
Selected data sets are offered which provide information on the emissions cleaning conducted for your vehicles.
The meaning of the abbreviations in the parameters is given in the tables in Section General Information on Technical Data, Page 6–15.
You can determine for the complete fleet which data is dis-played here. For this purpose, please contact the FleetBoard Support.
Gear Box, Retarder, Clutch
Selected data sets are offered which provide information on the state of the gear box, retarder, and clutch.
The meaning of the abbreviations in the parameters is given in the tables in Section General Information on Technical Data, Page 6–15.
Vehicle Management 6-21

Telediagnostics
You can determine for the complete fleet which data is dis-played here. For this purpose, please contact the FleetBoard Support.
Drive Axles HL
Data which refers to the function of the driven rear axle.
The meaning of the abbreviations in the parameters is given in the tables in Section General Information on Technical Data, Page 6–15.
You can determine for the complete fleet which data is dis-played here. For this purpose, please contact the FleetBoard Support.
PTO, Axles AL, HD
Data referring to the functions of the driven front axle (AL), the driven torque axle rear axle (HD), and the PTO.
The meaning of the abbreviations in the parameters is given in the tables in Section General Information on Technical Data, Page 6–15.
You can determine for the complete fleet which data is dis-played here. For this purpose, please contact the FleetBoard Support.
Brake
Selected data sets are offered which provide information on the condition of the braking systems of your vehicles.
The meaning of the abbreviations in the parameters is given in the tables in Section General Information on Technical Data, Page 6–15.
You can determine for the complete fleet which data is dis-played here. For this purpose, please contact the FleetBoard Support.
6-22 Vehicle Management

Telediagnostics
Control Unit List
Selected data sets are offered which provide information on the control units of your vehicles.
The meaning of the abbreviations in the parameters is given in the tables in Section General Information on Technical Data, Page 6–15.
You can determine for the complete fleet which data is dis-played here. For this purpose, please contact the FleetBoard Support.
6.6 Telediagnostics, Vehicle Query
To start a vehicle query, proceed as follows:
1. Under Inquiry Type, select which type of vehicle query you wish to start.
2. Select a vehicle, a vehicle group, or the entire fleet as addressee.
Vehicle Management 6-23

Telediagnostics
3. Click the Submit button.
You will receive a message asking you whether you really want to start a query.
4. Click Yes to submit the query.
The requested data will now be queried from the vehicle.
Note: You can only carry out vehicle queries for telediagnostics purposes for vehicles belonging to the MB telematics group. Therefore, only vehicles belonging to this telematics group are displayed under Addressee > Vehicle. Accordingly, only vehicle groups containing vehicles of the MB telematics group are displayed under Addressee > Vehicle Group.
6-24 Vehicle Management

AABS 6–12Accelerator pedal movement
Performance Analysis MB 4–7Acrobat Reader 1–6ADR 5–4AG 6–12Air filter 5–10Alarm 2–3Alg 6–15All-Makes 1–12All-makes vehicles 4–2ANE 6–12ART 6–12ASR 6–12AUF 6–12Average overall consumption
Performance Analysis MB 4–8Average slope
Performance Analysis MB 4–13Average speed
Diagram MB 4–27, 4–49Filter 4–5Performance Analysis MB 4–8
Average total consumptionDiagram MB 4–85Filter 4–69Universal 4–73
Average weightDiagram MB 4–26, 4–48Filter 4–5Performance Analysis MB 4–8, 4–13
BBrake 6–22Brake wear 5–10, 5–11
Braking distancePerformance Analysis MB 4–16
Braking distance w/o brake wear / total distance
Performance Analysis MB 4–15Braking distance/total distance
Performance Analysis MB 4–14Browsing between data sets 1–15BS 6–12Bulbs 5–10Buttons 1–8
Export 1–9Help 1–9Mapping 1–9Messages 1–8Print 1–9Services 1–8Support 1–9
CCalendar week
Filter 4–20, 4–67Clutch 6–21Coasting distance/total distance
Performance Analysis MB 4–15Control unit hardware 6–11Control unit list 6–4, 6–5, 6–8, 6–10, 6–23
Abbreviations 6–12Control unit software 6–11Coolant level 5–10Cooling data 1–5Cooling water 5–10Cruise control / total distance
Performance Analysis MB 4–16Current error 6–9Current faults 6–3
Index
Index
Vehicle Management i

Current fuel consumption 5–12
DDate time 1–13Deceleration 4–12
Performance Analysis MB 4–7Degree of difficulty
Diagram MB 4–24, 4–46Filter 4–5Performance Analysis MB 4–8
Detail view 1–16Performance Analysis 4–10
Diagnostics identification 6–14Diagram
Go to 4–3Symbol 4–3
Distance 3–7Distance to next maintenance activity5–5Driv. distance 4–70Drive consumption
Diagram MB 4–29, 4–51Filter 4–5Performance Analysis MB 4–8, 4–14Performance Analysis Universal 4–88
Drive distancePerformance Analysis Universal 4–89
Driver 1–12Filter 1–12, 4–66not available 2–4
Driver analysis MB 4–58Period breakdown 4–60Predefined period(s) 4–58Trip(s) summary 4–61
Driver Analysis Universal 4–63Period Breakdown 4–64Predefined period(s) 4–64Trip(s) summary 4–65
Driver workstation 1–4Driving style
Diagram 4–74Diagram MB 4–22, 4–45Diagram Universal 4–75Evaluation 4–70Filter 4–5, 4–68Performance Analysis MB 4–7Universal 4–70
DTCO ID 1–12Duration 3–7
EEAB 6–12Economic driving 4–72
Diagram 4–91Filter 4–68
Economic driving styleDiagram 4–81
EDW 6–12End 4–69End of trip 4–55, 4–69Engine operation
Performance Analysis MB 4–7Engine operation M/n
All gears 4–18, 4–38Highest gear 4–17, 4–36Not highest gear 4–11, 4–17, 4–35
Engine speed 4–35, 4–38Engine torque 4–35, 4–37, 4–38Engine, cooling 6–21Environment data 6–6, 6–10Evaluation system 4–4, 4–62
Index
Vehicle Management ii

Excel 1–16Export 1–16
Button 1–9
FFFB 6–12Filter 1–11
Average speed 4–5Average total consumption 4–69Average weight 4–5Calendar week 4–20, 4–67Date time 1–13Degree of difficulty 4–5Drive consumption 4–5Driver 1–12, 4–66Driving style 4–5, 4–68Economic driving 4–68Harsh brakes 4–68Idling time (engine on) 4–68Interval 4–41, 4–67Number of overrevs 4–68Period 4–19, 4–67Reset 1–14Speeding 4–68Time overrevs 4–68Total consumption 4–69Trailer 1–12Undo 1–14Vehicle 1–12, 4–66Vehicle group 4–19, 4–40, 4–66Year 4–19, 4–41, 4–67
FLA 6–13FleetBoard DriverCard 1–12Forms 1–6Forwarding received messages 2–12FR 6–13Fuel quality 5–8
GGear box 6–21General vehicle data 6–20GPS date time 3–5Grading system 4–4GS 6–13
HHardware version 6–14Harsh brake
Diagram 4–92Harsh brakes 4–73
Filter 4–68Home call 2–3HPS 6–13HZR 6–13
IIcons 1–15Idle consumption
Performance Analysis MB 4–14Performance Analysis Universal 4–88
Idling time (engine off) 4–89Performance Analysis MB 4–14
Idling time (engine on) 4–89Diagram Universal 4–77Filter 4–68Performance Analysis MB 4–14Performance Analysis Universal 4–70
Ignition 4–54Inbox mail list 2–3Individual query 6–17
Defining 6–17View results 6–19
Information pages 1–10
Index
Vehicle Management iii

INS 6–13Interval
Filter 4–41, 4–67
KKind of error 6–6
Stored faults 6–10KOM 6–13KS 6–13KSA 6–13
LLL 6–15Login 1–2
Fleet 1–2Password 1–2User 1–2
Logout 1–6
MMagnifying glass symbol 1–16Main brake
Diagram MB 4–32Maintenance 5–2
Prognosis list 5–3Status list 5–9
Maintenance due 5–5Malfunction list
Environment data 6–6Kind 6–6Number 6–4Path 6–6Quality rating 6–4Time count 6–6
Manuals 1–5
Mapping 1–5Button 1–9
MB 1–12MB vehicles 4–2Message type 2–5Messages 1–3, 2–2
Button 1–8Filter 2–5Forwarding 2–12Home call 2–3Inbox mail list 2–3New messages 2–3Outbox mail list 2–7Read confirmation 2–7Read confirmation: Request 2–10Send free text message 2–10Table of contents 2–7Vehicle language 2–6
Microsoft Excel 1–16Moving time
Performance Analysis MB 4–14Performance Analysis Universal 4–89
MR 6–13MW 6–15
NNavigation bar 1–7Navigation symbols 1–15Next maintenance activity 5–4Non-MB vehicles 1–12NR 6–13Number of drivers
Performance Analysis MB 4–9Performance Analysis Universal 4–73
Index
Vehicle Management iv

Number of harsh brakes 4–90Diagram 4–84
Number of overrevs 4–71, 4–90Diagram 4–78Filter 4–68
Number of PTO uses 4–90Number of stops 4–15
Performance Analysis MB 4–7Performance Analysis Universal 4–90
Number of vehiclesPerformance Analysis MB 4–8
OOil pressure 5–12Oil quality 5–8Oil shortfall 5–10Oil viscosity 5–8Online help, activating 1–9Operation
General information 1–10Outbox mail list 2–7Overrev Time
Diagram 4–79Overrev time 4–71, 4–89Overview table 1–11
PPA 6–15Part number 6–13Password 1–2Path 6–6, 6–9PDF files 1–6Pedal movement 4–11Percentage speed > 85km/h 4–15Performance Analysis 4–1, 4–2
Detail view 4–10
How to use 4–3Important symbols 4–3MB 4–4Overview table 4–4Universal 4–62
Performance analysis 1–4Vehicle query 4–94
Performance Analysis MBDriver analysis 4–58Evaluation 4–4Grading 4–4Vehicle analysis 4–19, 4–40
Performance Analysis UniversalDriver analysis 4–63Evaluation 4–62Points 4–62Vehicle Analysis 4–63
PeriodFilter 4–19, 4–67
Point system 4–62Position 3–3Power steering oil level 5–12Power take off
Performance Analysis MB 4–15PR 6–15Predefined query 6–19Preventive driving style
Performance Analysis MB 4–7, 4–11, 4–12
PrintButton 1–9
Production date⁄week 6–13Prognosis list 5–3
Distance to next maintenance activi-ty 5–5Fuel quality 5–8Maintenance due 5–5
Index
Vehicle Management v

Oil quality 5–8Oil viscosity 5–8Transmission oil quality 5–8
Protocol version 6–11PSM 6–13PTO consumption
Performance Analysis Universal 4–88
QQuality rating 6–4, 6–9
RRead confirmation 2–7Retardation class 4–92Retarder 6–21Retarder braking distance
Diagram MB 4–34Performance Analysis MB 4–17
Retarder settings 4–34Routing 1–5RS 6–13
SSCR NOX 6–21Send free text message 2–10Service 1–4Service intervals 5–2Services 1–3
Button 1–8Messages 1–3Performance analysis 1–4Service 1–4Telediagnostics 1–4Trip records 1–4
Single Trips 3–6
Software version 6–14Sorting 1–14SPA 6–13Speed classification
Diagram MB 4–31Performance Analysis MB 4–16
Speeding 4–72Diagram 4–82Filter 4–68
Start and end of a trip or pause 3–7Start of trip 4–55, 4–69Starting FleetBoard 1–2Status list 5–9
Air filter 5–10Brake wear 5–11Bulbs 5–10Cooling water level warning count 5–10Current fuel consumption 5–12Current maximum brake wear 5–10Oil pressure 5–12Oil shortfall 5–10Power steering oil level 5–12Washing water reserve 5–12
StopsPerformance Analysis MB 4–11, 4–13
Stored faults 6–6Control unit 6–8Current 6–9Environment data 6–10Kind of error 6–10Path 6–9Quality rating 6–9
SupportContacting 1–9
Index
Vehicle Management vi

SymbolsPerformance Analysis 4–3
TTCO 6–13TCO chart 4–54Technical data 6–15
Brake 6–22Control unit list 6–23Engine, cooling 6–21Gear box, retarder, clutch 6–21General vehicle data 6–20Individual query 6–17Predefined queries 6–19SCR NOX 6–21
Telediagnostics 1–4, 6–2Control unit list 6–10Current faults 6–3Individual query 6–17Predefined queries 6–19Stored faults 6–6Technical data 6–15
Telematic group 1–12All-Makes 1–12MB 1–12
Telligent maintenance system 5–2Time count 6–6, 6–9
Stored faults 6–9Time of PTO Uses
Performance Analysis Universal 4–89
Time overrevsFilter 4–68
Time share green section 4–90Total coasting distance
Performance Analysis MB 4–15Total consumption
Diagram 4–85Diagram MB 4–28, 4–50Filter 4–69Performance Analysis MB 4–14Performance Analysis Universal 4–88
Total distanceDiagram MB 4–25, 4–47Diagram Universal 4–76Performance Analysis MB 4–8, 4–14
TP version 6–11Trailer
Filter 1–12Transmission oil quality 5–8Trip 3–2, 4–54Trip Records
Average speed 3–8Distance 3–7Duration 3–7GPS date time 3–5Position 3–3Single Trips 3–6Start and end 3–7Status 3–7Vehicle Query Form 3–10
Trip records 1–4, 3–2
UUniform speed 4–12Uniform vehicle speed
Performance Analysis MB 4–7User 1–2
VVehicle 1–12
Filter 1–12, 4–66
Index
Vehicle Management vii

Vehicle analysis MBPeriod breakdown 4–40Predefined period(s) 4–19Trip(s) summary 4–54
Vehicle Analysis Universal 4–63Period Breakdown 4–64Predefined period(s) 4–64Trip(s) summary 4–65
Vehicle countPerformance Analysis MB 4–8Performance Analysis Universal 4–73
Vehicle groupFilter 4–19, 4–40, 4–66
Vehicle language 2–6Vehicle query
Maintenance 5–13Telediagnostics 6–23
Vehicle Query FormTrip Records 3–10
Vehicle registration date 2–6Vehicle search 4–67
WWashing water reserve 5–12WS 6–13WSK 6–13
YYear
Filter 4–19, 4–41, 4–67
ZZV 6–13
Index
Vehicle Management viii


If you require help or further information, please contact the FleetBoard hotline.You can find the current contact on the FleetBoard user website under Support.
Status: August 2008, Subject to modifications.Daimler FleetBoard GmbH, Germany, Stuttgart
www.FleetBoard.com