vegetative cover in minnesota: prospects and challenges
TRANSCRIPT

Vegetative Cover in Minnesota: Prospects and Challenges
Opportunities for Pasture and Forage, Cover Crops, Small Grains and Perennial Crops to Improve Water Quality
July 2020

6/30/2020 1
Authors and Contributors
Doris Mold, Sunrise Consulting: Researcher
Suzanne Rhees, Board of Water and Soil Resources: Writer and Editor
Minnesota Department of Agriculture Project Team
Emily Jerve, Supervisor, Agricultural Marketing and Development Division
Bob Patton, Supervisor, Agricultural Marketing and Development Division
Margaret Wagner, Manager, Pesticide and Fertilizer Management Division
Acknowledgements
Thanks to the following reviewers:
Jeff Berg, Denton Bruening, Jen Schaust, David Weinand, MDA
Doug Bos, Rock County Soil and Water Conservation District
Laura DeBeer, Pipestone County Soil and Water Conservation District
Blaine Delzer, Dodge County Soil and Water Conservation District
Keith Olander, Ag and Energy Center, Central Lakes College
Jill Sackett Eberhart, BWSR
Thanks to the farmers and allied stakeholders who were interviewed for this study and who provided
detailed information and invaluable insights into their operations, research and related enterprises.
Project funding provided by the Clean Water Fund (from the Clean Water, Land and
Legacy Amendment).

6/30/2020 2
Contents Executive Summary ....................................................................................................................................... 3
Opportunities ............................................................................................................................................ 5
I. Study Purpose .......................................................................................................................................... 10
II. Methods .................................................................................................................................................. 10
III. The Context: Agriculture in Minnesota and the study areas ................................................................. 11
Agriculture in the study areas ................................................................................................................. 13
Dairy cattle .......................................................................................................................................... 13
Beef cattle ........................................................................................................................................... 14
Extent of pasture ................................................................................................................................. 14
Hay production ................................................................................................................................... 15
Corn silage production ........................................................................................................................ 16
Cover crop use .................................................................................................................................... 17
Regional characteristics of the study areas ........................................................................................ 18
IV. Agricultural practices of surveyed farmers ............................................................................................ 19
Grazing and pasture practices ................................................................................................................ 20
Forage production practices ................................................................................................................... 21
Cover crop practices ............................................................................................................................... 23
Small grains, other short season crops, and specialty/emerging crops ................................................. 25
Small Grains ........................................................................................................................................ 25
Other Short Season Crops ................................................................................................................... 27
Specialty Crops / Emerging Crops ....................................................................................................... 28
References .................................................................................................................................................. 30
Appendix A: Detailed Tables ....................................................................................................................... 31
Regional characteristics of the study areas ............................................................................................ 32
Appendix B: State Agricultural Grant and Loan Programs That Can Support Vegetative Cover ............... 35
Appendix C: Study Methods and Detailed Responses ............................................................................... 38
Farmer Interviews and Profile ................................................................................................................ 38
Allied Stakeholder Survey ....................................................................................................................... 39
Organizations Interviewed .................................................................................................................. 40
Appendix D: Questionnaires ........................................................................................................................ 2
Participant/Farm Profile ........................................................................................................................... 2
Allied Stakeholder Questionnaire ............................................................................................................. 7

6/30/2020 3
Executive Summary
The Vegetative Cover Study was initiated to learn whether
there are economically viable opportunities to expand
environmentally protective crops to improve water
quality, targeting areas with highly vulnerable
groundwater in Minnesota. The primary focus of this
study is on those crops and cropping systems that have
traditionally been grown in Minnesota, including
perennial crops, small grains, and cover crops, with the
premise that these were historically grown profitably, and
therefore there is an opportunity to grow them again.
Related study goals are:
• To identify existing and potential barriers to
adoption of additional vegetative cover.
• To identify actions that the Minnesota
Department of Agriculture and its partners can
take to capitalize on opportunities, overcome or
mitigate barriers, and increase chances for
success.
There are both opportunities and challenges in
establishing vegetative cover to improve water quality in
areas with highly vulnerable groundwater. These are
summarized in the next few pages and further discussed
by cover type on pages 18-27. Vegetative cover is defined
for the purpose of this study as vegetation that keeps the
soil covered throughout the year, particularly in spring
and fall. This may include a single crop (e.g. alfalfa) or a
cropping system (e.g. cover crops following corn silage).
By contrast, summer annual row crops typically leave the
soil bare (without vegetative cover) from October to June,
exposing it to erosion from wind and water and potential
nutrient runoff and leaching into surface waters,
subsurface tile drains or groundwater. Increasing
vegetative cover is an important strategy to help protect
water and soil resources.
Vegetative cover includes, but is not limited to, the
following categories:
• Perennial forage crops such as grass, alfalfa and
red clover for haying and grazing;
Vegetative Cover and Groundwater/ Drinking Water Protection
As stated in the Minnesota Nitrogen
Fertilizer Management Plan, current
agricultural crop production systems
require the input of nitrogen fertilizer
to increase production. The nitrate
form of nitrogen is very soluble in
water and can leach into groundwater.
Nitrate in groundwater is a public
health concern, especially for infants
under six months of age. This is
important since approximately three
out of four Minnesotans rely on
groundwater for their drinking water
supply. The Minnesota Department of
Agriculture (MDA) is the lead state
agency in Minnesota for nitrogen
fertilizer and has authority to regulate
its use, if necessary, to protect
groundwater quality.
The Nitrogen Fertilizer Management
Plan and Groundwater Protection Rule
acknowledge that in some parts of the
state, especially those with coarse-
textured soils, typical best
management practices for corn and
soybean may not be sufficient to
prevent or reduce nitrate leaching. In
these cases, the MDA encourages
farmers to consider Alternative
Management Tools (AMTs), including
increasing vegetative cover on the
landscape. Continuous cover can be
achieved by diversifying crop
rotations, adopting perennial cropping
systems and incorporating cover
crops. All the vegetative cover
strategies examined in this study can
help to achieve the goal of protecting
water resources.

6/30/2020 4
• Cover crops such as winter cereal rye, oats, and red
clover for grazing, feed and/or soil health benefits;
• Small grains, including wheat and oats, as well as
winter annuals such as cereal rye and winter wheat;
• Emerging specialty crops such as Kernza® (perennial
wheatgrass) and oilseeds (harvestable cover crops) for
food, oil and other uses.
There is considerable overlap between these categories since
many cover types have similar end uses. For example, cover
crops are frequently grazed, while small grains can be used as
cover crops.
Small grains such as spring wheat are included because they
are harvested earlier in the season than corn for grain, and
therefore offer opportunities for establishment of cover crops.
This opportunity is also present for silage corn. Other crops
such as sugar beets and potatoes also provide opportunities
for cover crops within the rotation but are not discussed in
this report. Likewise, perennial grasses planted in buffers or
other conservation areas are not discussed in this report, since
they are not typically grazed or harvested (although these
practices are permitted in some areas).
The term “forage” is used in several ways. In general, “forage”
includes any plant eaten by grazing livestock, as well as plants
cut and then fed to livestock, especially as hay or silage. For
the purpose of this report, “perennial forage” refers to alfalfa
and other legumes, and grass hay and other grasses that are
grazed or harvested, but not to corn silage. However, these
terms are used somewhat interchangeably by the interviewed
farmers and other stakeholders.
Study areas: Three study areas with highly vulnerable
groundwater were identified (see Figure 1): the Central Sands
(10 counties), southeast (7 counties) and southwest (3
counties). Each region has unique vulnerabilities to nitrate
contamination of groundwater: coarse-textured, sandy soils
and shallow distance to groundwater in the Central Sands
region; fractured limestone and shallow topsoil of the karst
topography in the southeast; and limited water supplies
drawn from alluvial channels near the surface and problematic
deeper groundwater in the southwest.
Study methods: Interviews were conducted with 36 farmers
and 66 allied industry partners who either interact with
farmers directly or have an interest in vegetative cover. Of the
farmers surveyed, 29 farmed in one of the three study areas.
Interview Highlights*
On Grazing Grazing keeps the brush and weeds
down on non-tillable acres.
A healthy environment for cattle; good
for the land. No erosion after gully
washers.
We graze pasture to improve our soil
quality, improve our species, and
utilize the land we own as well as
make our cattle production profitable.
Better for the cows: they harvest their
own food and distribute their own
manure. They are healthier.
I'm always interested in refining my
management abilities for pasture.
Fundamentally, I would like to get a
better handle on what level of
productivity I should expect from my
pastures, measured in Animal Unit
Grazing Days per Acre. Corn producers
have an objective goal of, say, 200
bushels per acre -- pasture productivity
is more difficult to measure, and it's
harder to know if I'm coming close to
my potential.
When it’s not in pasture you have a
hard time putting it back into pasture –
seeding, fencing, water.
Always more animals than pasture.
Annual forages and cover crops are
used to fill the gap.
Keep livestock in the community. Better
markets would help. Lower property
taxes, based on the land’s producing
ability, could encourage more pasture.
I need more land, but with land being
dominated by commodities, it’s hard to
buy or rent it.

6/30/2020 5
The consultant also engaged with participants at field days,
farm management association meetings, and related
conferences. A selection of responses from interviews and
questionnaires are shown in the sidebars on the following
pages. This report represents a ‘snapshot in time’ during
2018-2019 and may not be representative of all
stakeholders. This report captures the thoughts and ideas
of individuals who were interviewed because of their
experience and expertise, as well as others encountered
through the outreach and interview process.
Opportunities
Pasture, grazing and forage
The study area counties include some of the most heavily
populated dairy areas in the state, indicating that there is
still plenty of opportunity for vegetative cover to be
utilized as feed in these areas. However, opportunities
vary between dairy cattle and beef cattle.
Most of the interviewed farmers who graze livestock are
grazing beef cattle on pasture. Of the dairy farmers in the
study, only one grazed their milking herd, although nine
grazed heifers and five grazed dry cows.
The majority of dairy farms in Minnesota feed milking cows
in confinement. Confined feeding offers more control over
the cow’s diet and results in higher milk production.
However, many producers graze dry cows and heifers.
Corn silage is harvested earlier in the season than corn for
grain; therefore, it offers opportunities for establishment
of cover crops.
• Corn silage has become a greater portion of the
feed ration for dairy cows, often replacing haylage.
Alfalfa hay and haylage were once looked at as the
foundation of a dairy cow’s diet. However,
challenges in harvesting hay or haylage under
current weather patterns have caused many
producers to shift to a larger percentage of corn
silage.
• Custom silage operators harvest many acres and
could provide an audience for focused outreach
and assistance to plant cover crops within the
study areas.
Interview Highlights
Forage Production Forages follow livestock. Farms are
primarily growing alfalfa and corn
silage and harvesting grass hay out of
waterways and buffers. Farms are
constrained from expanding forages
because of several factors, including
work, weather, transportation,
storage, and the fact that it is
tougher to market.
I would benefit from more specific
knowledge about managing diverse
perennial grass/legume pasture/hay
land. I'm not sure I am optimizing
the productivity of my forage
production. I have questions about
harvest timing, maturity
management, managing the process
of dormancy in the fall, and
extending the grazing season without
damaging the sward in the fall and
winter.
With all the rain, difficult to put up
quality hay.
It helps cut feed costs.
Simple, easy, and most return per
acre.
Many mid-sized producers work off-
farm jobs. Adding forages to the mix
adds time/labor they feel they don’t
have. The bigger operations have
little or no need for forages, unless
they are a dairy.
Very important as part of contour
strip cropping to stop erosion.
Hay is more profitable than corn and
soybeans but it’s hard to change it
into cash, with weather and market
risks.
Allow CRP harvesting with a lower
payment.
Offer functional crop insurance for
foragers.

6/30/2020 6
• Large dairies that purchase corn silage and other
forages in bulk may be interested in improving the
sustainability of their operations by offering
direction or incentives to their silage producers to
incorporate cover crops.
Alfalfa remains important in the dairy ration but is subject
to many uncertainties, from weather to volatile markets. It
also requires significantly more equipment and labor from
the producer throughout the growing season, compared to
corn and soybeans. In addition, the introduction of distillers’
grains in the dairy ration has provided a cheaper protein
source and a better-balanced ration for ruminant animals.
New uses for alfalfa are being explored by USDA and
partners, including protein extraction for aquaculture feed
and other foods. However, near-term opportunities can be
identified in both large dairies and smaller integrated
operations. At least one large Minnesota dairy is
encouraging planting of low-lignin alfalfa, which can provide
improved fiber digestibility even if harvest is delayed for a
few days.
Packaged hay products also offer opportunities for growth.
These include:
• Dry hay for pet food and bedding
• High-quality blended feed for horses containing
alfalfa and grass
• Packaged feed for chicken and goats (including both
grains and alfalfa)
Beef cattle operations are still well-suited to grazing and
forage harvest. Interviews indicate that smaller livestock
producers are more likely than larger ones to grow their own
forage. The number of beef cows in Minnesota has remained
relatively steady in the last five years (about 370,000).
However, the number of small livestock producers has
declined in recent years (The number of Minnesota farms
with livestock in all size categories except the largest – 500 or
more cattle or calves – declined from 2012 to 2017).
Producers located in sensitive groundwater areas could be
targeted for incentive payments and technical assistance to
expand and diversify their forage production.
Incentives to assist in establishment of small beef herds and
grazing practices can offer the next generation a pathway
into farming, especially given the financial and knowledge
barriers to entry into both crop farming and dairy farming.
Interview Highlights
Cover Crops It’s a struggle to implement cover crops
here in the north because of the harvest
schedule – little or no window between
getting the crop off and freeze-up.
It works best after small grains and
silage – grazing for cattle when possible,
building soil health in corn and soybean
to get water into the soil, and capturing
excess nutrient benefits.
If you have a leader farmer in the area
who’s successful with cover crops,
others will start doing it.
Highlight short-term gains, such as
better access to fields in wet conditions.
Small Grains Among farmers considering cover crops
and small grains, some see no future in
the dominant corn/soybean model.
Others are looking to reduce fertilizer,
pesticide, and drainage tile costs. Others
are using them to transition to organic
certification to capture premium prices
or looking for opportunities to bring the
next generation onto the farm.
Small grains offer less risk than forage
crops, fit the grain farmer skills and
mindset, and are potentially as
profitable, or more so, than corn and
soybeans.
Emerging Crops Farmers are interested in new crops but
cautious… they are apprehensive and
not confident that there will be a
market. Subsidies will be needed… a risk
mitigation pool for farmers.
There is a need for protein from
alternative sources to satisfy customer
demand. Peas/pulses/beans as food
additives have good market potential.
There needs to be a favorable policy
environment and a production incentive
program to reduce risks.

6/30/2020 7
Cover Crops
The use of cover crops is growing throughout Minnesota and gaining traction in the three study areas,
although the percentage of acreage in cover crops remains low – ranging from around 2% to 8% of
cropland in the study area counties in 2017 (see Table A4). The benefits of cover crops include soil
health, erosion control, reduced tillage and fuel costs, and livestock grazing after the primary crop is
harvested (known as aftermath grazing). Challenges include Minnesota’s short growing season and
unpredictable weather, the lack of adequate financial incentives, equipment and labor requirements,
and the fact that successful establishment often requires several years of experimentation.
Increasing the availability of cost-share funds is an important strategy. Contracts of 3 to 5 years are
essential to allow producers enough time to gain sufficient experience with cover crops. Board of
Water and Soil Resources’ (BWSR) Clean Water Fund-supported Projects and Practices grants require a
minimum duration of three years for land management practices such as cover crops. A pilot program,
the Cover Crop Demonstration Grant, was initiated in 2019 to increase adoption of cover crops in
response to record-breaking rainfall and flooding that prevented planting of primary crops across much
of Minnesota. USDA programs, including Environmental Quality Incentives Program (EQIP), Conservation
Security Program (CSP), and a new Soil Health and Income Protection (SHIPP) Pilot program, may also
provide opportunities. The Minnesota Agricultural Water Quality Certification Program (MAWQCP)
provides opportunities for incorporation of cover crops and established a soil health endorsement which
may increase cover crop adoption. As of July 2020, MAWQCP has established over 63,900 acres of cover
crops.
Working with farmers who are already using cover crops would provide an opportunity to build on
existing success and expertise. Those farmers who have been most successful with cover crops could be
incentivized to plant additional acres. More importantly these innovative farmers can share their
expertise through peer-to-peer learning, such as through the Minnesota Soil Health Coalition or other
informal farmer-led networks.
Small Grains
Opportunities for small grains may increase due to consumer demand and the current weakness in
markets for corn and soybeans. Wheat acres have slowly increased in Minnesota in response to these
trends. Since small grains can be important constituents of livestock feed, additional opportunities may
emerge if ethanol production and related production of dried distillers’ grains continues to decline.
Small grains can be utilized in food and beverages, and in animal bedding. The benefits of small grains in
conjunction with cover crops and in multi-year rotations for pest and disease control and soil health
should also be emphasized. However, there is limited capacity to grow small grains (due to equipment
and storage requirement, farmer capabilities, etc.), and local markets for oats, wheat and barley are
limited.
Emerging Crops
Emerging perennial crops, (Kernza®), and winter annual “cash cover crops” (camelina and pennycress)
developed through the work of the University of Minnesota’s Forever Green Initiative and its partners,
are being “ramped up” to field scale, in hopes of gaining footholds in the broader marketplace. While
acreage will remain small for the near future, there are expanding opportunities to establish these crops
in vulnerable wellhead protection areas while continuing to build supply chains and market
opportunities.

6/30/2020 8
Cross-cutting Issues
Supply chain bottlenecks are an overarching question that cuts across most of the crops under
discussion. Lack of equipment to plant, cultivate, harvest, store, and process these crops, particularly
alfalfa and emerging crops, can hinder their adoption. Many small grains and perennial forages were
traditionally grown in Minnesota, and while farmers are likely capable of growing these again, the
“hurdles” of specialized equipment, cost, and time constraints are prohibitive. Agricultural dealerships
and conservation districts can play key roles in filling some of these gaps. Grants to farmers or these
supporting organizations could be prioritized to purchase needed equipment for planting, processing
and harvest of alfalfa, small grains and emerging crops.
Both co-ops and custom operators can provide assistance with planting/harvesting. Outreach and
educational efforts targeted to these operators – and to the farmers who might use their services –
will be increasingly important.
Opportunities by Region
Table 1 summarizes some of the primary opportunities in each of the study areas, based on the existing
mix of crops, climate, growing season length, and opportunities identified farmer and stakeholder
interviews and related research during 2018-2019. Opportunities for creating synergies between
sectors are identified – e.g., between short season crops and cover crops, or between horse farms and
high-quality dry hay production.
The high (H), medium (M), and low (L) potentials noted in the table are based on several objective and
subjective factors, including compilation and analysis of National Agricultural Statistics Service (NASS)
data, county crop information, and discussions with agricultural organizations, businesses, agency staff,
and those interviewed for this study. Some of the data, such as NASS, are well-established; others,
while important, are more subjective, such as the assumption that those surveyed are representative of
regional conditions.
The intent is not to discount other opportunities that may arise in one or more regions, but rather to
highlight those that currently appear most promising. With these opportunities come challenges, many
of them economic – e.g., the costs of establishing cover crops or the lack of reliable markets for local
hay. The MDA and partners could focus on addressing these challenges within each region going
forward.
Table 1: Summary of Primary Opportunities by Region
Opportunity Central Sands Southeast Southwest
Increased pasture-based grazing (i.e., beef cows) H H H
Perennial forage production for livestock feed (i.e., dairy cows)
H M H
Perennial forage crops for specialty uses (horses, pet food/bedding)
M H L
Increasing cover crop adoption – peer-to-peer networks
H M M
Cover crops after corn silage H H M
Cover crops after canning crops L H L
Cover crops after dry edible beans and potatoes H L L
Small grains for feed or food H H H

6/30/2020 9
Opportunity Central Sands Southeast Southwest
Specialty crops such as Kernza, camelina, etc. for feed, fuel and food
E E E
Investment in planting and processing equipment and storage capacity for small grains and emerging crops
M M H
H = high potential
M = moderate potential
L = low or undetermined potential
E = emerging opportunity
How can the MDA and other state agencies work to overcome barriers to vegetative cover?
One factor that comes through clearly in interviews with farmers and allied professionals is the
overriding economic imperatives that govern on-farm decision making. Farmers will respond to a
practice or enterprise expansion/use when it is economically viable, profitable or results in cost-savings.
Practices need to be sustainable long-term, and viable after subsidies end.
The MDA works with producers through its grant, loan, and marketing programs; these and other state
programs are summarized in Appendix B. There are opportunities to utilize a number of these programs
to provide increased incentives for vegetative cover, including small grains and winter annual crops.
This report should be considered a starting point to continue discussion of opportunities for increasing
vegetative cover. It can be used regionally by farmers, agricultural organizations, and others to provide
information, start new discussions, and build relationships that perhaps can lead to increased
production of and expanded markets for vegetative cover. It can also provide supporting information
for government agencies such as MDA, non-profits, farmer-led interest groups, and private businesses
to explore market development.

6/30/2020 10
I. Study Purpose
The primary goal of this study is to learn whether there are economically viable opportunities to expand
vegetative cover acreage including perennial crops, small grains, winter annuals, and cover crops, to
improve water quality, focusing on areas with highly vulnerable groundwater in Minnesota. A related
goal is to identify existing and potential barriers to adoption of additional vegetative cover. Finally, the
study identifies actions that the MDA and its partners can take to capitalize on opportunities, overcome
or mitigate barriers, and increase chances for success.
The study is focused on three areas of the state with vulnerable groundwater: the Central Sands,
southeast, and southwest regions (Figure 1). Sensitive areas in the following counties were included:
• Southeast: Houston, Fillmore, Winona, Olmsted, Wabasha, Goodhue, and Dakota counties
• Central Sands: Hubbard, Becker, Otter Tail, Todd, Douglas, Pope, Stearns, Benton, Morrison, and
Wadena counties
• Southwest: Pipestone, Rock and Nobles counties
The study explores the challenges and opportunities facing producers working in four broadly defined
practice areas:
• Pasture management and grazing
• Hay/Forage production
• Cover crops
• Small grains
• Emerging perennial crops
There is considerable overlap between these practice areas,
but the study treats them separately in order to focus on
the specific challenges and opportunities in each area.
II. Methods
Initial calls and contacts with conservation district staff in
the three regions, other local partners, and state agency
staff were made to identify farmers and allied agricultural
industry partners involved in grazing, hay and forage
production, cover crops, and other perennial or winter
annual crops. In-person interviews, phone interviews and
online questionnaires were the main study method.
Additional participants engaged with the study at field days and
other events.
The overall number of interviews and surveys was lower than expected due to challenges with the
project contract. The original goal was to conduct over 100 interviews to capture a representative
sample of farmers. Instead, we conducted 36 interviews with farmers and 66 interviews with allied
Figure 1: Regional study areas

6/30/2020 11
industry partners who either interact with farmers directly or have an interest in vegetative cover.
Agricultural industry partners included crop consultants, agricultural organizations, entrepreneurs, and
researchers in areas such as agricultural economics and water resource protection. Interviews were
supplemented with information from the National Ag Statistics Survey (NASS), research reports, and
professional input. Overall, the survey information is not representative of all producers with pasture, or
those who graze, grow forages and/or cover crops; rather it summarizes a big picture of challenges and
opportunities a producer may experience in the region.
Of the 36 farmers surveyed, 29 farmed in the three targeted study areas. In addition to the interviews,
21 farmers responded to an online questionnaire; fourteen of these respondents farmed within one of
the study areas. Appendix C includes detailed information on the demographics and farming practices
of the respondents.
Interviews were based on a standard list of questions which were modified as needed to respond to
individual comments and concerns. Questionnaires used a standard list of questions, included in
Appendix D. Results have been combined and respondents are not identified except by location within
one of the three study areas (a few responses from outside the study areas were also considered).
III. The Context: Agriculture in Minnesota and the study areas
Minnesota leads the nation in many aspects of agricultural production. As of 2019, the state ranks first
in production of red kidney beans, sugar beets and turkeys. Other rankings from the National
Agricultural Statistics Service indicate that Minnesota ranks:
• Second in value of hog and pig production, green pea production and sweet corn production
• Third in production of soybeans, spring wheat, oats, sunflowers for oil, area harvested for
vegetables, and grain storage capacity
• Fourth in production of corn for grain, corn for silage, dry edible beans, and canola
In livestock and dairy products, Minnesota ranks sixth in cheese production, seventh in milk cows and
milk replacement heifer inventory, and eighth in milk production and in the number of cattle and calves
on feed. It ranks ninth in number of steers 500 pounds and over.
The 2017 Census of Agriculture provides the latest snapshot of agricultural land uses and practices in
Minnesota. Many changes relevant to this study took place between the prior census in 2012 and 2017,
as summarized below and in Table 1 in Appendix A. It is important to note that neither census year is
truly representative: 2012 saw widespread drought, which affected crop yields, while 2017 saw ideal
weather patterns and record yields in both corn and soybeans.
Key findings:
• Land area and cover: The number of farms in Minnesota declined by 8% while average farm size
increased by 6%.
• The acres of farmland in Minnesota declined slightly, by 2%, while acres in cropland increased
slightly, possibly in response to higher commodity prices early in the decade.

6/30/2020 12
• Both permanent pasture and grazing land and the smaller acreage of pastured woodland
declined by 27%. Approximately 4.2% of farmland remains in pasture. Woodland acres
comprise a slightly higher percentage, 5.5%.
• Primary crops: Corn and soybean remain the dominant crops statewide, accounting for about
73% of all cropland.
• Small grains, specifically wheat, oats, and barley for grain, have seen dramatic declines, both
since 2012 and over the prior 20 years, as shown in Figures 2 and 3.
Figure 2: Change in wheat acres harvested (compiled with NASS data)
• Cover crops:
o The acreage in cover crops reported increased by 42%, (from 408,190 acres to 579,147
acres) still comprising only 2.2% of farmland, or 2.6 % of all cropped acres.
o The number of operations planting cover crops declined, from 5,661 to 5,302 (6.3%
lower) between 2012 and 2017.
o In 2017, Minnesota ranked 11th among the 50 states in cover crop acreage, behind
Texas, all other Midwestern states, Nebraska and Pennsylvania.
• Forage crops
o The acreage in perennial forage crops (hay, haylage, grass silage, greenchop) showed
only a slight decline from 2012 to 2017. However, the major decline in hay and haylage
occurred over the previous 15 years, as shown in Figure 4. Since 2002, harvested acres
have declined by 45% (data pre-2012 were unavailable).
Figure 4: Hay and Haylage, change in acres harvested (compiled with NASS data)
Figure 3: Change in oat acres harvested (compiled with NASS data)

6/30/2020 13
Agriculture in the study areas
The maps in this section, developed by USDA NASS, can be used to compare the results of the 2012 and
2017 agricultural censuses. It is important to note that the maps use broad categories to show
geographic distribution of crops and livestock, and do not capture all changes in acreage or livestock in
each county. Furthermore, comparison of two individual years does not indicate a trend. Appendix A
provides some additional detail.
Dairy cattle
Milk cow inventory maps from the 2012 and 2017 Census of Agriculture (Figure 5 and Table A3) show
that the Central Sands and southeast study areas are strong dairy cattle areas. Although the number of
herds are dropping in Minnesota, the total cow numbers in the Central Sands, southeast and southwest
remained relatively steady, with Pipestone County (southwest) showing growth. The study area
counties in general are some of the most heavily populated dairy areas in the state, indicating that
there is still plenty of opportunity for vegetative cover to be utilized for feed in these areas. However,
it is unlikely that this will include much land in pasture as most dairies harvest the feed and bring it to
their cows. Only the 108 certified organic dairy farms in Minnesota are required to graze their cattle,
since pasture grazing is required for at least 120 days per year for organic dairy production (2016
Certified Organic Survey, USDA NASS).
As dairy herd size increases, the availability of pastureland compared to cropland becomes a factor, as
does travel distance for grazing cows. Some small dairies are able to continue to graze their herds.
However, statewide, the number of herds in Minnesota is decreasing at a rapid pace (16.5% from 2016
to early 20191), while herd size is increasing (16.16% from 2016 to early 2019).
Figure 5: Milk cow inventories, 2012 - 2017 (NASS data)
1 Minnesota Department of Agriculture
6/30/2020 14
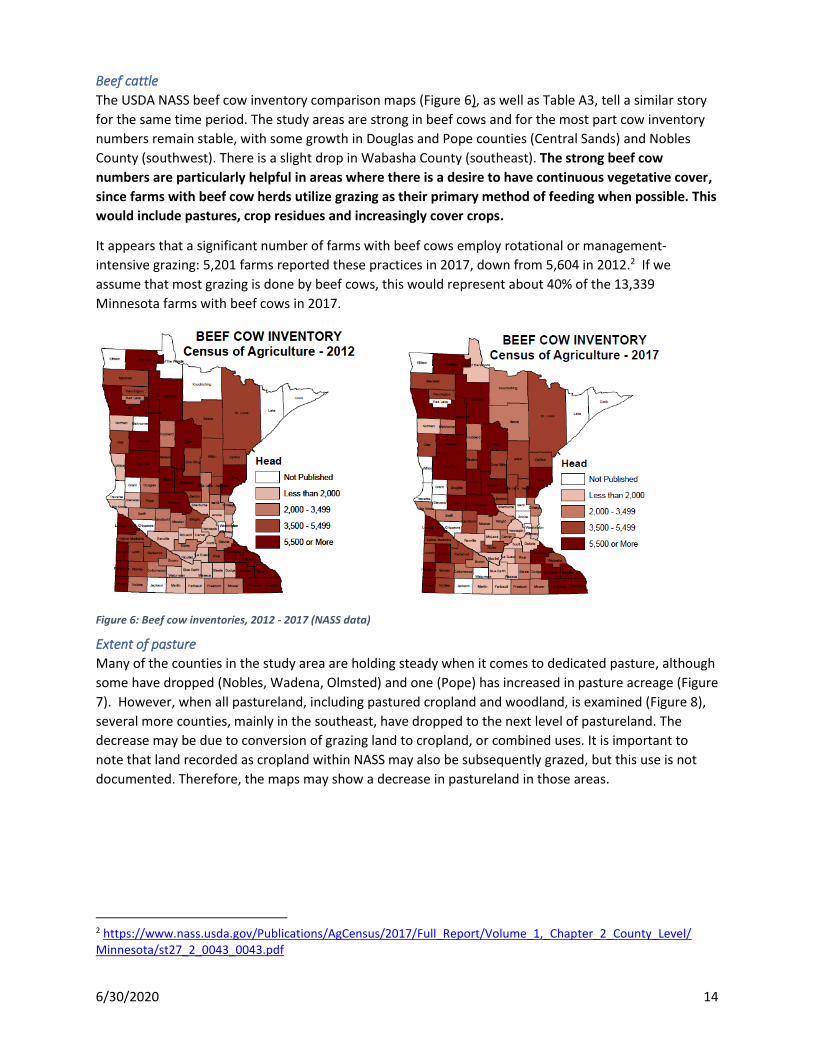
Beef cattle
The USDA NASS beef cow inventory comparison maps (Figure 6), as well as Table A3, tell a similar story
for the same time period. The study areas are strong in beef cows and for the most part cow inventory
numbers remain stable, with some growth in Douglas and Pope counties (Central Sands) and Nobles
County (southwest). There is a slight drop in Wabasha County (southeast). The strong beef cow
numbers are particularly helpful in areas where there is a desire to have continuous vegetative cover,
since farms with beef cow herds utilize grazing as their primary method of feeding when possible. This
would include pastures, crop residues and increasingly cover crops.
It appears that a significant number of farms with beef cows employ rotational or management-
intensive grazing: 5,201 farms reported these practices in 2017, down from 5,604 in 2012.2 If we
assume that most grazing is done by beef cows, this would represent about 40% of the 13,339
Minnesota farms with beef cows in 2017.
Figure 6: Beef cow inventories, 2012 - 2017 (NASS data)
Extent of pasture
Many of the counties in the study area are holding steady when it comes to dedicated pasture, although
some have dropped (Nobles, Wadena, Olmsted) and one (Pope) has increased in pasture acreage (Figure
7). However, when all pastureland, including pastured cropland and woodland, is examined (Figure 8),
several more counties, mainly in the southeast, have dropped to the next level of pastureland. The
decrease may be due to conversion of grazing land to cropland, or combined uses. It is important to
note that land recorded as cropland within NASS may also be subsequently grazed, but this use is not
documented. Therefore, the maps may show a decrease in pastureland in those areas.
2 https://www.nass.usda.gov/Publications/AgCensus/2017/Full_Report/Volume_1,_Chapter_2_County_Level/ Minnesota/st27_2_0043_0043.pdf

6/30/2020 15
Figure 8: Pastureland acreage, including pastured cropland and woodland, 2012-2017 (NASS data)
Hay production
Hay production (including alfalfa and all other dry hay) was maintained at fairly stable levels across all
study area counties (with the exception of Pipestone), although statewide the number of acres and
producing farms has dropped (Figure 9). However, per acre yields across the state increased from 2012
to 2017. Figure 9 does not include haylage or green chop production, which also showed drops in
acreage but an increase in yield per acre from 2012 to 2017. Overall, perennial forage acres as defined
by the census – hay, haylage, grass silage, green chop – have decreased, but yield per acre has
increased, resulting in just a small drop in total production.
Figure 7: Pastureland acreage, 2012-2017 (NASS data)

6/30/2020 16
Figure 9: Hay acres harvested, 2012-2017 (NASS data)
Corn silage production
Although corn silage acres in Minnesota decreased from 2012 to 2017, yield per acre increased,
resulting in an increased harvest of silage statewide. Corn silage acres remained fairly constant in the
study areas, with the exception of Douglas and Pope counties, where production declined to the next
size level (Figure 10).
Forages have always been considered the building blocks of the dairy cow diet and those forages have
traditionally been dry hay and haylage followed by corn silage. However, in recent years the role of corn
silage in dairy herd diets has increased. There are many reasons for this:
• Corn silage is an economical feed and yield per acre has increased over time making it even
more attractive.
• Farms are able to harvest more tons of dry matter per acre than they would get from hay or
haylage. Corn silage provides both forage in the leaves and stalks and grain in the corn.
• Corn silage is harvested in one pass, compared to three to four passes for other forages (haylage
or dry hay), making it simpler to harvest – or hire someone to harvest – once a year.
• Having a consistent feedstuff aids in ration balancing and animal nutritionists have been able to
improve feed efficiencies through the use of total mixed rations (TMRs) by dairies.
• Farmers also have more varieties of silage corn to choose from to meet the nutritional needs of
their cattle.
• Corn silage can be harvested using the same equipment as conventional corn, whereas hay
requires different harvesting equipment.
Because silage corn is harvested earlier in the season than corn for grain, it is well-suited to be
followed by a cover crop.

6/30/2020 17
Cover crop use
The use of cover crops is growing throughout Minnesota and in the three study areas, although the
percentage of acreage in cover crops remains low, as noted at the beginning of this section.
Table A4 and Figure 11 show the change in cover crops by county from 2012 to 2017. Cover crops in the
Central Sands area grew as to acres per farm, but the number of farms growing cover crops and the
total acres of cover crops declined. Morrison and Stearns counties saw considerable declines in acreage,
but that change does not appear on the map because of the acreage ranges used. Since weather
variations have such a large impact on cover crop establishment, fluctuations in acreage are common
from year to year. The declines in acreage in those counties may also be related to declines in the total
numbers of cattle (milk and beef cows, heifers, etc.), given the role of cover crops for forage and
Figure 11: Cover crops planted, 2012-2017 (NASS data)
Figure 10: Corn harvested for silage, 2012-2017 (NASS data)

6/30/2020 18
aftermath grazing. Morrison County saw a 7% decline and Stearns County saw a 21% decline in cattle
numbers during this period.
While the number of farms planting cover crops also dropped in the southeast study area, the total
number of acres in cover crops increased along with the acres per farm. In the southwest study area,
cover crops increased across number of farms, overall acres and acres per farm. As noted above,
however, comparison of two years over a five-year period does not constitute a trend.
Cover crop adoption increased in many areas in 2019 due to the unfavorable spring weather. To assist
farmers who were unable to plant an insurable crop, the USDA’s Risk Management Agency provided
crop insurance (“prevent plant”) benefits, as well as an opportunity for farmers to plant a cover crop on
these acres and not lose crop insurance benefits. These farms also qualified for trade assistance
payments of $15 per acre. According to the American Farm Bureau, of the 20 million acres of prevent
plant in the United States, more than 4 million acres of that land had been planted to a cover crop by
August 22, 2019. It is unknown as to how many of these farms would have normally utilized cover crops
in their operation, but the severe weather may have introduced another management tool to some
farms who had not tried cover crops before.
Regional characteristics of the study areas
The tables in Appendix A provide county-level detail on the crop mix, livestock numbers, and
conservation practices in the study areas, drawn from the 2012 and 2017 censuses of agriculture. Key
findings from the 2017 census are summarized below, focusing on existing and potential opportunities
to increase vegetative cover.
Central Sands
• The region leads in forage production (hay, haylage), with 7 out of the 10 counties reporting at
least 20,000 acres of forage grown. Stearns, Otter Tail, and Morrison counties reported the
highest acreage.
• The region also has the largest amount of pastureland, with Wadena, Todd and Morrison
counties with over 10% of farmland in pasture.
• Spring wheat for grain is grown in significant amounts in three counties, with the largest
acreage in Becker and Otter Tail counties, each with around 30,000 acres in production.
• Potatoes and vegetables are grown in Hubbard and Wadena counties, although acreage is
withheld to avoid disclosing data from a small number of producers.
• This region is a center of dry edible bean production, particularly kidney beans. Kidney beans
are a short season crop that can be followed by a cover crop.
• Stearns County leads in cattle production, primarily dairy cattle.
• Morrison, Stearns, and Benton counties lead in chicken production. Morrison, Stearns, Becker,
Otter Tail, and Todd counties also are centers of turkey production.
• Wadena County leads in cover crop adoption, with 13% of farms and 7.7% of cropland.
Hubbard, Otter Tail, Morrison, and Stearns counties all have at least 3% of cropland in cover
crops, although several counties have seen declines in acreage since 2012. Cover crop
establishment is highly susceptible to weather conditions from year to year, so some variability
is expected.

6/30/2020 19
Southeast
• This region leads in cover crop adoption, with all counties except Houston showing adoption on
over 10% of farms. Cover crops are planted on over 3% of cropland in Dakota, Wabasha,
Olmsted and Winona counties.
• Significant amounts of forage are grown in this region: in all counties except Dakota, acreage
ranges from just over 20,000 to 38,000 (Winona County).
• Dakota County has a large acreage in vegetables and sweet corn, probably related to its metro-
area location, with easy access to consumers and farmers markets. Olmsted County, centered
on the Rochester metropolitan area, also has significant acreage in these crops – which are
mainly short-season crops.
• Oats grown for grain occupy small but noteworthy acreages in Houston, Fillmore, and Winona
counties.
• Horses and ponies are found in somewhat larger numbers – 1,000 or more – in most counties,
except for Wabasha and Houston, indicating potential markets for hay.
• Turkey production appears to be significant but numbers are withheld in all except Goodhue
County.
Southwest
• The three counties in this region have relatively low levels of forage (hay and haylage)
production but all three have some small grain production, primarily wheat in Pipestone County
and oats in Rock County.
• Hogs and pigs are the dominant livestock in this region. A limited amount of barley has been
used in hog rations, offering some potential for its expansion in this area.
• Cover crop use is still relatively low, but adoption increased in each county between 2012 and
2017, more than doubling in Rock and Nobles counties.
• Pipestone County has the highest levels of cover crop adoption (13% of farms) and land in
pasture (8%).
IV. Agricultural practices of surveyed farmers
The majority of surveyed farms – 25 of the 29 farms included in the detailed data survey – have pasture,
and 22 graze some livestock. About half of this group practice continuous grazing and half practice
rotational grazing. Of the 29 surveyed farms, 28 grew corn and 19 grew soybeans. Crop farmers raised
corn for grain alone, while those who had livestock grew corn for grain and silage in most cases. (See
Appendix C for details.)
Regional differences in crops and land use:
• Central Sands farmers (on 16 farms surveyed) identified potatoes, kidney beans, cereal rye, and
wheat as additional crops. Several noted that not all of their land was tillable; the remainder
was in pasture.
• Southwest farmers (on seven farms surveyed) identified oats and peas as additional crops, as
well as oats planted with alfalfa as a nurse crop.
6/30/2020 20
• Southeast farmers (on six farms) mentioned rye and alfalfa as cover crops; also noted that hilly
acres are not cultivated.
Allied stakeholders work with every type of farm, with dairy, beef and corn/soybeans being the most
common, followed by small grains and hay/haylage. The majority work with farms that are growing
forages, pasturing livestock and growing cover crops.
Grazing and pasture practices
• Of the surveyed farms, 25 out of 29 had pasture and 21 pastured their animals in some fashion.
• The 12 dairy farms surveyed generally did not graze their milking cows. Milk production is
higher when feed is harvested and brought to the herd. Confined feeding provides more control
over the cow’s diet and enables the cow to pack in nutrient dense meals within a shorter period
of time. This can lead to higher milk production compared to grazing.
• Many of the surveyed dairy farms who do not graze or only occasionally graze their milking herd
reported grazing their dry cows and replacement heifers (5 farms grazed dry cows and 9 grazed
heifers). Some actually graze some or all of their animals, while others keep the animals outside
and allow them to graze what they can off the paddock, along with supplemental feed. Among
the advantages of this “dry lot” system are that it reduces bedding requirements, gives the
animal additional exercise and keeps the cattle off the concrete floor.
• All the beef cow/calf producers (14 farms) used grazing as their primary method of feeding
during the grazing season; some extend the grazing season by grazing crop residue and/or cover
crops. In addition to their cows, some farms graze their heifers and one farm grazes beef steers.
• Of the 21 farms practicing grazing, equal numbers (12) reported managed (rotational) grazing
and continuous grazing (farmers could select more than one practice). Paddock systems were
the most common type of managed grazing, with strip grazing and mob grazing also mentioned
by seven respondents.
• Ten interviewed farms reported aftermath grazing (grazing after harvest of a primary crop). Nine
grazed corn ground post-harvest, six grazed hay ground and cover crops, and one grazed wheat
stubble. These same farms also had dedicated pastureland.
• There is limited “other” grazing on interviewed farms, including horses, poultry and sheep.
Among allied stakeholders, about two-thirds reported that farms they worked with had pastures,
whether improved (planted with introduced species) or native vegetation. Most farms used a rotational
grazing system with paddocks, but continuous grazing was also common. Aftermath (post-harvest)
grazing on corn, cover crops, and hay was widespread, most commonly with beef cattle, but also with
dairy cows, steers, heifers, sheep, and goats.
Benefits of grazing; obstacles to grazing:
Farms that grazed animals noted several key benefits. First, they find that animals are healthier on
pasture. Second, it makes economic sense and utilizes ground that is not tillable. Another common
reason cited is that livestock and pasture are viewed as good for the land.
The top reasons why the surveyed farms did not graze were: they did not have livestock; grazing doesn’t
fit into their feeding system; or there was not enough land available. High land values and rent prices

6/30/2020 21
have prevented farmers from putting cropland back into pasture, although there are opportunities to
reseed lower-producing fields using a grazing management system.
Constraints and possible incentives for expansion of grazing
The majority of surveyed farm respondents are planning to expand their pasture (17%) or keep it the
same (41%). The primary constraints to expanding pasture that study participants identified included
time and labor; providing fencing and water; and finding enough land for pastures. Another factor that
limits grazing is generational: older cattle farmers are retiring, and unless they are transitioning a
younger person into the operation, their knowledge base is lost.
Participants would consider expanding pasture if economics were favorable, if other pasture were
available near them, or if a family member were interested in pasturing livestock. Most respondents
would be motivated to expand by economic considerations, and some producers would be interested in
government payments or incentives. Given the investment in time, management, fencing, watering
systems and establishment, producers need to be reasonably confident of long-term profitability in
pasturing livestock, comparable to keeping farmland in row crops.
Forage production practices
The majority of surveyed farms – 25 of the 29 included in the detailed data survey – reported that they
raised hay and other forage.
• The most frequent forage that is grown is dry hay, followed by corn silage.
• All of the dairy farms surveyed raise haylage or baleage, and all but two grow corn silage.
Thirteen of the farms sold forage.
• The most common forage sold was dry hay. Neighbors were the most common buyers, followed
by other informal contacts via word of mouth.
• The lack of more formal sales methods keeps marketing costs down, but perhaps limits the size
of the consumer base and the potential for premiums on prices.
• Surprisingly, none of the farms used forage-specific websites, Facebook or other online outlets
to sell forage, all of which would increase market reach, especially when farms outside of the
immediate area are short of hay.
• Some farms sold 100% of their forage crop while others didn’t usually sell, except for occasional
sales to neighbors to help them out.
• Those farms that sold hay indicated that they had ample outlets to sell their hay.
Nineteen farms reported that they purchased forage, with dry hay and bedding (also sometimes fed as
forage) the most commonly purchased.
• Purchased quantities varied from 5-50% of livestock needs, with an average of 25%.
• Those that reported tonnage averaged 165 tons purchased annually.
• Slightly less than half hauled their own purchases. Hauling distances ranged from 1-100 miles.
• Most of the purchased forage was being purchased for dairy or beef cattle.
• The most common hay source was neighbors, followed by contacts found via word of mouth.
Other sources included family, “hay jockeys” and a supplier.
Quality and cost were the most important considerations by those purchasing forage. One farmer stated
that the Sauk Centre hay market set the price for what was sold in the area even if one did not buy

6/30/2020 22
there. The prices from this market are tracked and published by University of Minnesota Extension and
offer insights to both the current and historical markets (see Figure 12 below).
Eleven out of 13 farmers that responded to the question said that they had adequate purchasing
options. All 13 respondents purchased some or all their hay/forage from Minnesota growers, although
some purchased wheat straw from Canada.
The majority of the allied stakeholders indicated that farms they work with grow forages, primarily
alfalfa and corn silage. Other forages, including clover, grasses, legumes and small grains, were grown to
a lesser extent. Forage was harvested primarily as haylage and dry hay, with lesser numbers also
harvesting baleage.
Constraints and possible incentives for expansion of forage
Six farms responded to the question “If you don’t grow forages, what is stopping you?” The main
constraints identified were limited equipment and labor. Other constraints related to land availability,
knowledge and timing of operations, weather, and production costs.
Compared to western hay, which is grown under controlled irrigation, rain events and erratic weather
patterns make growing hay and harvesting dry hay in Minnesota challenging. Winter kill in alfalfa also
presents challenges. The high capital cost of haying equipment and the amount of work needed to
harvest 3-4 crops of quality hay per year are also obstacles.
Fourteen farms responded to a question on incentives that would encourage them to grow forage or
increase forage production. The most common responses identified “higher profits” and “available
markets.” Other potential
incentives included
availability of custom
operators, availability of a
cost share program or grants,
low interest loans for
equipment and storage, and
additional livestock.
Among farmers and allied
stakeholders, the availability of
hay markets is key to forage
sales and purchases. There are
several established hay
auctions in the state and a
number of lesser known
auctions, which typically sell
dry hay and straw and
sometimes baleage and corn
stalk bales. Among the largest
auctions are those in Sauk
Centre, Litchfield, Zumbrota,
and Pipestone. The University of Minnesota provides an excellent resource for these auctions. In
Figure 12: Example Hay Auction Pricing Summary, Sauk Centre Hay Auction, 2001-2019 Medium Squares RFV 176-200

6/30/2020 23
addition to the auctions, they also provide a list of sources where one can purchase hay. On-line sales
for horse hay are also popular although not tracked.
Prices from the Sauk Centre hay market tracked by University of Minnesota Extension show a wide
range of prices within a season. In 2019 alone, a tested hay group showed a range of five times the
lowest price to the highest price – a range that would be unheard of in corn and soybean markets. There
are often significant differences from one year to the next. The combination of price and weather
uncertainties are hurdles for the hay producer to overcome.
Opportunities for forage market expansion
In Minnesota we primarily think of large herbivores consuming hay, but there is a growing and lucrative
market in pet food for small herbivores such as guinea pigs – orchard grass, timothy and alfalfa are
popular pet feeds. Hay for large animals may go for $100-250 per ton, but in the pet food trade, $2,000-
8,000 or more per ton is not an unusual price. The quality has to be exceptional, but if managed properly
there is likely opportunity in this niche market.
According to the most recent American Pet Products Association (APPA) National Pet Owners Survey,
small-pet ownership is at one of its highest levels in two decades, with 6.7 million households in the U.S.
owning at least one small animal3. The pet food market has grown every year since 2001. As of the 2017-
2018 National Pet Owners Survey, 6.7 million households have small animals as pets, including small
herbivores. Horse numbers included in the survey encompass those considered as pets and not working
horses.
Horses, as both pets and working horses, also offer an opportunity for additional forage sales. For
example, one Minnesota grower is packaging a total mixed ration in a cube for horses: a lot of nutrition
in a small package that is easy for horse owners to handle, since it comes in bags and not bulky bales.
However, Minnesota producers still face the challenges of getting dry hay processed under variable
weather conditions and the transportation costs of getting the product to these specialized markets.
Cover crop practices
Twenty-one of the 29 surveyed farms have grown/used cover crops in their farming operation. Ten of
the 21 online questionnaire respondents reported using cover crops as well.
• Responses from the surveyed farms indicated that the majority of respondents (75%) felt they
were average or above average in their understanding of growing/utilizing cover crops. The
remainder were split between “poor” and “excellent” levels of knowledge.
• Farms used a wide range of practices and systems, including everything from single species
(most commonly winter cereal rye) to multi-species mixes.
• Other cover crops included brassicas such as turnips, radishes and similar root crops, legumes
such as red clover, and small grains such as sorghum, spring wheat, oats and triticale.
• Some utilize the forage through grazing or otherwise harvesting it, while others terminate the
crop without using it for livestock feed.
3 National Pet Owners Survey: https://www.iii.org/table-archive/22305

6/30/2020 24
Regional differences:
• In the Central Sands, benefits identified included weed suppression, better access to fields in
spring, reduction of wind/water erosion, and prevention of nutrient runoff. More of the Central
Sands respondents identified challenges using cover crops, primarily the shorter growing season
and the narrow window of time between harvesting the primary crop and freeze-up.
o Some reported planting after small grains, or using spring wheat and winter wheat after
corn, then baling it for bedding.
o Others reported the use of winter wheat, lentils, ryegrass and clovers following
soybeans, the use of rye after corn silage and ahead of alfalfa, and the use of brassicas
and rye following potatoes and kidney beans.
o Some respondents noted cover crops are most effective in conjunction with no-till, not
conventional tillage.
• Southwest respondents identified more opportunities and fewer challenges for cover crops.
Practices included:
o Planting rye, oats and radishes after small grains and corn silage, using both aerial
seeding and interseeding into corn at the V3-V5 stage.
o Planting winter rye for grazing by cow/calf pairs in early spring and planting brassicas in
advance of a hay crop.
o Long-season cover crops with 14-18 different species used for grazing beef cattle.
o Improved soil health, enhanced water retention, and increased yield were cited as
benefits.
o Cutting red clover for sale as feed, then terminate for no-till planting.
• Southeast respondents identified fewer cover crop practices, although cover crop use is
relatively high in this region. Cover crops mentioned included winter cereal rye, triticale, annual
ryegrass and oats after corn silage, soybeans and corn for grain. Oats, BMR sorghum/Sudan
grass, and red clover were also reported.
Allied stakeholders reported that among the farms they work with, cover crops are gaining ground,
especially for grazing, and that they are most effective for short-season crops or when there is
livestock in the system.
Benefits and obstacles to cover crop use
In addition to the regionally-specific responses mentioned above, questionnaire respondents cited many
similar benefits:
• Soil health, nutrient cycling, better crops, build up organic matter
• Fill gaps in nutrition and availability of livestock forage
• Cut tillage and fuel costs while rebuilding the soil structure
• Erosion control
• Weed control
Obstacles included:
• Effort and expense of planting, with costs estimated at $30 – 40/acre
• Timing and weather, especially when seeding in the fall (lack of time to establish the cover crop)
• Lack of livestock to graze the cover crops
• Lack of education, knowledge, and equipment (i.e., a no till drill) or custom operators
• Risks and uncertainties of economics and yield

6/30/2020 25
Small grains, other short season crops, and specialty/emerging crops
This category includes both traditional small grains grown for food or feed and emerging crops such as
Kernza® and oilseeds. There is growing interest in both categories, but also many challenges to be
addressed regarding availability of equipment and supplies, markets and supply chains. Interviews with
surveyed farmers did not address their use of small grains as primary crops, although some respondents
mentioned using them as forage or cover crops. Interviews with allied stakeholders indicated some use
of small grains for feed and forage among their clients.
Small Grains
A 2018 report, Small Grains in Minnesota: Assessing the Feasibility of Local Supply Chains, from
Renewing the Countryside and University of Minnesota Extension partners, provides a comprehensive
overview of the status and potential for small grain cultivation. Key findings of the report are
incorporated in this section.
Small grains – specifically, wheat, oats, barley, and rye – have long been staple crops in Minnesota and
the Upper Midwest. However, production of small grains has declined across the region and state as
acreage in corn and soybeans have increased.4 Newer corn varieties that mature more rapidly have
enabled corn cultivation to spread further north and west. As discussed in Section III, harvested acres of
wheat, oats, and barley have all declined dramatically in the past several decades.
Much of the small grain production in Minnesota is for livestock feed, although small grain varieties such
as oats, buckwheat, and rye are also grown for human consumption. However, the largest food and
beverage processors in the state source their grains from elsewhere, due largely to economies of scale.
For example, Rahr Malting, one of the largest providers of malted barley for the brewing industry,
sources its barley from Canadian and European sources. General Mills, one of the largest processors of
wheat and oats for food, typically sources its oats from Canadian producers.
Small grains are short season crops, which makes it much easier to establish cover crops. Establishing
cover crops in corn and soybeans can be challenging because of the short window of time that remains
after harvest. “Even with the most advanced interseeding technologies, cover crop establishment
success will be greater following short season crops. Wheat, barley, and oats make establishing cover
crops much easier.”5 In addition, cover crops seeded following small grains can produce enough growth
to be grazed or harvested for forage in the fall.
Oats
Given the decline in harvested acreage of oats (see Figure 3 and Table A1), it’s surprising that Minnesota
remains the third largest producer of oats in the United States, behind North Dakota and South Dakota.
However, oat production has declined throughout the country. “Once one of the Upper Midwest’s most
popular crops, oats have struggled to compete with more profitable alternatives, and because fewer
farmers have produced the crop, the downward cycle has continued as many elevators in the region
4 Bjerga, A., Cl. Hoffman, and D. Ingold. 2018. The consolidation of the American harvest. Bloomberg, Sept. 7, 2018. https://www.bloomberg.com/graphics/2018-crop-shift/ 5 Wiersma, J., S. Wells, and J. Goplen. 2018. Small grains: an easier way to establish (and grow) cover crops. https://blog-crop-news.extension.umn.edu/2018/04/small-grains-easier-way-to-establish.html

6/30/2020 26
have quit handling oats.”6 In Minnesota, most oats are grown in northwestern counties and in the
Central Sands region, as shown in Table A2, but smaller quantities are also grown in southeast and
southwest.
At the same time, the increasing popularity of oats as a gluten-free grain and of oat-based beverages
indicates the potential for growing oats for human consumption may increase. Another current trend
is a decline in ethanol production in Minnesota due to lower U.S. demand and a plunge in exports, which
is leading to a decline in availability of dried distillers’ grains, a major co-product from ethanol
production, used as protein-rich animal feed. Oats may emerge as a partial replacement.
Some conservation districts pay producers to plant oats in advance of conservation practices, such as
grass waterways, which are constructed after harvest.
According to a number of allied stakeholders in the southwest region, grain elevators typically handle
oats to blend for livestock feed but experience periodic shortages in summer. If cost-share or other
financial incentives were available, it might be possible to increase the acreage of oats as a primary crop
within multi-year crop rotations. Availability of planting and harvesting equipment are also barriers
that could be overcome with focused investments.
Wheat, Winter and Spring
The majority of wheat grown in Minnesota is spring wheat, mainly grown in the northwestern counties,
from Norman County north to Kittson and Roseau counties. Portions of the Central Sands counties,
including Becker and Otter Tail, also include fairly high acreages. The University of Minnesota has
developed a number of hard red spring wheat varieties well-adapted to Minnesota’s growing conditions.
Challenges to wheat production include low prices, excess rainfall during planting and harvest, and
“falling numbers,” a measure of possible or potential sprout damage in wheat kernels. As a spring crop,
wheat offers ample opportunities to follow with a cover crop or second crop, but, as noted above, those
practices have their own challenges.
Rye (Cereal Rye)
Cereal rye is typically grown as a winter cover crop or for grazing but is also used for flour and seeds for
baking and for craft brewing and distilling. In 2017, just over 20,000 acres were harvested in Minnesota.
“Cereal rye has recently gained attention as a winter cover crop in corn-soybean production systems.
Seeded in the fall, cereal rye will grow before going into winter dormancy and resume growth early the
following spring.”7
Research in Minnesota, Iowa and North Dakota has resulted in development of hybrid rye varieties, with
higher yield and suitable characteristics for livestock feed. Trials of these varieties by Practical Farmers
of Iowa point to the potential of cereal rye for multiple purposes. “As farmers begin to plant cereal rye
for other purposes – cover crop seed, grain, straw, forage, hay or haylage production – they might seek
to plant cereal rye varieties with distinct production characteristics.”8 Food-grade applications hold
potential for locally-sourced grains or alcoholic beverages. Cereal rye remains the most common cover
crop grown in Minnesota, and is used with many crops including corn, soybeans, and potatoes.
6 Muckey, E. 2018. Small Grains in Minnesota. https://www.renewingthecountryside.org/publications 7 Practical Farmers of Iowa. Cereal Rye Variety Trial 2019. https://practicalfarmers.org/wp-content/uploads/2019/11/19.FC_.SG_.Cereal-rye-variety-trial_FINAL.pdf 8 Ibid.

6/30/2020 27
Barley
Like other small grains, barley was once among Minnesota’s leading crops, but production has declined
here as it has in other states; Minnesota currently ranks eighth among states in barley production. As
with other small grains, Minnesota’s northwestern counties are the center of barley production, with
the highest acreages in Marshall and Roseau counties.
Barley is divided into two general types: two-row (the oldest form) and six-row. The barley improvement
program at the University of Minnesota has developed a number of widely adapted spring six-rowed
malting barley varieties. Most craft brewers now prefer two-row barleys for malting and brewing. While
these varieties tend to grow best in a drier climate, some brewers in western Minnesota do purchase
locally-grown barley.
Plant breeding efforts by the Forever Green Initiative are focused on developing winter barley (both
two-row and six-row) as a winter annual planted in fall for use in malting. Winter barley will typically
have higher yields than spring barley in many regions, while improving soil health and reducing nitrate
leakage to groundwater. Winter survival of trial varieties is higher in southern Minnesota.9 Increasing
interest in small-scale craft beer production may contribute to increased demand for locally-grown
malting barley. However, widespread introduction of new varieties is likely two to three years away.
Other Short Season Crops
Any crop with a short growing season offers opportunities to establish cover crops. In Minnesota,
short season crops include sweet corn and peas, dry beans, sugar beets, and potatoes.
Sweet corn and peas
In 2017, Minnesota ranked first in the U.S. for sweet corn and pea production; in 2019 it ranked second.
The majority of these crops are grown in central, south-central, and southeast Minnesota, including
Dakota and Olmsted counties (see Table A2). Because these crops are harvested before full maturity,
nutrients such as nitrogen remain in the soil, and can be lost to leaching in the fall or the following
spring.10 Planting a cover crop can minimize these losses while reducing erosion. Cover crops that can
be planted following peas or sweet corn include winter rye, tillage radish, rape seed, and oats.
Edible Dry Beans
Minnesota was the national leader in kidney bean production in 2019. Most of the crop was grown in
north-central and northwestern Minnesota. Beans have a shallow root system and do well in sandy soil
with moderate irrigation. Otter Tail and Hubbard counties lead the region in dry bean acreage, while
Pope and Todd counties each reported over 5,000 acres of dry beans.
Like other legumes, dry beans have the ability to fix a portion of their nitrogen needs from the
atmosphere so nitrogen fertilizers may not be needed, especially if they follow crops fertilized with high
amounts of nitrogen.
Markets for dry beans are difficult to access, since they are dominated by large producers in North
Dakota. Beans also require a high level of weed management, especially for organic production.
9 https://extension.umn.edu/small-grains-crop-and-variety-selection/winter-barley-emerging-crop#winter-survival-and-planting-date-1884760 10 https://blog-crop-news.extension.umn.edu/2018/09/in-2017-minnesota-ranked-1-in-us-for.html

6/30/2020 28
Sugar Beets
Sugar beets are grown primarily in northwest and west-central Minnesota, including Becker, Otter Tail,
Pope, and Stearns counties.11 Many producers plant cover crops in spring to protect emerging beet
plants from wind erosion. Research by the southern Minnesota Beet Sugar Cooperative indicates that
incorporating fall cover crops can increase yield in the following season.12
Potatoes
Potatoes are grown in sandy soils in central and northwest Minnesota, particularly in the Pineland Sands
region of north central Minnesota, which includes parts of Hubbard, Becker, and Wadena counties.
Most are grown under irrigation, resulting in concerns about the potential for cumulative impacts to
groundwater. In addition to cover crops, potatoes benefit from a multi-year rotation that includes
alfalfa, which can help to break soil-borne disease cycles.13
Specialty Crops / Emerging Crops
Farmer respondents were generally unfamiliar with the emerging crops discussed below, although a few
had heard of Kernza®. Over half the allied stakeholder respondents indicated that the farmers they
worked with were considering alternatives, including small grains, canola, and hemp. Reasons included
interest in reducing fertilizer, pesticide, and drainage tile costs, reducing erosion, increasing organic
matter in soil, and looking for profitable opportunities.
Kernza®
Kernza is the trademarked name for the edible grain harvested from the intermediate wheatgrass plant,
developed as a promising new perennial grain crop by The Land Institute in Salina, Kansas, and the
Forever Green Initiative at the University of Minnesota. With a deep, dense root system and long
growing period, Kernza has been shown to reduce nitrate leaching to groundwater when compared to
fertilized annual crops. It has attracted increasing interest from growers, processers, and large and
small food manufacturers. Kernza is being used for baked goods, cereals, and brewing, but can also be
used as a forage crop, with the potential for multiple harvest (forage and grain) in a single season.14
Since the interviews for this study were conducted in 2018, awareness of Kernza has increased
dramatically, with products showcased at the State Fair, and has received substantial national media
attention. Development of seed supplies, supply chain, and markets for Kernza have also advanced, with
demand for seed outstripping supply. A new variety, MN-Clearwater, was introduced in 2019, and seed
supplies will allow about 1,000 acres to be planted in fall 2020. Availability of processing facilities
remains challenging – there is one processor in North Dakota, but capacity is limited. However, demand
for cleaning, dehulling, milling, and malting is increasing, and it seems likely that Kernza acreage will
expand in the next few years.
Winter Camelina and Pennycress
These crops are winter annual oilseeds that are being domesticated to fit Minnesota’s conventional
agricultural system. Both are cover crops that protect soil over the winter and early spring to reduce soil
erosion, nutrient loss, and weed infestations. At the same time, they can act as double or relay “cash
11 https://www.nass.usda.gov/Statistics_by_State/Minnesota/Publications/County_Estimates/2019/MN-CtyEst-Sugarbeets-17-18.pdf 12 https://www.smbsc.com/News/index.php/2017/11/30/mpca-bulletin-beet-co-op-promotes-cover-crops-exceeds-phosphorus-reduction-credit-goals/ 13 https://potatosoilhealth.cfans.umn.edu/about 14 See https://kernza.org/ for references and resources

6/30/2020 29
crops” that produce oil, with uses ranging from human consumption (for camelina) to bio-jet fuel, bio-
based plastics, and oilcake for animal feed. The University of Minnesota breeding program has been
working to develop high yielding, non-shattering, and high germination varieties. Both oilseeds are
ideally suited to crop rotations in which they follow short season canning crops, (primarily sweet corn
and peas, as discussed above) and are followed in spring by soybean. While opportunities to establish
the annual oilseeds in Minnesota are likely to increase, obstacles include restrictions against harvesting
cover crops in USDA-NRCS programs, lack of crop insurance protection, and unfamiliarity with the crops
among lenders, crop consultants, and other influencers.
Other Specialty Crops
Many other specialty crops are under development in Minnesota through the Forever Green Initiative
and other University of Minnesota programs, including hazelnuts, perennial sunflower, silphium (a
sunflower-related oilseed crop), and summer annual grains for double cropping. As plant breeding and
agronomy advances, opportunities for these crops will increase, although they still currently comprise
small niche markets.

6/30/2020 30
References
Dorsett, D.J., n.d. Pasture Management for beef cattle production. Texas Agricultural Extension Service.
http://publications.tamu.edu/FORAGE/PUB_forage_Pasture%20Management%20for%20Beef%20Cattle
%20Production.pdf
Gunderson, Dan. 2019. Tariffs leave Minnesota’s nation-leading kidney bean crop in limbo. Minnesota
Public Radio, Sept. 27, 2019. https://www.mprnews.org/story/2019/09/27/minn-leads-nation-in-kidney-
bean-production-tariffs-leave-harvest-in-limbo
Minnesota Agricultural Experiment Station. Oats. https://www.maes.umn.edu/publications/food-
life/oats.
Minnesota Agricultural Experiment Station. Field beans.
https://www.maes.umn.edu/publications/food-life/field-beans
Muckey, Erik. 2018. Small grains in Minnesota: Assessing the feasibility of local supply chains.
Southeast Regional Sustainable Development Partnerships, U of MN Extension, and Center for Urban
and Regional Affairs, UMN. https://www.renewingthecountryside.org/publications
Practical Farmers of Iowa and Sustainable Food Lab. 2019. Expanding the production of oats and small
grains in Iowa and Minnesota. http://www.sustainablefoodlab.org/wp-
content/uploads/2016/02/Interview-Synthesis_Oats_4.27.15.pdf
Practical Farmers of Iowa. Cereal Rye Variety Trial 2019. https://practicalfarmers.org/wp-
content/uploads/2019/11/19.FC_.SG_.Cereal-rye-variety-trial_FINAL.pdf
Scharpe, Peter. 2019. Adding oats, small grains to rotation has benefits, requires advanced planning.
Minnesota Farm Guide, Sept. 23, 2019.
https://www.agupdate.com/minnesotafarmguide/news/crop/adding-oats-small-grains-to-rotation-has-
benefits-requires-advanced/article_4b1ef0be-dadf-11e9-bf18-878057c8a2ec.html
Wiersma, J., S. Wells, and J. Goplen. 2018. Small grains: an easier way to establish (and grow) cover
crops. https://blog-crop-news.extension.umn.edu/2018/04/small-grains-easier-way-to-establish.html
Selected Definitions
Rotational grazing can be practiced in a variety of intensities. Systems can range from 2 to 30 or more paddocks. Management intensive rotational grazing involves a higher level of management with greater paddock numbers, shorter grazing periods, and longer rest periods. https://www.nrcs.usda.gov/Internet/FSE_DOCUMENTS/stelprdb1097378.pdf
Strip grazing involves the use of a movable electric fence, to give the stock a fresh strip of leafy grass per
day. This allows farmers to allocate fresh grass to their stock for 1 or 2 days at a time.
https://www.thatsfarming.com/news/grazing-system-farm

6/30/2020 31
Mob grazing is also known as ultra-high density grazing – grazing a large concentration of livestock in a
small area for a short duration, with animals moved several times per day.
https://grazer.ca.uky.edu/content/grazing-methods-which-one-you
Appendix A: Detailed Tables
Source for all tables is the Census of Agriculture, 2012 and 2017
Table A1: Changes in Land Cover, Primary Crops, and Conservation Practices in Minnesota, 2012-2017
Land Cover, Primary Crops, Conservation Practices 2017 2012 Change (%)
Land Area and Land Cover
Number of farms 68,800 74,542 -8
Land in farms (acres) 25.5 M 26.0 M -2
Average size of farm (acres) 371 349 6
Cropland (acres) 21.8 M 21.6 M 0.9
Permanent pasture and grazing land (acres) 1.0 M 1.27 M -27
Pastured woodland (acres) 345,600 439,300 -27
Crops (acres harvested)
Corn for grain 7.8 M 8.3 M -6
Soybeans 8.1 M 7 M 24
Wheat for grain 1.20 M 1.35 M -13
Sugar beets 423,100 481,000 -14
Dry edible beans 160,600 150,150 7
Oats for grain 84,600 130,700 -55
Barley for grain 67,500 99,640 -48
Potatoes 46,280 48,210 -4
Forage (all hay, haylage, etc.) 1.45 M 1.5 M -3.5
Hay 1.20 M 1.3 M -1.1
Alfalfa hay 829,000 784,000 5.7
Other dry hay 382,000 n/a
Corn for silage 330,500 361,200 -9
Conservation practices
No-till acreage 1.1 M 819,000 33
Reduced till 8.2 M 6.1 M 34
Cover crops 579,150 408,190 41

6/30/2020 32
Regional characteristics of the study areas
Table A2 summarizes the crop mix in the three study areas, Table A3 summarizes livestock numbers, and
Table A4 summarizes conservation practices. Counties with higher acreage in each category are
highlighted.
Table A2: Crop Mix in the Study Areas, 2017
Major Crops (Acres) – Harvested, 2017
Corn for
grain Soybeans
Corn for silage or
greenchop
Forage (hay,
haylage) Oats for
grain
Wheat for
grain
Dry edible beans Potatoes
Vegetabl-es, sweet
corn
Central Sands
Becker 59,859 86,237 5,436 32,358 29,990
Hubbard 11,214 15,402 8,412 (D) (D)
Otter Tail 168,402 179,243 81,319 30,196 14,437
Wadena 15,828 14,188 23,457 (D) (D)
Douglas 63,660 82,326 3,038 16,013 10,702
Todd 54,679 48,600 10,736 49,406 5,753
Morrison 71,970 38,723 21,105 65,403 4,271
Pope 115,033 93,627 13,150 5,318 5,769
Stearns 182,828 114,288 40,242 95,352 11,100
Benton 56,554 54,340 6,629 20,256 4,007
800,027 711,572 87,186 412,116 11,100 81,959 32,889 4,007
Southeast
Dakota 103,411 65,489 7,864 23,681
Goodhue 153,611 113,522 9,888 25,760 4,520
Wabasha 68,810 40,860 10,308 29,597 6,790
Olmsted 110,854 69,899 20,491 20,491 17,240
Winona 72,401 34,666 15,252 38,502 2,249
Fillmore 136,887 82,605 8,469 30,469 1,570
Houston 43,258 24,820 6,144 28,938 1,615
689,232 431,861 70,552 181,621 5,434 52,231
Southwest
Pipestone 94,639 83,912 6,599 10,325 2,049
Rock 127,899 113,772 8,309 7,463 1,544
Nobles 185,989 176,225 9,386 8,043 555
408,527 373,909 24,294 25,831 2,099 2,049

6/30/2020 33
Table A3: Livestock Numbers in the Study Areas, 2017
Livestock (number of animals), 2017
Cattle, calves
Milk cows
Beef cows
Hogs, pigs
Horses, ponies
Sheep, lambs Chickens Turkeys
Central Sands
Becker 26,645 6,279 6,154 (D) 382 316 2,743 578,604
Hubbard 6,841 411 3,148 1,052 551 511 2,716 65
Otter Tail 78,216 14,341 18,079 11,746 1,564 2,162 6,089 831,000
Wadena 12,818 2,576 4,237 181 585 877 3,999 (D)
Douglas 19,943 3,611 3,875 1,089 512 778 1,908
Todd 55,660 14,498 11,302 10,740 1,879 3,016 12,002 899,194
Morrison 87,791 27,805 15,438 59,080 992 1,080 5,479,289 1,477,183
Pope 27,195 3,446 6,123 104,433 354 867 (D) (D)
Stearns 198,361 66,524 11,343 84,707 1,490 2,610 4,102,606 2,734,124
Benton 33,372 10,404 4,013 25,398 492 990 2,894,028
546,842 149,895 83,712 298,426 8,801 13,207 12,505,380 6,520,170
Southeast
Dakota 22,749 3,577 1,915 14,493 980 1,024 3,359 (D)
Goodhue 70,463 18,382 8,146 103,073 1,108 2,624 6,658 543,043
Wabasha 56,163 20,257 5,438 11,603 529 547 2,180 (D)
Olmsted 44,266 10,660 8,034 23,691 1,476 923 2,405 (D)
Winona 70,460 24,032 8,543 112,381 1,160 3,049 7,326 (D)
Fillmore 59,346 10,963 16,206 143,545 1,691 3,163 21,301 (D)
Houston 43,648 9,177 7,861 12,703 488 595 1,559 (D)
367,095 97,048 56,143 421,489 7,432 11,925 44,788 543,043
Southwest
Pipestone 59,712 6,910 9,181 361,314 330 3,964 (D) (D)
Rock 93,683 3,880 5,561 299,729 195 2,057 (D) (D)
Nobles 92,426 6,569 5,094 393,029 231 1,805 1,213 186,011
245,821 17,359 19,836 1,054,072 756 7,826 1,213 186,011

6/30/2020 34
Table A4: Conservation Practices; Land Use in the Study Areas; Change in Cover Crops, 2012-2017
% 2017 Farms
practicing no-till*
% 2017 Farms
practicing reduced
till*
% 2017 Farms with cover
crops*
2017 Cropland
acres
% 2017 Cropland in cover
crops
2017 Cover crop acres
2012 Cover crop acres
% change 2012-2017
% Pasture-land**
Central Sands
Becker 5 11 6 255,999 2.5% 6,367 5,365 19 7
Hubbard 7 7 8 53,391 4.7% 2,491 2,245 11 8
Otter Tail 7 20 7 576,163 3.4% 19,501 17,231 13 6
Wadena 4 12 13 75,336 7.7% 5,809 2,130 173 13
Douglas 8 23 5 205,324 1.4% 2,773 2,722 2 4
Todd 6 16 8 210,494 2.8% 5,808 7,438 -22 12
Morrison 7 23 8 232,790 3.9% 9,008 13,710 -34 11
Pope 8 26 8 280,326 2.1% 5,883 2,471 138 6
Stearns 6 28 9 515,928 3.3% 17,017 24,906 -32 6
Benton 7 23 6 155,769 2.1% 3,244 4,483 -28 7
2,561,520 3.0% 77,901 82,701 -6
Southeast
Dakota 10 31 12 192,659 5.8% 11,174 5,033 122 2
Goodhue 14 34 11 329,994 2.8% 9,124 7,335 24 5
Wabasha 15 38 15 177,784 5.2% 9,327 6,590 42 6
Olmsted 15 30 12 209,399 4.5% 9,397 5,174 82 6
Winona 13 33 13 180,009 3.8% 6,836 9,866 -31 9
Fillmore 16 33 11 316,843 2.8% 8,853 9,752 -9 8
Houston 23 28 9 129,356 2.5% 3,280 4,715 -30 10
1,536,044 3.8% 57,991 48,465 20
Southwest
Pipestone 14 27 13 206,004 2.1% 4,278 2,238 91 8
Rock 20 43 8 252,671 1.7% 4,281 1,193 259 4
Nobles 9 34 5 350,983 1.8% 6,473 1,707 279 2
809,658 1.9% 15,032 5,138 193
* percent of number of farms
** percent of land in farms

6/30/2020 35
Appendix B: State Agricultural Grant and Loan Programs That Can Support Vegetative Cover
The following list does not encompass every state program that may be supportive of vegetative cover
initiatives, but rather identifies those that most directly address the issues raised in this report.
Note also that many best management practices that support vegetative cover receive funding through
USDA’s Natural Resources Conservation Service programs, particularly the Environmental Quality
Incentives Program (EQIP) and the Conservation Stewardship Program (CSP). Both programs provide
cost-share payments for specified practices such as cover crops, conservation crop rotation, and forage
and biomass planting. Farmers generally access these and other federal and state programs through
their local soil and water conservation district.
Agency Program Issues addressed
Loan and Information-Sharing Programs
MDA Cropland Grazing Exchange: matches livestock farmers with crop farmers who have forage (crop residues, cover crops, etc.) to harvest. Connections are made via an interactive map that shows the locations of farmers who have livestock to graze and farmers who have cropland they want grazed. Grazers may need to provide water and temporary fencing. Opportunities for grazing and harvest of hay on public land such as wildlife management areas can also be identified by contacting wildlife managers.
Availability of grazing land.
MDA FarmLink: a list of Minnesota farm properties for sale or rent; also a means to connect retiring farmers with prospective farmers, and experienced farmers with beginning farmers.
Availability of farmland for sale or rent; sharing of expertise.
MDA AgBMP Loan Program: a water quality program that provides low-interest loans to farmers, rural landowners, and agriculture supply businesses. The purpose is to encourage agricultural Best Management Practices that prevent or reduce runoff from feedlots, farm fields and other pollution problems identified by the county in local water plans.
Need for support for BMP implementation.
MDA Rural Financing Authority: offers low-interest loan programs to farmers for a wide variety of activities, including land purchase, farm improvements, and livestock production facilities.
Availability of funding for land purchase and capital investments.
Technical Assistance Programs
MDA/Multi-agency
MN Ag Water Quality Certification Program (MAWQCP): a voluntary program for farmers and agricultural landowners to take the lead in implementing conservation practices that protect our
Participants receive priority for technical and financial assistance to implement practices such as cover

6/30/2020 36
Agency Program Issues addressed
water. Farmers who become MAWQCP-certified obtain regulatory certainty for ten years as complying with any new water quality rules or laws during that time.
crops and other practices that improve soil health.
MDA Nutrient Management Initiative: Assists farmers and crop advisors in evaluating nutrient management practices on their own fields. Participants are compensated for their time.
Ability to monitor nutrient management practices easily at a field scale. Need for peer-to-peer learning.
Grant Programs – Research and Practice Support
MDA AGRI Crop Research Grant: funds applied crop research projects. Preference is given to projects for crops that have limited access to other research funds, projects with in-kind support, and projects involving access to underserved agricultural producers. Maximum award: $250,000. Many awards have focused on breeding improvements to small grains and emerging crops.
Need for ongoing research on improvements to small grains and emerging crops
MDA AGRI Livestock Investment Grant: reimburses investments in buildings or facilities for livestock production or livestock products, development of pasture for livestock use, and equipment for livestock housing, confinement, feeding, and waste management.
Need for infrastructure for livestock, i.e., fencing, housing, etc.
MDA Agri Value-Added Grant: helps processors add value to Minnesota agricultural products by helping underwrite feasibility studies and purchase of equipment.
Need for equipment for harvesting and processing small grains, alfalfa, etc. Need for additional research on utilization of small grains, etc.
MDA Sustainable Agriculture Demonstration Grant: funds projects that explore the profitability, energy efficiency, and environmental benefits of practices or
systems. Applications from Minnesota farmers receive priority. Grantees must share project results with others.
Need for research and peer-to-peer learning, on farm diversification using traditional and non-traditional crops and livestock, cover crops and crop rotations.
BWSR State Cost Share Program: provides funds to soil and water conservation districts (SWCDs) to share costs of conservation practices with producers for high priority erosion, sedimentation, or water quality problems. Structural or vegetative practices must be designed and maintained for a minimum effective life of ten years.
Need for support for a wide variety of conservation practices.
BWSR Projects and Practices Grant: is a competitive grant supported by the Clean Water Fund that invests in on-the-ground projects and practices that will protect or restore water quality in lakes, rivers or streams, or will protect groundwater or drinking water. Eligible
Need for support for conservation practices that are targeted to water quality improvements.

6/30/2020 37
Agency Program Issues addressed
activities include many agricultural BMPs that promote soil health.
BWSR Cover Crop Demonstration Grant: pilot program
established in 2019 is providing funds to five SWCDs
to offer technical and financial assistance to new adopters of cover crops.
Need for support for cover crop establishment
Marketing Programs
MDA Minnesota Grown: a statewide partnership between the Minnesota Department of Agriculture and Minnesota producers of specialty crops and livestock, in place for over 30 years to identify and promote locally-raised products.
Need to promote specialty crops, including small grains, and livestock, including grazed livestock, direct to consumers
MDA New Markets Cost Share Program: Offers reimbursements for e-commerce for Minnesota Grown members and registered food and beverage companies.
Need for support for online

6/30/2020 38
Appendix C: Study Methods and Detailed Responses
Farmer Interviews and Profile
The evaluator interviewed 36 farmers, working with 34 farms, of which 29 were included in the detailed
summary of responses. Four of the interviewed farms located outside the study areas were not included
in the detailed data portion, although their comments were included in the summary, and one
respondent from a farm in a study area did not provide detailed data.
Demographics
• 23 of the interviewed farmers were male, eight were female
• The online questionnaire included 14 males, four females; one who preferred not to say and two who did not respond.
Table B1: Farmer age range Age Number Percent
Under 20 0 0.0%
20-30 1 3.2%
31-40 6 19.4%
41-50 7 22.6%
51-60 5 16.1%
61-70 6 19.4%
70+ 0 0.0%
Not available/declined to say 6 19.4%
Total 31 100
n= 31 interview farmers representing 29 farms *
Operations
• Farms were operated by 2.4 people on average, with a family member the most likely to be the other person or persons involved.
• Input on management decisions came from spouses, parents, children, and other family
members.
• All farms used or more consultants to assist them in their farming operations, with an average of 4.62 consultants per arm with agronomists being the most prevalent.
Table B2: Whom do farmers consult with for their operations?
Frequency Percent Frequency
Agronomist 26 90%
Nutritionist 21 73%
Veterinarian 21 72%
Extension Educator 12 41%
Farm Business Management Instructor 7 24%
Lender 17 59%
Soil & Water Conservation District 15 52%
NRCS 12 42%
Other 3 10%
n= 29 surveyed farms; farms could make more than one selection

6/30/2020 39
Acreage owned and rented:
• Among surveyed farms, acres farmed ranged from 70 to 5,000 acres, with an average of 1,079 acres. The online questionnaire respondents reported a range of 10 to 5,000 acres with an average of 1,118 acres.
• Among the 24 farms that reported acres of owned and rented land, owned land averaged 802 acres per farm. Twenty farms reported cash-rented land averaging 469 acres, while two farms reported small acreages of shared rental land.
• Seven farms reported that their land farmed in 2018 increased from previous years, while three reported a decrease, 13 reported no change in land farmed and six did not specify.
Table B.3: Acreage of primary crops
Crop Average acres
Range in acres Number of farms reporting
Corn total 518 40-2,000 28
Corn grain 294 20-1,400 16
Corn silage 234 15-700 16
Soybeans 304 50-1,300 19
Small grains 155 15-600 10
Alfalfa – owned land 198 35-500 14
All hay including alfalfa 219 20-950 24
n=28
Nine farms did not specify how their corn crop was broken down between grain or silage; these are
presumed to be all grain.
Pasture: A total of 25 interviewed farms reported pasture and 21 pastured their animals in some
fashion. Twenty-four farms owned pasture, averaging 130 acres, while 8 farms rented pasture,
averaging 199 acres (one farm rented only, the remaining owned and/or rented pasture). Farms
included improved pasture, native pasture, and pastured woodland. Four of the farms did not have
pasture.
Allied Stakeholder Survey
A total of 81 people considered allied stakeholders provided information for this study.
• Twenty-seven people who work directly with farmers were interviewed using a standard
interview format (see below for organizations; see Appendix D for questions). An additional 15
responses were captured via an online questionnaire.
• An additional 39 people who have some professional involvement with vegetative cover and
who may or may not have farmer contact were also interviewed, focusing on their area of
expertise.
Types of farms and animal agriculture
Respondents worked with every type of farm, with dairy, beef and corn/soybeans being the most
common, followed by small grains and hay/haylage. Hogs were also common, with 13 respondents, as

6/30/2020 40
well as sheep, goats, poultry, and fruits/vegetables. The majority of interviewees indicated that they
worked with farmers who grow forages, sell forages, pasture livestock, rent pasture to others, grow
cover crops, or farm partially or entirely using organic practices.
Pasture and Grazing
Twenty-one of the 27 standard interview respondents indicated that they worked with farmers who had
improved pastures, either on owned or rented property. Over 50% reported that they worked with
farms that had native owned and rented pasture and owned pastured woodland. (Improved pastures
are those planted with introduced species such as cool-season or warm-season perennial grasses and
legumes.)
Nineteen of the standard interview respondents were able to provide detail on the grazing systems used
by farms that they were working with. Rotational grazing using a paddock system was the most
common, reported by 89% of the respondents, followed by continuous grazing, reported by 74%.
Management intensive grazing and MOB grazing were the least frequently used.
Respondents reported that the majority of farms they worked with practiced aftermath grazing, including
on corn and cover crops (both at 89%) and hay (84%). Beef cow-calf grazing was most common (85% of
the respondents), followed by dairy cows (50%) and other classes of cattle such as steers and heifers (30-
45%). Sheep (30%) and goats (20%) were also reported. Fifteen percent of respondents mentioned grazing
of other animals: horses, elk and buffalo.
Forage
Nineteen of the 27 standard interview respondents indicated that farms they work with grow forages on
both owned and rented land. All the farms that grew forage grew alfalfa, while 89% grew corn silage.
Other forages, including clover, grasses, legumes and small grains, were grown to a lesser extent. Forage
was harvested primarily as haylage (all) and dry hay (95%). Almost 80% also harvested baleage.
Cover Crops
Twenty-four of the 27 standard interview respondents indicated that they worked with farms that grow
cover crops. They reported that the practice is gaining ground, especially for grazing, and works most
effectively when there are livestock in the system or for short-season crops. Crops planted include
winter cereal rye after corn silage, triticale and winter wheat, as well as root vegetables. About 70% of
respondents stated that the farms they work with are planning on expanding the use of cover crops,
while 45% are planning on keeping the same acreage (multiple clients and multiple responses exceeding
100%).
Organizations Interviewed
Representatives of the following organizations provided information as part of the allied stakeholder
survey:
• Agricultural Research Service – USDA
• Agricultural Utilization Research
Institute
• Bioeconomy Coalition
• Center for Farm Financial Management
• CoBank
• Compeer Financial
• Farm Business Management, MN State
• Forever Green Initiative, UMN
• GEVO, Inc.
• Green Lands Blue Waters
• Land Stewardship Project
• Mid-American Auction – Sauk Centre
• Minnesota Ag Water Resource Center
• Minnesota Board of Water and Soil
Resources

6/30/2020 1
• Minnesota Corn Growers
• Minnesota Department of Agriculture
• Minnesota Department of Employment
and Economic Development
• Minnesota Department of Natural
Resources
• Minnesota Rural Water Association
• Minnesota State University
• Natural Resources Conservation Service
– USDA
• Pepsico (U of M, St Paul campus)
• Pheasants Forever
• Pipestone Water
• Riverland Community College
• Riverview Feed
• Sauk Center Hay
• Soil and Water Conservation Districts
• Square Deal Feeds
• Steffes Group Hay Auction
• Sustainable Farming Association of MN
• University of Minnesota – Departments
of Agronomy and Plant Genetics,
Applied Economics, Food Science and
Nutrition
• University of Minnesota Extension
• University of Minnesota – Morris
• Zumbrota Hay

2
Appendix D: Questionnaires Participant/Farm Profile
County_________________________________________ Date________________________________
Via Phone In-Person Electronic
1. Age range (circle one): under 20 20-30 31-40 41-50 51-60 61-70 70+ rather not say
2. What is your gender (circle one): M F
3. How many years have you been farming? _________
4. Type of farming operation - Which of the following best describes what you raise on your farm (Check all that apply)
Dairy ____ Beef____ Hogs____ Sheep____Goats____ Poultry____ Corn _____Soybeans ______ Small Grains_____
Hay/Haylage______Fruit/Vegetable____ Other ___________________________________________
Livestock number of head Dairy Cows________ Heifers ________ Beef Cows__________ Heifers__________Steers___________Bulls_____________
Sheep ________Ewes/Rams________Lambs_______ Goats_________Poultry___________Other________________________________
5. Acres farmed in 2018: _________ owned ___________rented (cash) __________rented (crop-share) Has this increased or decreased from previous years?___________Increase ____________Decrease
Comments_______________________________________________________________________________________________
Crop Acreages: Corn _________ grain________silage_________ Soybeans _________ Small grains _________, types_______________________
Forage Acreages: Owned _________ Alfalfa_______Mixed________ Clover________ Grass________ Other_______ specify_______________________
Rented _________ Alfalfa_______Mixed________ Clover________ Grass________ Other_______ specify_______________________
Owned _________ Corn Silage Rented ________Corn Silage
Other crops, (please specify) ________________acres_______ Other__________________ acres_______ Other _____________ acres______
Pasture Owned _________ Improved ________ native ________ pastured woodland Rented _________ Improved ________ native ________ pastured woodland Comments_______________________________________________________________________________________________ Have used covers to rebuild soil health (4) ________________________________________________________________________________________________________ Is any part of the farm operated/managed organically? Yes No

6/30/2020 3
Coments________________________________________________________________________________________________
6. The farm business is operated by (circle all that apply)
me my spouse parent/s child/children other family business partner
other____________________________________________
Comments_______________________________________________________________________________________________
7. Who provides input on management decisions? (circle all that apply)
me my spouse parent/s child/children other family business partner
other________________________________________
Comments______________________________________________________________________________________________
8. I consult with the following for my farming operation agronomist nutritionist veterinarian Extension educator Farm Business Management Instructor
lender Other, please specify______________________________________________________________________
Comments_______________________________________________________________________________________________
Other general
Pastures How would you rate your understanding of pastures/pasture management? 1=very poor 2=poor 3=average 4=above average 5=excellent 6= don’t know
Comments:
____________________________________________________________________________________________________________
Do you have pasture? Yes No Do you graze it? Yes No Rent out to others? Yes No Comments_______________________________________________________________________________________________
Grazing System
Continuous grazing Rotational Grazing -strip grazing, RG- paddock, Mgmt Intensive Grazing MOB grazing Other, please specify______________________________ Comments_______________________________________________________________________________________________
Are any crops aftermath grazed? Please specify: hay _________________ cover crops____________________________ Comments_______________________________________________________________________________________________ What numbers and types of animals are you grazing?
Dairy Cows____________ Heifers_______________ Steers______________
Beef Cow/calf _________ Heifers______________ Steers_______________
Sheep__________________Goats______________________________________
Other, please specify______________________________________________________________________________
Comments about grazing system:
If you graze, why do you graze?
If you don't graze, why not?

6/30/2020 4
No livestock No neighbors with stock for rental opportunities Doesn't fit with feeding system
Fences Work involved Getting water to stock Not enough land available to make it work
Limited knowledge/experience w/grazing Other
Comments
Are you planning on expanding your pasture? yes no keeping the same dropping
NA
Comments______________________________________________________________________________________________
What are the constraints, if any, to expanding pasture in your operation?
If you don't currently have pasture or are hesitating to expand your land in pasture, what would get you to
consider adding or expanding pastureland?
Are there incentives that would encourage you? e.g. Cost share, grants, tax credits, other?
Hay/Forage production
How would you rate your understanding of growing hay/haylage/forage? 1=very poor 2=poor 3=average 4=above average 5=excellent 6= don’t know
Comments_______________________________________________________________________________________________
Do you grow hay/forage yes no
Forage is harvested as _________dry hay __________ haylage _________baleage __________corn silage _________
other__________________________
Comments_______________________________________________________________________________________________
If yes, do you grow forage do you hire custom work? to plant yes, no harvest yes, no other yes, no
Comments_______________________________________________________________________________________________
If you don't grow forage what is stopping you?
equipment knowledge labor timing of operations flexibility availability of custom operators
market/marketing
weather storage handling logistics costs
Other
Comments: ______________________________________________________________________________________________
Are you planning on expanding your forage? yes no Keeping the same Dropping
NA
Comments: ______________________________________________________________________________________________
What are the constraints, if any, to expanding forages in your operation (storage, equipment, land)?
equipment knowledge labor timing of operations flexibility availability of custom operators
market/marketing weather storage handling logistics costs don't
know
Other _________________________________________________
Comments: _____________________________________________________________________________________________
If you don't currently grow forages or are hesitating on expanding your forage acreage, what would get you to
consider adding or expanding forage acreage?

6/30/2020 5
Are there incentives that would encourage you? e.g., cost share, grants, tax credits, other?
Do you sell forage? yes no
What type(s) of forage do you sell?
Forage is harvested as _________dry hay __________ haylage _________baleage __________
other__________________________
Where or how do you sell your forage?
neighbors word of mouth direct from grower classified ads forage specific auctions
auction markets that have a forage sales day online forage specific sites Craigslist Facebook
Website Other___________________________________________________________________________
How much of your forage crop do you sell?
Do you have ample outlets for forage that you sell or wish to sell?
Other comments:
Forage Purchasing
I purchase
hay bedding (straw, cornstalks) baleage haylage/silage Other
In a typical year I purchase approximately _________percent of my forage needs or about _______tons
___________bales
I haul my own purchases yes no
I hire someone else to haul yes no charge per loaded mile ________ Other charge_________
Miles typically hauled ?_____________
What is the limit to how far you would haul?_________
What are my primary considerations when purchasing? (Please rank) 1= most important (or check the important
ones if they can't check) rank the top 1-3 if they have numerous
_______Forage is tested_______Quality______RFV _______Protein_______Hauling Distance
_______Ease of loading_______Availability of delivery_______Form (rounds/squares)_______Size
_______ Type of Forage ________Quantity Available _________Consistent Supply _______Cost ______Consistent Quality
Other
Species being fed dairy beef sheep goats horses
Where do you buy forage? neighbors word of mouth direct from grower classified ads forage specific auctions
auction markets that have a forage sales day online forage specific sites Craigslist Facebook Website
Other
Do you have enough forage purchasing options? Yes No

6/30/2020 6
Explain:
Do you currently purchase forage from Minnesota growers Yes No
If no, why not? What would get you to purchase MN forage?
Cover Crops How would you rate your understanding of growing/utilizing cover crops? 1=very poor 2=poor 3=average 4=above average 5=excellent 6= don’t know
Comments: __________________________________________________________________________________________________________
Do you grow/use cover crops yes no
Types/practices
Cover Crops: please specify types ___________________acres___________ owned/rented System ________________________________________________________________________________________
Cover Crops: please specify types ___________________acres___________ owned/rented System ________________________________________________________________________________________
Cover Crops: please specify types ___________________acres___________ owned/rented System ________________________________________________________________________________________
Are you planning on expanding your cover crops? yes no Keeping the same Dropping
NA
Comments_______________________________________________________________________________________________
What are the constraints, if any, to expanding cover crops in your operation?
If you don't grow why not?
seed availability cost knowledge landlord equipment insurance manure application timing
lack of market for harvest storage logistics of getting harvest to market distance of market
Comments_______________________________________________________________________________________________
If you don't currently grow cover crops or are hesitating on expanding your cover crop use, what would get you to
consider adding or expanding cover crops?
Are there incentives that would encourage you? e.g. Cost share, grants, tax credits, other?
Other
Are there tools/resources that you might suggest?
Other people that we should be talking to?
Other comments/notes

6/30/2020 7
Allied Stakeholder Questionnaire
Participant Profile
1. Title
Where do you work
Nature of the work (how does it potentially relate to this project?):
Area(s) served:
2. What is your gender (circle one): M F
3. How many years have you been doing what you do?
What other work have you done
Comments:
=====================================================================================
Pastures
Your thoughts on grazing (have they worked with it at all or have any understanding?)
What are factors in operations’ decisions on grazing?
Do operations graze cattle? other species? On operations’ land? On other land?
What are they grazing animals on, type of pasture or grazing?
What incentives would you suggest to increase grazing in MN?
=====================================================================================
Forage
Your thoughts on forages (have they worked with it at all or have any understanding?)
Do operations grow forage?
What are they growing?
What are constraints to expanding land devoted to forage?
What incentives would you suggest to increase forages in MN?
What, if any, are forage equipment (planting, harvesting, handling, feeding) or storage constraints?
Are there any logistical issues with transporting forage or other products to or from markets?
Where do operations purchase/sell forage? Are their ample market outlets for both buyers and sellers?

6/30/2020 8
What qualities are most important decision drivers when operations purchase feed? (e.g. cost, protein
content, consistent supply, etc.)
If criteria are not met how do operations respond?
Would operations purchase Minnesota-grown feed and forage if it met purchasing criteria?
=====================================================================================
Cover Crops
Your thoughts on cover crops (have they worked with it at all or have any understanding?)
Do operations grow cover crops? What are constraints to expanding land devoted to cover crops?
What incentives would you suggest to increase cover crops in MN?
=====================================================================================
Market Opportunities
Are there market opportunities for other perennial crops or winter annuals (e.g. pet food, beer brewing,
biomass for energy, cover crops, seed etc.)?
What are the constraints to the markets?
Storage Size of markets Distance to market Costs
Critical mass (enough others growing crop)
Would you be in the market for products that are would come from increased vegetative cover?
What would you be in the market for and how much?
=====================================================================================
Are there tools/resources that you might suggest?
Other people that we should be talking to?
Comments/Overall Thoughts: