vegetation induced changes in the stable isotope
TRANSCRIPT

ECOHYDROLOGYEcohydrol. 7, 936–949 (2014)Published online 13 August 2013 in Wiley Online Library(wileyonlinelibrary.com) DOI: 10.1002/eco.1420
Vegetation induced changes in the stable isotope composition ofnear surface humidity
Kevin A. Simonin,1,2* Percy Link,3 Daniella Rempe,3 Scot Miller,4 Jasper Oshun,3 Colin Bode,1
William E. Dietrich,3 Inez Fung3 and Todd E. Dawson11 Department of Integrative Biology, University of California, Berkeley, CA, 94720, USA2 Faculty of Agriculture and Environment, University of Sydney, NSW, 2570, Australia
3 Department of Earth and Planetary Science, University of California, Berkeley, CA, 94720, USA4 Department of Earth and Planetary Sciences, Harvard University, Cambridge, MA, 02138, USA
*CEnvEm
Cop
ABSTRACT
Obtaining the d-excess parameter from oxygen and hydrogen stable isotope composition of meteoric waters has the potentialpower to reconstruct changes in atmospheric water pools (e,g. sources, origins and overall balance) and the climatic conditionsthat prevail during surface evaporation. Recently, plant and ecosystem scientists turned their attention using d-excess informationto inform questions at these scales. Here, we use the d-excess parameter to evaluate the influence of forest canopies onatmospheric humidity within a mixed evergreen forest in coastal California. We found that during the day, when transpirationwas at a maximum, the d-excess of atmospheric water vapour exceeded model predictions for the background atmosphere intowhich the ecosystem evapotranspiration mixes. At night when transpiration was minor, the d-excess of atmospheric water vapourwas on average less than model predictions for an ocean derived water vapour source. The observed diurnal fluctuations aroundthe d-excess of the modelled background water vapour provided a strong evidence that during the day as the land surface warmsand the boundary layer grows plants alter the isotope composition of atmospheric humidity via non-steady state isotope effects.In contrast, at night equilibrium isotope effects dominate as the atmosphere stabilizes. These day and nighttime fluctuationsaround the d-excess of ocean derived water vapour highlight the importance of plant transpiration for the isotope hydrology ofnear surface humidity and subsequently for the isotope composition of condensate like dew, an important water input to thisecosystem. Copyright © 2013 John Wiley & Sons, Ltd.
KEY WORDS d-excess; water isotopes; transpiration; water cycling
Received 28 January 2013; Revised 16 July 2013; Accepted 18 July 2013
INTRODUCTION
Most climatemodels predict dramatic changes in atmospherichumidity and in the distribution and abundance of precipi-tation in a future warmer climate (Bates et al., 2008).Although temperature-induced changes to the Earth’s watercycle seem quite certain, other aspects of howwater will cycleon Earth remain uncertain (Roderick and Farquhar, 2002;Huntington, 2006; Bowen, 2011). Part of this uncertaintycomes from an incomplete understanding of the relativecontributions of plant transpiration, surface evaporation(e.g. soils and lakes) and oceanic sources to atmospherichumidity over land, and by extension, to terrestrial precip-itation (Araguas-Araguas et al., 2000; Gerten et al. 2005;Lawrence et al. 2007; Worden et al., 2007; Jasechko et al.2013). Globally, the vast majority of atmospheric water
orrespondence to: K. A. Simonin Faculty of Agriculture andironment, University of Sydney, NSW 2570, Australiaail: [email protected]
yright © 2013 John Wiley & Sons, Ltd.
vapour is ocean derived (Trenberth et al., 2007) such thatvariation in the stable O and H isotope composition of watervapour and subsequent condensation events (e.g. rain, dew,fog and snow) are largely the result of changes in oceansurface conditions, for example, sea surface temperature andrelative humidity (Merlivat and Jouzel, 1979; Uemura et al.,2008). However, variation in the stable isotope compositionof terrestrial precipitation often deviates from the Raleighdistillation model predictions for ocean-derived air massesproviding strong evidence that terrestrial water sources cancycle, perhaps several times, between the liquid and vapourphase before returning to the ocean. As such, terrestrialecosystems may exert a greater influence on atmospherichumidity than previously thought (e.g. Salati et al., 1979;Ingraham and Taylor, 1991; Gerten et al. 2005), and recentestimates suggest that they are dominated (>80%) by planttranspiration (Jasechko et al. 2013). In this context, the extentto which plants contribute to terrestrial water recycling (notjust as a one-way flux from transpiration; Jasechko et al.2013) is perhaps themost poorly understood dimension of theterrestrial water cycle (Lawrence et al. 2007; Bonan, 2008).

937VEGETATION INDUCED CHANGES IN HUMIDITY
Although plants are known to play a major role interrestrial hydrology, our ability to quantify the relativecontribution of plant transpiration to atmospheric humidityand the influence of this water flux on future condensationevents remains limited (Bonan, 2008). Characterizing therelative contribution of plant transpiration to atmospherichumidity over daily, seasonal and annual time scales isessential for understanding how naturally configured andhuman reconfigured land surfaces interact with climate andultimately the water balance of the landscape and theatmosphere. Previous research suggests that vegetatedlandscapes directly influence atmospheric humidity, andtherefore, the chemical (isotope) composition of watervapour most strongly during the day, when leaf surfaceconductance and water flux from leaf to atmosphere (i.e.transpiration) are the greatest (e.g. Lai et al. 2006; Jasechkoet al. 2013). Yet, the fact that many plants do notcompletely close their stomata at night (e.g. Dawson et al.,2007) has potentially important consequences for the waterbalance of the landscape (e.g. Fisher et al., 2007) and the Hand O isotope composition near surface water vapour.
Knowing and using the stable isotope composition ofwater has long been considered a powerful tool forenhancing our understanding of the processes that drivevariation in atmospheric water balance and terrestrial watercycling (Gat, 1996). Furthermore, modelling the stableisotope composition of water in the Earth’s hydrologiccycle is an important diagnostic component of atmospheregeneral circulation models (Noone and Simmonds, 2002;Schmidt et al., 2005; Risi et al., 2010). This is because theisotopic composition of water varies predictably duringphase changes between solid, liquid and vapour. Oncewater is elevated into the atmosphere as vapour, it istransported horizontally and vertically without any frac-tionation effects as long as no cloud processes occur, that isliquid–vapour phase changes (Bony et al., 2008). As such,any changes in the isotope composition of water vapourcan be used to infer changes in the climatic conditions thatoccur during evaporation or condensation. In particular, thed-excess parameter, originally defined by Dansgaard, isconsidered a valuable tool for evaluating changes inatmospheric water balance and the climatic conditions thatprevailed during evaporation and condensation (Craig,1961; Dansgaard, 1964; Merlivat and Jouzel, 1979). Here,we use the d-excess parameter and associated theory tocharacterize the influence of a coastal mixed evergreenforest canopy on the isotope composition of near surfacewater vapour, during the day and at night.
Theory – d-excess and the physical processes regulatingthe distribution of O and H stable isotopes in water
Globally, the stable isotope ratios of oxygen (δ18O) andhydrogen (δD) of precipitation show a strong linear
Copyright © 2013 John Wiley & Sons, Ltd.
relationship described by the general equation, δD=8 ×δ18O + 10 with the y-intercept generally referred to as thed-excess (i.e. d-excess = δD – 8 × δ18O; Dansgaard, 1964).This strong covariation between the δ18O and δD withinprecipitation is ultimately controlled by twomass-dependentisotope effects: (1) the equilibrium fractionation effect(αequil) as a result of temperature-dependent differences inthe saturation vapour pressure of the ‘heavy’ and ‘light’stable isotopes in water and (2) the kinetic fractionationeffect (αdiff) as a result of differences in the moleculardiffusivity of the heavy and light isotopes moving in air.Isotope fractionation during the process of evaporation(αevap) involves both equilibrium and kinetic isotope effects(Gat, 1996; Criss, 1999). At the air-water interface,equilibrium processes dominate, such that αevap = αequil =RL/RV, where RL and RV are the heavy to light isotope ratio(i.e. D/H, 18O/16O and 17O/16O) of liquid and vapour at theair–water interface. The isotope composition of the watervapour transported away from the air–water interface intothe surrounding of unsaturated air is largely determined bythe relative humidity (h) of the air mass and αdiff. Subsequentfractionation during condensation (αcond), in the form of rainand/or dew events, are associated with equilibrium isotopeeffects where αcond = αequil =RL/RV (Merlivat and Jouzel,1979; Criss, 1999). The αequil is approximately eight to tentimes greater for HDO than H2
18O, depending on the surfacetemperature at the liquid–vapour interface, with αDequil=α
18Oequil
increasing as surface temperature decreases (Majoube,1971). In contrast, the kinetic isotope effect is greater forH218O than HDO, with the ratio of the αdiff less than one
(Merlivat, 1978; Cappa et al., 2003; Luz et al., 2009). Takentogether, these two fractionation events result in d-excessvalues for water vapour and precipitation that are largely afunction of the temperature and humidity during evaporationand condensation (Figure 1).We use the theoretical framework described in Figure 1 to
evaluate the influence of forest canopywater vapour exchangeon the isotope composition of near surface humidity. Thephysical processes determining αevap, originally described foropen bodies of water (Craig and Gordon, 1965), can also beused to describe fractionation during transpiration (αtrans):
atrans ¼ Rliq
Rtrans¼ aequil adiff 1-
wa
wi
� �þ wa
wi
Ratm
Rtrans
� �(1)
where Rtrans, Rliq and Ratm are the heavy to light isotope ratioof transpired water vapour, liquid water at the site ofevaporation and atmospheric water vapour;wa andwi are themolar concentrations of water (mol mol-1) in the atmosphereand the leaf (Dongmann, 1974; Flanagan et al., 1991;Farquhar and Cernusak, 2005). Because the water volume ofa leaf is relatively small in relation to the daily transpirationflux, Rtrans is often assumed to be equal to the isotopecomposition of water taken up by roots, that is, Rtrans occurs
Ecohydrol. 7, 936–949 (2014)

Figure 1. Climatic processes determining the covariation between 18O andD in vapour (open symbols) and liquid water (closed symbols) via (1)equilibrium (blue arrows) and (2) kinetic fractionation (red arrow) events.Water vapour at the air-seawater interface (open triangle) is in isotopicequilibrium with surface water; with a d-excess determined by thetemperature-dependent αequil (blue dashed line). The d-excess of watervapour transported away from the air-seawater interface (red dashed line)is inversely related to relative humidity (h). The isotopic composition ofsubsequent precipitation depends on the temperature-dependent αequil.
Figure 2. Results for the sensitivity analyses using a d-excess version ofthe Craig and Gordon evaporation model (Equation 2 in Theory section; δeis the 18O and D in liquid water at the site of evaporation, δE is the
18O andD in vapour). Leaf temperature and relative humidity, normalised to leaftemperature (i.e. wa/wi in equation 2), were varied independently, whereasother parameters were held constant; (A) Leaf temperatures variedby ± 25% and ± 50% from 18 °C (i.e. 12, 18, 24, 30 and 36 °C) values inparentheses represent the ratio of equilibrium fractionation factors for Dand 18O, i.e. aDequil � 1
� �= a
18Oequil � 1
� �, (B) wa/wi varied by ± 25%
and± 50% from 0·5 (i.e. 0·25, 0·375, 0·5, 0·625 and 0·75).
938 K. A. SIMONIN et al.
at isotopic steady state where Rtrans is equal to the isotopecomposition of xylem water (Rxylem). Thus, Equation (1)was originally used to predict Rliq by substituting Rxylem forRtrans (Flanagan et al., 1991; Farquhar and Cernusak, 2005).However, under naturally varying environmental condi-tions isotopic steady state transpiration is often not avalid assumption (Harwood et al., 1998; Harwood et al.,1999; Simonin et al. 2013), and therefore, we opt to usenon-steady state conditions for the work we present here.If transpiration does not occur at isotopic steady statethan we can use Equation (1) and the d-excess modeldescribed in Figure 1 to evaluate the influence of climatevariability, specifically temperature and humidity, on thed-excess of the transpiration water (isoflux) for a givenRatm and Rliq as:
d-excess≈Rliq � aDequilRatm
wawi
aDequilaDdiff 1� wa
wi
� �24
35� 8� Rliq � a
18OequilRatm
wawi
a18Oequila
18Odiff 1� wa
wi
� �24
35
(2)
A model sensitivity analysis of Equation (2) predicts thatfor a given wa/wi, or as depicted in Figure 1, h normalized to
Copyright © 2013 John Wiley & Sons, Ltd.
the temperature of the evaporating surface, as temperatureincreases the d-excess of the transpiration isoflux ispredicted to increase because of the temperature dependenceof αDequil=a
18Oequil (Figure 1, dashed blue line; Figure 2A). The
opposite is true for humidity. If temperature is constant, aswa/wi increases, the d-excess of the transpiration isoflux ispredicted to decrease (Figure 1, dashed red line; Figure 2B).Using Equation (2) to describe the isotope effects that occurduring non-steady state transpiration, we predict that duringthe day as wa/wi decreases the d-excess of the transpirationisoflux should increase and have a positive forcing on thed-excess of near surface humidity (e.g. analogous to surfaceevaporation shown in Figure 1). Similarly, at night during astable atmosphere, we predict that if average canopy leaftemperature approaches dew point temperature (i.e. wa/wi
approaches 1) the canopy isoflux will approach equilibriumisotope exchange (Figure 1). Under this scenario, the
Ecohydrol. 7, 936–949 (2014)

939VEGETATION INDUCED CHANGES IN HUMIDITY
d-excess of the canopy isoflux will approach the d-excess ofsource water, analogous to equilibrium isotope exchange inFigure 1. How quickly the canopy isoflux approaches thed-excess of source water is dependent upon the leaf waterresidence time (Dongmann et al., 1974; Farquhar andCernusak, 2005):
τ ¼ W aequiladiffgwi
(3)
where W is leaf water content (mol m-2), and g is total leafsurface conductance (mol m-2 s-1). During this process ofnighttime equilibration between leaves and the atmosphere,we predict that canopy water vapour exchange with theatmosphere will have a negative forcing on the d-excess ofnear surface humidity.
METHODS
Site description
The focus of this study was a mixed evergreen forest on asteep hillslope in coastal Mendocino County, in northernCalifornia where an intensive monitoring programme hasbeen underway since 2007 (Salve et al. 2012). The site,referred to as Rivendell, is located in the Angelo CoastRange Reserve, on a north-facing, ~32 degree, unchanneled
Figure 3. (A) Laser altimetry map of Elder Creek watershed derived from datwithin the watershed is coloured by canopy height (light green is brush and hato reveal bare earth topography. Inset shows location of Elder Creek watershField Site. (D) Study site showing elevation contours (1 and 5m intervals)humidity, surface soil temperature) and W1, W2, W3, W5, W6, W7, W10,
corresponds with wells W1, W12 and W13; level 2 corresponds
Copyright © 2013 John Wiley & Sons, Ltd.
slope ~12 km from the Pacific coast (Figure 3). Theunchanneled slope drains a surface watershed area that isabout 125m long, with a maximum width of 40m. The siteextends from Elder Creek (at 392 masl) to 470 masl, close tothe ridge-top. Across the Rivendell hillslope a thin-soil layer(up to ~0·50m) blankets nearly vertically dipping argilliteand a sandstone interbed along the eastern divide. Thehillslope is forested and has a limited understory. There aremore than 30 Douglas fir (Pseudostuga menziesii) trees thatare>25m tall within or adjacent to the surface drainage areadelineated in Figure 3, with some older trees >50m tall.These mature conifers represent the majority of the leaf areaon this hillslope and are separated by a variety of lowercanopy trees [e.g. interior live oak (Quercus wislizeni), tan-bark oak (Notholithocarpus densiflorus), madrone (Arbutusmenziesii) and California bay laurel (Umbellulariacalifornica)], creating a relatively densely vegetated hillslope.Some relatively young redwood trees (Sequoia sempervirens)are also present.The Angelo Coast Range Reserve has a Mediterranean-
type climate characterized by warm dry summers and coolwet winters. It receives on average 1900mm of rainannually with little snow, and there is significant variabilityin total annual precipitation. The bulk of annual precipitationis restricted to a 5–6month period beginning in October.Typically, in early October, daily average temperatures at
a collected by the National Centre for Airborne Laser Mapping. Vegetationrdwoods, dark green is the taller conifers). Elsewhere, vegetation is filtereded within Northern California (B) Image of Elder Creek and (C) Rivendell, the location of meteorological instruments (air temperature and relativeW12, W13, W14, W15 and W16 are identifiers for the 12 wells. Level 1with wells W2, W3 and W13; level 3 corresponds with W10.
Ecohydrol. 7, 936–949 (2014)

940 K. A. SIMONIN et al.
the site fluctuate around ~10 °C and then decrease close tozero by the end of December, before increasing to ~20 °C inearly August. Daily fluctuations in temperature are muchlarger during the warm summer months than in the winter(Figure 4).
Forest Meteorology
Three microclimate stations were installed along thehillslope to monitor precipitation (TE525, Campbell Sci.,Inc.), soil temperature (PST-55, Campbell Sci., Inc.), airtemperature and relative humidity (Vaisala HMP45C-L,Campbell Sci., Inc.). An additional rain gauge was installedin an open meadow across from the site. The average annualrainfall among the three sites that monitored continuouslythroughout the 2010 water year (Meadow, Level 1 and Level3) was 1729mm. For the 2010 water year, interception at theforested sites along the hillslope likely caused averagerainfall to be 26% less than was received at the meadow(Salve et al., 2012). During dry periods, diurnal relativehumidity fluctuations often exceeded 60% with the largestfluctuations occurring during the hotter summer months. AtLevel 1, which experienced the highest mean annual relativehumidity of 82%, dew point temperature exceeded themeasured air temperature for 2% of the 2010 water year(Figure 4). Shallow (0·05m) soil temperatures tracked airtemperatures closely (Figure 4) but were limited to smalleramplitude fluctuations.
Figure 4. Variation in site meteorology from October 2009 to January 2011.time when air temperatures reached dew point temperature. Meteorological v
and (C) level 3 (D) Precipitation. See Fi
Copyright © 2013 John Wiley & Sons, Ltd.
Tree water use
Variation in tree water use was characterized by measuringxylem sap velocity by way of the heat ratio method(Burgess et al., 2001). Sap velocity was measured at 1mabove the ground in the trunks of 26 trees at two radialdepths in the sapwood (1·25 and 2·75 cm). The heat ratiosensors measure heat pulse velocity, which is subsequentlyconverted to sap velocity by measuring the wood densityand water content of the sapwood at the two radial depthswhere heat pulse velocity is measured (Burgess et al.,2001). Additionally, we corrected sap velocity for variationin probe spacing by assuming zero sap flow during periodsof low-wind speed, when relative humidity was between92 and 95%, 3 h prior to sunrise and during periods of norain between January and March when soil moisture wasnear the annual maximum using the method described inBurgess et al. (2001).
Water vapour stable isotopes
Diurnal variation in the H and O isotope composition ofatmospheric water vapour was evaluated at three differentlocations in our field site using an isotope ratio infraredspectroscopy (IRIS) instrument (model L1102-i, PicarroInc., Sunnyvale, CA, USA). Air was sampled continuouslyover a 24-hour-period at 2 l min-1 from one, 10 and 50mabove the forest floor and solenoids were used to switch
Relative humidity (%), air temperature (°C), soil temperature (°C) and theariables were measured at three different locations (A) level 1 (B) level 2gure 3 for a description of levels 1–3.
Ecohydrol. 7, 936–949 (2014)

941VEGETATION INDUCED CHANGES IN HUMIDITY
between each sample inlet every 20min. For all 20minmeasurement periods, we discarded the first 5min ofsampling at each location to allow for flushing of theprevious sample through the optical cell and tubing and toallow for dissipation of transient pressure variation becauseof switching between sampling locations. The IRISinstrument makes a measurement every 5–10 s, which wethen converted to 1min averages.
The IRIS instrument calculates the δ18O and δD of watervapour from spectral absorbance in specific wavelengths.All measurements are expressed in per mil (‰) as:
δX ¼ Rsample
Rstandard� 1
� �(4)
where X is either D or 18O, R is the ratio of the heavy tolight isotope (e.g. D/H or 18O/16O) of the sample (Rsample)and standard [Rstandard; in this case vienna standard meanocean water (V-SMOW)]. Two calibration standardsbracketing the range of measured values were used tocalibrate each instrument and to express the measured deltavalues relative to V-SMOW. The calibration standardswere sent to the IRIS using a custom built standard deliverydevice described by Simonin et al. (2013). Additionally,measurements of δ18O and δD by the IRIS show aconcentration dependence that is instrument-specific. Weused the standard delivery device to characterize thedependence of δ18O and δD measurements on theconcentration of water vapour across the range ofconcentrations observed during the measurement periods.To correct for concentration dependencies, we first linearlyregressed the actual isotope ratios against the measuredisotope ratios (determined by mass spectrometry) at a fixedconcentration of 10 000–10 200 ppmv, and applied thiscalibration factor to all the data resulting in a partiallycorrected value. We then plotted the residual isotope error(actual minus partially corrected measured) against watervapour concentration, and we fit a polynomial to thisrelationship for each standard. We used these fittedequations (actual vs measured delta value and residualdelta error vs concentration) to correct the samplemeasurements made during the evaluation.
In order to estimate the isotope composition of theoverlying background air, we used a back trajectoryanalysis to identify the source area and climatic conditionsat 20m above the ocean from which the air masses enteringour site originated. STILT, the Stochastic Time-InvertedLagrangian Transport Model, uses an ensemble of backtrajectories to estimate the source area of the air massreaching the study site (Lin et al., 2003). Back trajectorieswere run for a 72-hour period based on Trenberth (1998).These trajectories are computed using wind fields from theEta Data Assimilation System (EDAS40) (Rogers et al.1996). We constructed an empirical d-excess condition
Copyright © 2013 John Wiley & Sons, Ltd.
over the source area using temperature and relativehumidity data from North American Regional Reanalysis(Mesinger et al., 2006) and the empirical model of Uemuraet al. (2008). The range of d-excess values sampled by theensemble of trajectories provides an estimate of uncertaintyin the model prediction.
Liquid water stable isotope analyses
We evaluated diurnal variation in leaf and stem water forthe tree species occurring at our site by collecting samplesthree times per day (morning, midday and afternoon),rapidly sealing them in water-tight vials and storing them ina cool, dark location until water could be extracted fromeach sample. We removed the water via cryogenic waterdistillation (Ehleringer et al., 2000) and then subsequentlyanalyzed each sample for its H and O isotope compositionusing an isotope ratio mass spectrometer (IRMS). Weavoided analyzing any of our plant water samples on theIRIS instrument because many plants are known to possesssecondary metabolites that, if distilled into the watersample, can cause spectral interferences that invalidate theisotope ratio data (see West et al., 2010 and 2011 for acomplete discussion). Soil and saprolite (see Salve et al.,2012 for description of subsurface materials) water sampleswere taken around midday along a transect that started nearthe stream and ended on the south facing slope. Sampleswere taken at eight locations on the north-facing slope andfour locations on the south-facing slope (Figure 3D). InMay, subsurface water was sampled at 2 and 10 cm depthsand then at one site a deeper core was drilled to 145 cm andsamples collected about every 15 cm. In August, sampleswere collected to a depth of 100 cm, at about 8–10 cmintervals. At one location, a deeper core was taken to110 cm and between 65 and 110 cm samples were collectedabout every 9 cm. As with the leaf samples, samples wereplaced in water-tight vials and stored in a cool, darklocation until water could be extracted from each samplevia cryogenic water distillation. All soil and saprolite watersamples were analyzed for their H and O isotopecomposition on the IRIS instrument. A subset of thesesamples was analyzed on the IRMS for δ18O to test for anyinterference from secondary compounds. Differences betweenthe IRIS and IRMS ranged from 0·1–0·4‰.Well water was sampled on the morning of 7 May and
25 August. Water samples were taken from well 1, 3 and 6(Figure 3D). Samples were kept in water-tight vials andstored in a cool, dark location until analysis.
RESULTS
In May (spring) and August (summer), the d-excess ofwater in the unsaturated zone (i.e. bulk subsurface water,representing a combination of loosely bound and mobile
Ecohydrol. 7, 936–949 (2014)

942 K. A. SIMONIN et al.
water pools extracted from the soil and saprolite – Seemethods section) was less than the d-excess of winterprecipitation and ground water. Overall, the isotopiccomposition of water in the unsaturated zone fell to theright of the local meteoric water line, with the greatestdifference between water in the unsaturated zone andprecipitation occurring in August (Figure 5 and 6). Thevertical structure in the d-excess of water in the unsaturatedzone provides strong evidence that the evaporation affectdetected in the isotope composition and d-excess is notlimited to near surface water but can also influence theisotope composition of water at depth; in this case, theuppermost 50 cm of the soil profile. The isotope compositionof water in the uppermost soil layers (averaged across0–5 cm) was strongly coupled to topographic position. InMay, the d-excess of the near surface soil water increasedfrom the north slope near the stream, to the south slope, tothe north slope near the ridge top (Figure 5A). Contrary toMay, in August, near surface soil water on the south slopeand the north slope near the ridge top showed the mostnegative d-excess values.The stable isotope composition of xylem water fell
within the range of δD and δ18O values for precipitation atour site (Figure 6A and B). However, the d-excess of tree
Figure 5. Variation in the d-excess of water in the unsaturated zone atdepth (cm) for (A) 6 May 2010 and (C) 24 August 2010. The averagey-intercept of the local meteoric water line + or � 1 SD is shown by thesolid and dotted lines. The d-excess of water at the soil surface as related toposition in the watershed for (B) 6 May 2010 and (D) 24 August 2010
(Means ± SE).
Figure 6. The δD and δ18O of precipitation, atmospheric water vapour,water in the unsaturated zone, tree xylem water, well water and modelledleaf water in equilibrium with atmospheric water vapour prior to dawn for6 May 2010 (A) and 24 August 2010 (B). The solid line represents thelocal meteoric water line and the dashed line is the leaf-water evaporationline. The figure inserts are a close-up of the covariation between the δDand δ18O of tree xylem water, water in the unsaturated zone and wellwater; the triangles represent the potential range of values that can occur
through mixing of well water and water in the unsaturated zone.
Copyright © 2013 John Wiley & Sons, Ltd.
xylem water was less than the d-excess of bothprecipitation and well water (Figure 7A and C) such thattree xylem water fell to the right of the local meteoric waterline (Figure 6). Additionally, in both May and August theisotope composition of tree xylem water was bounded bythe isotope composition of water in the unsaturated zone(which extends into the underlying saprolite), precipitationand well water (Figure 6 inserts), with the majority of thesamples falling along an evaporation line between deeperrock moisture (sensu Salve, et al., 2012) of the saproliteand the shallow evaporatively enriched soil moisture.Based on samples collected during this study, the observedpattern is consistent with isotope mass balance ifsubsurface water sources are the primary sources of plantwater (Dawson and Simonin, 2011), and all reservoirscontributing to a tree’s isotopic signature are accuratelymeasured during the study period. The data thereforesuggests that trees at our site rely upon a mixture ofsubsurface water sources. The d-excess of xylem watervaried between the angiosperm trees (A. menziesii, L.densiflorus, Q. agrifolia and U. californica) and the
Ecohydrol. 7, 936–949 (2014)
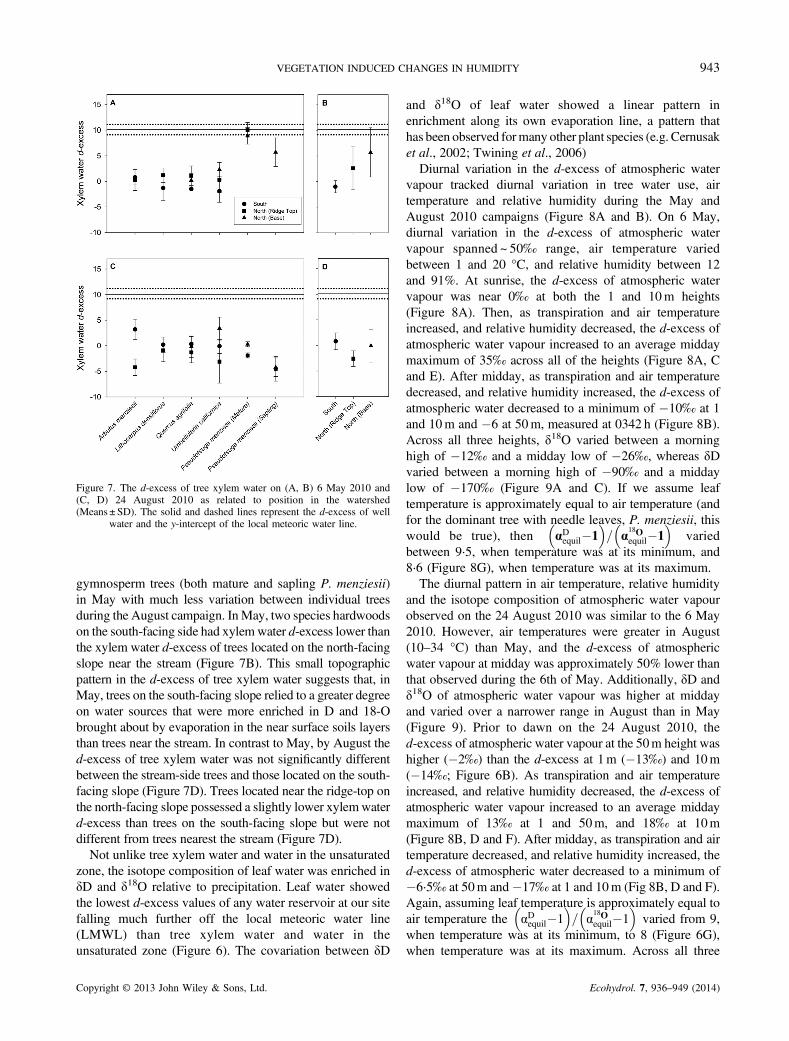
Figure 7. The d-excess of tree xylem water on (A, B) 6 May 2010 and(C, D) 24 August 2010 as related to position in the watershed(Means ± SD). The solid and dashed lines represent the d-excess of well
water and the y-intercept of the local meteoric water line.
943VEGETATION INDUCED CHANGES IN HUMIDITY
gymnosperm trees (both mature and sapling P. menziesii)in May with much less variation between individual treesduring the August campaign. InMay, two species hardwoodson the south-facing side had xylemwater d-excess lower thanthe xylem water d-excess of trees located on the north-facingslope near the stream (Figure 7B). This small topographicpattern in the d-excess of tree xylem water suggests that, inMay, trees on the south-facing slope relied to a greater degreeon water sources that were more enriched in D and 18-Obrought about by evaporation in the near surface soils layersthan trees near the stream. In contrast to May, by August thed-excess of tree xylem water was not significantly differentbetween the stream-side trees and those located on the south-facing slope (Figure 7D). Trees located near the ridge-top onthe north-facing slope possessed a slightly lower xylemwaterd-excess than trees on the south-facing slope but were notdifferent from trees nearest the stream (Figure 7D).
Not unlike tree xylem water and water in the unsaturatedzone, the isotope composition of leaf water was enriched inδD and δ18O relative to precipitation. Leaf water showedthe lowest d-excess values of any water reservoir at our sitefalling much further off the local meteoric water line(LMWL) than tree xylem water and water in theunsaturated zone (Figure 6). The covariation between δD
Copyright © 2013 John Wiley & Sons, Ltd.
and δ18O of leaf water showed a linear pattern inenrichment along its own evaporation line, a pattern thathas been observed formany other plant species (e.g. Cernusaket al., 2002; Twining et al., 2006)Diurnal variation in the d-excess of atmospheric water
vapour tracked diurnal variation in tree water use, airtemperature and relative humidity during the May andAugust 2010 campaigns (Figure 8A and B). On 6 May,diurnal variation in the d-excess of atmospheric watervapour spanned ~ 50‰ range, air temperature variedbetween 1 and 20 °C, and relative humidity between 12and 91%. At sunrise, the d-excess of atmospheric watervapour was near 0‰ at both the 1 and 10m heights(Figure 8A). Then, as transpiration and air temperatureincreased, and relative humidity decreased, the d-excess ofatmospheric water vapour increased to an average middaymaximum of 35‰ across all of the heights (Figure 8A, Cand E). After midday, as transpiration and air temperaturedecreased, and relative humidity increased, the d-excess ofatmospheric water decreased to a minimum of �10‰ at 1and 10m and �6 at 50m, measured at 0342 h (Figure 8B).Across all three heights, δ18O varied between a morninghigh of �12‰ and a midday low of �26‰, whereas δDvaried between a morning high of �90‰ and a middaylow of �170‰ (Figure 9A and C). If we assume leaftemperature is approximately equal to air temperature (andfor the dominant tree with needle leaves, P. menziesii, thiswould be true), then αDequil�1
� �= α18O
equil�1� �
variedbetween 9·5, when temperature was at its minimum, and8·6 (Figure 8G), when temperature was at its maximum.The diurnal pattern in air temperature, relative humidity
and the isotope composition of atmospheric water vapourobserved on the 24 August 2010 was similar to the 6 May2010. However, air temperatures were greater in August(10–34 °C) than May, and the d-excess of atmosphericwater vapour at midday was approximately 50% lower thanthat observed during the 6th of May. Additionally, δD andδ18O of atmospheric water vapour was higher at middayand varied over a narrower range in August than in May(Figure 9). Prior to dawn on the 24 August 2010, thed-excess of atmospheric water vapour at the 50m height washigher (�2‰) than the d-excess at 1m (�13‰) and 10m(�14‰; Figure 6B). As transpiration and air temperatureincreased, and relative humidity decreased, the d-excess ofatmospheric water vapour increased to an average middaymaximum of 13‰ at 1 and 50m, and 18‰ at 10m(Figure 8B, D and F). After midday, as transpiration and airtemperature decreased, and relative humidity increased, thed-excess of atmospheric water decreased to a minimum of�6·5‰ at 50m and�17‰ at 1 and 10m (Fig 8B, D and F).Again, assuming leaf temperature is approximately equal toair temperature the αDequil�1
� �= α
18Oequil�1
� �varied from 9,
when temperature was at its minimum, to 8 (Figure 6G),when temperature was at its maximum. Across all three
Ecohydrol. 7, 936–949 (2014)

Figure 8. Diurnal variation in tree water use (Means ± SD), the d-excess of atmospheric humidity, air temperature, relative humidity (%) and theequilibrium fractionation factor (αequil �1) expressed as the ratio of D to 18O measured at 1, 10, and 50m above the soil surface (white, dark grey andblack circles) on the 6–7 May 2010 (A, C, E and G) and the 24–25 August 2010 (B, D, F and H). The dark grey bars in A and B represent time when
water vapour standards were sent to the isotope ratio infrared spectroscopy.
Figure 9. Diurnal variation in the δD and δ18O of forest humidity measured at 1, 10 and 50m above the soil surface (white, dark grey and black circles)on the 6–7 May 2010 (A, C) and the 24–25 August 2010 (B, D). The dark grey represent time when water vapour standards were sent to the isotope ratio
infrared spectroscopy.
944 K. A. SIMONIN et al.
heights, δ18O varied between a morning high of �12‰and a midday low of �19‰, whereas δD varied betweena morning high of �118‰ and a midday low of �140‰(Figure 9A and C).
Copyright © 2013 John Wiley & Sons, Ltd.
The empirical model of Uemura et al. (2008) incombination with STILT showed large differences in thed-excess of ocean derived water vapour. The calculatedd-excess of the background, ocean derived, near surface
Ecohydrol. 7, 936–949 (2014)

945VEGETATION INDUCED CHANGES IN HUMIDITY
water vapour differed between May (spring) and August(summer) campaigns and was different than the averaged-excess observed for precipitation annually. On the 6–7May, the average relative humidity at 20m above theocean surface was 74·6%± 4·6 with an average d-excessof 7·8‰ ± 3·9. During the spring campaign, the modelpredicted d-excess of the near surface, ocean derived,water vapour was lower than the d-excess of precipitationaveraged over 2008–2010 (11·3‰± 3·6). On average, thebulk of precipitation at our site occurs between October andMarch with relatively infrequent, minor, rain eventsoccurring in April and May. In 2010, there were a fewsmall rain events in May (105·6mm total) with anaverage d-excess of 7·6‰± 2·4. On the 24–25 August theaverage relative humidity at 20m above the ocean surface wasgreater than May at 90·9%±0·62 with an average d-excess of�0·59‰±2·5. During the summer campaign, the modelpredicted d-excess of the near surface, ocean derived andwatervapour was lower than the spring campaign and much lowerthan the annual average d-excess of precipitation(�0·59‰±2·5; 7·8‰±3·9 and 11·3‰±3·6, respectively).
DISCUSSION
In coastal areas dominated by ocean-to-continental air masstrajectories, it is often assumed that during non-rainyperiods the d-excess of atmospheric water vapour will bevery close or equal to the average d-excess of ocean bornstorms unless: (1) there are drastic changes in ocean surfaceconditions between rainy and non-rainy periods, that is,temperature and relative humidity, as shown in Figure 1 or (2)there is a significant contribution of evapotranspiration to theisotope composition of atmospheric humidity (Gat, 2000;Lai and Ehleringer, 2011; Welp et al., 2012). For the presentinvestigation, we propose that unraveling the underlyingreasons for the isotope patterns we observed requires thatboth mechanisms be evaluated as potential explanations forthis mixed evergreen forest in the north coast of California.
In order to understand the relative influence ofevapotranspiration on the isotope composition of nearsurface humidity, it is necessary to identify all the potentialsources of moisture to the atmosphere. To accomplish this,we first used back trajectory analysis (i.e. STILT seemethods) and the empirical model of Uemura et al. (2008)to estimate the d-excess of the background atmosphericwater vapour (i.e. ocean derived vapour) into whichterrestrial evapotranspiration mixes. The lower d-excessvalues of the background, ocean derived, near surfacewater vapour during the 24–25 August relative to the 6–7May were associated with an increase in relative humidityabove the ocean from 74·6% ± 4·6 on 6–7 May to90·9%± 0·62 on 24–25 August. The strong seasonalchange in the d-excess of atmospheric water vapour
Copyright © 2013 John Wiley & Sons, Ltd.
between the spring and summer sample periods suggeststhat in environments with distinct rainy and non-rainyseasons it cannot be assumed that the d-excess of watervapour is equal to the d-excess of precipitation especiallyduring non-rainy periods. Additionally, the d-excess ofatmospheric water vapour measured within and below theforest canopy was different from model predicted valuesfor the near surface, ocean-derived water vapour. We,therefore, interpret the observed differences between thed-excess of water vapour within and below the forestcanopy and the d-excess of ocean derived water vapour asproviding strong evidence for non-isotopic steady statetranspiration during the day, and equilibrium isotopeeffects between leaf water and ambient humidity at night, asthe mechanisms driving variation in the isotope compositionof near surface humidity at our site.During spring and summer campaign, the d-excess
showed a distinct diurnal pattern, increasing from pre-dawnto midday. In the early morning hours, as near surfacetemperatures increase due to an increase in incoming solarradiation, buoyant convection in combinationwithmechanicalturbulence will result in a mixing of the backgroundatmosphere into the forest canopy air (i.e. entrainment).This early morning mixing, that occurs as both transpirationand evaporation are at a minimum, is expected to cause ashift in the isotope composition of forest water vapourtowards the isotope composition of the background watervapour. As predicted, the rapid increase in the d-excess ofwater vapour within and below the forest canopy towards themodel predicted d-excess of the overlying air providesstrong evidence for entrainment as one of the mechanism forchanges in the d-excess of forest water vapour during theseearly morning hours. As the day progresses from latemorning to midday, the d-excess of atmospheric watervapour within and below the forest canopy continued toincrease as forest evapotranspiration increased. Accordingto isotope mass balance, this further increase in the d-excessof water vapour cannot be explained by entrainment becausethe d-excess of forest water vapour exceeds the d-excess ofthe background, overlying ocean-derived air. Because forestwater vapour is ultimately a mixture of water evaporatedfrom both ocean and terrestrial water sources any increasesabove the d-excess of ocean derived water vapour must beassociated with a greater contribution of terrestrial watersources, in this case transpiration and soil evaporation.Previous research aimed at describing the influence of
terrestrial evaporation on the isotope hydrologic cyclegenerally start with the assumption that transpiration,unlike soil evaporation and surface evaporation from openbodies of water, occurs at isotopic steady state (e.g.Williamset al. 2004; Jasechko et al. 2013). At isotopic steady state,the isotope composition of transpiration is equal to theisotope composition of xylem water (Gat, 1996; Gat, 2000).However, recent lab-based and field-based evaluations of
Ecohydrol. 7, 936–949 (2014)

946 K. A. SIMONIN et al.
the isotope composition of transpiration at the leaf levelsuggest that under naturally occurring conditions the rate ofchange in abiotic and biotic fractionation events that occurduring transpiration (e.g. Equation 2) are likely greater thenleaf water residence times and thus preclude isotopic steadystate transpiration (Wang and Yakir, 1995; Harwood et al.,1998, 1999; Simonin et al., 2013). Our observations of treewater use (as measured by sapflow) and the isotopecomposition of both near surface ocean derived watervapour and humidity within the forest canopy providefurther evidence that transpiration is generally not at isotopicsteady state. If transpiration did occur at isotopic steadystate, then the d-excess of atmospheric water vapour shouldmove in the direction of the d-excess of tree xylem water asthe relative contribution of transpiration to atmospherichumidity increases from early morning to midday.Because the d-excess of tree xylem water at our site was
less than the average d-excess of precipitation (i.e. fell tothe right of the LMWL; Figure 6), isotopic steady statetranspiration should result in a negative relationshipbetween solar radiation, atmospheric demand and the d-excessof atmospheric water vapour over a diurnal cycle, such thatduring the day atmospheric water vapour would lie to the rightof the LMWL. In other words, isotopic steady statetranspiration would have a negative forcing on the d-excessof near surface humidity with the d-excess of forest watervapour at its minimum when transpiration is at its maximum.Clearly, this pattern of variation in the d-excess of atmosphericwater vapour was not observed at our site (Figure 8). Instead,we found that the d-excess of atmosphericwater vapour duringthe day was greater than the average d-excess of precipitation,with the maximum d-excess of atmospheric water vapouroccurring when transpiration was at its maximum, and theminimum d-excess occurring when transpiration was at itsminimum (Figure 8). The observed correlation between thed-excess of near surface humidity and tree water use suggestthat day-time transpiration is rarely at isotopic steady state atthe ecosystem scale, when measured at high-temporalfrequencies. Previous research evaluating changes in theisotope composition of forest water vapour integrated overlonger time scales (e.g. 15–20min) also suggests foresttranspiration is generally not occurring at isotopic steadystate (Lai et al., 2006; Lai and Ehleringer, 2011). That said,when integrated over even longer periods, the isotopecomposition of water leaving the forest canopy should equalthe isotope composition of water taken up by roots. Thequestion that remains to be adequately answered is whatthat time-frame is. Our data do not allow us to answerthis question.If transpiration does not occur at isotopic steady state
then the d-excess of transpiration should be negativelyrelated to relative humidity as predicted by Equation (2)(Figure 2B). For both May and August campaigns, thed-excess of atmospheric water vapour was positively
Copyright © 2013 John Wiley & Sons, Ltd.
correlated with variation in air temperature and negativelycorrelated with variation in relative humidity (Figure 8); apattern observed previously in other terrestrial ecosystems(Welp et al., 2012). According to the Craig and Gordonmodel for evaporation (2) increasing temperature shouldincrease the d-excess of the evaporative flux because of adecrease in αDequil�1
� �= a
18Oequil�1
� �. However, variation in
temperature is expected to have a relatively minor effect onthe d-excess of the evaporation flux when compared withrelative humidity (e.g. Figure 2A and B). Instead, the largediurnal variation in d-excess was likely more closelyassociated with changes in relative humidity than temperature.Despite a similar range of magnitude in transpiration and
relative humidity, the d-excess of forest water vapour washigher in May than August. This was likely a result of twodifferent factors. Firstly, absolute humidity was lower inMay than August as shown by the lower air temperature for agiven relative humidity, resulting in a higher mixing ratio oftranspiration with background air. Secondly, the d-excess ofthe background ocean derived water vapour was lower inAugust than May. It’s also important to note thattranspiration is not the only terrestrial source of watervapour at our site. As such, an alternative hypothesis for thepositive relationship between d-excess, air temperature andrelative humidity could be that soil evaporation contributesmore to forest evapotranspiration than tree transpiration.However, because of the large amount of leaf area and thenorth-facing aspect, we do not believe this is a likelyscenario at our site. A large amount of leaf area and a north-facing aspect will greatly reduce the amount of solarradiation reaching the soil surface resulting in a decrease inpotential evaporation from soils.In addition to the daytime processes discussed
previously, we propose that the nighttime variation inthe isotope composition of atmospheric humidity waslargely a function of equilibrium isotope interactionsbetween the forest canopy and the atmosphere thatdominate during periods of high-relative humidity whenthere is little to no transpiration. When considering thenighttime contribution of plants to atmospheric humidity,it is important to note that mass flux and isoflux are notthe same. At night when the atmosphere stabilizes, ifthe average canopy leaf temperature approaches Tdew, thevapour pressure difference between the leaf and theatmosphere (i.e. the driving force for transpiration)approaches zero resulting in no net loss of water vapourfrom the canopy. However, differences between theisotope compositions of water vapour inside the leafand the atmospheric vapour may still exist, which wouldresult in equilibrium isotope exchange between leaf waterand atmospheric humidity, if nighttime stomatal conduc-tance is >0. In other words, there can be a net flow ofdifferent water isotopologues even if there is no measureable(net)flowof total watermolecules from canopy to atmosphere.
Ecohydrol. 7, 936–949 (2014)

947VEGETATION INDUCED CHANGES IN HUMIDITY
If nighttime equilibration between forest canopy leafwater and atmospheric humidity is occurring, then we canpredict the isotope composition of leaf water using theequilibrium fractionation factor and the measured isotopiccomposition of vapour. On 6 May and 24 August, thenighttime air temperatures approached Tdew, a requirementfor equilibration between the canopy leaf water and theatmosphere. Assuming the average canopy leaf temperature isalso near Tdew prior to dawn then, we can model the isotopecomposition of leaf water from the isotope composition ofatmospheric humidity (i.e. RV) as αequil =Rleaf/RV. Ifnighttime stomatal conductance and the duration ofequilibrium isotope exchange results in the completeturnover of leaf water (Kim and Lee, 2011; Lai andEhleringer, 2011) then the predicted Rleaf should lie on theleaf water enrichment line as the minimum leaf waterenrichment achieved over a 24-hour period (Landais et al.,2006). As shown in Figure 6A and B, the αequil-predictedleaf water lies very close to the leaf water enrichment line.Therefore, the αequil-predicted leaf water provides strongevidence that the changes in the δ18O, δD and the d-excess ofatmospheric water vapour that occur as the atmospherestabilizes and subsides are the result of nighttime equilibrationbetween leaves and atmosphere. Previous research usingartificially induced conditions has provided strong evidencefor nighttime equilibration between leaf water and watervapour (Kim and Lee, 2011). Here, we show under naturallyoccurring conditions that nighttime equilibration between leafwater and atmospheric water vapour can occur at the canopyand perhaps even the ecosystem scale. These observednighttime effects of forest canopies on the isotope composi-tion of atmospheric water vapour, when relative humiditiesapproach 100%, will directly influence the water isotopecomposition of dew and/or radiation fog and by extension theisotope composition of near surface soil water. For example,on the north-facing slope close to the stream the near surfacesoil water, in May, was as isotopically enriched in δ18O andδD as surface soils on the south-facing slope (Figure 7).Because south-facing slopes in the northern hemispherereceive more energy to drive soil evaporation than north-facing slopes do, isotope theory predicts that all else beingequal the surface soil water on the south slope should bemore isotopically enriched in 18O and D than surface soils onthe north-facing slope, in response to greater soil evaporation.However, if nighttime stomatal conductance is >0 and leaftemperature approaches dew point temperature, then thedaytime evaporatively enriched leaf water signal couldenter the surface soil water reservoir as dew drip from leafsurfaces during the process of equilibrium isotopeexchange as leaf water turns over. Air temperatures onthe north-facing slope near the stream reached dew pointtemperature on a regular basis during the early spring,whereas other areas in the watershed remained above dewpoint (Figure 4). Thus, we propose that the enrichment of
Copyright © 2013 John Wiley & Sons, Ltd.
18O, D and the d-excess of surface soil water near thestream was the result of dew formation that occurred as leafwater and atmospheric water vapour were equilibrating.Because nighttime stomatal conductance is relativelycommon among woody plants (Dawson et al., 2007),nighttime equilibration between leaf water and atmosphericwater vapour may be a common phenomenon across woodyecosystems. Nighttime equilibration followed by theformation of dew and/or radiation fog may represent anotherpathway by which water is redistributed in any ecosystemother than just via root systems (e.g. hydraulic redistribution;see Prieto et al., 2012 and Neumann and Cardon, 2012 forrecent reviews).
CONCLUSION
Stable isotopes have proven to be a powerful tool formonitoring changes in terrestrial water cycling acrosslarge spatial and temporal scales. Here, we highlight theutility of the d-excess parameter for characterizing theinfluence of forest canopies on the isotope composition ofnear surface water vapour. Our data provides strongevidence that during the day forest canopies significantlyalter the isotope composition of atmospheric humidity vianon-steady state isotope effects (i.e. isotopic non-steadystate transpiration). Additionally, our data provides strongevidence that nighttime variation in the isotope compositionof atmospheric humidity is strongly influenced by equilibri-um isotope interactions between the forest canopy and theatmosphere that occur during periods of high relativehumidity when there is little to no transpiration. Theseobserved daytime and nighttime effects of forest canopies onthe isotopic composition of atmospheric water vapour mayhave profound effects on the isotope composition of futurecondensation events.
ACKNOWLEDGEMENTS
Thisworkwas supported by a grant from theKeck Foundation(HydroWatch), the National Centre for Earth-SurfaceDynamics and the UC Berkeley Centre for Stable IsotopeBiogeochemistry. The topographicmapwas derived from dataprovided to Mary Power (University of California, Berkeley)by the National Centre for Airborne Laser Mapping. DaniellaRempe was supported in part by the Department of EnergyOffice of Science Graduate Fellowship Program (DOESCGF), made possible in part by the American Recoveryand Reinvestment Act of 2009 administered by ORISE-ORAU under contract DE-AC05-06OR23100. Jasper Oshunwas supported by National Science Foundation CMGCollaborative Research project. Much of the monitoringinfrastructure was installed by Rohit Salve.
Ecohydrol. 7, 936–949 (2014)

948 K. A. SIMONIN et al.
REFERENCES
Araguas-Araguas L, Froehlich K, Rozanski K. 2000. Deuterium andoxygen-18 isotope composition of precipitation and atmosphericmoisture. Hydrological Processes 14: 1341–1355.
Bates BC, Kundzewicz ZW, Wu S, Palutikof JP. 2008. Climate Changeand Water. Technical Paper of the Intergovernmental Panel on ClimateChange, IPCC Secretariat, Geneva; 210.
Bonan GB. 2008. Forests and climate change: forcings, feedbacks, and theclimate benefits of forests. Science 320: 1444–1449.
Bony S, Risi C, Vimeux F. 2008. Influence of convective processes on theisotopic composition (δ18O and δD) of precipitation and water vapour inthe tropics: 1. Radiative-convective equilibrium and tropical ocean-global atmosphere-coupled ocean–atmosphere response experiment(TOGA-COARE) simulations. Journal of Geophysical Research 113:D19305, doi:10.1029/2008JD009942.
Bowen GJ. 2011. A faster water cycle. Science 332: 430–431.Burgess SSO, Adams MA, Turner NC, Beverly CR, Ong CK, Khan AAH,Bleby TM. 2001. An improved heat pulse method to measure low andreverse rates of sap flow in woody plants. Tree Physiology 21: 589–598.
Cappa CD, Hendricks MB, DePaolo DJ, Cohen RC. 2003. Isotopicfractionation of water during evaporation. Journal of GeophysicalResearch 108, doi:10.1029/2003JD003597.
Cernusak LA, Pate JS, Farquhar GD. 2002. Diurnal variation in the stableisotope composition of water and dry matter in fruiting Lupinusangustifolius under field conditions. Plant, Cell and Environment 25,893–907.
CraigH. 1961. Isotopic variations inmeteoricwaters. Science 133: 1702–1703.Craig H, Gordon LI. 1965. Proceedings of a conference on stable isotopesin oceanographic studies and paleotemperatures; 9–130.
Criss RE. 1999. Principles of stable isotope distribution. OxfordUniversity Press: New York.
Dansgaard W. 1964. Stable isotopes in precipitation. Tellus 16: 436–468.Dawson TE, Burgess SSO, Tu KP, Oliveira RS, Santiago LS, Fisher JB,Simonin KA, Ambrose AR. 2007. Nighttime transpiration in woodyplants from contrasting ecosystems. Tree Physiology 27: 561–575.
Dawson TE, Simonin KA. 2011. The roles of stable isotopes in foresthydrology and biogeochemistry. In:Forest hydrology and biogeochemistry:synthesis of past research and future directions Eds. Levia DF, Carlyle-Moses D, Tanaka T; 137–161.
Dongmann G, Nurnberg HW, Förstel H, Wagener K. 1974. On theenrichment of H2
18O in the leaves of transpiring plants. Radiation andEnvironmental Biophysics 11: 41–52.
Ehleringer JR, Roden J, Dawson TE. 2000. Assessing ecosystem-levelwater relations through stable isotope ratio analyses, methods inecosystem science, edited by: Sala OE, Jackson RB, Mooney HA,Howarth, RW; 181–398.
Farquhar GD, Cernusak LA. 2005. On the isotopic composition of leafwater in the non-steady state. Functional Plant Biology 32: 293–303.
Fisher JB, Baldocchi DD, Misson L, Dawson TE, Goldstein AH. 2007.What the towers don’t see at night: nocturnal sap flow in treesand shrubs at two AmeriFlux sites in California. Tree Physiology 27:597–610.
Flanagan LB, Comstock JP, Ehleringer JR. 1991. Plant Physiology 96:588–596.
Gat JR. 1996. Oxygen and hydrogen isotopes in the hydrologic cycle.Annual Review of Earth and Planetary Sciences 24: 225–262.
Gat JR. 2000. Atmospheric water balance - the isotopic perspective.Hydrological Processes 14: 1357–1369.
Gerten D et al. 2005. Contemporary “green” water flows: simulations witha dynamic global vegetation and water balance model. Physics andChemistry on Earth 30: 334–338.
Harwood KG, Gillon JS, Griffiths H, Broadmeadow MSJ. 1998. Diurnalvariation of Δ13CO2, ΔC
18O16O and evaporative site enrichment ofδH2
18O in Piper aduncum under field conditions in Trinidad. Plant, Celland Environment 21: 269–283.
Harwood KG, Gillon JS, Roberts A, Griffiths H. 1999. Determinants ofisotopic coupling of CO2 and water vapour within a Quercus petraeaforest canopy. Oecologia 119: 109–119
Huntington TG. 2006. Evidence for intensification of the global watercycle: review and synthesis. Journal of Hydrology 319: 83–95.
Copyright © 2013 John Wiley & Sons, Ltd.
Ingraham NL, Taylor BE. 1991 Light stable isotope systematics of large-scale hydrologic regimes in California and Nevada. Water ResourcesResearch 27: 77–90.
Jasechko S, Sharp ZD, Gibson JJ, Birks SJ, Yi Y, Fawcett PJ.2013. Terrestrial water fluxes dominated by transpiration. Nature 496:347–351.
Kim K, Lee X. 2011. Transition of stable isotope ratios of leaf water undersimulated dew formation. Plant, Cell and Environment 34: 1790–1801.
Lai C-T, Ehleringer JR. 2011. Deuterium excess reveals diurnal sources ofwater vapor in forest air. Oecologia 165: 213–223.
Lai C-T, Ehleringer JR, Bond BJ, Paw U, KT. 2006. Contributions ofevaporation, isotopic non-steady state transpiration and atmosphericmixing on the δ18O of water vapour in Pacific Northwest coniferousforests. Plant, Cell and Environment 29: 77–94.
Landais A, Barkan E, Yakir D, Luz B. 2006. The triple isotopiccomposition of oxygen in leaf water. Geochimica et CosmochimicaActa 70: 4105–4115.
Lawrence DM, Thornton PE, Oleson KW, Bownan GB. 2007. Partitioningof evaporation into transpiration, soil evaporation, and canopyevaporation in a GCM: impacts on land-atmosphere interactions.Journal of Hydrometeorology 8: 862–880.
Lin JC, Gerbig C, Wofsy SC, Andrews AE, Daube BC, Davis KJ,Grainger CA. 2003. A near-field tool for simulating the upstreaminfluence of atmospheric observations: The Stochastic Time-InvertedLagrangian Transport (STILT) model. Journal of Geophysical Research108(D16): 4493, doi:10.1029/2002JD003161.
Luz B, Barkan E, Yam R, Shemesh A. 2009. Fractionation of oxygen andhydrogen isotopes in evaporating water. Geochemica et CosmochimicaActa 73: 6697–6703.
Majoube MJ. 1971. Fractionnement en oxygen-18 et en deuterium entrel’eau et sa vapeur. Journal de Chimie et Physique 58: 1423–1436.
Merlivat L 1978. Journal of Chemical Physics 69: 2864–2871.Merlivat L, Jouzel J. 1979. Global climatic interpretation of the deuterium-oxygen 18 relationship for precipitation. Journal of GeophysicalResearch 84: 5029–5033.
Mesinger F, DiMego G, Kalanay E, Mitchell K, Shafran PC, Ebisuzaki W,Jovíc D, Woollen J, Rogers E, Berbery EH, Ek MB, Fan Y, GrumbineR, Higgins W, Li H, Lin Y, Manikin G, Parrish D, Shi W. 2006. NorthAmerican regional reanalysis. Bulletin of the American MeteorologicalSociety 87: 343–360.
Neumann RB, Cardon ZG. 2012. The magnitude of hydraulic redistributionby plant roots: a review and sysnthesis of empirical andmodeling studies.New Phytologist 194: 337–352.
Noone D, Simmonds I. 2002. Associations between δ18O of water andclimate parameters in a simulation of atmospheric circulation for 1979–95.Journal of Climate 15: 3150–3169.
Prieto U, Armas C, Pugnaire FI. 2012. Water release through plant rots:new insights into its consequences at the plant and ecosystem level.New Phytologist 193: 830–841.
Risi C, Bony S, Vimeux F, Jouzel J. 2010. Water-stable isotopes in theLMDZ4 general circulation model: Model evaluation for present-dayand past climates and applications to climatic interpretations of tropicalisotopic records. Journal of Geophysical Research 115, D12118,doi:10.1029/2009JD013255.
Roderick ML, Farquhar GD. 2002. The cause of decreased panevaporation over the past 50 years Science 298: 1410–1411.
Rogers E, Black TL, Deaven GD, DiMego GJ, Zhao Q, Baldwin M,Junker NW, Lin Y. 1996. Changes to the Operational “Early” EtaAnalysis/Forecast System at the National Centers for EnvironmentalPrediction. Weather Forecasting 11: 391–413.
Salati E, Dall’Olio A, Gat JR, Matsui E. 1979. Recycling of water inthe Amazon basin: an isotopic study. Water Resources Research 15:1250–1258.
Salve R, Rempe DM, Dietrich WE. 2012. Rain, rock moisture dynamics,and the rapid response of perched groundwater in weathered, fracturedargillite underlying a steep hillslope. Water Resources Research48: W11528. DOI:10.1029/2012WR012583.
Schmidt G, Hofmann G, Shindell D, Hu Y. 2005. Modelling atmosphericstable water isotopes and the potential for constraining cloud processesand stratosphere-troposphere water exchange. Journal of GeophysicalResearch 110, D21314, doi:10.1029/2005JD005790.
Ecohydrol. 7, 936–949 (2014)

949VEGETATION INDUCED CHANGES IN HUMIDITY
Simonin KA, Roddy AB, Link P, Apodaca R, Tu KP, Hu J, Dawson TE,Barbour MM. 2013. The isotopic composition of transpiration and ratesof change in leaf water isotopologue storage in response to environmentalvariables. Plant, Cell and Environment doi:10.1111/pce.12129.
Trenberth, KE. 1998. Atmospheric moisture residence times and cycling:implications for rainfall rates and climate change. Climatic Change 39:667–694.
Trenberth KE, Smith L, Qian T, Dai A, Fasullo J. 2007. Estimates of theglobal water budget and its annual cycle using observational and modeldata. Journal of Hydrometeorology 8: 758–769.
Twining J, Stone D, Tadros C, Henderson-Sellers A, Williams A. 2006.Moisture isotopes in the biosphere and atmosphere (MIBA) inAustralia: A priori estimates and preliminary observations of stablewater isotopes in soil, plant and vapour for the Tumbarumba fieldcampaign. Global and Planetary Change 51: 59–72.
Uemura R, Matsui Y, Yoshimura K, Motoyama H, Yoshida N. 2008. Evidenceof deuterium excess inwater vapor as an indicator of ocean surface conditions.Journal of Geophysical Research 113, doi:10.1029/2008JD010209.
Copyright © 2013 John Wiley & Sons, Ltd.
WangX-F, Yakir D. 1995. Temporal and spatial variations in the oxygen-18content of leaf water in different plant species. Plant, Cell andEnvironment 18: 1377 – 1385.
Welp LR, Lee X, Griffis TJ, Wen X-F, Xiao W, Li S, Sun X, Hu Z, MartinMV, Huang J. 2012. A meta-analysis of water vapor deuterium-excessin the midlatitude atmospheric surface layer. Global BiogeochemicalCycles 26: GB3021, doi:10.1029/2011GB004246.
West AG, Goldsmith GR, Brooks PD, Dawson TE. 2010. Discrep-ancies between isotope ratio infrared spectroscopy and isotoperatio mass spectrometry for the stale isotope analysis of plant andsoil waters. Rapid Communication in Mass Spectrometry24: 1948–1954.
Williams D, et al. 2004. Evapotranspiration components determined bystable isotope, sap flow, and eddy covariance techniques. Agriculturaland Forest Meteorology 125: 241–258.
Worden J, Noone D, Bowman K. 2007. Importance of rain evaporationand continental convection in the tropical water cycle. Nature445: 528–532.
Ecohydrol. 7, 936–949 (2014)