vasyr 2020 vulnerability assessment of syrian refugees in
TRANSCRIPT

1
VASyR 2020 Vulnerability Assessment of Syrian Refugees in Lebanon

2
VASyR 2020 Vulnerability Assessment of Syrian Refugees in Lebanon

3
ACKNOWLEDGEMENTS The Vulnerability Assessment for Syrian Refugees in Lebanon (VASyR 2020) was conducted jointly by the United Nations Children’s Fund (UNICEF), the United Nations High Commissioner for Refugees (UNHCR) and the United Nations World Food Programme (WFP). The VASyR could not have been achieved without the full commitment and support of national and international staff from each of these agencies.
The VASyR team in Lebanon included: WFP (Catherine Said, Dina Saleem, Maroun Dagher and Simon Renk), UNHCR (Hiba Taha, Karel Chromy, Milos Terzan and Ruba Cheaib) and UNICEF (Jamil El Khoury). Specific acknowledgement goes to the Inter-Agency unit (Dina El Khoury, Jad Ghosn, Raffi Kouzoudjian, Rosa Vidarte and Tamara Stupalova) and the agency heads of unit for their continued support.
The team would also like to express its gratitude to the international non-governmental organizations (NGOs) responsible for the field data collection: Caritas, Makhzoumi Foundation, SHIELD (Social, Humanitarian, Economical Intervention for Local Development) and World Vision International. It also wishes to acknowledge the assistance of Humanity and Inclusion (HI), the Lebanese Red Cross (LRC) and UNWomen. HI supported the team in integrating the Washing Group Questions on Disabilities within the VASyR survey, conducting the training of enumerators for this set of questions, and providing guidance on analysis and results interpretation. LRC provided a mandatory training session on COVID-19 for all enumerators involved in the data collection. UNWomen (Carly Fuglei, Claire Wilson) upheld the team in conducting gender specific analysis and result write-up.
Special thanks go to the refugee households who welcomed the survey team and responded to the questions with valuable information for this assessment.
Cover photo credit:© UNDP
• UNICEF is a leading humanitarian and development agency working globally for the rights of every child.
• UNHCR, the UN Refugee Agency, is a global organization dedicated to saving lives, protecting rights and building a better future for refugees, forcibly displaced communities and stateless people.
• WFP is the world’s largest humanitarian agency fighting hunger worldwide.

4
In our effort to make the VASyR more accessible, a website was launched in 2019. It includes a wide range of resources such as hundreds of data tabulations not published in this report, additional tools to support humanitarian actors to develop similar assessements and more.
VASyR microdata is published on the UNHCR microdata library.
http://ialebanon.unhcr.org/vasyr
THE VASYR HUB
http://microdata.unhcr.org/

5
List of Tables
List of Annexes
Acronyms
Executive Summary
Introduction
Methodology
Demographics
Protection
Shelter
Water, Sanitation and Hygiene (WASH)
Education
Health
Food Consumption
Economic Vulnerability
Livelihoods and Income
Coping Strategies
Food Security
Energy
Gender Analysis
6
7
8
9
16
20
24
30
41
50
55
61
71
80
92
102
112
120
127
CONTENTS

6
Table 1. Partners that conducted data collectionTable 2. Shelter condition classification methodologyTable 3: HWDD and HDADD groups and mean in 2018 and 2019Table 4. SMEB and MEB values per household (in LBP)-2020Table 5. Economic vulnerability groups by sectors indicatorsTable 6. Food security by sectors indicatorsTable 7. Combination of components for the food security classification.Table 8. Electricity grid connection - frequency of paymentTable 9. Energy sources for cookingTable 10. Energy sources for heating
LIST OF TABLES

7
Annex 1. Gender and share of household membersAnnex 2. Legal residency and birth registrationAnnex 3. Type of housing and type of occupancyAnnex 4. Type of rental agreement, rental costs, overcrowding and shelter conditionsAnnex 6: Food consumptionAnnex 7: (S)MEB breakdown, poverty line and debtAnnex 8: Debt per household and per capita, and households borrowing moneyAnnex 9: Monthly expenditure per capita, food expenditure share and expenditure share (monthly average)Annex 10: Working household members, per capita income, and cash and income sourcesAnnex 11: Cash and income sources – continuedAnnex 12: Employment and unemploymentAnnex 13: Sectors of workAnnex 14: Food related coping strategies in the last 7 daysAnnex 15: Average number of days food related coping strategies were appliedAnnex 16: Livelihood-related coping strategies in the last 30 daysAnnex 17: Summary of asset depletion coping strategiesAnnex 18-19: Food security classification
LIST OF ANNEXES

8
FAOFCSGoLGSO
HDADDHH
HWDDILO
IYCFITS
LCRPMEB
MoEWMoPH
NGOODKPHCRAISrCSI
SMEBUN
UNHCRUNICEFVASyR
Vit AWASH
WFPWHO
Food and Agriculture Organization of the United NationsFood Consumption ScoreGovernment of LebanonGeneral Security OfficeHousehold Daily Average Diet DiversityHouseholdHousehold Weekly Diet DiversityInternational Labour OrganizationInfant and Young Child FeedingInformal Tented SettlementsLebanon Crisis Response PlanMinimum Expenditure BasketMinistry of Energy and WaterMinistry of Public HealthNon-Governmental OrganizationOpen Data KitPrimary Health CareRefugee Assistance Information Systemreduced Coping Strategy IndexSurvival Minimum Expenditure BasketUnited NationsUnited Nations High Commissioner for RefugeesUnited Nations Children’s FundVulnerability Assessment of Syrian RefugeesVitamin AWater, Sanitation and HygieneWorld Food ProgrammeWorld Health Organization
ACRONYMS

109
EXECUTIVESUMMARY
The Vulnerability Assessment of Syrian Refugees in Lebanon (VASyR) analyses a representative sample of Syrian refugee families in Lebanon to provide a multi-sectoral update of the situation of this population. Conducted annually, 2020 marks the eighth year of this assessment. The contents of this report, jointly issued by the United Nations High Commissioner for Refugees (UNHCR), the United Nations Children’s Fund (UNICEF) and the World Food Programme (WFP), show that the economic downturn, steep inflation, COVID-19 and finally the Beirut blast have pushed vulnerable communities in Lebanon - including Syrian refugees - to the brink, with thousands of families sinking further into poverty and vulnerability.One of the most concerning indicators of the impact of the compounded crises Syrian refugees have been facing in Lebanon is the sharp increase in the share of households living under the extreme poverty line, reaching a staggering 89 percent in 2020, up from 55 percent only a year before. They now live on less than LBP 308,728 per person per month – this is less than half the minimum wage in Lebanon.
Between the 19th of August and the 17th of September, survey teams visited 4,563 randomly selected Syrian refugee households, covering all districts across Lebanon. The household questionnaire was designed based on the questionnaire of the previous year to ensure comparability and was carried out through face-to-face interviews at refugees’ homes. The analysis plan was developed by following the sectors’ guidance and global indicators.
METHODOLOGY
© UNHCR/Diego Ibarra Sánchez

11
KEY FINDINGSCivil and legal documentation remains a challengeLack of legal residency remains a key protection issue affecting the lives of refugees and their ability to access services, hindering their movement and exposing them to exploitation and possible arrest and prosecution. The rate of legal residency among the Syrian refugee population in Lebanon has continued to decline in 2020. Only 20% of individuals (above 15 years old) reported having legal residency, compared to 22% in 2019 and 27% in 2018. Rates among youth and women remained lower than middle-aged, men counterparts. Rejection by the General Security Office (GSO), including based on the request to obtain a Lebanese sponsor, even for those that are exempted, was the highest reported barrier to regularizing their stay. Individuals who cannot benefit from the legal residency fee exemption extensively reported their inability to cover the associated costs and/or to secure a sponsor, due to the brutal economic turndown.
The positive outcomes noted in the level of birth registration in 2019 did not continue through 2020, most likely because of the COVID-19 related lockdowns and their impact on awareness raising and legal counselling activities, as well as on the closure of institutions, and because of the increased inability of the population to cover the costs associated with the procedures. In 2020, 28% of births were registered at the Foreigners’ Registry, compared to 30% in 2019. Though all births (99%) since 2011 had, at the minimum, a birth certificate from a hospital or midwife, still, the majority of births remained unregistered with the proper authorities and if left unregistered, can have serious negative effects such as limited access to key services both in Lebanon and later on in the country of origin in case of return.
Competition for jobs, curfews and safetyLike in 2019, a small minority of refugees rated their relations with the host community as negative (4%), while most refugee families rated this relationship as positive or very positive (54%), noting continued instances of inter-community support in the context of the worsening socio-economic crisis affecting both populations. When examining reported issues that were perceived to drive tensions among refugees and the host community, competition for jobs continued to come up most frequently (40%), noting that the share of households citing cultural differences steeply increased (to 20% from 8% in 2019). Before curfews started to be imposed in relation to Covid-19, 21%, or 1 in 5 refugee households consulted, reported that there was a curfew being imposed in the area where they live (an increase from 14% in 2019). The vast majority of these curfews were imposed by municipalities, noting a substantial increase in the share of households that reported curfews in Bekaa, El Nabatieh and North Lebanon. These curfews were seen as discriminatory, as they were imposed specifically on refugees, being the source of security concern; thus, they limited freedom of movement and heightened the risk of arrest for individuals in that area. The percentage of families that reported community violence or disputes doubled to 6%, from 3% in 2019, noting that incidents of sexual and gender-
EXECUTIVE SUMMARY
based violence, or other problems affecting women more specifically, are likely to be underreported as most of the respondents were men and interviews did not take place in a confidential setting.
Reported need to access primary and hospital care has declined Despite the increasingly difficult accessibility situation in the country due to the multi-faceted crisis, refugees reported having increased access to needed care both at primary and hospital care levels. Like previous years, cost was the most cited reason for not accessing care even though in 2020 cost of transportation and cost of drugs gained importance compared to doctors’ fees. More refugees relied on pharmacies for primary health care needs in 2020 than in 2019 and fewer went to primary health care outlets.
At the same time, it was reported that the need for both primary and hospital care has declined. This might be explained by seasonal variations of incidence of certain diseases and the fact that in 2020 VASyR was conducted during a different time period compared to 2019. Other possible reasons might be related to the ongoing crisis and financial hardship in which households are not prioritizing health needs and do not consider preventive or primary health care as a necessity. COVID-19 situation and restrictive preventive measures implemented at different levels might also have impacted health seeking behaviour and the perceived need for healthcare.
The proportion of home-based deliveries remained unchanged during 2020.
Refugees continue to live in conditions below humanitar-ian standardsRefugees continue to live in conditions below humanitarian standards with over half (58%) of Syrian refugee families living in overcrowded shelters, shelters below humanitarian standards and/or shelters in danger of collapse. Forty-three percent of Syrian refugee households were living in shelters that were below humanitarian standards or in dangerous conditions. Almost one-third of households continued to live in overcrowded conditions of less than 4.5m2/person. The distribution of Syrian refugee households across the main shelter types remained mostly stable with the majority (67%) living in residential structures, 21% in non-permanent shelters and 12% in non-residential structures. Female headed households (27%) were more frequently living in tents than male headed households (19%) and FHH (15%) were more often hosted for free than MHH (8%).
Share of households with poor food consumption has quadrupled compared to 2019In 2020, almost half of the Syrian refugees had unacceptable food consumption. The share of households with poor consumption level has quadrupled compared to 2019 (19.5% in 2020 vs. 5% in 2019) and that of households with borderline consumption level increased by 1.5 times compared to 2019 (30% in 2020 vs. 20% in 2019).

12
The number of meals consumed by adults in 2020 was 1.9 meals per day, down from 2.2 meals in 2019; and that consumed by children was 2.5 meals, down from 2.8 in 2019. Dietary diversity has declined. In terms of Household Weekly Diet Diversity (HWDD), the share of households consuming 9 or more food groups per week has significantly decreased by 30 percentage points between 2019 and 2020. In terms of Household Daily Average Diet Diversity (HDADD), 21% of households had poor dietary diversity (consuming less than 4.5 food groups on a daily basis), up by 13 percentage points compared to 2019.
Proteins sourced from meat/fish/eggs were the least consumed food group while cereals/tubers were the most consumed food group followed by oil/fat/butter. Furthermore, there has been a substantial decline in the intake of key nutrients. The share of households who have never consumed Vitamin A increased from 3.6% to 15.3%, and those who have never consumed protein increased from 1.6% to 10%. Men-headed households were consuming a more diverse diet per day than women-headed households.
Ninety-six percent of households were adopting livelihood-based coping strategiesIn terms of food-related coping strategies, 65% of households have reduced the portion size of meals (up by 6 percentage points in 2019) and 65% have reduced the number of meals eaten per day (up by 5 percentage points compared to 2019). Additionally, 43% of households borrowed food or relied on help from friends or family (up by 4 percentage points in 2019).
Ninety-six percent of Syrian refugee households were adopting livelihood-based coping strategies. Around half of households living below the SMEB were adopting more crisis coping strategies than other S/MEB categories. Moreover, 38% of households were adopting stress coping strategies in 2020, up from 30% in 2019.
Half of the households are now food insecureForty-nine percent of Syrian refugee households were food insecure, up by 20 percentage points compared to 2019. Additionally, food insecurity increased in all governorates in Lebanon with the highest levels reported in the North (70%) and South (67%) ones. Female-headed households (FHH) were more food insecure than male-headed households (MHH) (55% vs. 48%). FHHs (55%) were slightly more food insecure than MHHs (48%). A far higher proportion of FHHs (68%) than MHHs (13%) were using coping strategies categorized as “crisis level or emergency level”. 7% of all households reported restricting the food consumption of female members of the household specifically.
Decrease in breastfeeding ratesExclusive breastfeeding, among children under 6 months showed a decrease of 12 percentage points. Likewise, the Minimum Acceptable Meal Frequency for children between 6 and 23 months of age drastically decreased from 80% in 2019 to 51% in 2020.
Nine out of 10 households are now living in extreme povertyEighty-nine percent of Syrian refugee households were below the SMEB, a significant increase of 34 percentage points compared to 2019, and the highest level compared to the previous years. The Beirut governorate witnessed 48 percentage points increase in the share of households under the SMEB level, while the highest levels of households under the SMEB level were reported in Bekaa (96%) and Baalbek-El Hermel (94%).
Ninety-two percent of overall households were in debt, with the average debt per household being LBP 1,835,838, up by 10% compared to 2019. The top reason cited for borrowing money was to purchase food, at 93%, up by 18 percentage points compared to 2019. The main source of borrowing continued to be friends in Lebanon.
Fifty-four percent of households have food share expenditures of less than 50%, down from 64% in 2019. The per capita monthly expenditure increased by around 27% compared to 2019 reflecting inflation of prices of commodities, but not necessarily an increase in the volume of expenditures. “Bread and pasta” continued to be the most purchased food items at 25%.
Higher unemployment Thirty-nine percent was the overall unemployment rate in 2020, up by 8 percentage points compared to 2019. From a gender lens, the employment to population ratio varied considerably, with it being 46% among men and 8% only among women. Additionally, one out of four men were unemployed and 86% of women were outside the labour force. At a governorate level, Bekaa and Baalbek-El Hermel reported the highest unemployment rates (61% and 52% respectively).
There was a 7 percentage points decrease in the share of Syrian refugee households who had working members in the past 7 days prior to the survey (52% in 2020 vs. 59% in 2019). Contextualizing the results in terms of gender, women-headed households reported double the percentage decrease of men-headed households.
Lack of jobs in the area where they lived was the main reported reason of unemployment among Syrian refugee households.
The level of engagement in the agriculture sector almost doubled between 2019 and 2020, while construction dropped from being the top sector in 2019 to the second place in 2020. This could be explained by the COVID-19 lockdown, the financial crisis that affected imported materials for construction, and the increase in the local agricultural production.
WFP assistance in the form of e-cards was reported as the main household source of income (21%), followed by informal debt (17%) and ATM cards used in ATM machines from UN or humanitarian organizations (15% - up from 7% in 2019) ). When asked about the top three sources of income, informal debt ranked first at 73%, up by 9 percentage points compared to 2019.
EXECUTIVE SUMMARY

13
The amount of LBP 97,600 was the average per capita weekly income down from LBP 105,000 in 2019. Severely food insecure households had the lowest income per capita in comparison to other food security groups.
More children are engaged in child labourChildren between the ages of 5 and 17 years who are engaged in child labour almost doubled since 2019, reaching 4.4% in 2020. As in previous years, boys are at higher risk than girls, 7% and 2% respectively. Out of children who were engaged in child labour, 71% were engaged in economic activities and 1% in household chores. For children between the ages of 1 and 14, there was an 8 percentage points decrease in those who have experienced one form of violent discipline. Twenty-four percent of adolescent girls (15 to 19 years of age) were reported to be married at the time of the survey, similar to last year. However, there were governorate differences between 2019 and 2020. Last year, the North recorded the highest rate, whereas this year the highest rate was reported in Beirut.
Households continue to rely on bottled drinking waterSimilar to previous years, access to improved drinking water was at 87% with mineral bottled water being the most prominent improved drinking water source. However, bottled mineral water dropped by 5 percentage points since 2019, reaching 37%. The VASyR 2020 found an 8 percentage points increase in the water source being readily available on premises. The majority (91%) of household members had access to improved sanitation facilities. The estimates of water and sanitation varied greatly between governorates and residential types.
Most students did not attend school, not even remotelyThe pre-primary and primary enrolment rates remained the same at 16%, whereas the secondary rates increased by 7 percentage points reaching 29%. When asked if children attended school after the closure due to COVID-19, the results showed that most students did not attend school, not even remotely due to lack of internet.
The top three reasons for children between 3 and 17 years of age not being enrolled in school remained the same as in previous years: child not in age for school (36%), cost of education materials (20%) and cost of transportation to school (15%). Since the child not attending due to age was predominately among children 3 to 5 years of age, attending non-formal education programme and not enrolled due to work emerged as the third most reported reasons for children 6 to 14 and 15 to 17, respectively. Noteworthy, among children 6 to 14 years of age, the rates of the cost of education materials tripled and the cost of transportation doubled from last year, with the same rate of children not enrolled in school. Gender parity indices showed no significant differences between boys and girls.
Eleven percent of youth (aged 15 to 24 years) were enrolled in school, similar to last year. The main reasons were due to marriage (29% - mostly girls), to work (22% - mostly boys), and to the cost of educational materials (17%). The rate of youth who were not in education, employment, or training was at 67%, higher among girls.
EXECUTIVE SUMMARY

14
RECOMMENDATIONSThe next VASyR activities should undergo a detailed review of all indicators to ensure that the impact of COVID 19 and economic crisis on vulnerabilities can be analysed exhaustively. This also includes a continuation of partners’ coordination on the ground, including with the Government of Lebanon, to assess and further grasp the impact of the crisis on Syrian households.
- Challenges with obtaining legal residency should be addressed through an expansion of the fee waiver in line with the recommendations in the Brussels I and II Conference partnership papers. Expanding the fee waiver for legal residency to all categories of refugees is critical for refugee protection. This would in particular allow the increase of refugees’ freedom of movement and access to documentation as well as to critical services and to justice.
- In light of the growing number of curfews specifically
imposed on refugees, and the ensuing risk of arrest and their impact on the refugees’ ability to provide for their families, it is critically important for the London and Brussels commitments "to preserve dignified stay of refugees, while enforcing the application of national laws in a non-discriminatory manner" to be applied broadly. Efforts should also be made to address socio-economic pressures and tensions, especially at the local level. These include livelihood and social stability initiatives that benefit both the Lebanese communities and the refugees, as well as advocacy around dignified work.
- A deeper understanding about household perception of need for care is crucial to interpret the contradicting finding of reported increased access to care in the face of increased economic vulnerability. Households deprioritizing preventive health care and early symptoms might lead to increased morbidity and mortality despite reports of increased access to care.
- Given that cost is once again cited as being the most important barrier for accessing care, the need for financial assistance to the most vulnerable groups is needed. This includes the subsidization of direct services and supplies costs but also the indirect costs such as transportation.
- Further inquiry and qualitative analysis are needed to determine the reasons why some women continue to opt for delivering at home.
- Preparedness and response to emergencies, mainly addressing refugees living in non-permanent shelters, should be ensured to enhance lifesaving interventions.
- Current yearly mobility rate of 15%, and eviction and eviction threats manifested due to increased socio-economic vulnerability and civil unrest should be addressed through an integrated and multi-sectoral response, with focus on shelter/WASH/protection/social stability assistance being required to meet the increasing needs of the refugee population.
- Given the drastic increase in the share of households that were food insecure and in order to prevent hidden hunger or appearance of malnutrition, it is recommended to expand horizontally and vertically food and non-food assistance coverage for the households in need. Moreover, a more frequent monitoring of food security indicators and setting thresholds to trigger appropriate mitigation measures at national or subnational levels, including emergency responses, need to be further strengthened. Monitoring activities should also help to better understand access to adequate and nutritious diets and healthcare services and to target and implement assistance programs.
- Most households require financial resources to urgently meet their basic needs, including food and non-food needs, and to access increasingly unaffordable services, including education and healthcare. As households are already implementing negative coping mechanisms and facing drastic income reductions, it is recommended that partners design and implement large scale cash-based programs, based on in-depth multi-faceted analyses of transfer modalities, market monitoring and security aspects. The programs should also ensure that female-headed households, which are more vulnerable than male-headed ones, are proactively consulted in the future program designing to respond to the findings.
- With almost all families now living below the SMEB and in poverty, maintenance and scale-up of regular multi-purpose cash assistance through the basic assistance sector is highlighted as a priority in the overall response.
- The food security and agriculture sector should continue to coordinate partners providing food assistance to Syrian refugees and recommend the adoption of a common targeting strategy and standards for assistance in order to minimize duplications at a time when needs are increasing and financial resources remain limited. The participation of Syrian refugees in casual work through agriculture programs, one of the main sectors of employment for Syrians, should be advocated as a source of income and skills building. Advocacy towards the donors’ community to continue to fund and increase resources for food assistance in Lebanon should persist.
- Across all sectors, strengthening the referrals system should be maintained to ensure ad hoc support through different modalities to vulnerable refugees. Conflict sensitivity should also remain a focus in the designing of assistance interventions, regardless of the modality.
- The increase in child labour warrants prioritization by the humanitarian sector. A tailored multi-sectoral and integrated response and a deeper understanding behind the increase is required to be able to address the issue at the root causes. The aforementioned should have a gender lens, given the difference between girls and boys. The response needs to have short-term and long-terms results, and to consider prevention interventions and risk mitigation measures. The need to address these issues is of great importance vis-à-vis the deteriorating socio-economic and COVID-19 pandemic situation in Lebanon.
EXECUTIVE SUMMARY

15
- Given that learning modalities might need to change, the MEHE and the education sector should work on a distance learning strategy with learning milestones and indicators for each grade. The learning strategy can be customized to a compressed year with a technological approach, for example, internet or paper- based. Moreover, this should cover promoting violence-free environments, at school and home. Since more children are spending time at home, there should be a focus on caregivers as well. Last but not least, education interventions should be systematically linked to child protection systems and livelihood opportunities for youth, with a gender lens.
- The continuous child marriage rates between 2019 and 2020 show the need for a holistic integrated multi sectorial approach at the macro and micro levels. The lack of a national policy and laws on child marriage put more responsibility on the humanitarian sector to work with the communities and caregivers in shifting attitudes and behaviours of child marriage. Moreover, with the severity of the economic crisis and COVID-19, child marriage is less likely to decrease in the upcoming year.
- Violent disciplinary measures remain high in Lebanon despite the recent efforts made to ensure that every child is protected from any form of violence. Community and caregivers focused activities are needed to tackle the root causes of violent disciplinary measures. In 2020, UNICEF- Lebanon published a formative study entitled “Understanding the root causes of violence against children and women in Lebanon” that aimed to unravel the complex reasons accompanying violence against children and women using a Social Behavioural Model1.
- The water and sanitation sector should maintain the accessibility of Syrian refugees to improved drinking water sources and improved sanitation facilities. The results show that the rates differ between shelter types and across governorates; thus, the sector should put a special focus on governorate and shelter types, especially non-permanent ones. Despite the importance of having an improved water source, the quality of water is an important indicator and the water sector should work towards testing the water quality Syrian refugees are getting.
- The education response should focus on the retention of students in schools and on completion. Given the unpredictable situation of COVID-19 in Lebanon and its impact on learning modalities, a qualitative study can be of benefit in unpacking the challenges and identifying opportunities for an effective distance learning modality, especially when the results showed that children were not able to adhere to distance learning due to lack of internet. That said, there should be an assessment on learning loss for children who were automatically promoted to the next school grade despite challenges in attending the previous year.
- As the situation in Lebanon is deteriorating, Syrian refugee children are at higher risk of dropping out of school. Thus, there should be a better predictor of dropouts. UNHCR-funded liaison volunteers stationed in second shifts schools can work with school administrations to identify children at risk of dropping out, through NGO partners. This approach can be complemented by the MEHE sharing with sector partners, attendance data and school opening days at a geographical level as proxy to learning and risk to dropout.
1 https://www.unicef.org/lebanon/reports/understanding-root-causes-violence-against-children-and-women-lebanon
EXECUTIVE SUMMARY

1716
INTRODUCTION © UNHCR/Diego Ibarra Sánchez

18
BACKGROUND
PURPOSE
ASSESSMENT ORGANIZATION AND SCOPE
Nine years into the Syria conflict, Lebanon remains at the forefront of one of the worst humanitarian crises. The economic downturn, steep inflation, COVID-19 and finally the Beirut blast have pushed vulnerable communities in Lebanon - including Syrian refugees - to the brink, with thousands of families sinking further into poverty.
The Government of Lebanon (GoL) estimates that the country hosts 1.5 million1 of the 6.6 million2 Syrians who have fled the conflict since 2011 (including 879,529 registered with UNHCR as of end of September 20203). The Syrian refugee population in Lebanon remains one of the largest concentration of refugees per capita in the world.
The 2020 Vulnerability Assessment of Syrian Refugees in Lebanon (VASyR) was the eighth annual survey assessing the situation of Syrian refugees in Lebanon to identify changes and trends in their vulnerabilities. Given the COVID-19 pandemic in Lebanon, most assessments and other activities requiring in person visits were either cancelled or postponed. Considering the prolonged socio-economic status in Lebanon and COVID-19, it was crucial to provide needs-based estimates on Syrian refugees in the country. Thus, the VASyR 2020 was one of the few assessments that were conducted face-to-face; the implementation was accompanied by a comprehensive protocol to ensure the safety of families and field workers (see Methodology for more details). The criticality of conducting the VASyR 2020 was to provide insights about Syrian refugees impacted by the political and economic crisis that hit Lebanon in late 2019 and by the COVID-19 outbreak.
The VASyR is an essential tool for planning, decision-making and needs-based program designing. Results of the VASyR are used by ten sectors under the Lebanon Crisis Response Plan (LCRP) to understand the evolving situation in Lebanon and to advocate for funding from donors. The VASyR has also been used to build targeting models, for instance to predict the socio-economic vulnerability. Results of the VASyR are used to show the geographical differences in vulnerabilities at governorate and district levels, which feed into the situation analysis.
The key objectives of the VASyR are:1. To provide a multisectoral overview/ update of
the vulnerability situation of Syrian refugees in Lebanon through an annual household survey. This assessment offers an understanding of the economic situation, food security, shelter living conditions, coping strategies, access to services, the situation specifically for women and children, and more. The information feeds into the situational analysis of the LCRP and informs the planning processes of local government agencies, donor countries and NGOs.
UNHCR, UNICEF and WFP are the VASyR technical leading agencies, and form the VASyR steering committee together with the Inter-Agency Coordination unit. The Inter-Agency Coordination Unit is responsible for implementing the assessment, providing technical insights and ensuring quality control. The inter-agency unit coordinates the VASyR process, ensuring linkages between the VASyR and the LCRP, as well as communication and feedback from the different sectors.
Development of the analysis plan and questionnaire began in January 2020 through rounds of feedback with the Core Group and sector experts. Due to COVID-19 and the resulting national lockdown in Lebanon from mid-March onward, the original 2020 VASyR data collection initially planned for the end of March was postponed till August 2020. Preliminary data analysis occurred from September through December 2020, and full analysis and report writing took place from December 2020 through January 2021.
The figure on the following page reflects the scope and contents of the VASyR.
The analysis for this report was conducted by the three above-mentioned UN agencies with the support and coordination of the Inter-Agency. The UN High Commissioner for Refugees (UNHCR) is the lead for demographics, protection, shelter, health and assistance, while the UN Children’s Fund (UNICEF) is the lead for WASH, youth, education, child protection, child health, child nutrition and children with disabilities. The World Food Programme (WFP) is the lead agency for economic vulnerability, livelihoods, food consumption, coping strategies and food security. All agencies conducted the data analysis and wrote-up internally based on the breakdown of responsibilities per section. UNWOMEN conducted the analysis of the gender chapter. Coordinators from the three agencies oversaw the relevant chapters in the VASyR.
For additional details on the implementation of the survey, see the Methodology chapter.
INTRODUCTION
2. To enhance targeting for the provision of assistance. The VASyR is used to build or revise targeting models like the targeting formula to predict socio-economic vulnerability, which in turn is used for targeting for cash and food assistance. The results of the VASyR also inform other targeting approaches, for instance on protection risks or shelter vulnerability, and identify most vulnerable areas.
3. To contribute to the LCRP Monitoring and Evaluation (M&E) framework. the VASyR results are used to measure whether sector objectives (outcomes) have been achieved. The VASyR is also used in the formulas to calculate LCRP impact indicators (e.g. protection risks).
4. Provide an overview of the additional needs of Syrian refugees impacted by the ongoing crisis. VASyR 2020 aims to provide insights on how the Syrian refugees have been impacted by the political and economic crisis that hit Lebanon in late 2019 and by the COVID-19 outbreak.
1LCRP 2017-2020 (2020 update)2https://www.unhcr.org/globaltrends2019/3UNHCR registration data as of 30 September 2020

19
INTRODUCTION

2120
METHODOLOGY © UNHCR/Houssam Hariri

22
the Lebanese Red Cross, which covered key information about the virus, transmission and precautionary methods. The bulk of the trainings were administered by UNHCR, WFP and UNICEF staff. Trainings on the Washington Group Question Set of Functioning was provided by Humanity and Inclusion. Data was collected and entered on electronic tablets by the enumerators during the interviews using KoBo toolbox software. The data was then sent to UNHCR Refugee Assistance Information System (RAIS) Platform. Data collection took place between the 19th of August and the 17th of September through face-to-face interviews at refugee homes by four partners in each region, as shown in the table below.
METHODOLOGY
SAMPLING
TRAINING AND FIELD WORK
COVID-19 SAFETY MEASURE DURING DATA COLLECTION
Sampling for the VASyR followed a two-stage cluster approach, keeping with the methodology of previous years. UNHCR database of known Syrian refugees as of June 2020 served as the sample frame. Cases with missing addresses were excluded. Sampling was based on a “30 x 7” two-stage cluster scheme initially developed by the World Health Organization. This method outlines a sample size of 30 clusters per geographical area and seven households per cluster which provides a precision of +/- 10 percentage points1. Districts were considered as the geographical level within which 30 clusters were selected. There are 26 districts in Lebanon, where Beirut and Akkar each represent a district and a governorate. As such, to ensure similar representativeness with other governorates, an additional two strata samples were considered for each, yielding 90 cluster selections for each. The governorate of Baalbek- El Hermel is made up of only two districts, and thus to ensure an adequate sample in that governorate, one additional cluster sample was considered.
The primary sampling unit was defined as the village level (i.e. cluster) and UNHCR cases served as the secondary sampling unit. A case was defined as a group of people who are identified together as one unit (usually immediate family/household) under UNHCR databases. Using the Emergency Nutrition Assessment (ENA) software, villages were selected with a probability proportionate to size where villages with a larger concentration of refugees were more likely to be selected and 30 clusters/villages were selected with four replacement clusters, per district.
In order to determine the sample size needed to generate results representative at a district, governorate and national level, the following assumptions were used:
- 50% estimated prevalence.- 10% precision.- 1.5 design effect. - 5% margin of error.
Using the above parameters, 165 cases per district/cluster selection were required, leading to a target of 5,115 cases nationally. Due to the known high level of mobility of the Syrian refugee population and based on experience in previous rounds of VASyR and other household level surveys, a 40% non-response rate was considered. In the final sample, 8,662 cases were targeted across all districts of which 4,563 households were visited.
Due to the COVID-19 pandemic, enumerator training took place remotely. Separate enumerator trainings were carried out online for each operational region (Bekaa, Mount Lebanon, North and South) covering the data collection tool, contextual background, methodology and ethical considerations. Additionally, enumerators were required to attend a two-hour online COVID-19 training, provided by
With the support of the Lebanon Crisis Response Plan Health working group and WHO, detailed guidelines were put in place to ensure the safety of enumerators and refugee families during the face-to-face data collection. Firstly, prior to the visit, households were screened over the phone to ensure that no member in the households was exhibiting COVID-19 related symptoms and also to inform households of the measures that would be taken during the interview. UNHCR field offices and partners also liaised closely with local authorities to inform them of the exercise and measures taken to ensure access to specific areas. During the data collection activity, enumerators were provided with Personal Protective Equipment which included masks and sanitizing equipment. These were also provided to refugee individuals who participated in the interviews. Enumerators were also equipped with digital thermometers in order to measure body temperature of individuals prior to beginning the interview. Interviews took place with one person in the household with safe social distancing and in an outdoor or a well-ventilated area. If these conditions were not met or if any household member was showing COVID-19 related symptoms, the interview was called off.
1Using the Emergency Nutrition Assessment (ENA) Software.
Table 1: Partners that conducted VASyR interviews
Akkar
Baalbek-El Hermel
Beirut
Bekaa
Mount Lebanon
El Nabatieh
North
South
Caritas
World Vision International
Makhzoumi Foundation
World Vision International
Makhzoumi Foundation
SHIELD
Caritas
SHIELD

23
(ns/n)
wn= (Ns/N)
METHODOLOGY
QUESTIONNAIRE
DATA QUALITY ASSURANCE
DATA PROCESSING
LIMITATIONS AND CONSTRAINTS
The 2020 VASyR questionnaire consisted of around 580 questions that collected data at the household and individual level including demographics, legal documentation, safety and security, shelter, WASH, health, food security, livelihoods, expenditures, food consumption, debt, coping strategies and assistance, as well as questions specifically relating to women, children and people with disabilities.
The VASyR questionnaire is a household survey administered with either the head of the household or any other adult household member.
The full questionnaire can be downloaded via the following link: https://data2.unhcr.org/en/documents/details/84558
On a weekly basis, five percent of the weekly target number of households were contacted to verify a few questions from the interview and to receive feedback on the enumerators’ performance. Additionally, At the end of each week, a data collection summary report was shared with all agencies to check on the progress of data collection. Team leaders and field focal points followed up closely with enumerators and general feedback was shared on a weekly basis.
Data weighting was necessary to ensure that the geographical distribution of the population was reflected in the analysis and to compensate for the unequal probabilities of a household being included in the sample. The normalized weight was calculated for each district using the following formula:
As in any survey, limitations were expected. Key limitations of the VASyR were as follows:
1. While previous rounds of the VASyR occurred during the same time of the year (May-June), in 2020, the data collection was delayed till August-September, due to the COVID-19 Outbreak. Data collection in Beirut was also slightly delayed due to the August 4th Beirut port blast.
Where wn is the normalized weight, Ns is the total sample frame of the district, N is the total national sample frame, ns is the number of households visited in the district and n is the total visited households.
The data was cleaned from any significant outliers and consistency checks were applied to spot any data errors. Results were disaggregated by district, governorate, gender of the household head, shelter type, food security and economic vulnerability, when deemed necessary. Data was analyzed using SPSS version 20.
This may have had implications on indicators that concern behaviors with eventual seasonal variations.
2. The VASyR relies primarily on self-reported data which may give rise to bias. To minimize the impact of this bias, enumerators were trained on providing a comprehensive informed consent to reassure confidentiality, purpose, risks and benefits.
3. Sample sizes for specific age groups may have been be small as the sampling strategy was not conducted for this purpose. Thus, results for such age groups were either not reported (e.g., cases below 25), not segregated by geography (e.g., IYCF) or reported but with caution.
4. The VASyR sampling frame excluded Syrian refugees who have never approached UNHCR (unless within a targeted household). It is worth noting that this population is a consistent gap in data on Syrian refugees in Lebanon.
5. The VASyR questionnaire and respective indicators were subjected to adjustment and changes in order to ensure that the most accurate definition or calculation was being used. This has caused some results not to be directly comparable with previous years.
6. The VASyR is a household survey and the interview is usually conducted with the head of household or any other adult household member. As such, there are no individual interviews carried out with each family member and obtaining accurate information on particularly sensitive topics is a challenge (i.e. child labor or harassment).
7. Due to the geographical level sampling methods, families that have moved to a different governorate or whose address was not updated with UNHCR were not captured in the survey.

2524
DEMOGRAPHICSThe VASyR tracks key demographic indicators over time to better understand the population of Syrian refugees in Lebanon. This includes household composition, profile of the head of household, dependency and prevalence of disabilities and other specific needs. A household is defined as a group of people that live under the same roof, share the same expenses and eat from the same pot. The head of household is the main decision maker.
- Household size remained stable with, on average, five individuals in a typical Syrian refugee household in Lebanon.- The share of female-headed households remained similar to 2019 at 19%.- There were no major shifts noted in the overall population composition, with an even split between males and females. More than half of the population was under the age of 18.- Among the population, 9% of individuals were found to have a disability. At the household level, one third (33%) of households had at least one member with a disability.
KEY FINDINGS
© UNHCR/Andrew McConnell

26
DEMOGRAPHICS
POPULATION PROFILE
REFUGEE HOUSEHOLDS
Figure 1: Age distribution by gender
Females Males
0-4 years olds
10 to 14 years old
20 to 24 years old
30 to 34 years old
40 to 44 years old
50 to 54 years old
60 to 64 years old
70 years old or above
20% 15% 10% 5% 5% 10% 15% 20%0%
Examining the distribution of the population by age and gender, there was an overall even split between males and females in the population. The exception was in the age group between 25-29 years where there was a notable gender gap, with a smaller proportion of men than women. Over half (54%) of the Syrian refugee population in Lebanon was below the age of 18 years.
The average Syrian refugee household size has remained stable at five individuals per household. On average, households were composed of two adults (18-59 years), 1.8 children aged between 6 and 17 years, and one child aged five years or younger.
Most commonly, households had between one and four household members (42%), 36% had five to six members and 23% had seven household members or more. Eighty-six per cent of households had at least one member under the age of 18, and 60% had at least one child under the age
of five. Ten percent of households had an elderly member aged 60 years or above.
The share of female-headed households has remained stable over the years, at 19% in 2020 compared to 18% in 2019. Beirut and Mount Lebanon had the lowest share of female-headed households at 7% and 15% respectively, while Baalbek- El Hermel, Bekaa and the South had the highest rate, with one quarter of families in these governorates being headed by a female.
Figure 2: Share of female-headed households in the population by governorate
19%22%
7%9%
25%26%
16%
25%
13%
Total Akkar Baalbek-El Hermel
Beirut Bekaa El Nabatieh MountLebanon
North South
27
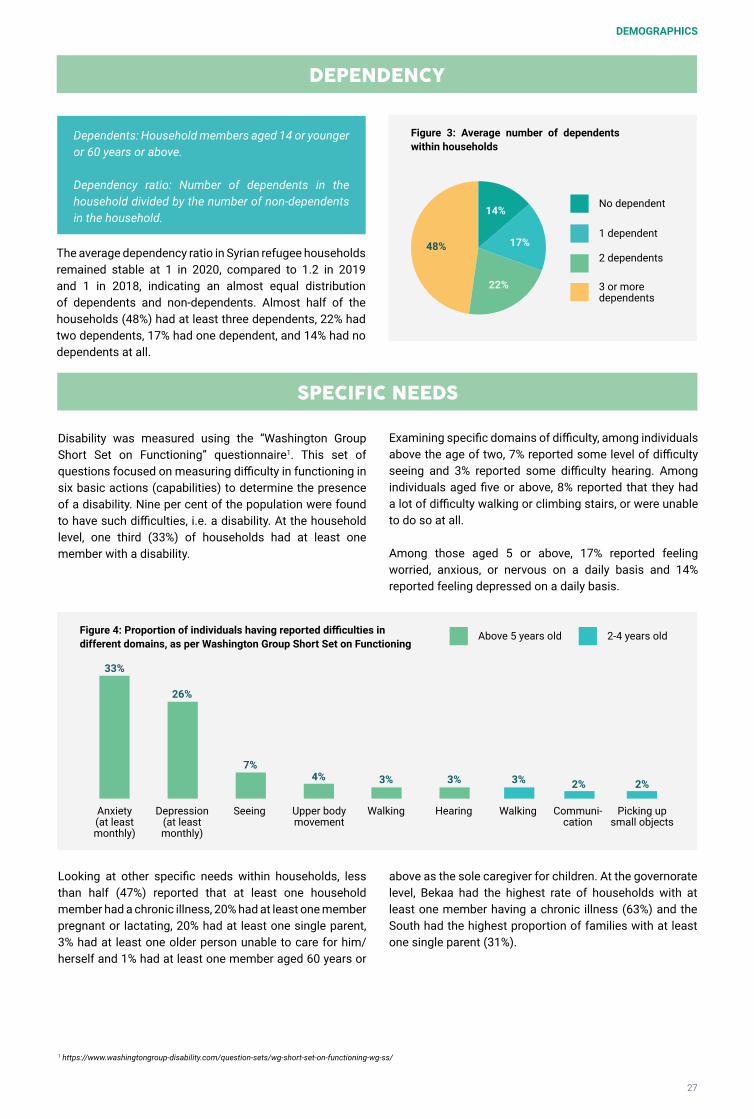
Dependents: Household members aged 14 or younger or 60 years or above.
Dependency ratio: Number of dependents in the household divided by the number of non-dependents in the household.
The average dependency ratio in Syrian refugee households remained stable at 1 in 2020, compared to 1.2 in 2019 and 1 in 2018, indicating an almost equal distribution of dependents and non-dependents. Almost half of the households (48%) had at least three dependents, 22% had two dependents, 17% had one dependent, and 14% had no dependents at all.
DEMOGRAPHICS
DEPENDENCY
SPECIFIC NEEDS
Disability was measured using the “Washington Group Short Set on Functioning” questionnaire1. This set of questions focused on measuring difficulty in functioning in six basic actions (capabilities) to determine the presence of a disability. Nine per cent of the population were found to have such difficulties, i.e. a disability. At the household level, one third (33%) of households had at least one member with a disability.
Looking at other specific needs within households, less than half (47%) reported that at least one household member had a chronic illness, 20% had at least one member pregnant or lactating, 20% had at least one single parent, 3% had at least one older person unable to care for him/herself and 1% had at least one member aged 60 years or
Examining specific domains of difficulty, among individuals above the age of two, 7% reported some level of difficulty seeing and 3% reported some difficulty hearing. Among individuals aged five or above, 8% reported that they had a lot of difficulty walking or climbing stairs, or were unable to do so at all.
Among those aged 5 or above, 17% reported feeling worried, anxious, or nervous on a daily basis and 14% reported feeling depressed on a daily basis.
Figure 3: Average number of dependents within households
No dependent
1 dependent
14%
17%
22%
48%
Figure 4: Proportion of individuals having reported difficulties in different domains, as per Washington Group Short Set on Functioning
26%
Depression (at least monthly)
33%
Anxiety(at least monthly)
4%
Upper body movement
3%
Walking
3%
Hearing
7%
Seeing
3% 2% 2%
Walking Picking up small objects
Communi-cation
Above 5 years old 2-4 years old
1 https://www.washingtongroup-disability.com/question-sets/wg-short-set-on-functioning-wg-ss/
above as the sole caregiver for children. At the governorate level, Bekaa had the highest rate of households with at least one member having a chronic illness (63%) and the South had the highest proportion of families with at least one single parent (31%).
2 dependents
3 or moredependents

28
Figure 5: Proportion of households with at least one household member with a specific need, by governorate
47%
48%
44%
44%
44%
51%29%
30%
30%
15%
63%
32%25%
26%
29%
34%
38%27%
22%
12%
18%
19%
44%28%
13%
29%20%
3%
3%
3%
3%
3%
3%
2%
2%0%
0%
0%
3%
1%
1%
1%
1%
4%
0%
Total
Akkar
Baalbek-El Hermel
Beirut
Bekaa
El Nabatieh
Mount Lebanon
North
South
Older person as the solecaregiver of a child
Pregnant or lactating
Chronic illness
Older person unable tocare for self
Single parent
DEMOGRAPHICS

29
Anne
x 1:
Gen
der a
nd s
hare
of h
ouse
hold
mem
bers

3130
PROTECTIONIndicators assessing the protection space of Syrian refugees in Lebanon through the VASyR are in relation to legal residency, civil documentation and safety. These indicators include residency status, birth registration, and marriage documentation, with a focus on births and marriages that occurred in Lebanon as well as community relations and tensions. Indicators specific to child protection assessed through the VASyR include child labor and child marriage.
- The rate of legal residency among the Syrian refugee population continued to decline, with only 20% of individuals aged 15 years and above having had legal residency (compared to 22% in 2019). Disaggregation by age showed that younger individuals (aged 25 years and younger) had lower rates of legal residency as compared to their older counterparts. Across all age groups, a higher proportion of men had legal residency, as compared to women.- Birth registration did not continue to improve, as was noted in 2019. In 2020, only 28% of Syrian refugee children born in Lebanon had their births registered with the Foreigners’ Registry, compared to 30% in 2019 and 21% in 2018. However, almost all (98%) had either a doctor’s or midwife’s certificate.- Twenty-one per cent of families reported curfews being imposed in the area where they live, compared to 14% in 2019. The highest rate and largest increase since 2019 was found in El Nabatieh (68% in 2020, 46% in 2019).- Similar to previous years, competition for jobs was cited most commonly (40%) as one of the main drivers for tensions between the refugee and host communities; this was, however, a stark decrease from 2019 (51%). Also, competition for resources was cited as a driver of tension by only 8% of families, a decrease since 2019. A 12 percentage point increase in the share of households citing cultural differences as a main driver for community tensions was noted.
KEY FINDINGS
© UNHCR/Diego Ibarra Sánchez

32
PROTECTION
LEGAL RESIDENCY
Rates of legal residency continued to decline, with only 20% of individuals above the age of 15 holding legal residency permits (compared to 22% in 2019 and 27% in 2018). The most notable decrease was in Beirut where rates of legal residency were at 34% in 2019 but dropped to 21% in 2020. Akkar continued to have the lowest rate with only 11% of individuals aged 15 years and above with legal residency.
Trends of legal residency by gender and age group were similar to previous years where youth and younger adults (under the age of 25) had lower rates of legal residency than their older counterparts. Females across almost all age groups had lower rates of legal residency than males. Women and youth remain facing difficulties when
The majority of individuals (84%) who did not have legal residency at the time of the interview also reported not having had legal residency at any point in the year. Among those without valid residency, 58% reported that they have never approached the General Security Office (GSO) to renew, 27% reported that they had approached the GSO prior to 2018, 6% in 2018, 7% in 2019 and only 2% in 2020.
mobilizing due to lack of legal residency and will require enhanced targeted awareness raising. Lower shares of households living in non-permanent shelters had legal residency (14% compared to 22% in both residential and non-residential shelters). Among individuals with a disability, 18% did not have legal residency permits.
Figure 1: Percentage of individuals aged 15 years or above holding legal residency permits, by governorate
Total Akkar Baalbek-El Hermel
Beirut Bekaa El Nabatieh MountLebanon
North South
2019 2020
22% 20%
13% 11%14% 15%
21%18% 18% 17%
34%39% 39%
44%
37%
22% 22% 23%
At the household level, only 11% of households reported that all members were holding legal residency (10% in 2019) and 30% had at least one member with legal residency (from 33% in 2019). This leaves less than three quarters (70%) of households with no member at all having legal residency.
Based on the current regulations, Syrian refugees can renew their residency permits either on the basis of registration with UNHCR, through a pledge of responsibility by a local sponsor, courtesy permit (if the mother or wife are Lebanese), or through other categories such as a property ownership, tenancy, student visa, etc. Additionally,
Figure 2: Percentage of individuals 15 years or older holding legal residency permits, by gender and age group
those who had entered Lebanon legally as of 2015 had to do so based on one of the entry categories and could only renew their legal stay within the limitations set for this specific entry category (such as tourism, medical visit, transit etc.). Each category has its own requirements, fees and residency duration. In 2017, the residency fees were waived for Syrian refugees registered with UNHCR prior to 1 January 2015 and who did not previously renew their legal residency based on categories such as tourism, sponsorship, property ownership, or tenancy. However, it was not possible to switch from a residency permit based on one of these categories to the UNHCR certificate residency permit.
Males Females
15-19Age group 20-24 25-29 30-34 35-39 40-44 45-49 50-54 55-59 60-64 65-69 70 and above
14%11%
15%
19% 19%
17%
21% 20% 20%23% 22%
19% 19%
15%12%
23%
29% 29% 29% 29%27% 27%
33%
13%

33
PROTECTION
Figure 3: Reasons for not holding legal residency permits, by gender
Rejection by GSO, including inconsistent practices, were the most commonly cited reasons (33%) for not having legal residency, followed by the inability to obtain a sponsor or pay residency fees (26%); the latter being slightly more commonly cited by men as compared to women. Limitations of the existing regulations, which included individuals that had an unrenewable and expired residency or individuals who lacked ID documents, was cited by 12% of those not having legal residency. Eleven percent of individuals stated personal reluctance and discouragement as the reason they did not have legal residency.
Similar to 2019, over half (55%) had legal residency through their UNHCR registration certificate. This was much more common among females than males (68% versus 44%), while males were much more likely to have legal residency through sponsorship (46% versus 19%). Ten percent of households had legal residency through courtesy (i.e. having a Lebanese parent or a Lebanese wife).
MARRIAGE AND BIRTH REGISTRATION
One quarter (26%) of the married individuals surveyed were married in Lebanon. In 2019, there was a slight improvement in the level of marriage registration for those married in Lebanon compared to 2018. However, this improvement seemed to have halted in 2020. This reversal in trend could be explained by the COVID-19 related lockdowns and their impact on awareness raising and legal counselling activities, as well as on the closure of institutions, and by the enhanced inability of the population to cover the costs associated with the procedures. The
Figure 4: Percentage of individuals having completed the required steps of marriage registration, for marriages in Lebanon
No Marriage Documents
Marriage contract from an uncertified
Sheikh
Marriage contract from a religious
authority or Proofof marriage from the
Sharia Court
Marriage certificate
authenticated by the Mukhtar
Marriage certificate
registered with the Noufous
Marriage certificate
registered with the Foreigners’
Registry
Marriage certificate
stamped by the Ministry of Foreign Affairs
Marriage certificate
stamped by the Syrian Embassy
Updated Family booklet or family civil extract or marriage
certificate from Syria
Rejection by General Secuirty Office, including inconsistent practices
Inability to obtain a sponsor or pay the residency fees (not eligible to the waiver)
Limitation of the existing regulations
Reluctance and discouragement of the individual
Other Reasons
Unaware of procedures
Limited capacity of General Security Office
5% 5%6%
23% 23%19%
15%19% 18%
23%22% 20% 20%26% 26%27% 27%
73% 73% 73%
40% 42% 41%
28%33% 35%
21%
32%
23%29%
26%
12%
12%13%
13%
11%
10%8%
9%
9%
7%
6%4%
4%4%4%
33%33%
2018 2019 2020
Males FemalesTotal
proportion of marriages with no legal documentation (which included those without any documentation (6%) and those with documentation only from an uncertified Sheikh (21%)) remained stable at 27%. Almost three quarters (73%) met the minimum needed documentation of either a marriage contract from a religious authority or proof of marriage from the Sharia Court. Similar to 2019, 27% reported to have had their marriage registered at the level of the Foreigners’ Registry (26% in 2019).

34
Figure 5: Cumulative percentage of highest-level birth registration document for Syrian children born in Lebanon. Children registered at the level of the Foreigners’ Registry are considered as ‘registered’ under Lebanese law
Without documentation
With birth notification
issued by the doctor/midwife
With birth certificate issued
by the Mukhtar
With birth certificate
regsitered with the Noufous
With birth certificate
registered with the Foreigners
Registry
With birth certificate
stamped by the Ministry of Foreign
Affairs
With birth certificate
stamped by the Syrian Embassy
With an updated family booklet or indivudal civil extract of family civil extract for the
child
0%3% 1%
97% 97% 98%
82% 81% 78%
40%44%
21%30% 28%
20% 22% 19%10% 13% 12%
27% 26%17%
48%
2018 2019 2020
Like marriage documentation, improvements noted in the level of birth registration in 2019 did not continue through 2020, most likely for the same reasons as those mentioned above. In 2020, 28% of births were registered at the Foreigners’ Registry, compared to 30% in 2019. However, the proportion of births that went without any documentation improved and decreased to 1%. Thus, almost all births have at least completed the first step of the birth registration process (having a notification from a doctor or midwife). The highest rates of birth registration with the Foreigners’ Registry were among families living in
Beirut (49%), while the lowest were among families living in Akkar (8%). No differences were noted in birth registration rates when comparing boys and girls. When examining birth registration rates by shelter type, a striking difference was noted between those living in non-permanent shelters compared to those living in residential and non-residential buildings. The proportion of births registered at the Foreigners’ Registry among those living in residential and non-residential shelters was above the national average, at 35% and 31% respectively. For those in non-permanent shelters however, the rates were much lower at only 9%.
Cost was the most commonly cited barrier for those who were able to register the births at the Nofous but not at the Foreigners’ Registry (62%); this included transportation costs as well as registration fees required by the Foreigners’ Registry. It is worth noting that being unaware of procedures was cited by 21% of individuals, at the same rate in 2019.
Figure 6: Percentage of children born in Lebanon with births registered at the Foreigners’ Registry, by governorate
Akkar8%
Baalbek-El Hermel
10%
Bekaa20%
El Nabatieh39%South
26%
North32%
MountLebanon
44%
Beirut49%
Above national average
Below national average
PROTECTION

35
PROTECTION
Figure 7: Barriers to birth registration at the Foreigners' registry, among those who registered the birth with the Noufous
Cost is prohibitive (transportation cost + fees)
Unaware of the procedures
Limited freedom of movement due to lack of residency
Did not approach Foreigners' Registry because of assumption they ask for a valid residency which is not available
Lack of identification documents (ID, valid passport, family booklet, etc.)
Other reasons
Foreigners Registry refused to register without having legal residency
The Mukhtar comitted to doing this
Fear that Foreigners Registry will inform General Secuirty Office of lack of residency
Not able to register at the Foreigners registry due to lack of proof of marriage by Syrian authorities
Restrictive mobility (roadblocks - lockdown - curfew)
Long waiting time or Foreigners' Registry asked to come back another time
Personal reasons (no time, not interested, disability, etc.)
Closure of the General Secuirty Office (due to COVID-19)
62%
21%
11%
4%
4%
3%
2%
2%
2%
2%
1%
1%
1%
1%
At the time of data collection, there was no COVID-19 specific national lockdown in place that restricted movement. While 21% of households reported that there was a curfew being imposed in the area where they live (an increase from 14% in 2019), 11% of all families also reported that curfews were a source of safety or security issues (12% in 2019). Specifically, there was a substantial increase in the share of households that reported curfews in Bekaa, El Nabatieh, and the North , while this decreased in the South. Curfews were mainly being imposed by the municipality (95%), with a few households (5%) reporting curfews by the local community. Most commonly, the sanction imposed for breaching the curfew was cited to be a verbal warning (84%); less than one quarter (23%) reported fines.
Ten per cent of families reported concerns for safety that limit their freedom of movement. The percentage of
SAFETY AND SECURITY
families that reported community violence or disputes doubled to 6%, from 3% in 2019.
On average, two to four per cent of families reported that they worried about a household member being exploited while accessing services such as housing, food, health services, legal services, jobs, and others. However, less than 1% reported having heard of such incidents in the three months preceding the interview.
It is important to acknowledge that interviews for this assessment most likely took place with the head of households or other adult members, and the respondent was male in about two thirds of the interviews. Individual and confidential interviews with household members were not conducted as part of this data collection exercise and, therefore, incidents related to physical or sexual harassment were most likely to be underreported.

36
Figure 8: Percentage of households who experienced any of the following safety/security incidents during the previous three months
Curfews
Concerns for safety limiting freedom of movement
Community Violence/Disputes
Employees deducting Salaries
Extortion
Unsafety accessing sanitation facilities
Theft/Robbery
Physical Harrassment
Confiscation of Identification Documents
Sexual Harrasment
Raids
Detentions
Kidnapping
Bribes
Other safety issues
2019 2020
11%12%
10%
6%3%3%
3%
3%
1%
1%1%
1%
1%1%1%
1%1%1%
1%
1%0%
1%
2%
2%
2%
4%
4%
4%
Figure 9: Percentage of households reporting a curfew being imposed on them in the area where they live, by governorate
Total Akkar Baalbek-El Hermel
Beirut Bekaa El Nabatieh MountLebanon
North South
2019 2020
1% 1% 1%
14%8% 8% 5%
16%9%
21%
46%
68%
19% 23%
11%
30%
43%28%
Most refugee families rated their relationship with the host community as positive or very positive (54%), at a similar rate to 2019 (56%), with few rating it as negative or very negative (4%). As in previous years, competition for jobs was cited most commonly as one of the main drivers for community tensions (40%), although this decreased from 51% in 2019. The proportion of families citing cultural differences as a key driver of community tensions increased to 20% from only 8% in 2019, while competition for resources decreased drastically to 8% (compared to 20% in 2019). Forty-five per cent of families did not report tensions with the host community, similar to 43% in 2019.
COMMUNITY RELATIONS
Figure 10: Quality of interactions with the refugee and host community
Negative VeryNegative
NeutralPositiveVery positive
7%
49%
39%
4% 3% 1% 1%
45%41%
9%
2019
2020
PROTECTION

37
PROTECTION
Figure 11: Key issues cited by refugees as drivers of tensions between refugee and host communities
2019 2020
No tensions reported
Competition for Jobs
Cultural Differences
Political differences
Competition for resources/services
Religious Differences
Suspicions of crimial activity
Harrasment of women
45%43%
40%51%
20%
20%
13%10%
8%
8%
5%4%
3%
1%0%
3%

38
Of these children involved in child labour, a significantly higher proportion was involved in economic activities rather than household chores.
This section explored child protection issues faced by Syrian refugee children; specifically, child labour, child marriage, and violent discipline. Findings detailed below show that Syrian refugee children were at risk of being exposed to exploitation and abuse.
KEY FINDINGS- The percentage of children between 5 and 17 years old who were engaged in child labour almost doubled compared to 2019 at 2.6% to 4.4% in 2020;- Boys were still at higher risk of child labour than girls, 7% and 2%, respectively;- 1 out of 2 children between the ages of 1 and 14 years have experienced at least one form of violent discipline. Despite the rate being high, it showed a decrease of 8 percentage points from last year; - The percentage of Girls between the age of 15 years old and 19 years who were married at the time of the survey was at 24%. In 2019, the highest percentage of girls (15-19) who were married was in the North governorate. This year, Beirut governorate reported the highest percentage of girls (15-20) who are married at 37%.
CHILD PROTECTION
CHILD LABOUR
Child labour is defined as a child having performed either economic activities or household chores during the last week for more than the age specific number of hours.
- Economic activities: aged 5-11: 1 hour or more; aged 12-14: 14 hours or more; aged 15-17: 43 hours or more.
- Household chores: aged 5-14: 28 hours or more; aged 15-17: 43 hours or more.
The share of children aged 5-17 involved in child labour almost doubled from 2018 and 2019, where the share was at around 2%, reaching 4.4% in 2020. Mount Lebanon and the South recorded the highest rate of children engaged in labour at 6% (see Figure 12). Additionally, as across the years, child labour was more common among boys (7%) than girls (2%).
Figure 12: Child Labour (5 to 17 years old) by governorate2019 2020
Total Akkar Baalbek-El Hermel
Beirut Bekaa El Nabatieh MountLebanon
North Male FemaleSouth
3% 3% 3% 3% 3%4% 4% 4% 4% 4% 4%
5% 5%6% 6%
7%
2% 2% 2% 2%1% 1%
PROTECTION

39
Figure 13: Children between the ages of 15-19 who are currently married
Total Akkar Baalbek-El Hermel
Beirut Bekaa El Nabatieh MountLebanon
North South
2019 2020
27% 27% 26% 26%29% 29% 29% 29% 29% 29%28%
34%31%
34% 34%37%
25% 25%23% 23%23%
15% 15%
20% 21% 21%24%
Twenty-four percent of girls aged 15-19 were married at the time of the survey, down from 27% in 2019. There was variability in rates of child marriage across governorates as can be seen in figure 13.
VIOLENT DISCIPLINE
CHILD MARRIAGE
Child marriage was measured as children between the ages of 15-19 who are currently married.
Violent discipline is any form of psychological, physical, or severe aggression.
Psychological aggression: if the child is shouted, yelled or screamed at; called an insulting name (dumb, lazy, etc.)
Any physical aggression: shook him/her; spanked, hit, or slapped; hit him/her on the bottom; hit or slapped on any part of the body.
Severe physical aggression: hit or slapped on the face.
Non-violent discipline: took away privileged; explained behavior; gave something else to do.
Children between the ages of 1 and 14 years of age who have experience any form of violent discipline decreased from last year at 66% to 57% in 2020. The highest rate of violent discipline was reported in the Bekaa governorate (80%) and the lowest in Mount Lebanon (38%). There were no significant differences between girls (57%) and boys (58%). Caregivers who have used violent discipline methods mainly resort to psychological violence (48%) or physical violence (43%), while severe violence was reported at 6% (half the rate reported in 2019 at 12%). Furthermore, 63% of caregivers reported using only non-violent discipline methods.
Figure 14: Children between 1 and 14 years old that have experienced at least one form of violent discipline
Total Akkar Baalbek-El Hermel
Beirut Bekaa ElNabatieh
MountLebanon
North Males Females Between1 and 4
years old
Between5 and 14years old
South
57%
73%
53% 51%
80% 77%
38%
50% 55% 58% 57% 57%57%
2018
PROTECTION

40
Anne
x 2:
Leg
al re
side
ncy
and
birt
h re
gist
ratio
n

4241
SHELTERIn Lebanon, most of the Syrian refugee population lives in cities and villages in the context of the governmental policy prohibiting the establishment of formal refugee camps. The remaining fraction lives in spontaneously set-up tented settlements throughout the country. Through the VASyR, the physical conditions of these shelters were assessed as well as the occupancy agreements and rental costs. Mobility of households between places of residence, including for reasons of eviction, has also been examined. The COVID-19 outbreak in 2020 limited the ability of enumerators to observe the shelter conditions of crowded shelters.
- The distribution of Syrian refugee households across the main shelter types remained mostly stable with the majority (67%) living in residential structures, 21% in non-permanent shelters and 12% in non-residential structures. - Rent costs for all shelter types combined remained like last year at LBP 264,000.- Rent costs in non-permanent (LBP 93,419) and non-residential (LBP 256,365) shelters increased by 25% and 22% respectively compared to 2019.- Geographical trends remained similar with the highest rental fees reported in Beirut (LBP 454,897) and the lowest in Baalbek- El Hermel (LBP 133,864).- Like last year, over half (58%) of Syrian refugee households were living in shelters that were either overcrowded, had conditions below humanitarian standards and/or were in danger of collapse. - Close to 32% of Syrian refugee households were living in shelters that were below humanitarian standards and an additional 11% were living in dangerous conditions. Almost one third of households continued to live in overcrowded conditions of less than 4.5m2/person. - Nineteen percent of households that moved in the past 12 months did so because they were evicted (3% of all households). Inability to pay rent was the most cited reason for those evicted (86%), followed by evictions due to measures implemented locally in the context of COVID-19 (7%).
KEY FINDINGS
© UNHCR/Diego Ibarra Sánchez

43
Figure 1: Shelter type by governorate
SHELTER
SHELTER TYPE, RENT AND OCCUPANCY AGREEMENTS
1. Apartment/house2. Concierge room in residential building3. Hotel room
1. Factory2. Workshop3. Farm4. Active construction site5. Shop6. Agricultural/engine/pump room7. Warehouse8. School
1. Tent2. Prefab unit
Shelter type
Residential
Non-Residential
Non-Permanent
Most households (67%) continued to live in residential structures with 21% residing in non-permanent shelters. The latter were located primarily in Baalbek-El Hermel, Bekaa and Akkar.
Average monthly rent costs remained stable at LBP 264,642. Rent costs in non-permanent (LBP 93,419) and non-residential (LBP 256,365) shelters increased by 25% and 22% respectively compared to 2019.
Figure 2: Rental fee by shelter type (LBP)
52,0
00
204,
000
328,
500
328,
500
85,5
00
223,
500
331,
500
331,
500
75,0
00
199,
500
300,
000
300,
000
93,4
19
256,
365
314,
230
314,
230
2017 2018 2019 2020
Non-Permanent Non-Residential Residential All types
Total Akkar Baalbek-El Hermel
Beirut Bekaa El Nabatieh MountLebanon
North South
Residential Non-Residential Non-Permanent
21%
12%12%
59% 6%
6%
93%12%
44%39%
67%
29%55%
1%
44%
9%
6%12%
18% 20%
71%72%86%85%
9%2%
10%
Akkar
North
Beirut
Baalbek-El Hermel
MountLebanon
Bekaa
ElNabatieh
South

44
SHELTER
Rent prices remained similar across governorates except for the Bekaa where a 10% increase was reported, mainly driven by the rise in rent in non-permanent shelters. Majority of households (92%) paid their rent on a monthly basis. This was different for households living in non-permanent shelters where 38% paid their rent on a yearly basis.
Most households (82%) were paying direct rental fees to their landlord while a smaller number (6%) was working in exchange for rent- more commonly in non-residential shelters. Some families (9%) were being hosted for free.
Most households that were renting (98%) had verbal agreements with their landlord as opposed to written lease agreements. Of the few that had written lease agreements, only a quarter registered with the municipality of their area and under only 18% reported paying municipal taxes.
In 2020, because of the economic crisis and COVID-19 outbreak, 9 out of 10 were found to be living below the minimum expenditure basket. A slightly larger share of households living in non-permanent shelters were also living under the survival minimum expenditure basket (95%), as compared to other shelter types where 87% were living in extreme poverty.
The highest rental fees were reported in Beirut (LBP 454,897) and the lowest in Baalbek-El Hermel (LBP 133,864).
Figure 3: Rental fee by governorate (LBP)
Figure 4: Most important reason for selecting the current shelter
55%59%
33%
18%13%
47%
13% 13%7% 7% 7%
10% 10%4% 4%
Total Akkar Baalbek-El Hermel
Rent cost Proximity to family or relatives
Proximity to work/livelihoods
Being far from theconflict
Other
Beirut Bekaa El Nabatieh MountLebanon
North South
2019 2020
266,
254
173,
191
262,
625
488,
335
302,
075
129,
985
365,
262
165,
090
283,
721
264,
642
182,
097
276,
002
454,
897
288,
761
133,
864
359,
818
179,
188
271,
869
Similar to last year, for over half of families living in residential and non-residential structures, rental cost was cited as the main reason for choosing the current accomodation; In non-permanent structures, proximity to relatives was the the most important factor (47%) compared to residential (18%) and non-residential structures (13%). For female headed households, rental cost was also the most cited reason for choosing a shelter (44.5%) followed by being close to relatives (33%); a signficantly higher reason than male headed households where only 21% reported being close to relatives as the most important factor. As for male headed households, only 21% reported proximity to relatives as the most important factor.
Residential Non-Residential Non-Permanent

45
Figure 6: Shelter conditions
Like last year, over half (58%) of Syrian refugee households were living in shelters that were either overcrowded, had conditions below humanitarian standards and/or were in danger of collapse1.
Figure 5: Households living below minimum expenditure basket (MEB) per shelter type
Figure 7: Overcrowded (<4.5m2/person)
Residential Non-Residential Non-Permanent
90% 91% 96%
10% 9% 4%Above MEB(>LBP 350,200 per capita)
Below MEB(<LBP 350,200 per capita)
SHELTER CONDITIONS
OVERCROWDINGTwenty nine percent of households (29%) continued to live in overcrowded shelters, a slight improvement compared to 2019 (32%) and 2018 (34%). Overcrowded shelters are defined as having less than 4.5m2/person. Overcrowding was more common in non-permanent (38.5%) and non-residential (35%) shelters, compared to residential shelters (25%).
Twenty percent of surveyed households shared latrines with other families. Sharing of latrines in non-permanent structures was significantly higher (33%) compared to residential (16%) and non-residential (15%). Like last year, 3% of households were using latrines that were shared by 15 people or more; half of them were households in non-permanent shelters.
ResidentialNon-Residential
Non-Permanent
Total
32%
46%42%
35%
26% 25%
38%
29%
2019 2020
1COVID-19 restrictions prohibited enumerators from visually assessing the shelter condition in overcrowded shelters; this has prompted a change in the methodology used to assess shelter conditions in 2020.
live in overcrowded or in substandard or dangerous
conditions
58%42%
33%
11%
14%No Adverse Condition, not overcrowded
Dangerous
Substandard
Overcrowded with no adverse condition
SHELTER

46
Figure 9: Prevalence of shelter conditions
44% of Syrian refugee households were living in either shelter conditions that were below humanitarian standards or in danger of collapse. Baalbek-El Hermel had the highest rates of households living in substandard or dangerous conditions (68%), followed by the Bekaa (60%) and the South (53%).
Figure 8: Percentage of households living in substandard conditions
PHYSICAL CONDITIONS
The South had the highest percentage of households living in dangerous conditions (35%).
Shelter conditionsInadequate physical conditions1- Windows/doors were not sealed to natural elements 2- Leaking roof Leakage / rottenness in the walls / floors 3- Water pipes not functional N/A 4- Sanitation pipes not functional N/A5- Latrine/toilet was not useable (damaged, full, no handwashing facilities, etc.) N/A 6- Bathing/washing facilities were not useable (damaged, no privacy, etc.) N/A 7- Electricity installation/connection were not adequately installed or not safe 8- Damaged walls
Dangerous conditions1- Shelter Structure in danger of collapse 2- Damaged roof 3- Damaged columns
Each shelter type is considered inadequate depending on the number of observed physical conditions:
Residential structuresThree conditions and above
Non-residential structuresOne condition and above
Non-permanent structuresAll refugees living in non-permanent structures (informal settlements) were considered to be living in physical substandard conditions. Those refugees were at higher risk of being affected by extreme weather, fire, etc..
2019 2020
Shelters with leaking roof
Shelters with leakage/rot in the walls
Shelters with unsealed windows/doors
Shelters with water pipes not functional
Shelters with latrine/toilet not usable
Shelters with inadequate electricity installment
Shelters with sanitation pipes not functional
Shelters with damaged roof
Shelters with damaged walls
Shelters with damaged columns
Shelters in danger of collapse
Shelters with bathing/washing facilities not usable
56%50%
54%44%
31%22%
20%12%
12%
9%
9%
9%
7%7%7%
6%7%
16%
14%
14%
13%
13%
10%
10%
SHELTER
Total Akkar Baalbek-El Hermel
Beirut Bekaa El Nabatieh MountLebanon
North South
56% 66%
32%
70%
40%64% 64%
47%69%
33% 29%61%
16%55%
24% 24%
18%
18%
11% 5% 7% 14% 5% 12% 12%35%
13%
Dangerous Substandard No adverse condition

47
MOBILITY AND MOVEMENT
Fifteen percent of households reported changing their accommodation in the past 12 months (a decrease from 20% in 2019), three quarters of which occurred in the previous 6 months, mainly due to rent being too expensive.
Nineteen percent of households that moved in the past 12 months did so because they were evicted (3% of all households moved because of eviction). Inability to pay rent was the most cited reason for those evicted (86%), followed by evictions due to measures implemented locally in the context of COVID-19 (7%).
A small proportion (5%) of households were planning to move within the coming 6 months, a quarter of which due to threat/fear of evictions.
At the time of interview, 5% of households were living under an eviction notice, the majority of which (82%) were expected to leave within the next month. For almost all under eviction notice, the notices were issued by the landlord.
Figure 10: Reasons for changing accommodation in the past 12 months(percentage out of households who changed accommodation)
2019 2020
Rent too expensive
Eviction
Shelter and WASH Conditions not acceptable
Tension with landlord
Lack of livelihood opportunities in the area / location
Tension with community / restrictive measures
End of free hosting agreement / rent assistance
Security threats or Harassment
Other reasons
End of rental agreement
40%37%
12%19%
15%8%
Not enough privacy for my family
7%
7%
3%
3%3%3%
1%
1%
1%2%
2%
6%
4%
5%
12%11%
Figure 11: Eviction threats
Figure 12: Percentage of households living under an eviction threat
3%
5%
5% 5%
2%3% 3%
6%7% 7%
6%
4%
2018
2019
2020
Total Akkar Baalbek-El Hermel
Beirut Bekaa El Nabatieh MountLebanon
North South
SHELTER

48
Anne
x 3:
Typ
e of
hou
sing
and
type
of o
ccup
ancy
Gen
der o
f the
hea
d of
hou
seho
lds
Type
of o
ccup
ancy

49
Anne
x 4:
Typ
e of
rent
al a
gree
men
t, re
ntal
cos
ts, o
verc
row
ding
and
she
lter c
ondi
tions
Gen
der o
f the
hea
d of
hou
seho
lds

5150
WASHWATER, SANITATION, AND HYGIENE This chapter examined the water, sanitation, and hygiene situation of Syrian refugee households in Lebanon.
- In terms of access to drinking water, 87% of household members had access to an improved drinking water source, like last year. Bottled mineral water remained to be the highest source that households rely on for drinking water, though it dropped from 42% in 2019 to 37% in 2020;- When asked whether a water source was readily available on premise, 69% of household members had it so, an 8-percentage point improvement from last year;- The majority (91%) of household members had access to improved sanitation facilities. The rate went down to 84% and 78% when the shelter type was non-permanent or non-residential, respectively. The use of a basic sanitation service, which is an improved not shared sanitation facility, was found to be at 77%, with the lowest rate being observed in Akkar governorate at 53%.
KEY FINDINGS
© UNICEF

52
Improved drinking water sources:• Household water tap/water network• Bottled mineral water• Water tank/trucked water• Protected borehole• Piped water to yard/lot• Protected spring• Protected well
Unimproved drinking water sources• Public/shared water stand/taps• Unprotected borehole/well/spring• Rainwater
Basic drinking water sources• Water source in dwelling/yard/plot• Water source within 30 minutes round trip
collection time
WASH
The majority (87%) of Syrian refugee households had access to improved drinking water sources, a slightly similar result to last year, representing a governorate level decrease, mostly El Nabatieh with a decrease of 14 percentage points. Furthermore, the rates of improved drinking water sources in 2020 varied across governorates, with a notable decrease of 14% in the governorate of El Nabatieh (see figure 1).
It should be noted that VASyR did not measure the quality of the water provided.
ACCESS TO DRINKING WATER
Figure 1: Use of improved drinking water sources
Figure 2: HH main source of drinking water from 2015 to 2019 (Improved Water Sources)
Total Akkar
Bottled Tap Trucked Other
Baalbek-El Hermel
Beirut Bekaa El Nabatieh MountLebanon
North South
2019 2020
2019 20202017 20182015 2016
88% 88%91% 88%87%95%
36% 34%
21%
8%
16%
10% 12%
95% 95%94%
35%
99%92%
86% 89% 93% 90% 93%91% 91%83%86% 86%
70% 74% 74%
98%90%
76%
SOURCES OF DRINKING WATER
2018

53
WASH
Although bottled mineral water remained the main source of drinking water as in the previous year, there was a decrease from 42% in 2019 to 37% in 2020. Bottled mineral water was followed by tap water/water network (21%). The Distribution of the main sources of drinking water can be seen in figure 2.
The distribution varied widely across governorates. For example, while Beirut, Mount Lebanon, and the South
2019 2020
showed the highest rates of use of bottled water (80%, 64%, and 58% respectively), the Bekaa and Baalbek- El Hermel governorates showed relatively low use of bottled mineral water (18% and 15% respectively).
The main sources of drinking water also varied considerably among different shelter types, as can be seen in figure 3.
Figure 3: Sources of drinking water by shelter type
2019Bottled mineral water Water tap/water network Protected borehole/well/
spring/piped to yard/plotWater tank/trucked water
2019 2019 20192020 2020 2020 2020
34%
51%46%
25% 25%27%
9%
15%15%12%
16%18%
3%7%
48% 50%
5%
13%
24%
7% 5%
30%
13%14%
Residential Non-Residential Non-Permanent
The results confirmed the previous year trend that on one hand, households in residential and non-residential shelters relied most on bottled mineral water, at 51% and 34% respectively. On the other hand, households in non-
permanent shelters relied most often on water tank or trucked water, at 21% when provided by UN/NGO and at 27% by a private provider.
BASIC DRINKING WATER SERVICES
The use of basic drinking water service was reported at 83%. The below graph shows the variation across governorates and shelter types.
Figure 4: Use of basic drinking water service, by governorate and shelter type
86%83%93%
86% 86% 86%87% 87%92% 88% 89%81% 80%
90% 90%82% 82%84% 84%81%
72% 72% 71%76%
Total Akkar Baalbek-El Hermel
Beirut Bekaa ElNabatieh
MountLebanon
North ResidentialSouth Non-residential
Non-permanent
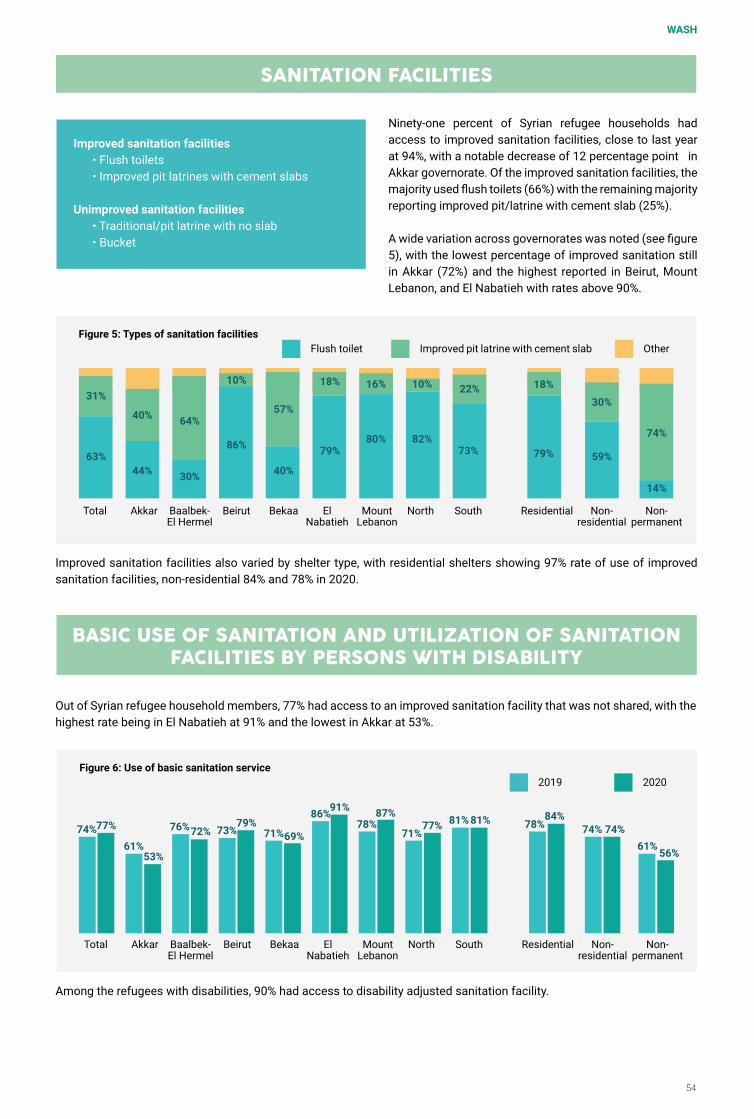
54
Improved sanitation facilities• Flush toilets• Improved pit latrines with cement slabs
Unimproved sanitation facilities• Traditional/pit latrine with no slab• Bucket
Ninety-one percent of Syrian refugee households had access to improved sanitation facilities, close to last year at 94%, with a notable decrease of 12 percentage point in Akkar governorate. Of the improved sanitation facilities, the majority used flush toilets (66%) with the remaining majority reporting improved pit/latrine with cement slab (25%).
A wide variation across governorates was noted (see figure 5), with the lowest percentage of improved sanitation still in Akkar (72%) and the highest reported in Beirut, Mount Lebanon, and El Nabatieh with rates above 90%.
SANITATION FACILITIES
Improved pit latrine with cement slab OtherFigure 5: Types of sanitation facilities
63%44% 30%
86%
40%
57%
79%80% 82%
73%
22%10%16%18%10%
64%40%
31%
79%
18%
59%
14%
74%
30%
Total Akkar Baalbek-El Hermel
Beirut Bekaa ElNabatieh
MountLebanon
North ResidentialSouth Non-residential
Non-permanent
Flush toilet
Improved sanitation facilities also varied by shelter type, with residential shelters showing 97% rate of use of improved sanitation facilities, non-residential 84% and 78% in 2020.
Among the refugees with disabilities, 90% had access to disability adjusted sanitation facility.
BASIC USE OF SANITATION AND UTILIZATION OF SANITATION FACILITIES BY PERSONS WITH DISABILITY
2019 2020
Out of Syrian refugee household members, 77% had access to an improved sanitation facility that was not shared, with the highest rate being in El Nabatieh at 91% and the lowest in Akkar at 53%.
Figure 6: Use of basic sanitation service
74%77%
61%53%
76%72% 73%79%
71%77%
71%69%
86%91%81% 81%78% 78% 74% 74%
61% 56%
84%87%
Total Akkar Baalbek-El Hermel
Beirut Bekaa ElNabatieh
MountLebanon
North ResidentialSouth Non-residential
Non-permanent
WASH

5655
- Participation in organized learning, which is the percentage of children between 3 and 5 years of age who were attending an early education program at the time of the survey, remained the same as last year at 16%. As for children between 6 and 14 years of age, enrollment remained stable at 67%. The percentage of children between 15 and 17 years of age increased by 7 percentage points reaching 29% in 2020.- Noteworthy, following school closure by the Ministry of Education and Higher Education (MEHE) due to COVID-19 pandemic, most students were not able to continue learning in person at school. The rates of students who were able to continue distance learning via online increased by age, 12% for ages between 3 and 5, 17% for 6 to 14 and 15 to 17, and 23% for those between 18 and 24 years old. Lack of or insufficient internet was cited by half as the barrier to accessing online learning.- The gender parity indices indicated that the share of girls enrolled in schools, remained equal to that boys at primary level. The share of girls was reported to be slightly higher than that of boys at lower secondary (1.14) and lower at higher secondary.
KEY FINDINGS
EDUCATION
© UNHCR/Diego Ibarra Sánchez

57
Participation in organized learning: the share of children 3 to 5 years of age who are enrolled in an early childhood education program, such as nursery, KG1, and KG2.
Gender Parity Index: the number of girls enrolled in school over the number of boys enrolled in school. If the gender parity index is over 1, it means that school enrollment is higher for girls than boys.
NEET: the share of youth (15 to 24 years of age) who are not employed, not in education or training.
PRE-PRIMARY SCHOOL
ENROLLMENT IN PRIMARY AND SECONDARY SCHOOLS
EDUCATION
The percentage of children between 3 and 5 years of age who were attending an early childhood education program was 16%. The highest rates of participation in organized learning for children between 3 and 5 years of age was
As for enrollment in schools, 67% of children of primary school age (6 to 14 years old) were enrolled in the scholastic year 2019-2020, similar results to last year. The highest rate was reported in Beirut at 81% and the lowest in Bekaa at 54%. Despite the national primary enrollment being similar to last year, Baalbek-El Hermel governorate showed an increase from 57% in 2019 to 74% in 2020. Enrollment rates were similar for girls and boys.
Figure 1: Participation rate in organized learning
16%
25%
20%
11% 11%
17% 17% 16%16%13%
18%
Total Akkar Baalbek-El Hermel
Beirut Bekaa El Nabatieh MountLebanon
North MaleSouth Female
Figure 2: Primary school Age Enrollment (6 to 14 years of age)
Total Akkar Baalbek-El Hermel
Beirut Bekaa El Nabatieh MountLebanon
North South
2019 2020
69% 67%
80%75%
57%
74%79% 81% 81%
55% 54%
76% 77%71% 71%
64%72%
67%
The rate of children between 15 to 17 years old enrolled in schools at the time of the survey increased from 22% in 2019 to 29% in 2020. Noteworthy, there was a 20 percentage point decrease in secondary school enrollment in Bekaa. Also, there was a difference between boys and girls, at 32% and 27% respectively.
reported in the governorates of Akkar (25%) and Baalbek-El Hermel (20%) and the lowest in the governorates of Bekaa and Beirut at 11% each. The difference between girls and boys was negligible, at 16%.

58
REASONS FOR NOT BEING ENROLLED IN SCHOOL
Similar to previous years, the three most common reasons for not being enrolled in school, were the child not in age for school (36%), inability to afford the cost of educational materials (20%), and the cost of transportation to school (15%). Additional reasons which were cited, albeit to a lower extent, were that school did not allow children to be enrolled (9%) or children did not attend due to work (6%)
The results vary significantly between the different age groups, as shown in the figure below.
Figure 4: Percentage out of the children between 3 and 17 years of age not enrolled in school
Figure 5: Main reasons for not being enrolled in school, across age groups
36%
78%
8% 11%
30%21%
7%
25%16%
2%12%
3% 3% 4% 8%5% 5%
20%
0% 0% 0% 0% 0% 0%
10%
36%
20% 21%19%
15% 15%
9% 9%8%6% 6%
3% 3% 3% 3% 3%2% 2% 2%0%
4%7%
5%
10%10%
16%
35%
Not in age for school
Not in age for school
Cost of educational
materials
Cost of educational
materials
Cost of transportation
to school
Cost of transportation
to school
School did not allow
enrollment
Non-Formal/Informal
education program
Non-Formal/Informal
education program
Not attending
due to work
Not attending
due to work
Difficulty with school curriculum
Difficulty with school curriculum
Learning difficulties
Learning difficulties
Not attending
due to marriage
Not attending
due to marriage
Figure 3: Secondary school Age Enrollment (15 to 17 years of age)
Total Akkar Baalbek-El Hermel
Beirut Bekaa El Nabatieh MountLebanon
North South
2019 2020
22%29% 33% 30%
14%
29%39%
44%
16% 19% 24% 24% 21% 21%31% 35%
27%36%
Males FemalesTotal
6 to 14 years old 15 to 17 years old3 to 5 years old
or due to marriage (2%). The trends remained consistent for boys and girls; however, there were differences in the estimates. Specifically, when the reason behind not enrolling was due to work, boys were three times at greater risk than girls (9% vs. 3%); when the reason behind not enrolling was due to marriage, only girls were at risk (4%).
EDUCATION

59
GENDER PARITY INDICES
SCHOOLING OF YOUTH AGED 15-24
Figure 6: Gender parity indexThe gender parity index is the proportion of girls enrolled in school over the proportion of boys enrolled in school. If the gender parity index is over 1, it means that school enrollment is higher for girls than boys.
The number of girls in primary school was equal to that of boys. The ratio favored girls in the lower secondary level and the opposite at upper secondary where the number of girls was lower than that of boys.
The share of Syrian refugee youths between the ages of 15 and 24 years who were enrolled in school was 13%. The highest was reported in the governorate of Beirut (21%) and the lowest in the governorate of Bekaa (7%). There was no difference across gender with approximately equal rates between girls and boys. The rates considerably differ between age groups, with younger ages (15-18) having 26% enrollment rates, while those 19-24 only reaching 3%. Enrollment rates were similar for girls and boys, among the two youth age groups.
The main reasons for school dropout among youth were detailed in Figure 5, and showed variations across age-range and between girls and boys. The main reasons remained similar to last year, although there have been some changes in the estimates of each reasons. Additionally, the prominent reasons have changed since last year. For example, not attending school due to work was the highest reason in 2019. In 2020, the main reported reasons were not attending due to marriage, not attending due to work, or the cost of educational materials.
Primary Lower Secondary Upper Secondary
0.91 0.93 1 1.13 1.13 1.140.86 0.95
1.32
2018 2019 2020
Figure 7: Percentage of youth (15 to 24 years of age) enrolled in formal education
Total Akkar Baalbek-El Hermel
Beirut Bekaa El Nabatieh MountLebanon
North South
2019 2020
11%13% 14% 14%
17%
21%
16%
7% 7%10% 10%11% 11%11%
14% 14%17%
15%
Figure 8: Main reasons for youths (15-24) not being enrolled in formal education
Not attending due to marriage
Not attending due to work
Cost of educational
materials
Cost of transportation to
school
Difficulties at school with curriculum or
language of instruction
Other
Males FemalesTotal
29%
22%
37%
7% 7% 6% 5%8%
17%11%11% 10% 10%
13%11%15%
19%
46%
EDUCATION

60
EDUCATION
NOT IN EDUCATION, EMPLOYMENT, OR TRAINING (NEET)
NEET rates indicate an important focus on the need of Syrian refugee youths (15-24 years) in need of education and improved access to decent work conditions and income generating opportunities.
Similar to last year, the NEET rate among Syrian refugees remained at 67%. The NEET rate was higher among girls than boys, 78% vs. 54% respectively. The rates increased with age ; for youths between 19 and 24 years of age , the NEET was at 75% and for youths 15 to 18 years of age , at 57%. Rates of NEET among Syrian refugee youth varied widely across governorates, with the highest in Bekaa (78%) and the lowest in Beirut and the South (57%).
Figure 9: Main reasons for youths (15-18) not being enrolled in formal education
Figure 10: Main reasons for youths (19-24) not being enrolled in formal education
Not attending due to marriage
Not attending due to marriage
Not attending due to work
Not attending due to work
Cost of educational
materials
Cost of educational
materials
Cost of transportation to
school
Cost of transportation to
school
Difficulties at school with
curriculum or language of instruction
Difficulties at school with
curriculum or language of instruction
Alreadygraduated
Not attending due to
learning difficulty
Other
Other
13%
39%
20%
23%
30%
43%
9%
6%
8% 8%6% 6%
10%
21%
13%
11%
5% 5%0% 0% 0%
6%
13%
19%
12%
15%
8% 7% 7%8%
15%
13%
14%
10%
23%
15%
25%
58%
0% 0%0%
18%
Figure 11: NEET for Syrian youths
Total Akkar Baalbek-El Hermel
Beirut Bekaa El Nabatieh MountLebanon
North Male FemaleSouth
67%57%
75%70%
61%
79%
63%54%
72% 72%78%
73%
57% 57% 57% 57%54%50%47%
66% 66%66% 63% 63% 64%
89%
69%
86%
59%52% 52%
48%
78%
15 to 18 19 to 2415 to 24
Males FemalesTotal
Males FemalesTotal

6261
© UNDP
HEALTHHealth services are available to refugees through primary health care fixed and mobile outlets and hospitals. Through the VASyR, ability of households to access needed care has been examined as well as the barriers to healthcare access. VASyR did not reflect on the quality of the received care. Reported access included all types of care accessed by refugees. Moreover, knowledge and access to COVID-19 related services were examined, in addition to child birth details (where deliveries took place). The assessment has also examined the proportion of children under 2 years of age who were suffering from at least one disease and needed hospitalization or doctor’s consultation.
- There has been a decrease in both demand for primary health care and hospital care since 2019.- Access to primary health care remained stable at 90%, while access to hospital care increased slightly to 87% from 81% in 2019.- For both primary and hospital care, cost was, by far, the main barrier to accessing the needed care, rather than physical limitations. This included direct and indirect costs. Direct such as treatment fees or doctor’s fees and indirect such as transportation costs with the share of households citing transportation costs as a barrier to primary health care having increased. - The share of refugee children under the age of two who suffered at least from one disease in the two weeks prior to the survey decreased by more than half to 23% in 2020, compared to 48% in 2019.
KEY FINDINGS

63
PRIMARY HEALTH CARE
Primary health care (PHC) refers to health care that does not require hospital admission. This includes services such as: vaccination, medication for acute and chronic conditions, non-communicable diseases care, sexual and reproductive healthcare, malnutrition screening and management, mental healthcare, dental care, basic laboratory and diagnostics as well as health promotion. Primary healthcare fixed outlets are either primary health care centers (PHCCs) that are part of the Ministry of Public Health’s (MoPH) network or dispensaries outside the MoPH’s network; other types of primary health care fixed outlets include private clinics and pharmacies. Primary health care mobile outlets are referred to as mobile medical units.
It is worth noting that need for care is often dependent on seasonal fluctuations of incidence of certain diseases and data collection for the 2019 and 2020 VASyR took place at different times in the year (spring of 2019 and fall of 2020). Demand for PHC services decreased since 2019, with 57% of families reporting that at least one household member required PHC in the past six months, compared to 63% in 2019, 54% in 2018 and 46% in 2017. The decreased demand can be explained by seasonal variations of incidence of certain diseases and the fact that 2020 VASyR was conducted during a different time-period compared to
2019. Other possible reasons might be related to a change in health seeking behaviors due to the ongoing crises and financial hardship where households are not prioritizing health needs and are not considering preventive or primary health care as a necessity. COVID-19 situation and restrictive preventive measures implemented at different levels might also have impacted health seeking behaviors and therefore the perceived need for healthcare. Baalbek-El Hermel was the only governorate where demand for PHC increased since 2019 (79% compared to 64%). While at the national level, ability to access PHC remained high with only 10% of households reporting that they were unable to access the needed PHC, geographical differences were noted. In the South and El Nabatieh, share of households that did not have access to needed care increased drastically from 8% and 3% in 2019 to 26% and 14% in 2020, respectively. In Mount Lebanon, the trend was inversed with 16% of families reporting that they were unable to access the needed PHC, compared to 26% in 2019.
Similar to trends noted in previous years, a larger proportion of families residing in non-permanent shelters reported requiring PHC (75%), compared to those in residential (47%) or non-residential (51%) shelters.
Total
Total
Baalbek-El Hermel
Baalbek-El Hermel
Beirut
Beirut
Bekaa
Bekaa
El Nabatieh
El Nabatieh
MountLebanon
MountLebanon
North
North
South
South
2019 2020
2019 2020
63%
10% 10%
57% 59%
3% 3% 3%
47%
0%
64%
4%
79%
2%
49%
12%
37%
16% 16%
86%
8% 8%
86%
66%77%
7%
76%64%
14%10%
46% 43% 43%
58%
26% 26%
2019
2019
2020
2020
Figure 1: Share of households that reported requiring PHC services in the past six months, by governorate
Figure 2: Share of households that required PHC in the past six months but did not receive it, by governorate
Akkar
Akkar
HEALTH

64
The most commonly cited PHC service that was not accessed was consultations (85%), followed by medications (60%). For 2020, despite of the COVID-19 outbreak which was a great barrier to accessing health care, cost remained the overwhelmingly largest barrier to receiving the needed primary health care, including the costs of drugs (77%), doctors’ fees (73%) and transportation costs (49%). This further highlights the increasing financial hardship that is resulting from the multi-faceted economic, financial, socio-political and medical crisis. Compared to 2019, the share of households citing transportation costs and costs of drugs increased substantially. Other, much less commonly cited reasons (3% or less) included being rejected by the facility, inadequate treatment, distance, fear of COVID-19, restricted movement, or not knowing where to go.
Almost all the households reported accessing PHC in Lebanon, with only 1% reported having received PHC in Syria. Most households received primary health care through a primary health care outlet (55%). share of households that reported receiving PHC at a pharmacy increased reaching 25% in 2020, compared to 12% in 2019, while those who accessed services through a private doctor remained stable (18% in 2020). For those who accessed services at a private doctor’s clinic, the majority (51%) cited trust in the
2019 2020
70%
55%
12%
25%17% 18%
1% 1% 1%0%
2019 2020
2019 2020
Figure 3: Places where Primay Health Care Services were accessed in Lebanon
Primary health care outlet
Pharmacy Private doctor's clinic
Other Mobile medical unit
physician as the main reason, compared to 60% in 2019. In 2020, proximity to the doctor’s clinic was cited by 45% of families as the reason for using this service (compared to 22% in 2019).
The majority of families reported paying for the PHC received in full (54%) while 40% reported paying a discounted price. Five per cent reported receiving the service for free.
Figure 4: Primary health care services that were not accessed
Consultation
Medication
Mental health services
Other services
Sexual and/or reproductive health services
Vaccination
COVID-19 treatment
8%
85%
69%
6%
4%
3%
Figure 5: Barriers to accessing primary health care services
Transportation cost Doctors' fees Cost of drugs
0%
28%
49%
75% 73%
57%
77%
HEALTH

65
HOSPITAL CARE
Similar to PHC, the reported need for hospital care decreased with 16% of households reporting to have needed hospital care in the past six months, compared to 22% in 2019. While this decrease was noted across all the governorates, South and El Nabatieh recorded the highest rates of demand for hospital care. Access to the care, however, increased slightly with 87% reporting being able to receive it (81% in 2019). Baalbek- El Hermel and Mount Lebanon saw the most substantial improvements in access to hospital care,
while rates deteriorated in the South. Unlike PHC, trends across the shelter types did not significantly differ.
As with PHC, few (2%) of the interviewed households reported that they accessed the hospital care in Syria. For those who have accessed it in Lebanon, 46% reported paying for the service in full while 42% reported having received a partial contribution from UNHCR. Six per cent reported having receive hospital care for free.
Total
Total
Baalbek-El Hermel
Baalbek-El Hermel
Beirut
Beirut
Bekaa
Bekaa
El Nabatieh
El Nabatieh
MountLebanon
MountLebanon
North
North
South
South
2019 2020
2019 2020
22%
19%
13%
16% 16%
22% 21% 21%
28% 28%26%
18%
12% 12%14%
19%17%
8%
6% 6%7%
24%
14%17%
12% 11%
16%18%
35%
7% 7%
16% 16%
24%
32% 31%
2019
2019
2020
2020
Figure 6: Share of households that reported requiring hospital care in the previous six months, by governorate
Figure 7: Share of households that required hospital care in the past six months but did not receive it, by governorate
Akkar
Akkar
Again, cost came up as the main barrier to accessing hospital care, much more so than physical barriers related to distance or accessibility to centers. The main cost barrier was the cost of treatment, followed by transportation costs. Eight percent of household cited that they were refused services due to their inability to secure a deposit.
HEALTH

66
HEALTH
Total Baalbek-El Hermel
Beirut Bekaa El Nabatieh MountLebanon
North South
2019 2020
76%68%
79%73% 70%
87%
67%
85%
62%53%
46%
68%61%
92% 92%
74% 71%84%
2019 2020Figure 9: Share of households that reported knowing where to access emergency health care services
Akkar
The share of households that reported knowing where to access emergency medical care or services declined slightly to 68% from 76% in 2019. The lowest rates remained to be in Beirut and Mount Lebanon.
Figure 8: Barriers to accessing hospital care
Cost of treatment
Transportation costs
Refusal due to the inability of the family to secure the hospital deposit
Other
Hospital required COVID-19 test
Fear of COVID-19
Inadequate welcoming/treatment by hospital staff
Security/concerns/fear of movement
Distance to the hospital
Refusal due to inavailability of beds
8%
84%
22%
4%
3%
2%
2%
2%
1%
0%
Of the children in the sample born after 2011, 64% were born in Lebanon. Almost all births (95%) were delivered in a hospital, with a small percentage reporting home delivery (5%) and less in other healthcare facilities (1%). Examined
The majority of households (68%) reported that they had received information related to COVID-19. The main type of information received was related to prevention and symptoms of COVID-19 (97%) followed by where to access
CHILD BIRTH DETAILS
KNOWLEDGE AND ACCESS TO COVID-19 RELATED SERVICES
over time, no significant difference was noted in terms of increases or changes in the proportion of children who were being delivered at home.
services (69%) and information on treatment (58%). However, only around half (51%) reported that they knew where to access services in the event that a household member was suspected to have contracted the virus.

67
Diarrhea Severe diarrhea Cough Respiratory infection
Fever Skin disease Other symptoms
2019 2020
83%75%
45%56%
73%
32%
14%20% 24%
19%7% 6% 6%
0%
2019 2020Figure 10: Types of sickness experiences by children aged 0-23 months who suffered from disease in the past two weeks.
CHILD HEALTH
The share of refugee children under the age of two who suffered at least from one disease in the two weeks prior to the survey decreased by more than half to 21% in 2020, compared to 48% in 2019. The most prominent disease was reported to be fever (75%) followed by diarrhea (55%).
The remaining diseases were reported at much lower rate with cough at 33%, respiratory infection at 20%, severe diarrhea at 19%, and skin diseases and other symptoms at 7%, each1.
The rate of children under 2 years of age who suffered from severe diarrhea which required hospitalization or a doctor’s consultation was reported to be 32%, an increase of 8 percentage point from 2019. In contrary, children who suffered from respiratory infection and required hospitalization or a doctor’s consultation decreased from 28% in 2019 to 23% in 2020.
1 Results on illness may be affected by COVID-19 related precautions taken during data collection where enumerators were instructed not to conduct interviews with families if any family member was exhibiting COVID-19 related symptoms.
HEALTH

68
BREASTFEEDING COMPLEMENTARY FEEDING
The assessment examined infant and young child feeding (IYCF) practices in Syrian refugee households. Information was collected on 855 children aged 6-23 months and 380 infants under six months old.
The share of infants under 6 months of age who were exclusively breastfed decreased by 12 percentage points from 2019, reaching 44% in 2020. As for children between 12 and 15 months, the rate of children who were fed breast-milk the day prior to the survey was almost the same, at 57%.
Complementary feeding included solid, semi-solid, soft foods or other liquids received during the previous day. The percentage of children between 6 and 8 months of age who received complementary feeding was at 35%, close to the 31% of the previous year.
KEY FINDINGS
INFANT AND YOUNG CHILD FEEDING PRACTICES
- There was a notable decrease of 12 percentage points in children under 6 months of age who received only breast milk the day prior to the survey, from 56% in 2019 to 44% in 2020.- Complementary feeding for children between 6 and 8 months was close to last year’s rate, at 35%.- The percentage of children between 6 and 23 who met the Minimum Diet Diversity decreased by 5 percentage points since last year, reaching 12%;- The Minimum Acceptable Meal Frequency for children between 6 and 23 months of age drastically decreased from 80% in 2019 to 51% in 2020.
CHILD NUTRITION
MINIMUM DIET DIVERSITY
According to the WHO guidelines (2008)1 for assessing infant and young child feeding practices, children 6-23 months old should consume a minimum of four food groups out of seven to meet the minimum diet diversity target, independent of age and breastfeeding status. The food groups are:
1- Grains, roots, and tubers;2- Pulses and nuts;3- Dairy products (milk, yogurt, cheese);4- Meats (red meat, fish, poultry, and liver/organ meats);5- Eggs;6- Vitamin-A rich fruits and vegetables;7-Other fruits and vegetables.
HEALTH
In 2018 and 2019, the share of children between the ages of 6 to 23 months who were fed a diverse diet, which consisted of four or more food groups, on the previous day was at 17%. In 2020, the share dropped to 12%.
Eleven percent of children aged 6 to 23 months living in households with a per capita expenditure below the Survival Minimum Expenditure Basket (SMEB) received foods from four or more food groups.
1 Available at: http://www.who.int/maternal_child_adolescent/ documents/9789241596664/en/.

69
Figure 7: Minimum dietary diversity for children between 6 and 23 months old
Figure 7: Minimum Acceptable Meal Frequency amongchildren between 6 and 23 months
WHO defines the minimum acceptable meal frequency for young children as follows:- 2 meals/day for breastfed infants (6 - 8 months old)- 3 meals/day for breastfed children (9 - 23 months old)- 4 meals/day for non-breastfed children (6 - 23 months old)
MINIMUM ACCEPTABLE MEAL FREQUENCY
From 2018 to 2019, the share of children between 6 -23 months who have received the minimum acceptable number of meals every day witnessed an increase of 16 percentage points reaching 80%. The same rate dropped by 29 percentage points, 51% in 2020. Among children who were breastfed, the minimum acceptable meal frequency was at 55%, as for those who were not breastfed the figure was 47%.
Less than 4
4 and more
None
2019 2020
Total Non-breastfedchildren
Breastfedchildren
88%82%
14%
0.5%
80%70%
47%
91%
55%51%
4%
11.5%
2019
2020
HEALTH

70
Anne
x 5:
Hou
seho
ld a
cces
s to
prim
ary
and
seco
ndar
y he
alth
car
e

7271
FOOD CONSUMPTIONFood consumption is the cornerstone of food security analysis. The indicators in this chapter captured the dimensions related to food consumption which were the basis for classifying households according to their food security status. Quantity of food was measured by the number of meals consumed, while quality and diversity were captured through the Food Consumption Score (FCS) and Household Dietary Diversity Score (HDDS).1
- Almost half of the Syrian refugees were with inacceptable food consumption (poor: 19.5%, borderline: 30.2%). The households with inadequate diet have doubled compared to the previous year (25% in 2019 vs. 50% in 2020). - The dietary diversity decreased in 2020 compared to 2019 with the Syrian households consuming less variety of food. 23% of households consumed 6.5 or more food groups per day in 2019, compared to 33% in 2019. A drastic decrease was observed in the Vitamin A daily consumption (48% in 2019 vs. 32.4% in 2020), as well as protein consumption which dropped by 25% (from 67% in 2019 to 42% in 2020) while iron daily intake remained negligible. This increase in improper diet indicated a risk of micronutrient deficiency. - Men-headed households were consuming a more diverse diet per day than women-headed households, where 34% of men-headed households consumed Vitamin A on a daily basis compared to 26% for their female counterparts. Similar difference was noticed in the protein’s daily consumption where men-headed households were consuming more proteins at 43% compared to 36% for their women counterparts.- Poor food consumption has drastically increased among governorates and districts. In terms of governorates, food consumption was the poorest in the South (39% poor food consumption) followed by the North (31%). As for districts, almost 58% of Syrian refugees residing in Saida had poor food Consumption followed by Hasbaya at 39%.- The decrease in the number of meals followed the trend of the food consumption between 2019 and 2020. The number of meals consumed by adults dropped from 2.2 in 2019 to 1.9 meals in 2020. Similarly, the number of meals consumed by children dropped from 2.8 in 2019 to 2.5 in 2020.
KEY FINDINGS
1Check Annex 13 for calculation and definition of Food Consumption Score © UNHCR / Houssam Hariri

73
Figure 3: Number of meals consumed by refugees per day
FOOD CONSUMPTION
Figure 1: Households with poor and borderline food consumption 2018 and 2019 by governorate
Total
2019 2019 2019 2019 2019 2019 2019 2019 20192020 2020 2020 2020 2020 2020 2020 2020 2020
Akkar Baalbek-El Hermel
Beirut Bekaa El Nabatieh MountLebanon
North South
Poor Borderline
10%
20%5%
30%
15%24%
18%23% 17%
22% 20%24%
11%18%16% 16%
32%32%
29%
39%
39%
28%
31% 14%25%1% 1%12%8% 8%2%3% 5%
5%5% 5%
19%
The food consumption levels of Syrian refugees have drastically deteriorated. In 2020, households with poor consumption level has substantially increased to 19.5%, around four times the 2019 reported figure (5%). Similarly, the households with borderline consumption level has increased by 1.5 times from last year (30% in 2020 vs. 20% in 2019).
Poor and borderline food consumption has increased in all households across all governorates in 2020 compared to 2019, with the highest inadequate diet (poor and borderline food consumption) reported in the North, South and Bekaa at 70%, 67% and 57% respectively. In terms of districts, the highest inadequate diets were reported in Saida (84%), Hasbaya (73%), Tripoli and Bcharre (72%).
Figure 2: Percentage of households with poor and borderline food consumption
0% - 10%
11% - 20%
21% - 40%
31% - 80%
>80%
AkkarAkkar TripoliTripoli
El Minieh-Dennie
El Minieh-Dennie
ZghartaZgharta
ElKoura
ElKoura HermelHermel
BcharreBcharre El BatrounEl Batroun
JbeilJbeil
KesrwaneKesrwane
El MetenEl Meten
ZahleZahle
RachayaRachaya
WestBekaa
WestBekaa
SaidaSaidaHasbaya
HasbayaMarjaayoun
Marjaayoun
BaabdaBaabdaAleyAley
BeirutBeirut
ChoufChouf
JezzineJezzine
BaalbekBaalbek
ElNabatieh
ElNabatieh
SourSourBent Jbeil
Bent Jbeil
NUMBER OF MEALS
Number of meals consumed by adults has dropped from 2.2 meals per day in 2019 to 1.9 meals per day in 2020. This figure, however, varied across the governorates. In fact, households across all governorates have reported consuming less meals in 2020 except in Baalbek-Hermel where there was a slight increase of 0.2; nevertheless, the largest drop was reported in Akkar and the South governorates (0.6 meal per day). Similar to 2019, households living in non-permanent shelters were consuming more meals (2.2 meals/day) than those living in non-residential or residential shelters (1.8 meals/day each).
2019 2020
Adults
Children
2018 2019 2020
2.2 2.2
2.8 2.5
1.9
3.0

74
FOOD CONSUMPTION
In 2020, the number of meals consumed by children declined from 2.8 in 2019 to 2.5 in 2020. Similar to adults, all households across all governorates witnessed a decrease in the number of meals consumed by children per day except in Baalbek-Hermel (slight increase of 0.3). The largest drop was reported in El Nabatieh (2.1 in 2020 vs. 2.4
DIETARY DIVERSITY
The dietary diversity has decreased between 2019 and 2020. The percentage of households consuming 6.5 or more food groups on a daily basis, has decreased by 10% (23% in 2020 vs. 33% in 2019). On a weekly basis, the percentage of households consuming 9 or more food groups has dropped substantially from 74% in 2019 to 44% in 2020. Furthermore, the share of households with poor dietary diversity has approximately tripled on a daily basis from 8% in 2019 to 21% in 2020 (Table 3). From a gender
Figure 4: Number of meals consumed by adults per day, by Governorate
Figure 5: Number of meals consumed by adults per day, by Governorate
Total
Total
Akkar
Akkar
Baalbek-El Hermel
Baalbek-El Hermel
Beirut
Beirut
Bekaa
Bekaa
El Nabatieh
El Nabatieh
MountLebanon
MountLebanon
North
North
South
South
2019 2020
2019 2020
2.2
2.8
2.2
2.9
2.4
3.2 3.2 3.2
2.4
3.4
2.42.3 2.3
1.9
2.5
1.92.1
2.4 2.4 2.4 2.6
2.1 2.1 2.2
2.12.12
2.8 2.8
21.7 1.7 1.7
1.4
2.3 2.3
in 2019), whereas the governorates with the least number of meals consumed by children per day were Mount and North Lebanon at 2.1 meals. Similar to 2019, children living in non-permanent shelters were consuming 3.1 meals per day, significantly higher than those living in non-residential (2.2 meals) and residential shelters (2.3 meals).
lens, 24.5% of female-headed households had a poor dietary diversity, consuming less than 4.5 food groups per day, in comparison to 20.7% of male-headed households.
Therefore, opposite to the past two years, poor dietary intake has increased fourfold in comparison to the previous year (16% in 2020 vs. 4% in 2019); similarly, less households were consuming more diversified food.
Table 1: HWDD and HDADD groups and mean in 2018 and 2019

75
Males Females
Figure 6: Mean of the food groups by gender of the head of household
Cereals/Tubers
Oil/Fat/Butter
Sugar/Sweet
Vegetables
Dairy Products
Legumes/Nuts/Other Nuts
Meat/Fish/Eggs
Fruits
6.56.6
5.85.9
5.75.6
3.63.8
2.52.8
1.51.6
1.21.4
0.30.3
Opposite to 2019, the share of households with low dietary diversity consuming less than 4.5 food groups per day in 2020 increased in all governorates compared to 2019 with the largest increase reported in the South governorate. Households with the highest percentage of low dietary diversity in 2019 were found in the South (53%) and the North (32%), followed by Mount Lebanon (30%). The highest percentages of households with a high dietary diversity, i.e. consuming 6.5 or more food groups, were in El Nabatieh (40%).
As shown in figure 6, the most consumed food group by households was cereals/ tubers followed by oil/ fat/ butter then sugar/sweets. The least consumed food groups were meat/fish/eggs followed by fruits. Male-headed households consumed more dairy products (2.8) including fresh/sour milk, yogurt, Lebneh and cheese – than female-headed households (2.5). Similarly, meat/fish/eggs were consumed more by male-headed households than their female counterparts (1.4 vs. 1.2). Additionally, vegetables were consumed more by male than female headed households (3.8 vs. 3.6). This might indicate that female-headed households had lower dietary diversity than their male counterparts.
FOOD CONSUMPTION SCORE NUTRITION
In terms of key nutrients intake, there was a substantial decline on all aspects, noting that the share of households who never consumed any of the three key nutrients (Vitamin A, Protein, and heme iron) has increased between 2019 and 2020. Moreover, a significant drop of 16% was observed in the Vitamin A daily consumption, from 48% in 2019 to 32% in 2020. Protein daily consumption has also declined by 25% (67% in 2019 vs. 42% in 2020) while iron daily intake remained negligible. The percentage of households who have never consumed heme iron increased from 48% in 2019 to 63.44% in 2020. This implied that around two out of three Syrian refugee households were at risk of developing anemia. The percentage of households that have never
consumed Protein in 2020 was five times the percentage reported last year (2% in 2019 vs. 10% in 2020). Similarly, the percentage of households that have never consumed Vitamin A was around four times the percentage observed last year (3.6% in 2019 vs. 15.3% in 2020). Contextualizing these results in terms of gender, men-headed households were consuming a more diverse diet per day than women-headed households. Men-headed households consumed on a daily basis Vitamin A at 34% and Protein at 43%, compared to women headed households at 26% and 36% respectively. The North was the governorate with the least daily consumption of Vitamin A (20%), Protein (24%) and iron (0%).
FOOD CONSUMPTION

76
FOOD CONSUMPTION
Figure 7: Food consumption nutrition score categories 2018-2019
2019 2019 20192020 2020 2020
Vitamine A Protein Iron
Consumed 1 to 6 times a Week
Daily Consumption
48%
48%
10%
32%
67%
42% 52%
48%
1%
36%
63%31%2%
52%
15%
48%
4%
Never Consumed
Annex 13: Food consumption score
The food consumption score (FCS) is based on dietary diversity (number of food groups consumed by households during the seven days prior to the survey), food frequency (number of days on which each food group is consumed during the seven days prior to the survey) and the relative nutritional importance of each food group. A weight was
The FCS can have a maximum value of 112, implying that each food was consumed every day for the last seven days. Households are then classified into three categories (poor, borderline and acceptable) on the basis of their FCS and standard thresholds. The cut-off points have been set at 28 and 42, as recommended by the WFP Emergency Food Security Assessment Handbook. This is to allow for the fact that oil and sugar are consumed extremely frequently among all households surveyed; the cut-off points have been heightened to avoid distorting the FCSs of those surveyed.
Food Consumption Score Nutrition (FCS-N)The way in which the FCS is analysed does not explicitly provide information on the main macronutrient (carbohydrate, fat, protein) and micronutrient (vitamins and minerals) adequacy and consequent potential risks of deficiencies of these nutrients, but the data recorded in the FCS module provides enough information to shed light on the consumption of these nutrients.
attributed to each food group according to its nutrient density. The food consumption score is calculated by multiplying the frequency of consumption of each food group (maximum of seven if a food group was consumed every day) by each food group weight and then averaging these scores.
WFP has developed an analytical method to utilize this data and provide information on specific nutrients – a tool called the FCS-N. While it does not identify individual nutrient intake, the ‘food consumption score nutrition quality analysis’ fills this gap at the household level, and attempts to improve the link between household food access/consumption and nutritional outcomes.
The analysis looks at how often a household consumed foods rich in a certain nutrient. The thesis of the FCS-N is that although the nutrient, for example Vitamin A, can be obtained from many foods, the number of times a household consumed food particularly rich in this nutrient can be used to assess likely adequacy of that nutrient. The FCS-N analysis is complementary to the standard FCS estimation.
The following two steps illustrate this analytical method using a hypothetical example.

77
Step 1. Aggregate the individual food groups into nutrient rich food groups. As the purpose of the analysis is to assess nutrient inadequacy by looking at the frequency of consumption of food groups rich in the nutrients of interest, we first need to create the nutrient-rich food groups. This is done by summing up the consumption f requency of the food sub- groups belonging to each nutrient-rich food group, following the FCS module table above:
- Vitamin A rich foods: dairy, organ meat, eggs, orange vegetables, green vegetables and orange fruits. 2. Protein rich foods: pulses, dairy, flesh meat, organ meat, fish and eggs. 3. Hem iron rich foods: flesh meat, organ meat and fish. The first three groups above (Vitamin A, Iron and Protein) are mandatory to be able to perform FCS-N.
- Categorize the Vitamin A rich groups (dairy, organ meat, orange vegetables, green vegetables, orange fruits) and sum up the frequencies of consumption of foods rich in Vitamin A.
- Categorize the protein rich groups (pulses/nuts, dairy, meat, organ meat, fish, eggs) and sum up the frequencies of consumption of foods rich in protein.
- Categorize the hem iron rich group (flesh meat, organ meat and fish) and sum up the of consumption of foods rich in hem iron.
Step 2. Build categories of frequency of food consumption groups. Based on the validation tests, frequency groups are classified according to the consumption frequency of:
- Never: 0 day- Sometimes: 1-6 days- At least daily: 7 (and/or more) days
For the purposes of analysis, the consumption frequencies of each nutrient rich food group are then recoded into three categories:
- 1 = 0 times (never consumed)- 2 = 1-6 times (consumed sometimes)- 3 = 7 times or more (consumed at least daily)- 2.1 Build the category of frequency of the Vitamin A
rich group- 2.2 Build the category of frequency of the protein
rich group- 2.3 Build the category of frequency of the hem iron
rich group
Reference:https: //resources.vam.wf p.org/node/87
Annex 14: Diet diversity annex
Household food access is defined as the ability to acquire a sufficient quality and quantity of food to meet all household members’ nutritional requirements for productive lives. Household dietary diversity, defined as the number of unique foods consumed by household members over a given period, has been validated to be a useful proxy for measuring household food access, particularly when resources for undertaking such measurement are scarce.
The number of different foods or food groups eaten over
a reference period are recorded (in the VASyR questions were asked about food groups consumed over the 7 days previous to the data collection), without regard to frequency of consumption.
Household weekly diet diversity is equal to the number of food groups consumed over the previous 7 days. Household daily average diet diversity equal to the number of food groups consumed over the previous 24 hours (for this assessment, the number of food groups consumed was divided by 7 to determine equivalency for one day).
For a better reflection of diet quality, the calculation is based on the number of different food groups consumed and not on the number of different foods consumed. The more food groups households consumed, the more diversified the diet is; for example, an average of four different food groups implies that their diets offer some diversity in both macro- and micronutrients. This is a more meaningful indicator than knowing that households consume four different foods, which might all be cereals.
The following set of 12 food groups is used to calculate the household dietary diversity score (HDDS):1
1. Cereals2. Roots and tubers3. Vegetables4. Fruits5. Meat/poultry/organ meat 6. Eggs7. Fish and seafood8. Pulses/legumes/nuts9. Milk and milk products 10. Oils/fats11. Sugar/honey12. Miscellaneous
Key concerns: The dietary diversity score does not take into account the nutrient value of food items eaten. The questionnaire should properly account for food items consumed in very small quantities. For instance, if a spoon of fish powder is added to the pot, this should be treated as a condiment rather than a day’s consumption of fish. The same is true for a teaspoon of milk in tea.
Reporting: Mean dietary diversity score; compare mean between different groups.
Descriptive procedure: compare means; descriptive statistics.
Interpretation: Dietary diversity is positively linked with adequacy of food intake. Hence, a smaller value indicates poor quality of diet.
For a detailed discussion on the dietary diversity indicator, see the following websites:http://www.fantaproject.org/downloads/pdfs/HDDS_v2_Sep06.pdf.http://documents.wfp.org/stellent/groups/public/documents/manual_guide_ proced/wf p203208.pdf
1This set of food groups is derived f rom the U.N. Food and Agriculture Organization Food Composition Table for Africa. Rome, Italy, 1970. [www.fao.org/docrep/003/X6877E/X6877E00.htm] For a more thorough discussion of the differences between measures of dietary diversity from the socioeconomic compared with the nutritional perspective, see Ruel, Marie. Is Dietary Diversity an Indicator of Food Security or Dietary Quality? A Review of Measurement Issues and Research Needs. FCND Discussion Paper 140, International Food Policy Research Institute, Washington, DC. 2002.[www.if pri.org/divs/fcnd/dp/papers/fcndp140.pdf ]
FOOD CONSUMPTION

78
Anne
x 6:
Foo
d co
nsum
ptio
n

79
Anne
x 6:
Foo
d co
nsum
ptio
n

8180
ECONOMICVULNERABILITY
In order to assess the economic vulnerability of the Syrian refugee households in Lebanon, several variables were taken into perspective. These included the Survival and Minimum Expenditure Baskets (S/MEB), debt and the structure and volume of expenditures.
- Public unrest, economic crisis and COVID-19 pandemic almost pushed the entire refugee population (88.7%) to below the SMEB.- Inflation has substantially impacted food costs and non-food costs (174% and 175% respectively since October 2019).- The average monthly per capita expenditure was LBP 198,980; there were many elements that hindered the comparison with the 2019 expenditures due to the current inflation crisis; however, the slight increase in the expenditures did not follow the increase in prices, which reflected the very limited purchase power of the Syrian refugees. - The average level of debt per household has increased by nearly 10% and is now LBP 1,835,837, showing that Syrian refugee households continued to lack enough resources to cover their basic needs. Similar to the previous year, 9 out 10 households remained in debt. - Food, rent and health (buying medicine) remained to be the main reasons of debt, while borrowing money to buy food increased by 18 percentage points. Female-headed households have significantly borrowed money to buy medicine compared to their male counterparts (46% vs. 32%), while male-headed households have been borrowing more money to pay rent (49% vs. 43%). Similar to the previous year, friends in Lebanon remained the main source of borrowing in 2020 (79 %), followed by supermarkets (46%) and landlords (20%).
KEY FINDINGS
© UNHCR/Michael Muller

82
Almost 89% of Syrian refugee households lived below the SMEB of LBP 1,543,613 in 2020, a dramatic increase than last year’s figure of 55%. The number of Syrian refugee households spending less than MEB of LBP 1,751,542 has also steeply increased from 73% in 2019 to 91% in 2020. It is also worth noting that the share of households living between MEB and SMEB has substantially decreased from 18% in 2019 to 2% in 2020, indicating that more households were severely affected by the multi-pronged crisis in Lebanon. The S/MEB levels in 2020 were the highest amongst the past five years.
Figure 1: Households below S/MEB 2015-2020
REVIEW OF THE SURVIVAL AND MINIMUM EXPENDITURE BASKETS IN LEBANON
The survival and minimum expenditure baskets stand as a reference that allow humanitarian actors in Lebanon to assess the components and volume of purchasing conducted by Syrian refugee households to meet their basic needs. Since 2014, the S/MEB values have helped in studying the economic situation of Syrian refugees and categorizing them into different vulnerability groups, to identify those who are in dire need of humanitarian assistance, including the multi-purpose cash assistance.
Due to the multifaced crisis that took place in Lebanon during 2020, including public unrest, COVID-19, and economic crises, the SMEB update was a necessity in order to reflect the drastic changes in high cost conditions. This process was very important following the continuously rise in inflation rates, as well as prices and living cost inflation, diminishing income generating opportunities, high unemployment among others.
As shown in the above table, the total cost of the SMEB basket with both its food and non-food components has been updated to be LBP 1,543,613 per household. Additionally, the reviewed MEB basket including both its food and non-food components, was LBP 1,751,542 per household as of August, 2020. The new S/MEB figures shown in table 1 will inform future decisions regarding cash transfer values, in order to have meaningful assistance reflecting actual consumption patterns of Syrian refugee households amid the multifaceted crisis that Lebanon is going through.
ECONOMIC VULNERABILITY
Food 590,188 653,544
953,425 1,097,998
1,543,613 1,751,542
Non-Food
Total
SMEB per HH (LBP) MEB per HH (LBP)
SURVIVAL AND MINIMUM EXPENDITURE BASKET
2015 2016 2017 2018 2019 2020
69% 71% 75%68%
51%58%
53%52%
73%
55%
89%
Table 1: SMEB and MEB values per household (in LBP)-2020
91%
<MEB<SMEB
Figure 2: Percentage of households below SMEB by governorate
<30%
31%-50%
51%-70%
71%-90%
AkkarAkkar TripoliTripoli
El Minieh-Dennie
El Minieh-Dennie
ZghartaZgharta
ElKoura
ElKoura HermelHermel
BcharreBcharre El BatrounEl Batroun
JbeilJbeil
KesrwaneKesrwane
El MetenEl Meten
ZahleZahle
RachayaRachaya
WestBekaa
WestBekaa
SaidaSaida
HasbayaHasbaya
MarjaayounMarjaayoun
BaabdaBaabdaAleyAley
BeirutBeirut
ChoufChouf
JezzineJezzine
BaalbekBaalbek
ElNabatieh
ElNabatieh
SourSourBent Jbeil
Bent Jbeil 2019 2020
>90%
1 Check the methodology of the ‘Review of the Survival and Minimum Expenditure Baskets in Lebanon’ report onhttps://reliefweb.int/report/lebanon/review-survival-and-minimum-expenditure-baskets-lebanon-updated-smeb-and-meb
Several steps have been followed in adjusting the basket values1.

83
The percentage of households with debt greater than LBP 900,000 has considerably increased from 55% in 2019 to 63% in 2020. Additionally, there was a 4 percentage points increase in the households who have debt of less than LBP 300,000. In general, the share of households that are in debt has maintained the same level (93% in 2019 vs. 92% in 2020).
The mean debt per household with debt appeared to be rising steadily with around 10% increase between 2019 (LBP 1,672,602) and 2020 (LBP 1,835,838). Similarly, there has been a constant increase in the average debt per capita for households with debt at around 7% between 2019 and 2020, reaching LBP 442,634 per capita. At a governorate
Overall, the percentage of households below the SMEB level has increased significantly in all governorates, with the most substantial increase reported in Beirut with 48 percentage points difference (23% in 2019 vs. 71% in 2020). Moreover, the governorates where the percentage of households below SMEB was greater than the national average (89%) was Bekaa (96%), Baalbek-El Hermel (94%), the North (92%), and Akkar (91%). This also indicates that the economic
ECONOMIC VULNERABILITY
DEBT AND BORROWING MONEY
Figure 4: Debt category 2019-2020
2019 2020
No debt
<=LBP 300,000
LBP 300,001 - LBP 900,000
>LBP 900,000
vulnerability has risen in all areas across Lebanon. Moreover, Akkar governorate witnessed a 17 percentage points decrease in the percentage of households with working members compared to 2019, followed by the North (14 percentage points decrease) and Beirut (10 percentage points decrease). The governorate with the least percentage of households with working members continued to be Baalbek-El Hermel, in addition to Bekaa at 35%.
Total Akkar Baalbek-El Hermel
Beirut Bekaa El Nabatieh MountLebanon
North South
2019 2020
55%
89%
71% 71% 72%
91% 94% 96%
43%
87% 87%82%92%
43% 47% 46%
23%
78%
2019 2020Figure 3: Percentage of households below SMEB by governorate
Debt: current amount of accumulated debt that households have from receiving credit or borrowing money.
Borrowing: households that borrowed money or received credit in the three months prior to the survey.
29%55% 63%24%
9% 5%7% 8%
level, the North and Bekaa had the highest mean debt per household at LBP 2,340,550 and LBP 1,992,299 respectively. As for the mean debt per capita, the North and Beirut governorates reported the highest levels at LBP 552,771 and LBP 527,879 respectively.

84
Figure 5: Mean debt per households and per capita 2017-2020
2017 2018 2019 2020
Mean debt per household (only households with debt) Mean debt per capita (only households with debt)
LBP 400,000
LBP 800,000
LBP 1,200,000
LBP 1,600,000
LBP 2,000,000
LBP 0
LBP 1,378,500
LBP 340,500 LBP 375,000 LBP 413,167 LBP 442,634
LBP 1,522,500LBP 1,672,602
LBP 1,835,838
Buying food has been reported as the top reason for borrowing money with a dramatic increase from 75% in 2019 to 93% in 2020. Paying rent remained the second top reason for borrowing money with a slight decrease of 3 percentage points. It is worth noting that while buying medicine remained at almost the same level (33% in 2019
REASONS FOR BORROWING
vs. 34% in 2020), borrowing money to pay healthcare expenses witnessed a decrease of 10 percentage points between 2019 and 2020; this might indicate that households were spending less on the health of their members. Debt repayment has approximately maintained the same level (6% in 2019 vs. 5% in 2020).
Buy food Pay rent
Friends in Lebanon
Supermarket Landlord Friends not in Lebanon
Other Shawish
Buy medicine Pay health Buy water Buy shelter material
Other reasons Debt repayment
2019 2020
75%
73%79%
48% 46%
20% 20%
2% 2% 2%5% 3% 3%
93%
75%
51% 48%
33% 34% 34%24%
4% 6% 5% 5% 5% 5%6%9%
2019
2019
2020
2020
Figure 6: Main reasons for borrowing money 2019-2020
Similar to the previous year, friends in Lebanon have been the main source of borrowing with an increase of 6 percentage points between 2019 and 2020. The second reported source of borrowing was grocery shops with a slight decrease from 48% in 2019 to 46% in 2020. Borrowing money from friends not in Lebanon witnessed an increase of 3 percentage points between 2019 and 2020.
Figure 7: Sources for borrowing money
ECONOMIC VULNERABILITY

85
ECONOMIC VULNERABILITY
The share of expenditures among food, rent and health followed to a great extent the same trend as previous years. The monthly expenditure on food increased by 4% between 2019 and 2020, whereas the percentages of rent and health have slightly decreased. However, the monthly expenditure per capita has increased by around 27% from last year (LBP 156,943 in 2019 vs. LBP 198,981 in 2020). This might reflect the inflation of prices of commodities, but
EXPENDITURES
The details below demonstrate the profiling of the most economically vulnerable households and those falling below S/MEB thresholds.
Debt: Ninety-two percent of households under the SMEB were in debt, slightly less than the percentage in 2019 at 96%. In 2020, households under the SMEB were more likely to have debt greater than LBP 900,000 (63% in 2020 vs. 57% in 2019). In fact, households in all MEB/SMEB categories have been borrowing more money (greater than LBP 900,000) compared to 2019.
Reason for borrowing: Borrowing money to buy food has witnessed a dramatic increase among the most economically vulnerable households from 79.4% in 2019 to 93.4% in 2020. The second and third top reasons were paying rent (47.5%) and buying medicine (34.7%).
Shelter: Sixty-five percent of households under the SMEB lived in residential shelters, followed by non-permanent shelters (22.7%).
not necessarily an increase in the volume of commodities purchased. In terms of individual food items, “bread and pasta” continued to be the most purchased items at 25%, followed by fruits and vegetables at 16%. The third most purchased item in 2020 was cereals at 11% (up from 8% in 2019), whereas the third most purchased item in 2019 used to be dairy products (10.2% in 2019 vs. 8.6% in 2020).
44%
18% 20%15%
11% 11%10%12% 12%
44%48%
40%
2020201920182017
Figure 8: Monthly expenditure per capita 2017-2020
LBP 147,000LBP 166,500 LBP 156,943
LBP 198,981
Food
Rent
Health
Monthly Expenditures per Capita in LBP
CHARACTERISTICS OF ECONOMIC VULNERABILITY
Food security: Households falling under the SMEB were more likely to be food insecure at 51%, up by 16% compared to 2019.
Working members: Fifty-one point nine percent of the households under the SMEB level have a working member, down from 54% in 2019.
Coping strategies: Households under the SMEB level adopted more crisis and emergency coping strategies (59.2%) than households belonging to other S/MEB categories.
Demographics: The average household size for households under the SMEB was the highest compared to other S/MEB categories (5 members). Additionally, 82% of households under the SMEB level were men-headed and 18% were women-headed. Around one third of households between the MEB and SMEB levels were women-headed.

86
Table 2: Economic vulnerability groups by sectors indicators
ECONOMIC VULNERABILITY

87
ECONOMIC VULNERABILITY
Assistance VASyR 2020Vulnerable Syrian refugees in Lebanon received two main kinds of assistance aimed to cover basic needs: cash assistance and in-kind support. Most cash assistance was provided through ATM cards whereby refugees could withdraw cash from any ATM or use cards to purchase goods in the local market, where possible. Cash assistance allowed refugee households to meet their basic needs in a dignified manner by allowing them to prioritize their purchases according to their needs. The VASyR 2020 survey examined the proportion of surveyed households that were recipients of cash assistance at the time of the interview. The assessment also examined whether they had received training or education on proper hygiene.
Assistance ProvisionThe three largest cash programs for Syrian refugees were as follows:
1. Multipurpose cash assistance. Recipients of multipurpose cash assistance received a monthly cash transfer via an ATM card. Due to challenges and strains in the banking sector throughout 2020, some agencies shifted the modality and households were also able to redeem multipurpose cash assistance at WFP contracted shops. At the time of the survey (August-September), eligible households were receiving LBP 400,000 per month. Nationally, some 94,000 households were assisted with multipurpose cash. As of October 2020, beneficiaries who were receiving multipurpose cash assistance via debit card from UNHCR could purchase goods in all stores that were equipped with the card reader machines within Mastercard network.
2. Cash for food assistance and Food E-card. Beneficiaries of the Cash for Food assistance could withdraw cash from ATM and redeem the card in the WFP contracted shops or any store equipped with a POS terminal, while recipients of the Food E-card could only redeem the card in WFP contracted shops. In terms of the current targeting, 40% of WFP caseload is within food e-card modality and 60% with cash for food and multipurpose cash. In the month of September (time of the survey), 49,169
households received cash for food assistance, which overlapped with the recipients of the UNHCR MCAP assistance; and 54,076 households received Food E-card assistance. Eligible households received food component amounting to LBP 70,000 per household member per month from WFP for both modalities.
3. Cash for winter needs. In the 2019/2020 winter season, UNHCR assisted close to 260,000 households, including refugees and Lebanese, to support them meet the additional needs brought about by the winter. Cash assistance was provided via ATM cards to economically vulnerable households.
In addition to the above-mentioned programs, other cash assistance programs exist in Lebanon targeting smaller groups of households. These include protection and emergency cash programs, cash for education and cash for weatherproofing, inter alia.
A little under half (46%) of households reported they were in possession of a card from which they were able to redeem cash at an ATM. The highest proportions were in Baalbek- El Hermel (67%) and Akkar (78%). There was a slightly larger proportion of female-headed households that reported having a cash card (50% compared to 45% among male-headed households). A smaller proportion reported that they had a card which they could use directly to buy food from shops (35%) and much less (10%) reported that they were in possession of a card they could use in shops directly to buy non-food items. In-kind assistance was much less common with only 8% of households reporting that they had received in-kind food assistance in the three months preceding the interview. The same proportion reported having received education or training on hygiene over the last year.
When inquiring whether any organization that was providing assistance asked households about the kind of assistance they needed, the majority (88%) reported that this had not happened.
ASSISTANCE

88
Anne
x 7:
(S)M
EB b
reak
dow
n, p
over
ty li
ne a
nd d
ebt

89
Anne
x 8:
Deb
t per
hou
seho
ld a
nd p
er c
apita
, and
hou
seho
lds
borr
owin
g m
oney

90
Anne
x 9:
Mon
thly
exp
endi
ture
per
cap
ita, f
ood
expe
nditu
re s
hare
and
exp
endi
ture
sha
re (m
onth
ly a
vera
ge)

91
Anne
x 9:
Mon
thly
exp
endi
ture
per
cap
ita, f
ood
expe
nditu
re s
hare
and
exp
endi
ture
sha
re (m
onth
ly a
vera
ge) -
con
tinue
d

9392
LIVELIHOODSAND INCOMEThis chapter addressed the employment, income and work sectors at the individual and household levels. At the individual level, income-generating activities, employment and unemployment levels were probed one week prior to the survey, and covered household members aged 18 years and above, whereas in 2019 it included household members aged 15 years and above. At the household level, the survey investigated the households’ main income sources as well as the primary income source they rely on to cover living expenses.
- At the country level, unemployment among the labor force was reported at 39% in 2020, up from 31% in 2019, with a higher percentage among women at 45% compared to men at 38%. The highest unemployment rate was found in Bekaa (61%), followed by Baalbek-El Hermel (52%).- The labor force participation rate was 43%, with 74% among men and 14% among women. The highest percentage of labor force participation was in El Nabatieh (51%), followed by the South and Beirut.- On average, 52% of households had at least one working member in the 7 days prior to the survey in 2020, down from 59% in 2019. The lowest level of households with at least one working member was in Akkar (32%). - Only 35% of women-headed households had working members, compared to 56% of men-headed households.- A very slight decrease was observed in the average weekly per capita income (LBP 97,600 vs. LBP 105,000) with the lowest income in Akkar (LBP 47,120) and the Bekaa (LBP 52,766), followed by Baalbek-El Hermel (LBP 59,244). The highest income continued to be reported in Beirut (LBP 165,868 in 2020 vs. LBP 162,836 in 2019). - In 2020, the main work sectors order changed; hence, agriculture had the highest share (32% in 2020 vs. 17% in 2019) and construction ranked second (24% in 2020 vs. 21% in 2019), followed by other services (15% in 2020 vs. 13% in 2019). This might be due to the COVID-19 lockdown and the shift in interest towards local agricultural production following the economic crisis. Agriculture work was mostly found in Baalbek-El Hermel (52% in 2020 vs. 18% in 2019) and Akkar (48% in 2020 vs. 35% in 2019).- The main reason for not working was the lack of work opportunities in the different areas at 25%. - The main sources of income for Syrian refugees was WFP assistance (21%) and informal debt from friends and shops (17%), followed by ATM machines cards offered by UN or humanitarian organizations (15%); this underlined the high dependency on assistance and the challenges that Syrian refugees have faced in covering expenses of basic needs through employment. When asked about the top three sources of income combined, informal debt ranked first at 73%, up by 9 percentage points compared to 2019.
KEY FINDINGS
© UNDP

94
EMPLOYMENT, UNEMPLOYMENT AND THE LABOR FORCE
The definitions below are based on the core ILO Labor Force Survey (LFS) questions following the 19th International Conference of Labor Statisticians (ICLS) resolution. Those are comparable with the CAS/ILO’s Labor Force and Household Living Conditions Survey (LFHLCS) 2018-19.
It is worth noting that people aged between 15 and 18 years old have been included in the employed, unemployed and labor force in 2019 while they have been excluded in 2020. In fact, in 2020, the analysis included people aged 18 years old and above. Hence, this hindered the comparison between the 2019 and 2020 figures for the individual employment subsection.
Employment: number of working-age individuals (18+ years old) who have worked during the past week for someone else in return of pay as an employee, laborer, or apprentice or have worked in any other kind of business activity. It also includes working-age individuals who worked in the past week in own/family farming or fishing given that the farming or animal products were only or mainly for sale. Additionally, it includes working-age individuals who, during the last week, either performed any other activity to generate an income even for one hour (such as casual work, making things to sell, providing service for pay, among others), or have a paid job or business activity but were temporarily absent, or contributed without pay in a family business.
Unemployment: number of working-age individuals (18+ years old) who were not employed during the past week (as per the definition above), who looked for a paid job or tried to start a business in the past four weeks, and who are available to start working within the next two weeks if ever a job or business opportunity becomes available.
Outside labor Force: number of working-age individuals (18+ years old) who were not employed during the past week, and who either cannot start working within the next
two weeks if a job or business opportunity becomes available or did not look for a paid job or did not try to start a business in the past four weeks.
Labor Force: Sum of employed and unemployed working-age individuals.
Employment-to-Population Ratio (LPR): the proportion of a country’s working-age population that is employed.
Labor Force Participation Rate (LFPR) = (employed population + unemployed population) / total population aged 18+.
Potential Labor Force: number of working-age individuals (18+ years old) who were not employed during the past week, and who are available to start working within the next two weeks if a job or business opportunity arises but did not actively search for a job/try to start a business in the past four weeks. Potential labor force also includes working-age individuals who were not employed during the past week, and who are actively searching for a job/trying to start a business in the past four weeks, but who are unavailable to start working within the next two weeks if a job or business opportunity arises.
The unemployment rate in 2020 was 39%, up from 31% in 2019, while the employment to population ratio was 26%. The employment to population ratio, however, varied drastically among men and women. In fact, it was 46% among men, much more than the figure reported among women at 8% only. One out of four men were unemployed in 2020 and 86% of women were outside the labor force.
The Bekaa and Baalbek-El Hermel reported the highest unemployment rates among governorates at 61% and 52% respectively. Unemployment rate in the North and Akkar was reported to be 37% and 40% respectively.
Total Men Women
Figure 1: Employed, not working, and outside the labour force population for total population, men and women
Employed
Not working
Outside labour force
In labour force
43% 74% 14%
26%
26%
46%
28%
8% 6%
86%
17%
57%
LIVELIHOODS AND INCOME

95
Other
Injury or medical condition
Dependent children at home
69%
55%
At a household level, employment has declined in comparison to 2019. The share of households with members working in the past 7 days has decreased by 7.3 percentage points, from 59% in 2019 to 52% in 2020. From a gender lens, there has been a decrease of more than 10 percentage points in women-headed households reporting a member working in the past 7 days (from 46% in 2019 to 35% in 2020). Men-headed households reported half the percentage point decrease of that for women-headed households (5 percentage points decrease).
By governorate, Akkar witnessed a decrease by around 1.5 times in the share of households with a member working in the last 7 days, between 2019 and 2020 (49% vs. 32% respectively). Additionally, there was a 14 percentage points decrease in the North governorate and an 11 percentage points decrease in Beirut in households with working members in the past 7 days. It is worth mentioning that El Nabatieh witnessed a 9 percentage points increase in the households with working members in the past 7 days (66% in 2019 vs. 75% in 2020).
When asked about the reasons of unemployment, the majority of refugees mentioned that there were no jobs in the area where they lived (25%) followed by having dependent family members and dependent children (22% each). In 2019, the top reason for unemployment was having dependent children at 19.5%. Those who mentioned that there were no jobs in the area were located mainly in the Bekaa (30%) and in Akkar (28%) and were mostly men (56% of men and 7% of women). Those who mentioned that they have dependent children at home were mostly in the age group of 25 to 29 (38%) followed by the age group of 30 to 34 (31%) and were mostly female-
Figure 2: Households with members working in the past 7 days, by gender of the household head
Women-headed households
Men-headedhouseholds
2019
2020
46%
35%
61%56%
Baalbek-El Hermel
Beirut Bekaa El Nabatieh MountLebanon
North South
2019 20202019 2020Figure 3: Households with members working in the past 7 days, by governorate
Akkar
49%
32% 36% 35%
69% 69%81%
70% 66%75%
62% 66%
35%30%
headed households (33% females vs. 0.5% males only). The majority of those who mentioned that they have a dependent family member at home were female-headed households (33% females vs. 1% males) and were mostly located in Beirut (38%) and Mount Lebanon (35%).It is worth noting that continuing education as a reason of unemployment decreased from 19% to 3%; however, this dramatic drop might be due to the COVID-19 pandemic lockdown or to a difference in the timing, whereby the 2020 data was collected in the month of August while the 2019 data was collected in May during the 2019 school year. It might be also due to both.
Figure 4: Reasons for unemployment
Had been subject to serious abuse/exploitation in previous work
Seasonal work
Lack of skills
Elderly
Legal residency
Continuing education
Dependent family member(s)
No work in the area where I live 25%
22%
22%
14%
3%
3%
2%2%
1%
1%0%
LIVELIHOODS AND INCOME

96
The level of engagement in the agriculture sector has almost doubled between 2019 and 2020 (17% in 2019 vs. 32% in 2020). This might be due to the increased level of engagement in the local agricultural production following the economic crisis and the high prices of imported food items. Construction was the second employment sector that Syrian refugees were engaged in (24%) whereas it used to be the top sector in 2019 (21%). Indeed, the construction sector might have been negatively influenced by the COVID-19 lockdown and the high prices of imported materials as a result of the financial crisis. At a governorate level, agriculture was the main sector in Baalbek-El Hermel
(52% in 2020 vs. 18% in 2019), Akkar (48% in 2020 vs. 35% in 2019) and the South (43% in 2020 vs. 35% in 2019). In Beirut and Mount lebanon, “other services” sector was the most common sector followed by construction. Around one third of male-headed households were engaged in agriculture, less than the level of engagement for female-headed households at 46%. In construction, however, 28% of male- headed households were engaged compared to around 0.5% only for their female counterparts.
This difference between genders in the level of engagement in agriculture and construction was also observed in 2019.
Total Baalbek-El Hermel
Beirut Bekaa El Nabatieh MountLebanon
North South
Construction Other
32% 32%
38% 37% 39%43%
33%
7% 6%
16%22% 23%
13%
24%28%
24%
10%
48%52%
20%
5%
24%
15% 15% 15%14%
1%
AgricultureFigure 5: Employment sectors by governorate*
* The sectors listed in the VASyR 2020 report are: Agriculture, Construction, Concierge, Manufacturing, Wholesale and retail trade, Begging, Profes-sional Services, Occasional Work, Selling (tissues, water, etc.) on the street, Forestry, Waste collection/management, Other Services: hotel, restaurant, transport, personal services, Other
Akkar
WFP assists the beneficiaries through three modalities:
- Food e-card (beneficiary can only redeem the card in the WFP contracted shops).
- Cash for food (beneficiary can withdraw cash from the ATM and redeem the card in the WFP contracted shops).
- MPC multipurpose cash (beneficiary can withdraw cash from the ATM).
In terms of the current targeting, 40% of WFP caseload were within food e-card modality and 60% were with cash for food and multipurpose cash.
In the VASyR questionnaire, the option of cash assistance changed from “Cash from humanitarian organizations” in 2019 into “ATM cards used in ATM machines from UN or humanitarian organizations” in 2020. The 2020 option was masking the cash for food and MPC beneficiaries, which can explain the decrease in the WFP e-card assistance from 24% to 21% and the increase in the ATM cards used in ATM machines from 7% into 15%.
As the figure below shows, WFP assistance in the form of e-cards was the main household source of income for Syrian refugees in 2020 at 21%, down by 3 percentage points compared to 2019. The second source of income
INCOME
was informal credit and debts at 17%, and the third source of income in 2020 was ATM cards used in ATM machines from UN or humanitarian organizations (15%).
Construction dropped from being the third source of income in 2019 to the fourth in 2020 (10% in 2020 vs. 13% in 2019). At a governorate level, WFP e-cards were mostly mentioned in Akkar (50%), the Bekaa (40%) and Baalbek-El Hermel (31%). It was also mentioned as the main source for households below the SMEB (23%), female-headed households more than male- headed households (26% vs. 19%). Households with non-permanent shelters also relied on WFP e-cards assistance the most (34%) compared to non-residential (21%) and residential shelters (16%). However, it is worth noting that households that were severely food insecure relied the most on informal debts (32%) and secondly on WFP e-cards assistance (23%). Informal debts were more common in female-headed households than in male-headed households (19% vs. 16%) and in the North and Bekaa governorates (24% and 22% respectively). Finally, when asked about the top three sources of income combined, informal debt ranked first at 73%, up by 9 percentage points compared to 2019 (64%).
LIVELIHOODS AND INCOME

97
Figure 6: Main source of household income1
Gifts from family/relatives
Home based work/skill
Manufacturing
Concierge
Other services: hotel, restaurant, transport, personal services
Other
Professional services
Agriculture
Construction
ATM cards used in ATM machines from UN or humanitarian organizations
Credit/debts (informal shops, friends' hosts)
WFP food e-cards 21%
17%
15%
10%8%
7%
6%
5%
2%
1%
1%
1%
The average per capita weekly income has slightly decreased among households with working members, from LBP 105,000 in 2019 to LBP 97,600 in 2020. It was the highest in Beirut (LBP 165,870) and the lowest in Akkar (LBP 47,120) and Bekaa (LBP 52,766). Households below the SMEB had the lowest income per capita in comparison to the other S/MEB categories (LBP 75, 679). Severely food
In terms of the sectors of employment, construction dropped from the top sector in 2019 to the second one in 2020. Agriculture was the top sector of employment (17% in 2019 vs. 32% in 2020) in all governorates, except Beirut and Mount Lebanon. In terms of the main source of income, construction dropped from being the third income source in 2019 to the fourth one in 2020 (10% in 2020 vs. 13% in 2019). The COVID-19 lockdown, the high prices of the imported construction material priced in dollars, and the capital control measures might have led to the decreased level of engagement in the construction sector; whereas the level of engagement in the agricultural sector might be
insecure households had a much lower income per capita in comparison to food secure ones (LBP 69,867 vs. LBP 229,448 respectively). Households with non-permanent shelters had the lowest income per capita (LBP 52,946) compared to non-residential (LBP 91,829) and residential shelters (LBP 106,863).
1This figure includes data on the top 1 source of income. For a breakdown of the top 3 sources of income, refer to the tables on the VASyR website.
LIVELIHOODS AND INCOME
Figure 7: Per capita Income (LBP) (HH with working members) by S/MEB category
Figure 8: Per capita Income (LBP) (HH with working members) by food security category
Total Total>=125% MEB
Food secure
MEB- 125% MEB (LBP 350,200- 437,750)
Mild food insecurity
SMEB-MEB (LBP
308,722- LBP 350,200)
Moderate food
insecurity
< SMEB (LBP
308,722)
Severe food insecurity
97,599
97,599
229,448
96,862 83,545 69,867
369,278
184,131157,781
75,680
a result of the high prices of imported items leading to increased local agricultural production.
This, coupled with the economic and financial crisis, has resulted in 8 percentage points increase in unemployment between 2019 and 2020. One out of four Syrian refugee men were unemployed in 2020 and 86% of Syrian refugee women were outside the labor force. Additionally, the average weekly per capita income has decreased by 7% for households with working members (from LBP 105,000 in 2019 to LBP 97,600 in 2020).

98
Anne
x 10
: Wor
king
hou
seho
ld m
embe
rs, p
er c
apita
inco
me,
and
cas
h an
d in
com
e so
urce
s

99
Anne
x 11
: Cas
h an
d in
com
e so
urce
s –
cont
inue
d

100
Anne
x 12
: Em
ploy
men
t and
une
mpl
oym
ent

101
Anne
x 13
: Sec
tors
of w
ork

103102
COPING STRATEGIESIn order to deal with the absence of food and/or the resources to buy it, households adopt several coping strategies. The following section tackled a broad set of coping strategies, which are studied using two dimensions including food-based and livelihood-based coping strategies. In fact, food-based coping strategies allow for an enhanced understanding of the food consumption behaviors of a household lacking food, by studying the frequency and severity of changes it undergoes. Additionally, livelihood-based coping strategies is a proxy of a household’s coping capacity in the medium and long-run by understanding how challenging its situation is, and whether it will be able to mitigate future shocks.
- For food-related coping strategies, there has been an increase of 4 percentage points in the number of households borrowing food or relying on help from friends between 2019 and 2020. Sixty-five percent of households reduced the number of meals consumed per day in 2020, up from 60% in 2019, while the percentage of households reducing the portion size increased by nearly 6 percentage points between 2019 and 2020. Seven percent of households spent days without eating, a significant increase compared to 2019 (4%). - Only 4% of Syrian refugees’ households were not adopting livelihood-related coping strategies. Thirty eight percent of households were applying more stress-based coping strategies, an increase of 8 percentage points compared to 2019.
KEY FINDINGS

104
Total Baalbek-El Hermel
Beirut Bekaa El Nabatieh MountLebanon
North South
2019 2020
1816
FOOD-BASED COPING STRATEGIES
There have been various strategies used by households in order to cope with the lack of food. Some strategies were food-related, while others were livelihood-related. The food-related strategies included in the analysis were relying on less preferred or less expensive food, on reducing the portion size of meals and the number of meals eaten per day, on
A higher rCSI indicates that Syrian refugee households adopted more strategies to deal with the lack of or access to food in the past week. A high rCSI score also implies that households have adopted severe strategies more frequently. A decrease in the reduced Coping Strategy
COPING STRATEGIES
borrowing food or relying on help from friends or relatives, on restricting food consumption by adults in order for children to eat and by female heads of households, on spending days without eating, and on sending household members to eat somewhere else. The first five strategies were used to calculate the reduced Coping Strategy Index (rCSI).
Figure 1: Households reporting food-related coping strategies 2019-2020
Spent days without eating
Restricted food
consumption of female
members of households
Sent household
members to eat elsewhere
Restricted consumption
by adults in order for
children to eat
Borrowed food or relied on help from
friends or relatives
Reduced the number of
meals eaten per day
Reduced portion size of
meals
Relied on less preferred/
less expensive food
4% 7%7%7% 8%
37%39% 43%
60% 65%65%
88% 88%
59%
30%
9%
2019 2020
Index was reported in the North and Akkar governorates in 2020 compared to 2019 (25 vs. 32 in the North, and 19 vs. 26 in Akkar). In the other governorates, the rCSI has approximately remained the same, except in Beirut where it increased by 5 (from 11 in 2019 to 16 in 2020).
2019 2020Figure 2: Reduced food-related coping strategy index by governorates
Akkar
11 10 911
16
11
16 1617 1819 1919
26
32
25
Only 4% of Syrian refugee households were not adopting livelihood-based coping strategies. In order to further assess the coping capacity of a certain household, livelihood-based coping strategies are utilized, which are also known as asset depleting coping strategies. The latter influences a household’s coping capacity in the long run. For example, a household whose members were forced to beg or accept high risk, illegal, and socially
LIVELIHOOD-BASED COPING STRATEGIES
degrading jobs (emergency coping strategies) will have a much less coping capacity to upcoming disturbances than a household that had to buy food on credit in comparison (stress coping strategies). The figure below shows that, in comparison to 2019, households in 2020 adopted similar levels of emergency coping strategies and lower levels of crisis coping strategies. Moreover, the percentage of households who withdrew their children from school

105
COPING STRATEGIES
to 36% only of households spending between SMEB and MEB (LBP 308,722- LBP 350,200).
The percentage of households adopting stress coping strategies was the highest in 2020, over the past three years, at 38% with an increase of 8 percentage points compared to 2019. Forty-nine percent of households were using crisis coping strategies compared to 57% in 2019, and 8% were using emergencies coping strategies in 2020 compared to 10% in 2019.
At a governorate level, households in Bekaa and South reduced health expenditures the most at 73% and 71% respectively. The Bekaa governorate witnessed a noticeable reduction in food expenditures (96%).
At a district level throughout Lebanon, the two districts with the highest percentages of emergency coping strategies were Saida (36% in 2020 vs.19% in 2019) and Hasbayya (33% in 2020 vs. 9% in 2019), followed by Baabda (13% in 2020 vs. 7% in 2019). The two districts adopting the highest percentages of crisis coping strategies were West Bekaa (75% in 2020 vs. 66% in 2019) and Zgharta (73% in 2020 vs. 67% in 2019). Additionally, the district adopting stress coping strategies the most continued to be Beirut (57% in 2020 vs. 55% in 2019). Compared to 2019, Akkar was adopting more crisis coping strategies (53% in 2020 vs. 45% in 2019). Similarly, Bcharre was adopting more crisis coping strategies (65% in 2020 vs. 56% in 2019).
Additionally, households living in non-permanent shelters were adopting more crisis coping strategies (59.2%) compared to those with non-residential (49.3%) and residential shelters (46.2%).
Moreover, households living below the SMEB (LBP 308,722) were adopting more crisis coping strategies than less economically vulnerable households that were living above the SMEB. For instance, 51% of households below SMEB were adopting crisis coping strategies, as opposed
Figure 4: Livelihood-based coping strategies 2017-2020
decreased to half its previous value (6% in 2020 vs. 12% in 2019); this decrease might be a result of the COVID-19 pandemic lockdown as well as a timing difference, since the 2020 data was collected in August 2020 while the 2019
data was collected in May during the 2019 school year. The same trend was observed in the share of households reducing education expenditures which was reduced in 10 percentage points (30% in 2019 vs. 20% in 2020).
Figure 3: Households reporting livelihood-based coping strategies
Stre
ssCr
isis
Emer
genc
y
2019 2020
Household has debt
Bought food on credit
Spent savings
Reduced health expenditures
Withdrew children from school
Sold productive assets
Marriage of children under 18
Involved school children in income generation
Accepted high risk jobs
Sold household goods
93%
Reduced education expenditures
Sold house or land
Begged
92%76%
71%34%
23%28%
24%54%
49%30%
20%12%
6%10%
8%1%1%
5%5%
3%3%
3%2%
2%2%
11% 12% 10% 8%
55% 51% 57% 49%
30% 30% 38%34%
4% 4%3% 3%
HH not adopting coping strategies
Stress copingstrategies
Crisis copingstrategies
Emergency copingstrategies
2017 2018 2019 2020

106
The highest percentage of households using emergency coping strategies was in the South (19% in 2019 vs. 22% in 2020); this included begging (11.4%), selling house or land in Syria (11.1%), accepting high risk, illegal, socially degrading jobs (7%), and involving school children in income generation (7%). The highest percentage of households adopting crisis strategies to cope with the lack of food or lack of money to buy food continued to be in Bekaa
(71%). These crisis strategies included reducing health expenditures at 73%, reducing education expenditures (17.4%) and withdrawing children from school (9%).
Forty-seven percent of households living in Beirut governorate were adopting stress coping strategies; out of these, 61% were buying food on credit and 12% were selling household goods.
Akkar Baalbek-El Hermel
Beirut Bekaa El Nabatieh MountLebanon
North South
4%
53%
39%
5%
5% 7% 7%22%
58%
18%
56%
34%
3% 2%
8% 10% 9%
71%45%
35%
51%
6%
42%
3%21%
7%
38% 29%
57%49%
8%
Figure 5: Livelihood-based coping strategies by governorate
HH not adoptingcoping strategies
Stress copingstrategies
Crisis copingstrategiesEmergency copingstrategies
Figure 6: Percentage of households adopting crisis and emergency coping strategies by district (2019-2020)
36% - 40%
41% - 60%
61% - 80%
>80%
AkkarAkkar TripoliTripoli
El Minieh-Dennie
El Minieh-Dennie
ZghartaZgharta
ElKoura
ElKoura HermelHermel
BcharreBcharre El BatrounEl Batroun
JbeilJbeil
KesrwaneKesrwane
El MetenEl Meten
ZahleZahle
RachayaRachaya
WestBekaa
WestBekaa
SaidaSaida
HasbayaHasbaya
MarjaayounMarjaayoun
BaabdaBaabdaAleyAley
BeirutBeirut
ChoufChouf
JezzineJezzine
BaalbekBaalbek
ElNabatieh
ElNabatieh
SourSourBent Jbeil
Bent Jbeil
2019 2020
COPING STRATEGIES

107
Anne
x 14
: Foo
d re
late
d co
ping
str
ateg
ies
in th
e la
st 7
day
s

108
Anne
x 15
: Ave
rage
num
ber o
f day
s fo
od re
late
d co
ping
str
ateg
ies
wer
e ap
plie
d

109
Anne
x 16
: Liv
elih
ood-
rela
ted
copi
ng s
trat
egie
s in
the
last
30
days

110
Anne
x 16
: Liv
elih
ood-
rela
ted
copi
ng s
trat
egie
s in
the
last
30
days
- co
ntin
ued

111
Anne
x 17
: Sum
mar
y of
ass
et d
eple
tion
copi
ng s
trat
egie
s

113112
FOOD SECURITYFood security implies that individuals have physical and economic access to enough quantities of safe and nutritious food at all times1. This chapter assessed the food security and the extent of food insecurity of Syrian refugee households and disaggregated the results by governorate and district.
- Food security for Syrian refugees witnessed drastic deterioration in 2020. The share of households who were severely and moderately food insecure increased significantly by 20 percentage points (from 29 percent in 2019 to 49 percent in 2020). In 2020, nearly half of the Syrian refugee households was food insecure (moderately or severely).- Food insecurity was the highest in the North (70%) and the South (67%).- More than 90% of the households that were food insecure (moderately or severely) were living below SMEB.- Food insecurity has increased in the three pillars of food security: food consumption, livelihood-based coping strategies and share of expenditures. The share of expenditures on food highly increased in 2020, following economic vulnerability rise.- Food expenditure’s share from the total expenditure increased from 44 percent in 2019 to 48 percent in 2020; additionally, the share of households spending less than 50% of their total expenditures on food has decreased from 64% to 55%, which indicated further economic vulnerability. - Women-headed households were more food insecure than men-headed households (55% vs. 48% respectively). This followed a similar trend in comparison to 2019, where 35% of women-headed households were food insecure, compared to 28% of men-headed ones.- Households living in non-residential shelters (56%) were more food insecure than those living in non-permanent shelters (54%) or residential shelters (46%).
KEY FINDINGS
1World Food Summit 1996 © FAO/Hadi Abou Ayash

114
FOOD SECURITY
FOOD SECURITY METHODOLOGY
The food security status of Syrian refugees in Lebanon is measured using a composite indicator that combines three dimensions of food security:
• current consumption as determined by the food consumption score;
• food as a share of total expenditure reflecting economic vulnerability; and
• asset depletion strategies (livelihood coping strategies) which indicate the long-term coping capacity of livelihoods to shocks.
In order to compare the 2020 data with trends of the previous years, the methodology used to classify households was replicated as in previous VASyR assessments and detailed in Annex 28. Based on this methodology, households were classified into four categories: food secure, marginally food insecure, moderately food insecure and severely food insecure. Table 1 described the characteristics of the four categories.
Figure 1: Food insecurity trends 2016-2020
2016 2017 2018 2019 2020
7% 9% 10% 8% 4%
4%
47%
45%
63%
28%1%
53% 57%
31%3%
36%2%
58%
34%
4% 5% 5% 5% 6%
55% 55%
37%
2%
2% 2%31%
63%
28%
62%
8%36%4% 4%
12% 2%
36%
56%
6%
60%
25%3%
58%
36%
63%
32%1% 1%
47%
46%
4%
1%
Moderately food insecure
Marginally food insecure
Moderately food insecure Marginally food insecure
Severely food insecure
Severely food insecure
Food secure
Food secure
Overall, food insecurity among Syrian refugee households has significantly increased by 1.7 times compared to 2019. Households witnessed 18 percentage points increase in moderately food insecure households and 3 percentage points increase in severely food insecure ones. These reported levels were the highest in comparison to previous years. Additionally, the share of food secure households has decreased by twofold, from 8% in 2019 to 4% in 2020 – the lowest level of food security reported over the past five years. Moreover, the share of marginally food insecure households has decreased by 16 percentage points.
Lebanon witnessed a multi-faceted crisis starting with public unrest, economic slump, COVID-19 and Beirut Blast. The food insecurity results were in line with the overall situation. Almost 90% of the Syrian refugees were living below the SMEB with 34 percentage points increase compared to 2019, as well as 10% increase in the mean debt per household for households with debt, 7.3 percentage points decrease in households with working members and 7% decrease in average weekly per capita income for households with working members.
Figure 2: Food insecurity by governorate
Total Akkar Baalbek-El Hermel
Beirut Bekaa El Nabatieh MountLebanon
North South

115
Food insecurity has increased in all governorates. It almost doubled in the North (from 38% in 2019 to 70% in 2020), the Bekaa (from 26% in 2019 to 62% in 2020) and El Nabatieh (from 18% in 2019 to 40% in 2020), and almost tripled in the South governorate (from 23% in 2019 to 67% in 2020). Similar to 2018 and 2019, female-headed households were more food insecure than male-headed ones (55%
FOOD SECURITY
Figure 4: Food consumption trends 2016-2018
2016 2017 2018 2019 2020
19%
50%
30%
75%
20%5%
62% 67%
23%
10%
27%
11%
68%
24%
8%
Borderline
Acceptable
Poor
At a district level, the highest food insecurity level was reported in Saida at 83% (up by 60%) followed by Zgharta at 74% (up by 26%), El Minieh-Dennie at 72% (up by 31%) and Bcharre at 70% (up by 22%). The lowest food insecurity level was reported in Beirut at 28%, up by 9% compared to 2019.
vs. 48%). Additionally, households living below the SMEB were the most food insecure (51%) compared to other S/MEB categories. Households living in non-residential shelters were more food insecure (56%) than those living in non-permanent (54%) and residential (46%) shelters; this followed the previous year trend.
Figure 3: Percentage of households with moderate and severe food insecurity
< 20%
21% - 40%
41% - 60%
61% - 80%
>80%
Zgharta
Marjaayoun
ElNabatieh
AkkarTripoli
El Minieh-Dennie
ElKoura Hermel
El Batroun
Jbeil
Kesrwane
El Meten
Zahle
Rachaya
WestBekaa
SaidaHasbaya
Marjaayoun
BaabdaAley
Beirut
Chouf
Jezzine
Baalbek
ElNabatieh
SourBent Jbeil
El Meten
AkkarTripoli
El Minieh-Dennie
ElKoura Hermel
El Batroun
Jbeil
Kesrwane
Zahle
Rachaya
WestBekaa
Saida
Hasbaya
BaabdaAley
Beirut
Chouf
Jezzine
Baalbek
SourBent Jbeil
2020
FOOD CONSUMPTIONAs shown in the below figure, the level of poor and borderline food consumption (49%) was the highest and the level of acceptable food consumption (50%) was the lowest over the past years. This implies that the multi-pronged crisis that the country witnessed last year led to considerable deterioration in the food consumption level of Syrian refugees.
COMPONENTS OF FOOD SECURITY

116
LIVELIHOOD-BASED COPING STRATEGIES TRENDS
FOOD AS A SHARE OF HOUSEHOLD EXPENDITURES
Thirty-eight percent of Syrian refugee households were applying stress coping strategies, the highest level over the past years and up from 30% in 2019. Stress coping strategies included selling household goods, spending savings, buying food on credit and borrowing money. The share of households applying emergency coping strategies
Forty six percent of Syrian refugee households were spending more than 50% of their expenditure on food, up by 9.3 percentage points compared to 2019. The higher the share of household expenditure on food, the more
slightly decreased by 1.7 percentage points only between 2019 and 2020. Emergency coping strategies included begging, selling of house or land in Syria, accepting high risk, illegal and socially degrading activities, as well as involving school children in income generation.
they were economically vulnerable; hence, the year 2020 figure (45.5%) showed that households were getting more economically vulnerable. Therefore, their food security was also deteriorating.
Figure 5: Food expenditure share trends 2019 - 2020
>=50 - 65% >=65 - 75%< 50% >=75%
Percentage of household expenditure on food
202055%
27%
12%7%
201923% 64%
9%5%
CHARACTERISTICS OF FOOD INSECURITYThe following section studied the characteristics of the food insecure households, especially in terms of sector indicators.
S/MEB: Ninety-nine percent of severely food insecure households were below the SMEB level, up by 24 percentage points compared to 2019. Moreover, 92% of moderately food insecure households were below the SMEB level.
Debt: Sixty-three percent of severely food insecure households had debt greater than LBP 900,000, while 66.6% of moderately food insecure households were borrowing more than LBP 900,000. The majority of severely and moderately food insecure households were borrowing money to buy food at 95.9% and 94.3% respectively. The second reason to borrow money was to pay rent.
Expenditure level: The level of expenditure per capita among severely food insecure households was one of the lowest in comparison to the other groups, at LBP 117,705. The expenditure levels for all food security groups were overall higher than those in 2019, indicating the high
inflation in prices that took place in 2020. Moreover, severely food insecure households were the most economically vulnerable households among all groups.
Income Sources: Severely food insecure households were relying the most on informal credit/debt in comparison to other food security groups. They were the group to rely most on WFP food e-cards.
Working members: Food secure households had the highest level of working members at 67.4% while severely and moderately food insecure households had the lowest levels of working members (49.2% and 47.4% respectively) compared to the other food security groups.
Demographics: Twenty-two percent of moderately food insecure households were female-headed, similar to the figure reported in 2019. 15% of severely food insecure households were female-headed, down by 10 percentage points compared to 2019 (25%).
FOOD SECURITY

117
Table 1: Food security by sectors indicators
FOOD SECURITY

118
Annex 18: Food security classification
The Food security classification is based on the combination of three main indicators: food consumption score, livelihood coping strategies and expenditure share.
- The food consumption score measures the current food consumption. Households are grouped based on the variety and frequency of foods consumed as indicated in the FCS Annex. The FCS is grouped into three categories: acceptable, borderline and poor. Another group is created for the classification of food security combining those who have an acceptable food consumption and who applied any food related coping strategies.
- Share of food expenditures measures the economic
2. Calculate the coping capacity indicator by computing a rounded mean for the coping strategies index and the food expenditures share index;
3. Calculate the ‘Food security classification’ by computing a rounded mean of the household’s FCS score index and the Coping Capacities indicator. This variable will have a value from 1 to 4 and represents the household’s overall food security outcome.
vulnerability. Households are categorized based on the share of total expenditures directed to food. Households which allocate more of their expenditures on food are more likely to be food insecure.
- The livelihood coping strategies measures sustainability of livelihoods. Households are categorized based on severity of livelihood coping strategies. Households which didn’t apply any coping strategies fall under the category of food security.
Food security classification include four categories: food secure, marginally food insecure, moderately food insecure and severely food insecure
The table below describes the combination of components for the FS classification.
The steps to compute food security categories are the following:
1. Convert the three food security indicators into four-point scale indices:
- Coping strategy index- Food expenditure share index- Food consumption score index that was classified
into four groups as follows:
FCS Groups
Acceptable
Acceptable with food-related coping strategies
Borderline
Poor
1
2
3
4
Score
The FS methodology used in the VASyR slightly differs from the WFP CARI methodology. This choice was necessary in order to maintain consistency and comparativeness along the different VASyRs over the past six years while the CARI was developed and finalized only in 2015. The main difference in the two methods in 2019 consists in:
- The aggregation of food consumption and food related coping strategies in the second food consumption group as shown in the below table.
WFP advocates that the methodology should remain the same to ensure the comparability of results over the years.
As for the nomenclature for the food security categories as mentioned in the VASyR 2018 report; the VASyR 2019 is consistent with the WFP corporate definitions nomenclature by replacing mildly food insecure by marginally food insecure.
Please find below the link for more information about food security classification in CARI:
http://www.wfp.org/content/consolidated-approach-reporting-indicators-food- security-cari-guidelines
FOOD SECURITY

119
FOOD SECURITY
Annex 19: Food security classification

121120
ENERGYThis chapter analyses the access to electricity by Syrian refugee households in Lebanon. It also assesses the hours of electricity supplied by the national grid versus private diesel generators.
- Like 2019, 96% of Syrian refugee households had some access to electricity, mainly from the electricity grid and through diesel generators.- In 2020, the average hours of supply by diesel generators exceeded the hours of supply by the electricity grid. Electricity from the grid covered only 45% of the daily needs in 2020 (down from 55% in 2019), on average leaving 13 hours of power cuts nationally. - Increased reliance on diesel generators where the average hours of electricity supply from generators increased from 7 hours in 2019 to almost 13 hours in 2020. - On average 5 hours 25 minutes of electricity outage a day (up from 3 hours in 2019). - Forty-two percent of households paid for their electricity grid bill directly to the landlord or it was already included in their rent, while 43% paid directly to Electricité Du Liban(EDL) For 13.5% of households, no one was collecting electricity bills.- The use of renewable power, including solar panels and biomass/ biogas, remained negligible in all governorates.
KEY FINDINGS
© UNHCR

122
ACCESS TO ELECTRICITY
SOURCES OF ELECTRICITY
Overall, 96% of households had some access to electricity, while 4% reported having no access. Female-headed households had a slightly lower access (93%).
When considering the sources of electricity, 93% of households had access to the grid. Households living in non-residential and non-permanent shelters had less connection to the grid (88% and 89% respectively). While over 90% of households could access electricity from the gird in most governorates, in the South accessibility was only 76%.
ENERGY
Figure 1: Access to electricity
Figure 2: Access to electricity per shelter type
Total Residential Non-Residential
Non-Permanent
96% 96% 97% 96% 93% 92% 94% 97%
Have some access
Don't have access
2019
2020
96%
4%
Figure 3: Access to electricity per governorate
Total Akkar Baalbek-El Hermel
Beirut Bekaa El Nabatieh MountLebanon
North South
2019 2020
96% 96% 96%97% 97% 97% 97% 92%88%99% 99%
78%
99% 99% 100% 95%92% 98%
Looking at access to electricity per geographical area, the South scored as the governorate with the lowest rate at 78%.
Access to diesel generators was lower at 61% and varied significantly per governorate ranging from 85% in Akkar to 40% in Beirut and the Bekaa. The use of renewable power, including solar panels and biomass/ biogas, remained negligible in all governorates.
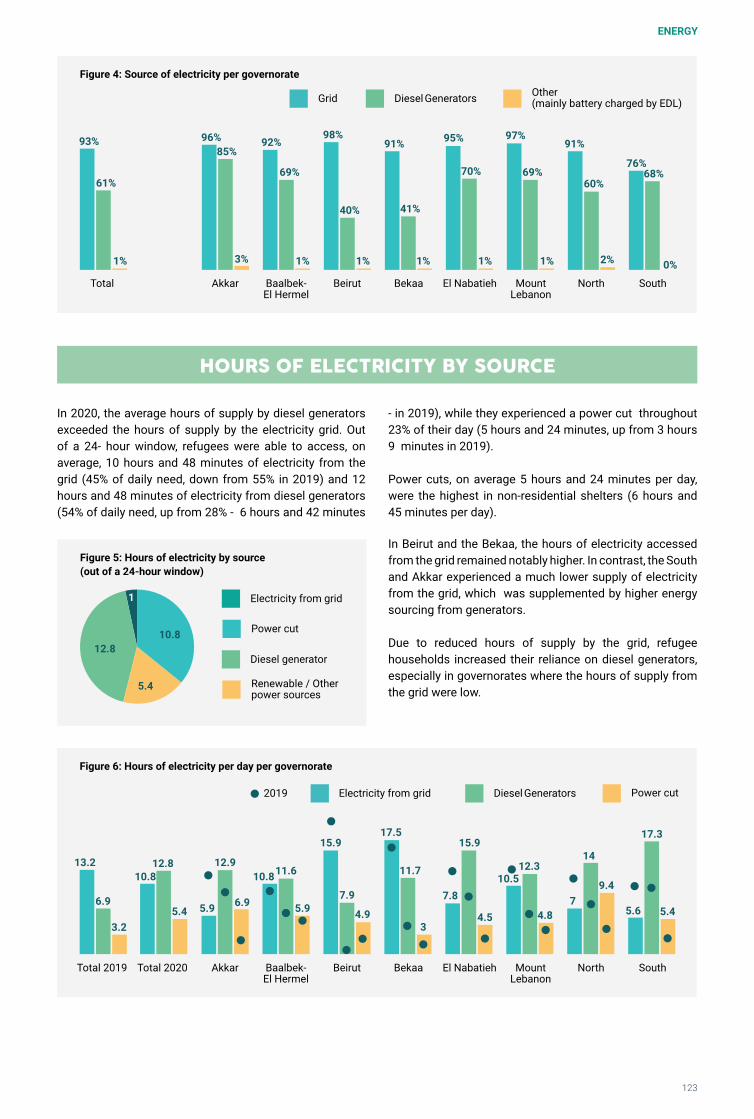
123
HOURS OF ELECTRICITY BY SOURCE
In 2020, the average hours of supply by diesel generators exceeded the hours of supply by the electricity grid. Out of a 24- hour window, refugees were able to access, on average, 10 hours and 48 minutes of electricity from the grid (45% of daily need, down from 55% in 2019) and 12 hours and 48 minutes of electricity from diesel generators (54% of daily need, up from 28% - 6 hours and 42 minutes
ENERGY
Figure 6: Hours of electricity per day per governorate
Figure 4: Source of electricity per governorate
Total 2020Total 2019
Total
Akkar
Akkar
Baalbek-El Hermel
Baalbek-El Hermel
Beirut
Beirut
Bekaa
Bekaa
El Nabatieh
El Nabatieh
MountLebanon
MountLebanon
North
North
South
South
10.813.2
93% 96%
61%
85%92%
98%91% 95% 97%
69%
91%
76%68%
60%
2%
70%
41%40%
69%
3%1% 1% 1% 1% 1% 1% 0%
12.8
6.95.4
3.2
5.9 5.9
12.910.811.6
15.9 15.9
10.512.3
14
17.3
9.4
5.6 5.47
4.8
17.5
11.7
3
7.9 7.8
4.54.96.9
- in 2019), while they experienced a power cut throughout 23% of their day (5 hours and 24 minutes, up from 3 hours 9 minutes in 2019).
Power cuts, on average 5 hours and 24 minutes per day, were the highest in non-residential shelters (6 hours and 45 minutes per day).
In Beirut and the Bekaa, the hours of electricity accessed from the grid remained notably higher. In contrast, the South and Akkar experienced a much lower supply of electricity from the grid, which was supplemented by higher energy sourcing from generators.
Due to reduced hours of supply by the grid, refugee households increased their reliance on diesel generators, especially in governorates where the hours of supply from the grid were low.
Diesel Generators Other(mainly battery charged by EDL)Grid
Diesel Generators Power cutElectricity from grid
Figure 5: Hours of electricity by source(out of a 24-hour window)
Electricity from grid
Power cut
Diesel generator
Renewable / Otherpower sources
10.8
5.4
12.8
1
2019

124
ELECTRICITY BILL COLLECTION
Collection of bills by EDL increased from 33% in 2019 to 43% in 2020.Forty-two percent of refugee household EDL bills were either collected by the landlord (26%) or were already included as part of the rent (16%). No bills were collected from 13% of households.
Like 2019, the highest rate of collection of bills by EDL was reported in Beirut (54%), El Nabatiyeh (51%) and Mount Lebanon (50%) while the lowest was in Akkar (33%).
Figure 7: Electricity bill collections
1% 13% 16%
43%
26%
85% Billed
Part of rent
EDL
Collected by thelandlord
Other
No bills arecollected
Part of rentEDL Collected by the landlord OtherNo bills are collected
Figure 8: Bills collection by governorate
Table 1: Electricity grid connection - frequency of payment
Total Akkar Baalbek-El Hermel
Beirut Bekaa El Nabatieh MountLebanon
North South
43% 33%44% 54% 38% 38%
36%
51% 50%
18%
22%7% 7%
19%
19%20%9%
44%
13%3%
10%
28%
6%
10%2%
55%
26% 26%
10%
18%
16%
13%
43%
20%
27%
10%
In 2020, there was an increase in the percentage of refugees living in non-permanent shelters (informal settlements). One-third of refugees living in non-permanent shelters (informal settlements) were paying the EDL electricity bills to the landlord (directly or part of the rent) and only 20% were paying directly to EDL staff compared to 38% of those living in residential shelters.
Of the 43% of households where EDL directly collected the bills, 69% paid monthly, whereas 30% paid every two months, with only 1% having settled their bills every 6 months. Refugee households more frequently tend to pay the landlords directly for the electricity grid, whereas 78% paid their bills every month.
Percentage calculated out of those who have access to EDL electricity and have their bills collected by EDL or Landlord.
ENERGY

125
EXPENDITURE ON ELECTRICITY
Like 2019, out of all visited households, 30% reported an expenditure on electricity from the grid (EDL) in the last 30 days, whereas 40% had an expenditure on generators during the same time period.
Looking only at of households who had expenditure on EDL (30% of households), the average amount spent was LBP 42,440 compared to LBP 64,612 for households who had expenditure on private generators (40% of households).
Taking into consideration all households (including those who spent zero), the average amount spent on electricity from the grid was LBP 13,737 (LBP 12,000 in 2019) per family monthly, whereas the average amount spent on generators was LBP 42,270 per family monthly, almost double the amount reported in 2019 (LBP 24,000).
Figure 10: Average amount spent on EDL and private generators - all households (including those who spent zero)
Total Akkar Baalbek-El Hermel
Beirut Bekaa El Nabatieh MountLebanon
North South
2020 EDL (LBP)2019 EDL (LBP) 2019 PrivateGenerators (LBP)
2020 PrivateGenerators (LBP)
13,7
37
9,51
9
14,1
54
23,7
03
12,5
48
12,5
48
7,88
3
12,7
88
3,00
0
7,50
0
22,5
00
19,5
00
13,5
00
12,0
00
10,5
00
10,5
00
19,5
00
31,5
00
28,5
00
22,5
00
34,5
00
30,0
00
16,5
00
19,5
00
12,0
0024
,000
42,2
70
23,8
04
31,6
67
34,2
75
41,4
62
41,4
62
36,1
17
57,3
48
34,4
574,
455
ENERGY SOURCES FOR COOKING
The main energy source used for cooking remained gas, as reported by 98% of households:
ENERGY

126
ENERGY SOURCES FOR HEATING
Oil (e.g. furnace oil) remained the number one source of heating for refugees reported by 39%; this source of energy for heating was used mostly in informal settlements where it was reported by 61% of households. The use of wood for heating has increased to 17% (12% in 2019) and was mostly used by households living in informal settlements.
ENERGY

128127
Findings in this chapter demonstrate gender inequalities across the Syrian refugee population, limiting access, rights and opportunities for women and girls, particularly as related to economic participation, education, food insecurity, humanitarian assistance, legal issues, and wider protections, including sexual and gender-based violence.
Compared with 2019, the vulnerability gap between female-headed households (FHHs) and male-headed households (MHHs) appeared to be shrinking in 2020. The evidence suggested that this was not because the situation for FHHs was improving, but because the overall socioeconomic situation was worsening for all households. Specific indicators included:
- Proportion of households below the SMEB: In 2020, 85% of Syrian FHHs and 90% of MHHs were below the SMEB, representing a rise from 63% and 53% in 2019 respectively.- Unemployment: Unemployment rates for women (45%) remained higher than those for men (38%) overall. Unemployment rates for both women and men increased by 8% since 2019.- Household per capita income:The gender gap in the per capita income between FHHs and MHHs with working household members effectively closed in 2020, with households averaging LBP 97,955 per week, in contrast to an approximate 0.44 gender income gap in 2019. In 2019, the mean per capita weekly income for MHHs was LBP 112,095 and in 2020 it was LBP 97,786, representing a 13% decrease. For FHHs, mean per capita weekly income increased from LBP 62,202 in 2019 to LBP 96,334 in 2020, representing a 54% increase. However, the identified increases in income for FHHs should not be interpreted as an increase in FHHs’ socioeconomic wellbeing. FHH with non working members still have a less per capita income than MHH.- Lack of legal residency: Women (18%) across all age groups were less likely to have legal residency compared with men (23%), but while the share of women without residency remained the same, it rose by 4 percentage points for men since 2019.- Accessing needed healthcare: In 2020, access to needed hospital care declined for FHHs by 16 percentage points, and for MHHs by 13 percentage points compared to 2019; during 2019, almost one third of FHHs (27%) did not have access to care compared with 17% of MHHs.- Child marriage: 26% of females aged 15-19 were married or had been engaged, separated, divorced or widowed while only 3% of boys were married.- Youth: Overall, 89% of young women compared with 57% of young men between the ages of 19-24 were not in education, employment or training.
However, women and FHHs remained more food insecure and dependent on humanitarian assistance:- FHH (55%) were slightly more food insecure than MHH (48%) and a far higher proportion of FHH (68%) than MHH (13%) were using coping strategies categorized as “crisis level or emergency level1.- Consistent with previous years, women continued participating in the paid labor force at very low rates: 12%, compared to 65% of men.- For income, FHHs were highly dependent on humanitarian assistance and informal credit lines, as opposed to working or depending on household members that work, and were becoming more so.- Almost half (45%) of FHHs reported either E-cards from WFP or ATM cards from humanitarian agencies as their main source of household income compared with 34% of MHHs. This represented a slight decrease for FHHs, 48% of which reported these main income sources in 2019 and an increase of MHHs with this dependency, 27% of which reported such in 2019.
KEY FINDINGS
© UNHCR/Diego Ibarra Sánchez
1 These percentages refer to households that were either severely or moderately food insecure.Stress: Household has debt | Bought food on credit | Spent savings | Sold household goodsCrisis: Reduced health expenditures | Reduced education expenditures | Withdrew children from school | Sold productive assets | Marriage of children under 18Emergency: Involved school children in income generation | Accepted high risk jobs | Sold house or land | Begged
GENDER ANALYSIS
In collaboration with

129
GENDER ANALYSIS OVERVIEW
This chapter was developed based on the gender-disaggregated results of each indicator included in the VASyR assessment2. Some survey questions were posed at the household level (i.e. the head of household was asked a question regarding the entire household) while others were posed at the individual level per each household member.
In keeping with trends in the past few years, there was an even split between men and women in the Syrian population and 19% of households self-identified as FHHs. Like in 2019, there was a gender gap among 20 to 30-year olds. In this age group, there was a slightly larger share of women compared to men. Otherwise, the population was relatively equally distributed among women and men in age categories of adults aged 30 and older, as well as among children and youth.
FHHs were smaller than MHHs on average and MHHs more frequently included young children. Similar to 2019, the average family size for MHHs was 5.3; whereas for FHHs, it was 4.1 and 60% of FHHs had 4 members or less compared with 37% of MHHs. A possible reason for this difference is that twice as many MHHs have young children in their household than FHHs: 65% of MHHs reported
This means full gender disaggregation is available for some findings, while disaggregation only by the gender of the head of household is available for others. Wherever possible, disaggregated findings at the individual level are reported throughout this chapter.
A note on Female-headed HouseholdsA female-headed household (FHH) is a household in which an adult female is the sole or main decision-maker, where a male headed household (MHH) is led by an adult male. In the VASyR, the head of household is self-identified, where enumerators ask the first person they encounter upon visiting the household to designate the main decision-maker of the household. If the head of the household is not available, information about this person is gathered and enumerators interview another adult in the family capable of conducting the interview. Hence in some cases, the sex of the head of the household (HoH) and that of the respondent is different. In the VASyR 2020, 67% of respondents were male and 33% were female, suggesting a male data bias the overall VASyR findings.
It should be noted that in many Syrian communities across Lebanon, women are not usually considered as heads of households unless no adult male is living permanently in the household as the patriarchal assumption is often that the head of a household is always an adult man, even if a woman’s economic contribution to the household’s maintenance is the same or greater.
DEMOGRAPHICS
having children under 5 in the household compared with 37% of FHHs. MHHs having more young children means they had a slightly higher dependency ratio (1) than FHHs (.92). Almost twice as many FHHs (48%) had no dependent or only one dependent compared with MHHs (28%), while MHHs reported having more dependents overall.
These demographic differences between FHHs and MHHs are potentially related to a smaller proportion of FHHs with women who are bearing children, supported by the fact that MHHs (33%) include at least one household member who is pregnant or lactating far more frequently than FHHs (13%). Moreover, 28% of FHHs were widowed and 17% divorced/ separated, while none of MHHs fell into these categories. All these findings are consistent with those of 2019, indicating little change.
GENDER ANALYSIS
2 Gender Analysis was conducted by UN Women, in partnership with UNHCR, UNICEF, and WFP.
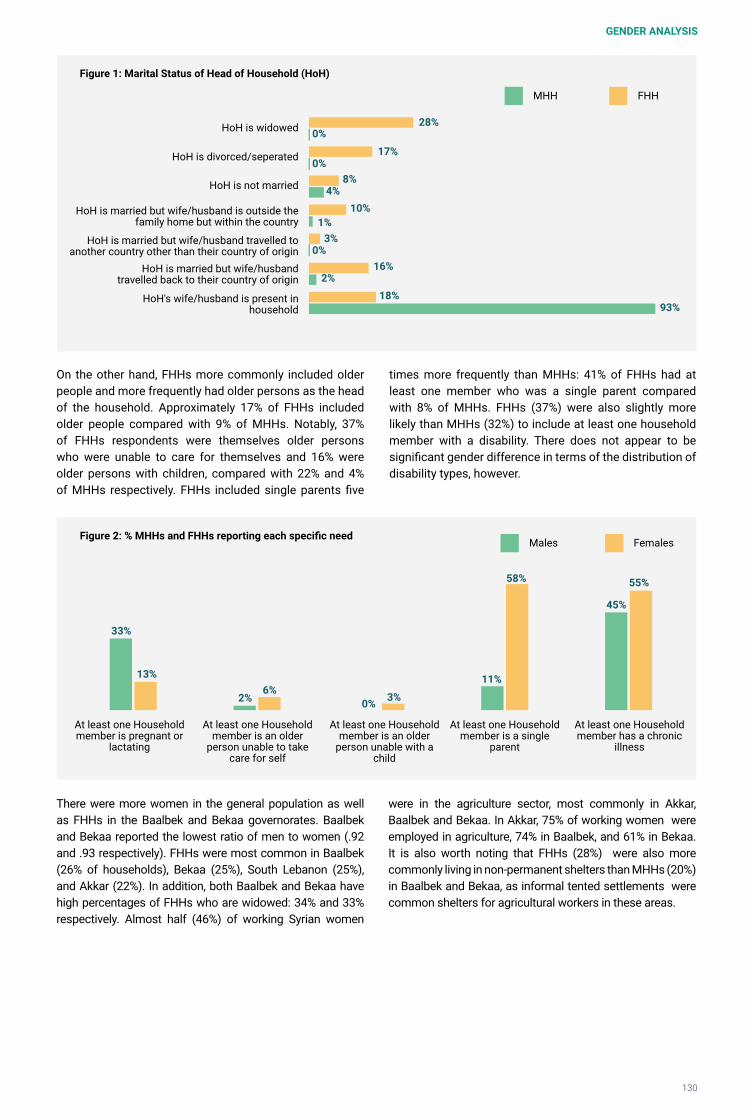
130
At least one Household member is pregnant or
lactating
At least one Household member is an older
person unable to take care for self
At least one Household member is an older
person unable with a child
At least one Household member is a single
parent
At least one Household member has a chronic
illness
33%
13%
2% 0% 3%
11%6%
58%
45%
55%
Figure 2: % MHHs and FHHs reporting each specific needMales Females
MHH FHH
Figure 1: Marital Status of Head of Household (HoH)
HoH is widowed
HoH is divorced/seperated
HoH is not married
HoH is married but wife/husband is outside the family home but within the country
HoH is married but wife/husband travelled to another country other than their country of origin
HoH is married but wife/husband travelled back to their country of origin
HoH's wife/husband is present in household
28%
17%
10%
8%
3%
4%
1%
2%
0%
0%
0%16%
18%93%
On the other hand, FHHs more commonly included older people and more frequently had older persons as the head of the household. Approximately 17% of FHHs included older people compared with 9% of MHHs. Notably, 37% of FHHs respondents were themselves older persons who were unable to care for themselves and 16% were older persons with children, compared with 22% and 4% of MHHs respectively. FHHs included single parents five
There were more women in the general population as well as FHHs in the Baalbek and Bekaa governorates. Baalbek and Bekaa reported the lowest ratio of men to women (.92 and .93 respectively). FHHs were most common in Baalbek (26% of households), Bekaa (25%), South Lebanon (25%), and Akkar (22%). In addition, both Baalbek and Bekaa have high percentages of FHHs who are widowed: 34% and 33% respectively. Almost half (46%) of working Syrian women
times more frequently than MHHs: 41% of FHHs had at least one member who was a single parent compared with 8% of MHHs. FHHs (37%) were also slightly more likely than MHHs (32%) to include at least one household member with a disability. There does not appear to be significant gender difference in terms of the distribution of disability types, however.
were in the agriculture sector, most commonly in Akkar, Baalbek and Bekaa. In Akkar, 75% of working women were employed in agriculture, 74% in Baalbek, and 61% in Bekaa. It is also worth noting that FHHs (28%) were also more commonly living in non-permanent shelters than MHHs (20%) in Baalbek and Bekaa, as informal tented settlements were common shelters for agricultural workers in these areas.
GENDER ANALYSIS

131
Figure 4: Percentage of individuals 15 years or older holding legal residency permits, by gender and age group Males Females
15-19Age group 20-24 25-29 30-34 35-39 40-44 45-49 50-54 55-59 60-64 65-69 70 and above
14%11%
15%
19% 19%
17%
21% 20% 20%23% 22%
19% 19%
15%12%
23%
29% 29% 29% 29%27% 27%
33%
13%
UNHCR Certificate Sponsorship Courtesy Tourism Rent/PropertyOwnership
Other
44%
68%
46%
0.3% 0.2% 0.2% 1%1%0.1%
19%9% 11%
Figure 5: Residency Categories by GenderMales Females
Figure 3: Rates of legal residency by gender(2018 to 2020)
Males
Females
2018 2019 2020
24%
18%
31%
23%
27%
18%
PROTECTION
Rates of legal residency have continued declining over the years for both men and women. Women (18%) across all age groups are less likely to have legal residency compared with men (23%).
Lack of legal residency was particularly prevalent for both genders in the 15-19 age group (86% for men and 89% for women), as well as those above the age of 70 (87% for men and 88% for women). It is worth noting that while the proportion of women without legal residency remained the same compared with 2019, it increased for men by 5 percentage points. FHHs were also slightly less likely to have all members of their households with legal residency. Male household members being prioritized for legal residency in Syrian refugee households is likely a result of men being more likely to work and of the perceptions that men were more likely to be arrested or detained without legal documentation compared with women.
Males who had residency had more often obtained it via sponsorship (46%) than females (19%). This could be connected to the fact that men (65%) were more often in the labor force3 than women (12%) and the sponsorship system is connected to labor. The most prevalent reasons for FHHs lacking legal residency was inability to secure
a sponsor (32%) while men were more likely to lack legal residency due to reasons linked to previous renewal based on sponsorship. As opposed to sponsorship, the most common form of residency for women was UNHCR certification: women (68%) were more likely than males (44%) to have residency in the form of UNHCR certificates.
3 The labor force refers to the number of individuals either employed or who are of working age and looking for work in the paid economy. For the purpose of this assessment, it covers everyone who stated they had worked in past 7 days or who stated they had actively looked for work in past 30 days (or have tried starting a business during same time period). Work, in this sense, includes: working for someone else for pay, working in own- or family farming, working in any other kind of business activity, doing other activities to generate income (e.g. casual work, making things to sell), and help without pay in a family business. Household labor is not calculated as part of the labor force.
GENDER ANALYSIS

132
Consistent with the findings of previous VASyR reports, child labor was a key protection issue among boys while child marriage was a more pressing issue for girls. The rate of children engaged in child labor rose from 2.6% in 2019 to 4.4% of all children in 2020. A higher proportion of boys (7%) were working than girls (2%) and spent more time per week on average working; this includes girls’ domestic labor and care work, which is often disregarded as unpaid female labor. Working boys spent 54 hours/week compared to working girls who spent 34 hours. The nature of work performed is gendered: while boys were more likely to be engaged in economic activities, such as agriculture, girls were more likely to be working in household chores, for which they were often unpaid. Child labor was often linked with economic vulnerability, where sending young boys to work was a coping mechanism of poverty. In fact, 95% of households with children working fell beneath the SMEB.
Girls, on the other hand, were far more likely to be exposed to child marriage. 26% of females aged 15-19 were married or had been engaged, separated, divorced or widowed while only 3% of boys were married.
High concentrations of women relative to the broader population appeared to be living in non-permanent informal tented settlements in the Bekaa and Baalbek governorates. FHHs were over-represented in these areas: they constituted 25% of households in the Bekaa and 26% in Baalbek compared with the national average of 18%, and the ratio of men to women was lower than the national average. Consistent with previous years, FHHs (27%) were more frequently living in tents than MHHs (19%) and FHHs (15%)
The absence of legal residency exposes both women and men to heightened protection concerns such as a risk of arrest, detention or extortion. Women who lack residency are also less likely to approach police or justice mechanisms to report incidents of harassment or violence. This means a lack of legal recourse and justice for gender-based violence against Syrian women, which is highly prevalent. Without valid residency permits refugees are unable to complete administrative processes to obtain civil documentation such as registering marriages or births of children. For example, women (10%) are slightly more likely than men (5%) to have no marriage documentation. Most children who were born in Lebanon have not been registered at the Foreigners’ registry, but even fewer children born to FHHs had been registered there. Only 21% of households headed by women had registered births with the Foreigners’ registry compared to 29% of male-
4 This process involves notifications issued by a doctor, obtaining a birth certificate from a mukhtar, obtaining a certificate registered with the Noufous, registering the birth with the Foreigners Registry, getting the Ministry of Foreign Affairs (MoFA) stamp on the birth certificate as well as a stamp from the Syrian Embassy.
headed households. FHHs are behind on all steps4 involved with registering births. The main reasons women are not registering births are due to the prohibitive cost (43%) and not being aware of procedures (35%). In addition, women are less likely than men to approach the GSO to undertake these procedures: 66% of women compared with 50% of men said they had never approached GSO.
Response rates for safety and security questions were low overall, but it appeared that MHHs were slightly more likely to have been extorted, robbed, to have been involved in community violence, to have been detained, had their identity documents confiscated or had a curfew imposed on them. On the other hand, FHHs (17.5%) were slightly more likely than MHHs (13.6%) to report that lack of safety compelled their movement.
Child marriage was particularly prevalent in Beirut governorate, where 37% of all women aged 15-19 were married. Although child marriage was also often linked to economic vulnerability, households with married girls were slightly less economically vulnerable. This surprising finding was consistent with the results in 2019 and should be further explored.
CHILD PROTECTION
SHELTER
Figure 6: Marital status for 15-19 year old boys and girls
Boys Girls
Single Married Separated Divorced
97%
74%
3%
24%
0% 0%1% 1%
were more often hosted for free than MHHs (8%). This trend could be a result of landlords being more sympathetic to the needs of FHHs, where the culture asks communities to ‘protect’ women, or worse, free shelter could be indicative or more exploitative conditions where women are subjected to work for rent or sex for rent. Notably there was no significant difference between MHHs and FHHs in terms of the 5% of HoH under threat of eviction.
GENDER ANALYSIS

133
MHH FHHFigure 7: MHH and FHH in non-permanent shelter types by governorate
Total Akkar Baalbek-El Hermel
Bekaa El Nabatieh MountLebanon
North South
74%
26%
3%
77% 82%
18%
74%
23%
73%
26%28%
80%
20%
97%
27%
72%
MHHs are more commonly living in residential settings which are more likely to be overcrowded and where they pay more on average than FHHs in rent. The median rent for MHHs was LBP 250,000 compared with LBP 200,000 for FHHs. Of the 6% of tenants that experienced a change in the cost of rent in the past three months, MHHs (74%) were more likely than FHHs (63%) to have had their rent increase. In addition, MHHs lived in slightly more crowded settings (8.97 meters per person) than FHHs (9.29 meters per person). These disparities could be an effect of MHHs having more children to accommodate on average than FHH.
There was no significant gender difference in terms of the types of rental agreements (verbal vs. written), whether
lease agreements were registered with the municipality, payment of municipal taxes, periods of rental agreements or the proportion of households that reported any change in rental cost. Nor was there a notable gender difference in the 18% of households living in sub-standard shelter conditions overall.
Possibly due to differences in the prevalence of shelter types, MHHs (52%) were more likely than FHHs (45%) to state cost of rent as the most important factor in selecting a place of residence while FHHs (33%) were more likely than MHHs (21%) to state proximity to family or relatives as their main reason for selecting a residence, likely due to gendered sociocultural norms.
The main gender difference in terms of men and women’s access to WASH was the proportion of FHHs (67%) with access to improved sanitation facilities that were not shared was lower than MHHs (78%). This could be related to the different shelter types common for both groups and should be further explored. In addition, a smaller proportion of FHHs (67%) had access to drinking water than MHHs (74%), perhaps due to higher economic vulnerability. On the other hand, FHHs benefitted from NGO WASH services
About half (49%) of Syrian children aged 3-17 were enrolled at the beginning of the school year in 2020, and consistent with 2019 findings. The gender parity index indicated that the share of girls in school remained almost equal to that of boys at primary level. The share of girls was reported to be slightly higher than that of boys at lower secondary (1.14) and lower at higher secondary. MHHs more commonly had very young children in the family so they were more likely to have children not at school age (39% MHHs vs. 22% FHHs). As in all previous assessments, reasons for not sending children to school were different for boys and girls: 30% of
WASH
EDUCATION
more: 11% of FHHs had their water trucked by UN or NGO providers compared with 7% of MHHs. Apart from this, there were no notable differences in terms of types of improved water sources used. Nor were there differences between MHHs and FHHs in types of unimproved water sources used, use of improved drinking water sources, distance from drinking water sources, and use of improved sanitation facilities.
boys between the ages of 15 and 18 not attending school were not attending due to work compared with 10% of girls, while 25% of girls not attending school who were in this age range were not attending due to marriage. Not attending school due to work rose to 43% for young men in the 19-24 age group and not attending due to marriage to 58% of young women 19-24. In general, women in this age group were neither enrolled in education nor participating in the labor market. Overall, 89% of young women compared with 57% of young men between the ages of 19-24 were not in education, employment or training.
GENDER ANALYSIS

134
Women (61%) were slightly more likely than men (56%) to have required primary healthcare in the 6 months prior to the assessment. Among households that did not access the care they needed, FHHs (94%) were markedly less likely than MHHs (83%) to not attend the health care consultations they required in the first place. Compared with 2019, the rate at which MHH and FHHs did not access the hospital care they needed appears to have evened out. In 2019, 27% of FHHs did not access needed hospital care compared with 17% of MHHs, while in 2020 these figures fell to 16% and 13% respectively.
Reasons for not accessing healthcare somewhat differed between men and women. FHHs (67%) were more likely than MHHs (44%) to cite transportation costs as a reason for not accessing primary health care services and somewhat more likely than MHHs to cite the cost of drugs as the reason (86% FHHs vs. 75% MHHs). MHHs (86%) were more likely
HEALTH
than FHHs (72%) to not access the hospital due to the cost of treatment. FHHs (10%) were far more likely than MHHs (1%) to say they refrained from going to the hospital due to the way they are treated by the hospital staff. It appeared that transportation costs also weigh into women’s decision making around which healthcare service to access more so than men. FHHs (54%) were more likely than MHHs (41%) to report accessing a given primary healthcare service because of its proximity to where they live, while MHHs (54%) are more likely than FHHs (40%) to access based on a trusting relationship with the doctor or pharmacist.
FHHs (35%) were slightly more likely than MHHs (30%) to have received information on COVID-19. However, there were no notable differences in the types of information households received nor knowledge on where to receive services if a family member is suspected to have COVID-19.
FHHs were struggling to send their children to school for financial reasons, particularly during the pandemic and the change to remote learning modalities, which collectively contributed to increased household chores and care work for women. FHHs more commonly stated financial reasons such as transportation costs (25% FHHs vs. 13% MHHs) and education material costs (27% FHHs vs. 19% MHHs) as the reasons for not sending children to school. Data showed that most children (65%) attended schools only physically at the beginning of the 2020 school year.
When learning switched to online modalities during the pandemic, many children did not attend school. For one third (33%) of children who attended school partially or fully online learning, this shift was challenging, and reasons for this challenge differed for MHHs and FHHs. FHHs (38%) were more likely than MHHs (25%) to say their children were unable to follow remote learning modalities due to not having the qualifications or time to teach children as needed, while MHHs (59%) were more likely than FHHs (48%) to state lack of internet access as the reason.
GENDER ANALYSIS
Figure 8: Reasons for not enrolling in school19
to 2
4 Male
0% 50% 100%
Work
Cost of
education Transportation
Other reasonscostmaterials
Marriage
Male
Male
Female
Female
Female
15 to
18
6 to
14
School did not allow enrollment
Difficulties at school with curriculum or language of instruction
FOOD CONSUMPTION AND ECONOMIC VULNERABILITY
Overall, households under the SMEB rose dramatically from approximately 55% in 2019 to 89% in 2020. While in previous years FHHs have tended to be more economically insecure than MHHs, this gap appeared to have grown smaller during 2020 as the rate of MHHs below the SMEB has risen dramatically during the economic crisis and COVID-19 pandemic. In 2020, 85% of Syrian FHHs and 90% of MHHs
were below the SMEB, representing a rise from 63% and 53% in 2019 respectively. There did not appear to be a significant difference between FHHs and MHHs in terms of household expenditure patterns, apart from FHHs being slightly more likely than MHHs to spend more on health (15% FHHs total expenditure vs. 9% MHHs).
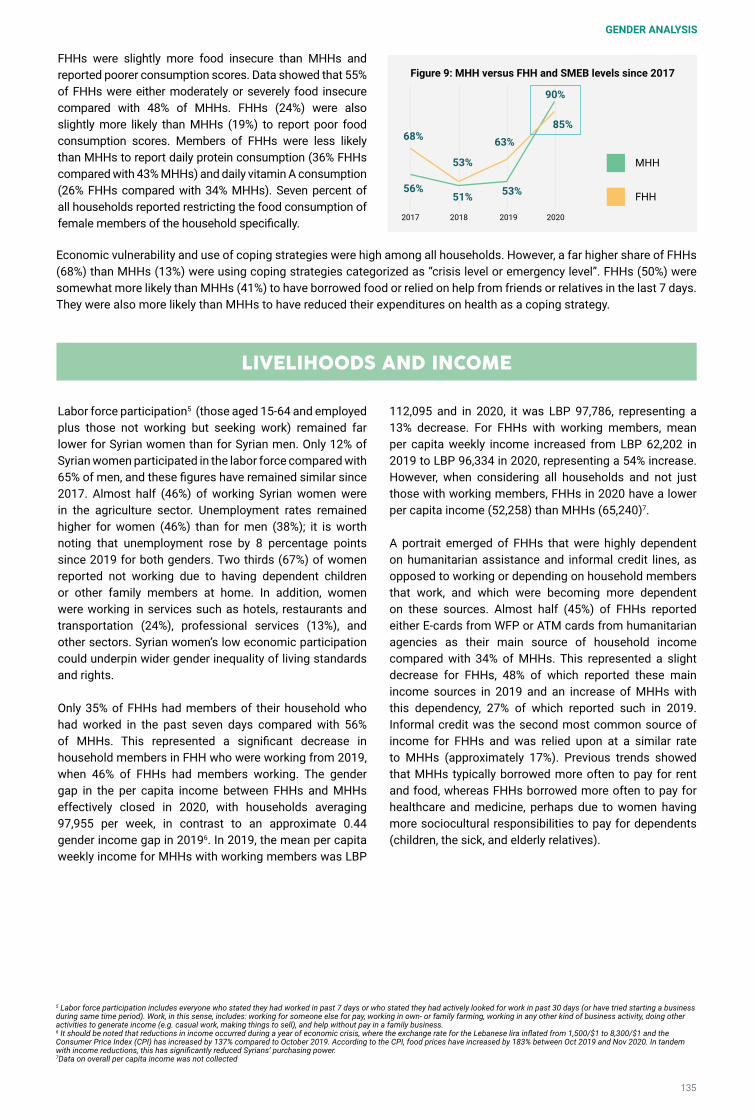
135
5 Labor force participation includes everyone who stated they had worked in past 7 days or who stated they had actively looked for work in past 30 days (or have tried starting a business during same time period). Work, in this sense, includes: working for someone else for pay, working in own- or family farming, working in any other kind of business activity, doing other activities to generate income (e.g. casual work, making things to sell), and help without pay in a family business. 6 It should be noted that reductions in income occurred during a year of economic crisis, where the exchange rate for the Lebanese lira inflated from 1,500/$1 to 8,300/$1 and the Consumer Price Index (CPI) has increased by 137% compared to October 2019. According to the CPI, food prices have increased by 183% between Oct 2019 and Nov 2020. In tandem with income reductions, this has significantly reduced Syrians’ purchasing power.7Data on overall per capita income was not collected
FHHs were slightly more food insecure than MHHs and reported poorer consumption scores. Data showed that 55% of FHHs were either moderately or severely food insecure compared with 48% of MHHs. FHHs (24%) were also slightly more likely than MHHs (19%) to report poor food consumption scores. Members of FHHs were less likely than MHHs to report daily protein consumption (36% FHHs compared with 43% MHHs) and daily vitamin A consumption (26% FHHs compared with 34% MHHs). Seven percent of all households reported restricting the food consumption of female members of the household specifically.
Labor force participation5 (those aged 15-64 and employed plus those not working but seeking work) remained far lower for Syrian women than for Syrian men. Only 12% of Syrian women participated in the labor force compared with 65% of men, and these figures have remained similar since 2017. Almost half (46%) of working Syrian women were in the agriculture sector. Unemployment rates remained higher for women (46%) than for men (38%); it is worth noting that unemployment rose by 8 percentage points since 2019 for both genders. Two thirds (67%) of women reported not working due to having dependent children or other family members at home. In addition, women were working in services such as hotels, restaurants and transportation (24%), professional services (13%), and other sectors. Syrian women’s low economic participation could underpin wider gender inequality of living standards and rights.
Only 35% of FHHs had members of their household who had worked in the past seven days compared with 56% of MHHs. This represented a significant decrease in household members in FHH who were working from 2019, when 46% of FHHs had members working. The gender gap in the per capita income between FHHs and MHHs effectively closed in 2020, with households averaging 97,955 per week, in contrast to an approximate 0.44 gender income gap in 20196. In 2019, the mean per capita weekly income for MHHs with working members was LBP
LIVELIHOODS AND INCOME
112,095 and in 2020, it was LBP 97,786, representing a 13% decrease. For FHHs with working members, mean per capita weekly income increased from LBP 62,202 in 2019 to LBP 96,334 in 2020, representing a 54% increase. However, when considering all households and not just those with working members, FHHs in 2020 have a lower per capita income (52,258) than MHHs (65,240)7.
A portrait emerged of FHHs that were highly dependent on humanitarian assistance and informal credit lines, as opposed to working or depending on household members that work, and which were becoming more dependent on these sources. Almost half (45%) of FHHs reported either E-cards from WFP or ATM cards from humanitarian agencies as their main source of household income compared with 34% of MHHs. This represented a slight decrease for FHHs, 48% of which reported these main income sources in 2019 and an increase of MHHs with this dependency, 27% of which reported such in 2019. Informal credit was the second most common source of income for FHHs and was relied upon at a similar rate to MHHs (approximately 17%). Previous trends showed that MHHs typically borrowed more often to pay for rent and food, whereas FHHs borrowed more often to pay for healthcare and medicine, perhaps due to women having more sociocultural responsibilities to pay for dependents (children, the sick, and elderly relatives).
Figure 9: MHH versus FHH and SMEB levels since 2017
MHH
FHH
68%
53%
53%
85%63%
90%
51%56%
20182017 2019 2020
Economic vulnerability and use of coping strategies were high among all households. However, a far higher share of FHHs (68%) than MHHs (13%) were using coping strategies categorized as “crisis level or emergency level”. FHHs (50%) were somewhat more likely than MHHs (41%) to have borrowed food or relied on help from friends or relatives in the last 7 days. They were also more likely than MHHs to have reduced their expenditures on health as a coping strategy.
GENDER ANALYSIS

136
United Nations High Commissioner for Refugees (UNHCR)Lebanon Country OfficeS&K Building, Nicolas Ibrahim Sursock Street, Jnah Beirut, LebanonTel: +961 1 849 201Email: [email protected]: UNHCRLebanonTwitter: @UNHCRLebanonwww.unhcr.org/lb
United Nations Children's Fund (UNICEF)Lebanon Country OfficeAshrafieh, Sodeco Area, Sama Beirut Beirut, LebanonTel: +961 1 607 400Email: [email protected]: UNICEFLebanonTwitter: @UNICEFLebanon www.unicef.org/lebanon
World Food Programme (WFP)Lebanon Country OfficeAzarieh Building, Block 6, 3rd floor, Azarieh Street, Downtown Beirut, LebanonTel: +961 1 964 615Email: [email protected]/countries/lebanon