vascular study group of new england - vqi.org study group of new england 17th semi-annual meeting...
TRANSCRIPT

Vascular Study Group of New England
17th Semi-Annual Meeting
Monday, November 7, 2011
Maine Medical Center, Portland

Guests from Outside New England Cardiac Care Network of Ontario
• Dan Purdham PhD
Catholic Health, Buffalo • Christine Juliano, Holly Bower
Indiana University Health • Gary Lemmon MD, Katharine Krol MD, Roberta Sutton-Stent RN
Michigan Surgical Quality Collaborative • Max Hutton MD, Majed Tomeh
Stonybrook University Hospital Shang Loh MD, Olympia Christoforatos RN MS
Toronto General and St. Michael’s Hospitals • Thomas Lindsay MD, Graham Roche-Nagel MD, Tony Moloney MD, Naomi
Eisenberg
University of Utah Medical Center • Larry Kraiss MD
Vascular Society of New Jersey • Paul Hauser MD

Guests from New England
Cape Cod Healthcare
• James Butterick MD
The Miriam Hospital
• Susan Kenyon RN, Patricia Sullivan RN
SVS PSO
• Carrie Bosela RN CPC, Administrative Director
M2S
• Greg Lange, President
• Jacyln Kinkaid MPH, Becky Ekstrom MPH, Ke Zhang MEM, Maryann Caron MPH, Matt Regan

Administrative Updates
VSGNE
SVS VQI
NESVS Clinical Trials Grant

Dartmouth-Hitchcock
Medical Center
Fletcher Allen Health
Care
Eastern Maine Medical Center
Maine Medical Center
Concord Hospital
Lakes Region
Hospital
Cottage
Hospital Central Maine Medical Center
Mercy Hospital
U. Mass. Medical Center
Elliot Hospital
Tufts Medical Center Boston Medical Center
St. Francis Hospital
Massachusetts General Hospital
Rutland Regional Medical
Center
MaineGeneral Medical Center
Caritas St. Anne’s Hospital
Yale-New Haven
Hospital
Baystate Medical Center
VSGNE 2011 27 Participating Hospitals
Berkshire Medical Center
25 - 950 Hospital Beds
Hartford Hospital St. Luke’s Hospital
Charlton Memorial Hospital
Beth Israel Deaconess Medical Center
Hospital of St.
Raphael
Concord Hospital
Brigham & Women’s Hospital

Dartmouth-Hitchcock
Medical Center
Fletcher Allen Health
Care
Eastern Maine Medical Center
Maine Medical Center
Concord Hospital
Lakes Region
Hospital
Cottage
Hospital Central Maine Medical Center
Mercy Hospital
U. Mass. Medical Center
Elliot Hospital
Tufts Medical Center Boston Medical Center
St. Francis Hospital
Massachusetts General Hospital
Rutland Regional Medical
Center
MaineGeneral Medical Center
Caritas St. Anne’s Hospital
Yale-New Haven
Hospital
Baystate Medical Center
VSGNE 2011 27 Participating Hospitals
Berkshire Medical Center
14 Community - 13 Academic
Hartford Hospital St. Luke’s Hospital
Charlton Memorial Hospital
Beth Israel Deaconess Medical Center
Hospital of St.
Raphael
Brigham & Women’s Hospital
“Real World Practice”

Maine
Central Maine Medical Center, Lewiston
Pietro Gualdalupi, MD
Allan Ingraham, MD
April Nedeau, MD
Pamela Rietschel, MD
Sarat Vaddineni, MD
Eastern Maine Medical Center, Bangor
Robert Cambria, MD
Robert Clough, MD
Larry Flanagan, MD
Lisa Floyd, MD
Terrance Fournier, MD
Felix Hernandez, MD
Matthew McKay, MD
Andrew Sherwood, MD
Peter Ver Lee, MD
Alan Wiseman, MD
MaineGeneral Medical Center, Augusta
Cristobal Alvarado, MD
Mark Bolduc, MD
Maine Medical Center, Portland
Christopher Baker, MD
Paul Bloch, MD
Scott Buchanan, MD
David Burkey, MD
David Butzel, MD
Robert Ecker, MD
Robert Hawkins, MD
Christopher Healey, MD
William Herbert, MD
Peter Higgins, MD
Jens Jorgensen, MD
M. Usman Nasir Khan, MD
Mercy Hospital, Portland
Paul Bloch, MD
Robert Hawkins, MD
Christopher Healey, MD
William Herbert, MD
Peter Higgins, MD
Jens Jorgensen, MD
New Hampshire
Concord Hospital, Concord
Eric Leefmans, MD
Joseph Meyer, MD
Richard Murphy, MD
William Tanski, MD
Christopher Danielson, MD
Kenneth Danielson, MD
Cottage Hospital, Woodsville
Christopher S. Danielson, DO
Kenneth S. Danielson, MD
Dartmouth-Hitchcock Med Ctr, Lebanon
Jack Cronenwett, MD
Mark Fillinger, MD
Philip Goodney, MD
Brian Nolan, MD
Richard Powell, MD
Eva Rzucidlo, MD
David Stone, MD
William Tanski, MD
Daniel Walsh, MD
Robert Zwolak, MD
Elliot Hospital, Manchester
Larry Hoepp, MD
William Wilson, MD
Lakes Region General Hosp., Laconia
Sam Aldridge, MD
David Coleman, MD
Glenn Fusonie, MD
John Vignati, MD
Vermont
Fletcher Allen Health Care, Burlington
Julie Adams, MD
Daniel Bertges, MD
Michael Ricci, MD
Andrew Stanley, MD
Georg Steinthorsson, MD
Rutland Regional Med Ctr, Rutland
Matthew Conway, MD
J. Christian Higgins, MD
Brad Jimmo, MD
John Louras, mD
Victor Pisanelli, MD
Massachusetts
Baystate Medical Center, Springfield
James Arcoleo, MD
Mark Bean, MD
Laura Feldman, MD
Aram Fereshetian, MD
Gregory Giugliano, MD
Neal Hadro, MD
Mark Hirko, MD
Ashequl Islam, MD
Lowell Kahn, MD
Jeffrey Kaufman, MD
Amir Lotfi, MD
Njogu Njuguna, MD
Mark Norris, MD
Sang Won Rhee, MD
Steven Weinsier, MD
Hao Wu, MD
Berkshire Medical Center, Pittsfield
Wilfred Carney, MD
Michael Cohn, MD
Eugene Curletti, MD
Christian Galvez-Padilla, MD
Jose Heisecke, MD
Parvis Sadighi, MD
Beth Israel Deaconess Med Ctr, Boston
Elliot Chaikof, MD
Allen Hamdan, MD
Roger Laham, MD
Duane Pinto, MD
Frank Pomposelli, MD
Marc Schermerhorn, MD
Mark Wyers MD
Boston Medical Center, Boston
Alik Farber, MD
Jeffrey Kalish, MD
Jonathan Woodson, MD
Brigham & Women’s Hospital, Boston
Michael Belkin, MD
Edwin Gravereaux, MD
Matthew Menard, MD
Louis Nguyen, MD
Keith Ozaki, MD
Palma Shaw, MD
Charlton Memorial Hospital, Fall River
David Bigatel, MD
Ibrahim Eid, MD
Martin Fogle, MD
Nosheen Javed, MD
Michael Meuth, MD
Connecticut
Hospital of St. Raphael, New Haven
Brian Coyle, MD
Ralph DeNatale, MD
Antoine Ferneini, MD
Thomas Sweeney, MD
St. Francis Hospital, Hartford
Surendra Chawla, MD
Scott Fecteau, MD
Tim Lehmann, MD
Arshad Quadri, MD
Steve Ruby, MD
Eugene Sullivan, MD
Jack Thayer, MD
Yale-New Haven Hosp., New Haven
Melih Arici, MD
John Aruny, MD
Raj Ayyagari, MD
Charles Beckman, MD
Hillary Brown, MD
Cassius Chara, MD
Ricardo Cordido, MD
Brian Coyle, MD
Jeptha Curtis, MD
Ralph DeNatale, MD
John Forrest, MD
Richard Gusberg, MD
Faisal Hasan, MD
Tracy Huynh, MD
Jeffrey Indes, MD
Akhilesh Jain, MD
Michele Johnson, MD
Igor Latic, MD
Carlos Mena, MD
Hamid Mojibian, MD
Bart Muhs, MD
Juan Carlos Perez-Lozada, MD
Jeffrey Pollak, MD
Rishi Razdan, MD
Eric Reiner, MD
Michael Remetz, MD
Erik Stilp, MD
Bauer Sumpio, MD
Tom Sweeney, MD
Craig Thompson, MD
Edward Tuohy, MD
Cliff Yeh, MD
Massachusetts (continued)
Mass. General Hospital, Boston
David Brewster, MD
Richard Cambria, MD
Mark Conrad, MD
Christopher Kwolek, MD
Glenn LaMuraglia, MD
Virendra Patel, MD
Michael Watkins, MD
St Anne’s Hospital, Fall River
David Bigatel, MD
Ibrahim Eid, MD
Martin Fogle, MD
St Luke’s Hospital, Fall River
Salman Bashir, MD
Singh Harmadeep, MD
Stephen Keith, MD
Michael Merport, MD
Roger Rosen, MD
Tufts Medical Center, Boston
Kevin Daly, MD
James Estes, MD
Neil Halin, MD
Mark Iafrati, MD
Harry Ma, MD
William Mackey, MD
Noah Rosen, MD
Andrew Weintraub, MD
University of Massachusetts
Medical Center, Worcester
Mohammad Alchter, MD
Elias Arous, MD
Donald Baril, MD
Kurt Barringhaus, MD
Mohammad Eslami, MD
Daniel Fisher, MD
Subhash Gulati, MD
Stephen Hoenig, MD
Louis Messina, MD
William Robinson, MD
Andres Schanzer, MD
Richard Whitten, MD
Connecticut
Hartford Hospital, Hartford
Mohiuddin Cheema, MD
Thomas Divinagracia, MD
James Gallagher, MD
Robert Iowe, MD
Immad Sadiq, MD
Mary Windels, MD
> 170 VSGNE
Members 2011
Invite all providers of VSGNE
procedures; cardiology,
interventional radiology

>21,000 Procedures Reported
0
4000
8000
12000
16000
20000
Jan-June 03
Jul-Dec 03
Jan-June 04
Jul-Dec 04
Jan-June 05
Jul-Dec 05
Jan-June 06
Jul-Dec 06
Jan-June 07
Jul-Dec 07
Jan-Jun 08
Jul-Dec 08
Jan -Jun 09
Jul-Dec 09
Jan-Jun 10
Jul-Dec 10
Jan-Jun 11
CEA, CAS, oAAA, EVAR, LEB, PVI, TEVAR

VSGNE Procedure Types
40%
22%
14%
10%
9%
3% 2%
Carotid
Endarterectomy
Infra-inguinal Bypass
Peripheral Vascular
Intervention
Endo AAA Repair
Open AAA Repair
Supra-inguinal Bypass
Carotid Artery Stent

VSGNE Semi-Annual Volume
0
500
1000
1500
2000
2500
3000
3500
Jan-Jun
2003
Jul-Dec
2003
Jan-Jun
2004
Jul-Dec
2004
Jan-Jun
2005
Jul-Dec
2005
Jan-Jun
2006
Jul-Dec
2006
Jan-Jun
2007
Jul-Dec
2007
Jan-Jun
2008
Jul-Dec
2008
Jan-Jun
2009
Jul-Dec
2009
Jan-Jun
2010
Jul-Dec
2010
Jan-Jun
2011
Number of Centers Entering Data:
8 9 9 10 11 11
12
21
25

VSGNE Semi-Annual Volume / Center
0
20
40
60
80
100
120
140
Jan-Jun
2003
Jul-Dec
2003
Jan-Jun
2004
Jul-Dec
2004
Jan-Jun
2005
Jul-Dec
2005
Jan-Jun
2006
Jul-Dec
2006
Jan-Jun
2007
Jul-Dec
2007
Jan-Jun
2008
Jul-Dec
2008
Jan-Jun
2009
Jul-Dec
2009
Jan-Jun
2010
Jul-Dec
2010
Jan-Jun
2011
PVI

Semi-Annual Procedures per Center
0
10
20
30
40
50
60
CEA CAS Infra Supra OpenAAA
EVAR PVI
Jan-Jun2003
Jan-Jun2011
Time Period:

New Features
More risk-adjusted benchmarks
New website
Smart phone app for Cardiac Risk Index
Social Security Death Index match
Current / future audits

Risk-Adjusted Outcomes
Develop multivariate model to predict expected outcome based on different patient characteristics
Calculate observed/expected (O/E) ratio
Allows benchmarking independent of different patient characteristics
Model only explains portion of the variation (Area under the curve, AUC)

Risk-Adjusted Outcomes
Previously: CEA, open AAA
Now: CEA, elective and ruptured AAA for both open and EVAR, infrainguinal bypass
Special thanks:
• Yuanyuan Zhao, VSGNE statistician
• Becky Ekstrom, Becky Lindstrom, M2S
• Philip Goodney MD

Website Upgrade: www.vsgne.org


Coming Soon: Members Only Section for Non-Public Information
Edited to remove Patient Safety Work Product


Lee’s Revised Cardiac Risk Index (RCRI)

EVAR
n= 1005
10%
OAAA
n= 1110
11%
LEB
n= 2673
27%
CEA
n= 5293
52%
Composite adverse cardiac
events, in-hospital:
1. MI
2. CHF
3. Arrhythmia
VSGNNE Cohort 2003-2008
n= 10,081
Excluded emergency operations (n= 368)

Number of
RCRI
Risk
Factors
RCRI
Predicted
Risk (%)
Actual Event Rates %
Entire
cohort
(n=9809)
CEA
(n=5115)
LEB
(n=2610)
EVAR
(n=988)
OAAA
(n=1096)
0 0.4
2.6
1.5
4.6
3.8
n/a
1 0.9
6.7
3.5
7.1
3.1
17.1
2 6.6
11.6
5.6
13.1
12.9
19.9
≥ 3 11.0
18.4
9.8
17.8
4.0
36.7

2.8
1.7
2.1
1.4
1.4
1.6
1.7
1.9
1.4
1.3
1.2
0.8
Multivariate Aggregate Model

3.1
5.0
6.8
11.6
3.8
5.2
8.1
10.1
0.0
4.0
8.0
12.0
0-3 4 5 6+
Co
mp
os
ite
Ad
ve
rse
Card
iac
Ou
tco
me
(%
)
Number of VSG-RCI risk factors
Derivation Dataset
Validation Dataset
10 Risk factors
Age Smoking
IDDM CAD
CHF CABG/PCI
Abnormal cardiac stress COPD
Creatinine ≥ 1.8
Chronic β blockade
Composite Adverse Cardiac Events
VSG-CRI Derivation vs. Validation Sets
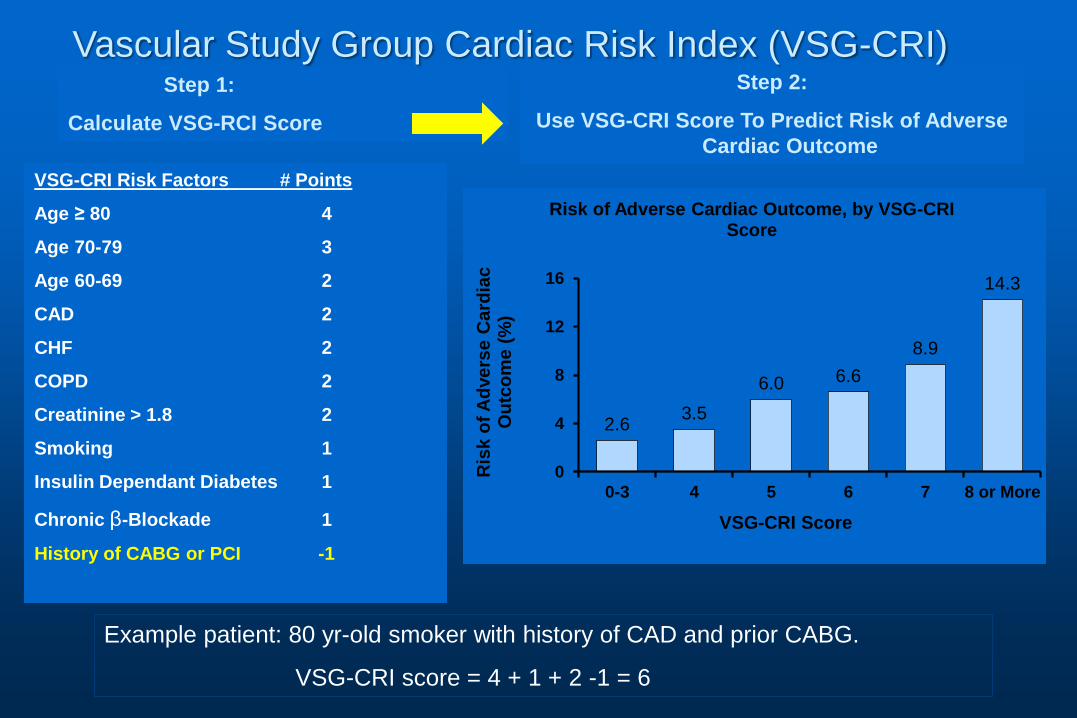
2.6 3.5
6.0 6.6
8.9
14.3
0
4
8
12
16
0-3 4 5 6 7 8 or MoreR
isk o
f A
dvers
e C
ard
iac
Ou
tco
me (
%)
VSG-CRI Score
Risk of Adverse Cardiac Outcome, by VSG-CRI Score
VSG-CRI Risk Factors # Points
Age ≥ 80 4
Age 70-79 3
Age 60-69 2
CAD 2
CHF 2
COPD 2
Creatinine > 1.8 2
Smoking 1
Insulin Dependant Diabetes 1
Chronic β-Blockade 1
History of CABG or PCI -1
Step 1:
Calculate VSG-RCI Score
Step 2:
Use VSG-CRI Score To Predict Risk of Adverse
Cardiac Outcome
Example patient: 80 yr-old smoker with history of CAD and prior CABG.
VSG-CRI score = 4 + 1 + 2 -1 = 6
Vascular Study Group Cardiac Risk Index (VSG-CRI)

VSG-CRI Procedure Models
CEA
LEB
1. age
2. gender
3. diabetes
4. COPD
5. CHF
6. cardiac stress test
7. statin
8. critical limb ischemia
1. diabetes
2. CAD
3. prior CABG or PCI within
5yrs
4. CHF
5. cardiac stress test
6. aspirin
7. clopidogrel
8. statin
9. prior vascular surgery

EVAR
oAAA
1. CHF
2. cardiac stress test
3. clopidogrel
4. AAA size
VSG-CRI Procedure Models
1. age
2. prior CABG/PCI w/i 5yrs
3. CHF
4. COPD
5. creatinine >1.8
6. beta blockers
7. prior vascular surgery

VSG-CRI calculator
http://www.vsgnne.org/
http://www.vascularweb.org/regionalgroups/vsgne/Pages/home.aspx
To be posted on SVS VQI site

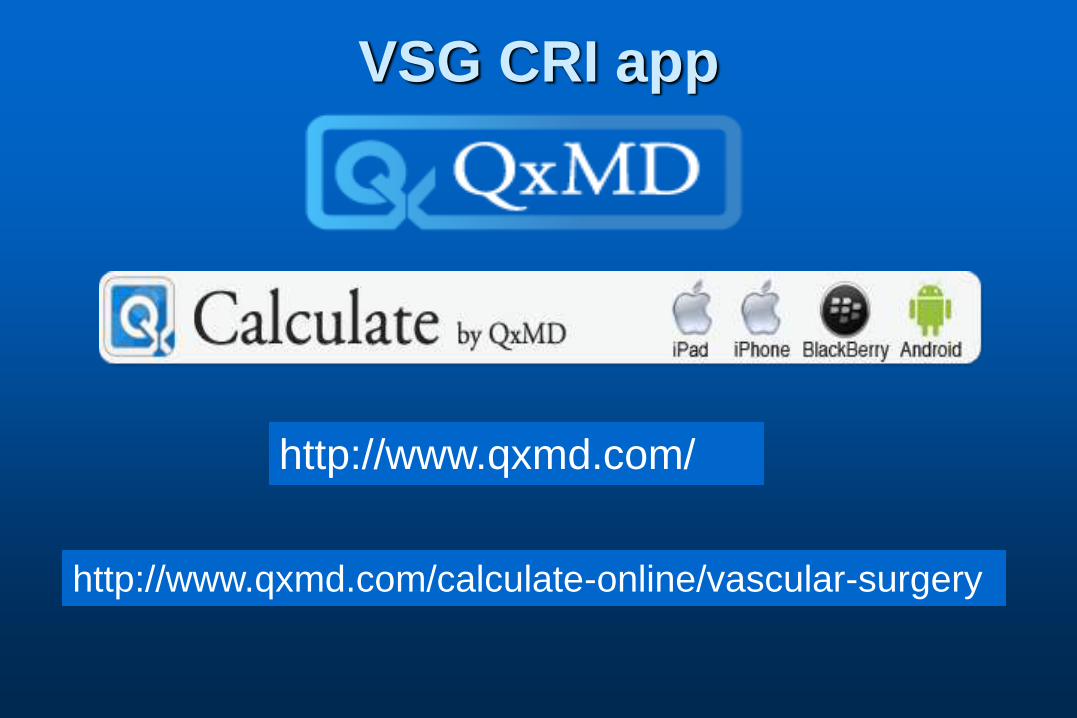
VSG CRI app
http://www.qxmd.com/
http://www.qxmd.com/calculate-online/vascular-surgery

Next Steps
Test VSG-CRI in new VSG-NE cohort 2008-2011
• More centers, more diverse population
Test VSG-CRI nationally within SVS VQI
Develop model for MI alone? • Stratify for type of MI
Practice patterns of stress testing
Is there regional variability in cardiac complications?

Social Security Death Index Match
SVS PSO purchases SSDI every 6 months
M2S developed a matching method
VSGNE patients who have died are identified in SSDI, updated in database
Over 4,000 late deaths matched to date
If centers download their data, SSDI death shows up as a new field that may be useful for center-specific research

Audit with Claims Data
Interval comparison hospital claims with VSGNE data
• Detect patients not entered
• Currently underway for 2007-2009 data
• Requires substantial hand matching because ICD-9 codes are imprecise for vascular
Working to develop automated system that uses physician CPT claims
• More precise matching, especially important for PVI procedures
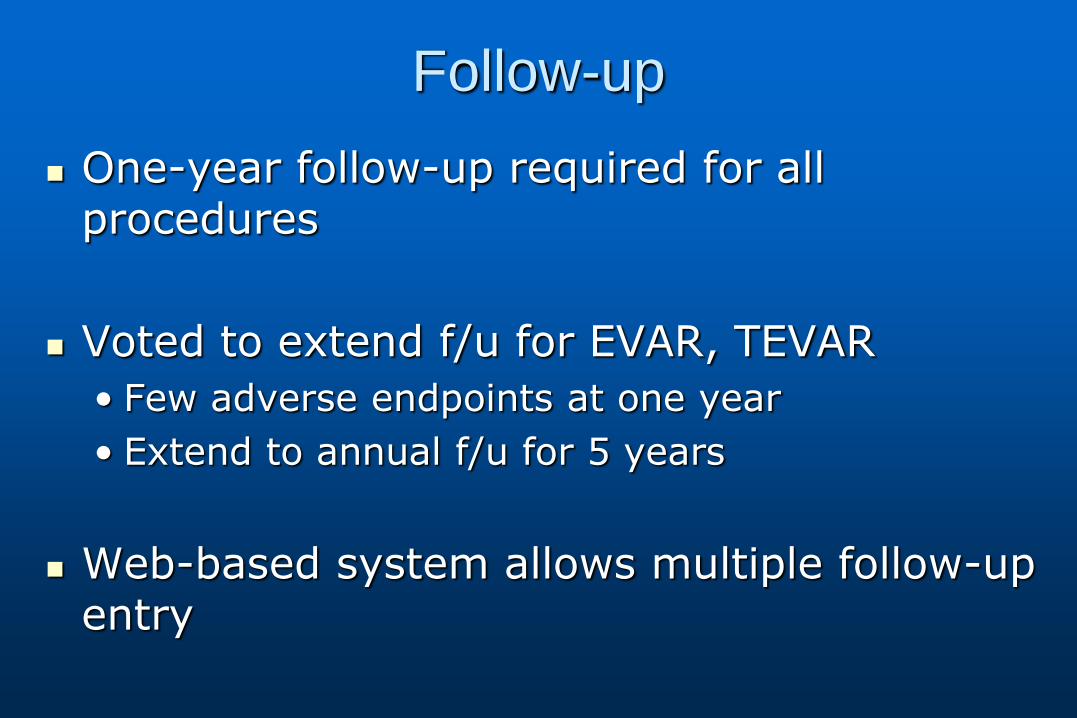
Follow-up
One-year follow-up required for all procedures
Voted to extend f/u for EVAR, TEVAR
• Few adverse endpoints at one year
• Extend to annual f/u for 5 years
Web-based system allows multiple follow-up entry

Follow-up Action
Staff to survey centers to understand successful methods, and problems
Offer advice based on best practice to low reporting centers
Remind centers of requirement
Potentially exclude centers that do not meet a reporting threshold based on Executive Committee review

• New Initiative in 2011
• Mission:
– To improve the quality, safety, effectiveness and cost of vascular health care by collecting and exchanging information.
• Organization:
– Regional quality groups
• Based on Vascular Study Group of New England
– SVS Patient Safety Organization (formerly VSG PSO)
– M2S Pathways data collection - reporting system

PSO Governing Council: 4 representatives from SVS, 1 from each region, Medical Director (ex officio)
• Conducts business of PSO, report to SVS Board • Approve recommendations of PSO Quality Committee
Richard Cambria, MD, Chair Anton Sidawy, MD, Vice Chair
Larry Kraiss, MD Louis Nguyen, MD
Michael Stoner, MD *Jens Jorgenson, MD - VSGNE
*Jeb Hallett, MD *Fred Weaver, MD
*Adam Beck, MD *Mark Davies, MD
Jack Cronenwett, MD, Medical Director, ex officio
*Representative from each regional group

PSO Quality Committee: 1 Representative from each regional RAC plus SVS appointees
Larry Kraiss, MD, Chair Philip Goodney, MD Jeb Hallett, MD Jack Cronenwett, MD, ex officio
Greg Landry, MD Andres Schanzer, MD Marc Schermerhorn, MD
• Develop national quality improvement projects • Recommend best practices based on PSO analyses • Evaluate requests for de-identified datasets for quality research that involve more than one region

• Achieved PSO accreditation by AHRQ
• Established PSO structure, Governing Council
• Enabled national participation
• Added TEVAR-Complex EVAR and Dialysis Access
Results to Date (since February, 2011)

100 centers, 29 states + Ontario > 2000 procedures per month
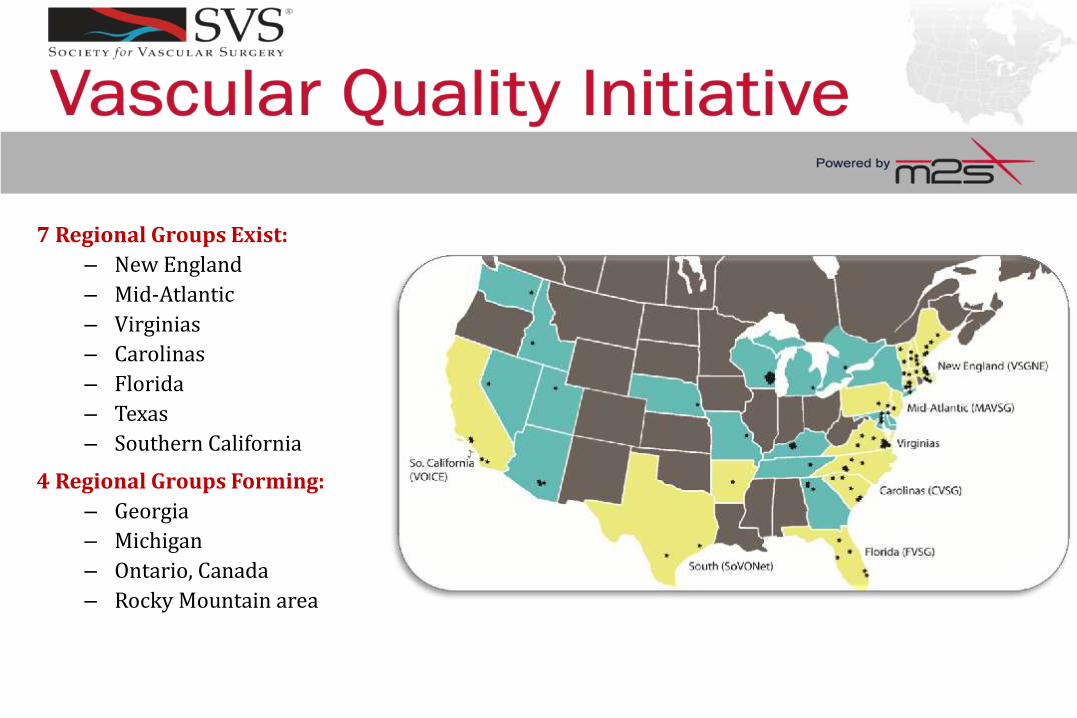
7 Regional Groups Exist:
– New England
– Mid-Atlantic
– Virginias
– Carolinas
– Florida
– Texas
– Southern California
4 Regional Groups Forming:
– Georgia
– Michigan
– Ontario, Canada
– Rocky Mountain area
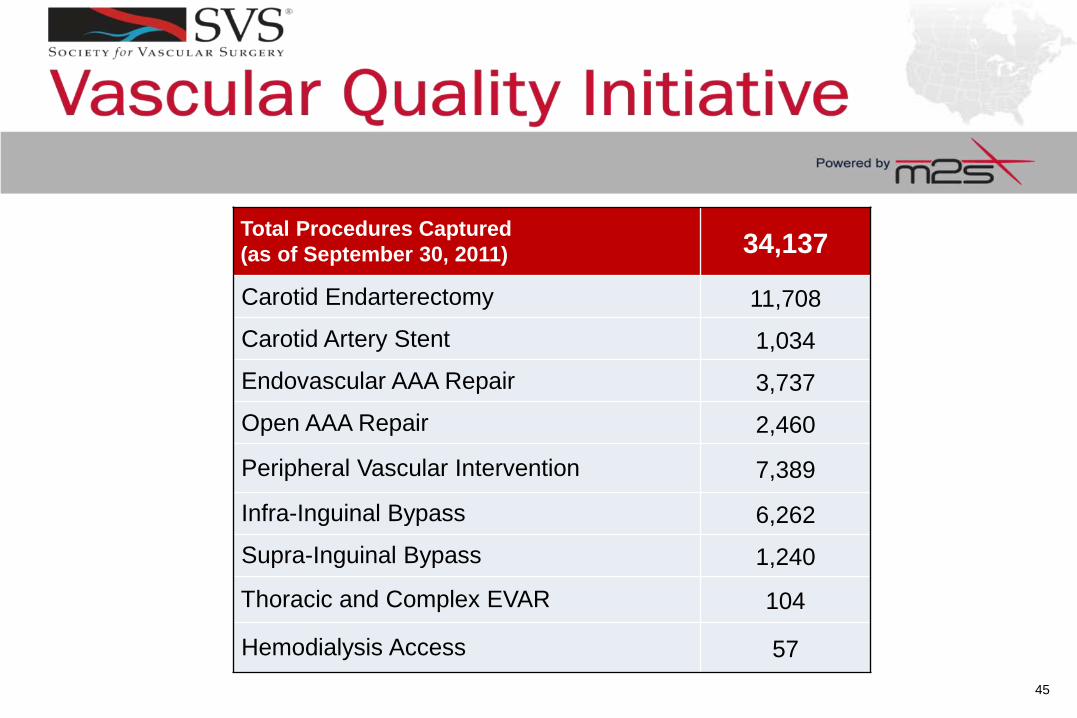
Total Procedures Captured
(as of September 30, 2011) 34,137
Carotid Endarterectomy 11,708
Carotid Artery Stent 1,034
Endovascular AAA Repair 3,737
Open AAA Repair 2,460
Peripheral Vascular Intervention 7,389
Infra-Inguinal Bypass 6,262
Supra-Inguinal Bypass 1,240
Thoracic and Complex EVAR 104
Hemodialysis Access 57
45

• Data collection meets CMS’ Carotid Artery Stent Facility Recertification requirements
• Meets quality improvement portion of Board Maintenance of Certification requirements
• Allows PQRS reporting for physicians without additional work of claims-based reporting
Additional Benefits to PSO Members

CMS Physician Quality Reporting System
Year Bonus Penalty
2010 2.0%
2011 1.5%
2012-2014 0.5%
2015 1.5%
2016 + 2.0%
% of all Medicare Part B claims
Data submitted to M2S for SVS VQI can be submitted to CMS
for PQRS reporting

• Provider billing (CPT) codes for auditing, PQRS
• Working with EMR vendors to incorporate data elements into process of care
• Working with FDA and industry to use VQI data for post-approval device studies
• Provide mechanism for regional groups to use VQI clinical data for efficient research trials
• Develop a mechanism to link Medicare claims data with PSO data to capture events and outcomes > 1 yr
New Projects

Broad Goal
• Develop a mechanism to merge Medicare claims data with all patients in SVS PSO to populate late outcome evens that are difficult to capture > 1 yr
• Use detailed clinical data collected at the time of surgery in the SVS PSO to determine patient and process factors that determine outcomes
• Seek funding to establish a long-term mechanism for claims matching

Link Medicare Claims with VSGNE Data
• Potential funding source:
– Agency for Healthcare Research and Quality (AHRQ)
• AHRQ Health Information Technology FOA
– Exploratory and Developmental Grant to Improve Health Care Quality through Health Information Technology (IT) (PAR-08-269; R-21, < $300K over 2 years)
– Improve health care decision making through the use of integrated data and knowledge management
• Target AHRQ broad approach to healthcare
– Better patient selection to avoid unnecessary surgery

Leveraging Health IT to Avoid Unnecessary Asymptomatic Carotid Revascularization
• To identify which asymptomatic patients are likely to receive unnecessary carotid endarterectomy using a merged registry-claims dataset, and design a Health IT tool to convey these findings to providers.
• To determine the potential cost savings associated with avoiding unnecessary CEA in asymptomatic patients.

Methods
• Assume CEA in asymptomatic patients who have stroke or death within 2 years of CEA were unnecessary
• Match Medicare claims with VSGNE data
– Use The Dartmouth Institute for access to Medicare claims
– Use Medicare claims to identify 2 year stroke/death risk
– Use VSGNE clinical data to identify patient factors that predict 2 year stroke/death
• Develop a decision making tool to select patients for CEA
– Smart phone and computer based tool
• Estimate cost of unnecessary CEA in U.S.

NESVS Clinical Trials Project
NESVS seed grant to initiate RCT using VSGNE data as core data set
• Central IRB
• Patient consent forms required
• Voluntary participation of VSGNE sites
• Investigator initiated, any topic in VSGNE data
Key concepts:
• Using VSGNE data should reduce cost of clinical trial while allowing multiple sites to collaborate
• NESVS: up tp $10,000 per year (3 yr max)

NESVS Clinical Trials Project
NESVS Clinical Trials Committee:
• Administration, oversight and funding
• Application review, recommendation to Executive Committee for funding
VSGNE/M2S:
• Data collection and storage
Investigators:
• IRB application, patient consent, data audit, data analysis, publication
• Eligible: members of both NESVS and VSGNE

NESVS Clinical Trials Project
Applications Due March 1, 2012
Application forms from NESVS

VSGNE Quality Research Projects
Proposed by members
Reviewed by Research Advisory Committee
Approved by each hospital via Executive Committee member
Solicit broad VSGNE member participation
Conduct study, supervised by mentor from Research Advisory Committee
Present results at VSGNE meetings

Approved Projects
PI Center Title Approved by EC
Jeff Kalish/Alik Farber BMC Wound Infection following LEB 12/1/2009
Jeff Kalish/Alik Farber BMC The Significance of Intra-Operative Completion Studies following LEB 12/1/2009
Phil Goodney/Sal Scali DHMC Shunt Use in CEA 5/25/2010
David Stone DHMC Clopidogrel is Not Associated with Major Bleeding Complications During Peripheral Arterial Surgery 5/25/2010
Phil Goodney/Bjoern Suckow DHMC Functional Outcomes of Amputation following LEB 5/25/2010
Jessica Wallaert/Phil Goodney DHMC Impact of Completion Imaging in CEA 5/25/2010
Phil Goodney DHMC Changes in Patient Selection in LEB in New England 5/25/2010
Phil Goodney DHMC ICA Re-exploration during CEA 5/25/2010
Brian Nolan DHMC Carotid Endarterectomy Pre-operative MRA 5/25/2010
Jens Jorgensen MMC Impact of RBC Transfusion on Post-Op Outcomes in AAA 1/1/2011
Chris Healey MMC The Effect of Coumadin on Endoleak Development after EVAR 1/1/2011
Jessica Simons UMASS Major Adverse Limb Events Associated with LEB for Claudication 2/21/2011
Julie Adams FAHC Gender Differences in LEB 2/21/2011
Danny Bertges FAHC Practice Patterns of Stress Test in Open AAA Patients 2/21/2011
Danny Bertges FAHC Validation of VSGNE CRI 2008 - 2010 2/21/2011
Andy Hoel DHMC Determinates of Smoking Cessation in the VSGNE 2/21/2011
Dave Kuwayama DHMC Length of Stay in the VSGNE Cohort 2/21/2011
Randy De Martino DHMC Outcomes of Ruptured AAA Repair in the VSGNE 4/5/2011
Jeff Kalish BMC Outcomes Related to Blood Transfusion After LEB 4/5/2011
Scott Fecteau St. Francis Conduit Limited Patients with CLI 4/5/2011
Danny Bertges FAHC Results of Coronary Revascularization for Post-op MI after Vascular Surgery 4/5/2011
David Stone DHMC Impact of COPD on Open AAA Repair 4/5/2011
Donald Baril UMASS Contralateral Amputation as a Predictor of Outcome after LEB 4/5/2011
Brian Nolan DHMC Risk Adjusted Outcomes of Carotid Stenting 4/5/2011
Danny Bertges FAHC PVI for Critical Limb Ischemia within the VSGNE 6/3/2011
Alik Farber BMC Dextran Infusion during CEA with peri-op Outcome 6/3/2011
James McPhee/Matt Menard Brigham Vein cuff in below knee prosthetic grafts 7/13/2011
Marc Schermerhorn BIDEAC Gender Differences in AAA 10/8/2011
Marc Schermerhorn BIDEAC Gender Differences in Carotid Interventions 10/8/2011
Ben Brooke / Phil Goodney DHMC Analysis of Variation in Use of Renal Protection in PVI 10/8/2011
Ramesh Patel / Danny Bertges FAHC Validation of VSGNE CRI 2008 - 2010 10/8/2011
Randy De Martino / Phil Goodney DHMC Long Term Survival Following AAA 10/8/2011
Jessica Wallaert/Phil Goodney DHMC Long term mortality following CEA 10/8/2011
V. Patel MGH Evolution of Technique and Outcomes for Juxtarenal/Complex AAA 10/8/2011
Chris Kwolek MGH Embolic protection versus flow reversal for Carotid Angioplasty and Stenting. 10/8/2011
VSGNE RAC Approved Projects

VSGNE at Regional-National Meetings
and Peer-Reviewed Publications
0
5
10
15
20
25
2007 2008 2009 2010 2011
Presentations
Publications
(9 Unique First
Authors)
(16 Unique
Presenters)
Hints Towards Organizing and
Managing a Multicenter Research
Project in VSGNE
P. Goodney

Nature of VSGNE: Scale
Initially (2002) • 6 centers
• ~20 surgeons
Now (2011) • 27 centers
• ~160+ physicians

Nature of VSGNE: Research Structure
Initially (2002) • “Hey, what is
our stroke rate for CEA?”
Now (2011) • RAC • Executive
Committee • Lots of
investigators • Lots of analysts

Current Research Environment in
VSGNE
“Good” things: • 25,000 +
procedures • Nearly 30 peer-
reviewed publications
• Multitude of research presentations, grant applications
• Broad skill set across variety of sites and investigators
• “Bad” things: – “Crowded
sandbox”
– Previously studied topics
– Differential learning curve (analytics, study design)
– Research bureaucracy
– Communication across large number of parties

Necessary Element: Collaboration
Within and across VSG centers, collaboration will be an increasingly important element of successfully completing a research project
Outline some examples of how this has been done successfully in recent projects

Executing Your Multicenter Project
Conceive idea
Review VSG
variables and
outcomes
Formulate RAC
proposal
Assemble project team
•Analytic roles
•Consultant roles
•Supervisory roles
Generate Mock Tables and
Figures
Discuss / Edit Mock Table
and Figures
Perform Univariate analyses
Discuss / Interpret / Revise
Univariate analyses
Perform
advanced/multivariable
analyses
Circulate tables and figures
with actual data
Assemble
abstract/manuscript
Revisions, edits, and
submission

Role of Collaborators
Use regular conference calls • Keep team on task
• Use the experience of prior analytic efforts
• Avoid re-inventing the wheel
Example • VSG-CRI project
• Dr. Bertges (PI) Organizational efforts
Outlining deliverables • Abstract deadlines
• Manuscript edits and versions
• Assigning tasks

Tips and Tricks
Make “dummy” tables and figures • Allows the group to visualize the final project
Identify abstract deadlines well in advance • Gives colleagues time to review • Prevents last-second analytic concern
Delegate work among colleagues • Introduction/Methods/Results • Tables/Figures • Literature review
Use the RAC committee member as a resource

Notes From Those Who’ve Done It
D. Bertges
• VSG CRI
J. Kalish
• Transfusion in LEB
D. Baril
• Effect of Amputation in LEB

LUNCH BREAK
30 Minutes

Quality Improvement Publications Improve patient selection by developing
better outcome prediction:
• Stroke/death after carotid endarterectomy
• One year mortality after elective AAA repair
• Ambulation status after leg bypass
• Amputation/graft occlusion after leg bypass
• One year mortality after leg bypass
• Functional outcome after LEB in CLI patients
• Amputation-free survival in CLI pts after LEB
• Cardiac risk prediction for vascular patients
• Symptomatic AAA outcomes

Quality Improvement Publications
Determine best processes of care:
• Protamine use during carotid endarterectomy
• Completion imaging during CEA
• Plavix and bleeding complications
Quality improvement initiatives:
• Increase pre-op statin usage
• Increase pre-op beta-blocker usage
• Increase patching during conventional CEA

Increased Pre-op Statin Use
40%
45%
50%
55%
60%
65%
70%
75%
80%
85%
2003 2004 2005 2006 2007 2008 2009
Developed Request Letters
to PCPs
Set 90%
Target
Started QI Initiative

Jan-Mar
2003
68%
0%
10%
20%
30%
40%
50%
60%
70%
80%
90%
100%
Jan-
Mar
03
April-
June
03
July-
Sept
03
Oct-
Dec
03
Jan-
Mar
04
April-
June
04
July-
Sept
04
Oct-
Dec
04
Jan-
Mar
05
April-
June
05
July-
Sept
05
Oct-
Dec
05
Jan-
Mar
06
April-
June
06
July-
Sept
06
Oct-
Dec
06
Jan-
Mar
07
April-
June
07
July-
Sept
07
Oct-
Dec
07
Jan-
Mar
08
Apr-
Jun
08
July-
Sept
08
Oct-
Dec
08
Oct-Dec 2008
88% Rate of Beta
Blocker Use
P<0.001
Increased Pre-op Beta Blocker Use

Jan-Mar 2003
68%
0%
10%
20%
30%
40%
50%
60%
70%
80%
90%
100%
Jan-
Mar
03
April-
June
03
July-
Sept
03
Oct-
Dec
03
Jan-
Mar
04
April-
June
04
July-
Sept
04
Oct-
Dec
04
Jan-
Mar
05
April-
June
05
July-
Sept
05
Oct-
Dec
05
Jan-
Mar
06
April-
June
06
July-
Sept
06
Oct-
Dec
06
Jan-
Mar
07
April-
June
07
July-
Sept
07
Oct-
Dec
07
Jan-
Mar
08
Apr-
Jun
08
July-
Sept
08
Oct-
Dec
08
Oct-Dec 2008
88%
Jan-Mar 2003
5.2% Oct-Dec
2008
5.5%
p=0.876
Rate of Beta
Blocker Use
Rate of Post-
op MI
P<0.001
No Change in Post-op MI Rate

Potential New Beta-Blocker Project
For medium and high risk patients based on VSGNE Cardiac Risk Index
Initiate beta-blockers > 1 week pre-op
Titrate dose to resting HR 55-70
Check troponins post-op
? Automated HR monitoring by phone
? RCT or QI project

Quality Improvement Discussion
Now that VSGNE is a mature group with substantial data collected,
How can we focus more on regional quality improvement?
What are the best projects and methods?

Quality Improvement Discussion
Reduce complication rates
• Use regional variation to identify opportunities

LEB QI Presentations at NESVS
Use of a postoperative insulin protocol decreases wound infection in diabetics undergoing lower extremity bypass
• Fuyuki Hirashima, University of Vermont
Blood transfusion is associated with increased perioperative surgical site infection and graft failure in lower extremity bypass
• Tze-Woei Tan, Boston Medical Center

QI Discussion Ideas at NESVS
Quality Improvement Committee
More concrete deliverables
• Practice guidelines, standard order sets, care pathways, patient education materials
• Guidelines for initial testing and followup
Reduce infections
• Skin prep, transfusion threshold, glucose Rx
Open AAA standard care pathway
• Reduce return to OR, transfusion, MI rates

QI Discussion Ideas at NESVS
Focus beta blockers on high risk patients
• Monitor heart rate pre-op
Revise performance measures
• Add protamine use during CEA
• Evaluate processes in other procedures
Analyze best – worst outcomes
• Site visits, granular discussions at meetings
Studies may require temporary variables
• Glucose levels to study insulin drip
Focus on efficiency: analyze costs, LOS

VSGNE Future Directions

Recent Quality Analyses
Dextran during CEA – Kevin Tan
Conduit type in LEB – Donald Baril
Completion imaging for LEB – Kevin Tan

Perioperative Use of Dextran Increases
Cardiac Complications after Carotid
Endarterectomy
On behalf of the Vascular Study Group of New England
Tze-Woei Tan, Jeffrey Kalish
Naomi Hamburg, Robert Eberhardt, Denis Rybin,
Gheorge Doros, Phil Goodney,
Jack Cronenwett, Alik Farber

Background
Dextran has been theorized to diminish the risk of stroke after carotid endarterectomy (CEA) • has been shown to decrease the number of
embolic TCD signals
Guant MR. J Vasc Surg 1994;20:1004-1005
• use in patients with post-op TCD embolic signals decreases stroke rate
Naylor AR. J Vasc Surg 2000;32:750-759

Background
Dextran use can be associated with bleeding, CHF, renal failure, and allergic reactions
Dextran use during CEA varies with center and surgeon practice and its role in the absence of TCD monitoring is uncertain
Objective
To evaluate the outcomes of perioperative Dextran use in patients undergoing CEA

Methods
Patient outcomes compared based on perioperative Dextran use
• Bivariate analysis
• Adjusted analyses
Multivariable regression
Group matching
Propensity score matching

Methods
Outcomes:
- Perioperative death, stroke, combined stroke/death, cardiac complications, bleeding complications
- One year survival, stroke

Sample Selection
6641
CEA
No Dextran
N= 1523
(82.1%)
Dextran
N= 333
(17.9%)
Perioperative
Dextran
No Dextran
N= 6307 CEA
(95%)
Dextran
N= 334 CEA
(5%)
Consecutive CEA
(VSGNE 2003 to 2010)
Group Matching:
CAD, CHF, Plavix
Shunt, Anesthesia

Demographics of Matched Sample
Characteristic Overall
(N=1856)
Dextran
(N=333)
No Dextran
(N=1523)
P-value
Gender, n (%)
Male 1109 (64.2%) 219 (65.8%) 971 (63.8%) 0.528
Race, n (%)
White 1830 (99.6%) 329 (99.4%) 1501 (99.6%) 0.641
Age, n (%)
35-60 261 (14.1%) 43 (12.9%) 218 (14.3%) 0.157
60-80 1281 (69.0%) 244 (73.3%) 1037 (68.1%)
80-100 314 (16.9%) 46 (13.8%) 268 (17.6%)
Smoking
Current 525 (28.3%) 94 (28.2%) 431 (28.3%) 0.961
Prior 934 (50.4%) 170 (51.1%) 764 (50.2%)

Clinical History of Matched Sample
Characteristic Overall
(N=1856)
Dextran
(N=333)
No Dextran
(N=1523)
P-value
Hypertension, n (%) 1594 (85.9%) 273 (82.2%) 1321 (86.7%) 0.036
CAD, n (%) 521 (28.1%) 94 (28.2%) 427 (28.0%) 0.946
CHF, n (%) 131 (7.1%) 29 (8.7%) 102 (6.7%) 0.195
Diabetes, n (%) 564 (30.4%) 102 (30.6%) 462 (30.3%) 0.948
COPD, n (%) 319 (17.2%) 60 (18.0%) 259 (17.0%) 0.688
Preoperative Medication
ASA, n (%) 1594 (85.9%) 284 (85.3%) 1310 (86.0%) 0.728
Plavix, n (%) 211 (11.4%) 40 (12.0%) 171 (11.2%) 0.703
ASA/ Plavix, n (%) 1629 (87.8%) 290 (87.1%) 1339 (87.9%) 0.712

Clinical History of Matched Sample
Characteristic Overall
(N=1856)
Dextran
(N=333)
No Dextran
(N=1523)
P-value
Symptomatic, n (%) 449 (24.2%) 83 (24.9%) 366 (24.0%) 0.724
Urgency
Elective 1686 (90.8%) 294 (88.3%) 1392 (91.4%) 0.093
Urgent 170 (9.2%) 39 (11.7%) 131 (8.6%)
Anesthesia, n (%)
Local/ Regional 400 (21.6%) 85 (25.5%) 315 (20.7%) 0.056
General 1456 (78.4%) 248 (74.5%) 1208 (79.3%)

Operative Characteristics of
Matched Sample
Characteristic Overall
(N=1856)
Dextran
(N=333)
No Dextran
(N=1523)
P-value
Type of Surgery, n (%)
Conventional 1415 (76.3%) 269 (80.8%) 1146 (75.3%) 0.033
Eversion 440 (23.7%) 64 (19.2%) 376 (24.7%)
Shunt, n (%) 369 (19.9%) 63 (18.9%) 306 (20.1%) 0.650
Patch, n (%) 1212 (65.3%) 202 (60.7%) 1010 (66.3%) 0.056
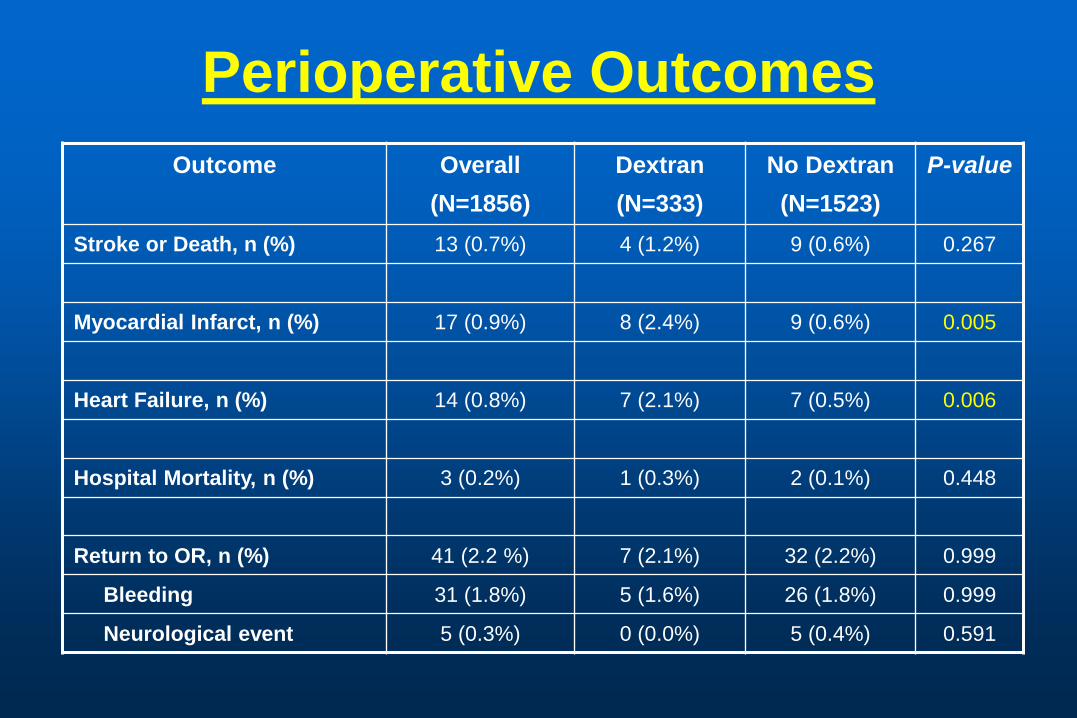
Perioperative Outcomes
Outcome Overall
(N=1856)
Dextran
(N=333)
No Dextran
(N=1523)
P-value
Stroke or Death, n (%) 13 (0.7%) 4 (1.2%) 9 (0.6%) 0.267
Myocardial Infarct, n (%) 17 (0.9%) 8 (2.4%) 9 (0.6%) 0.005
Heart Failure, n (%) 14 (0.8%) 7 (2.1%) 7 (0.5%) 0.006
Hospital Mortality, n (%) 3 (0.2%) 1 (0.3%) 2 (0.1%) 0.448
Return to OR, n (%) 41 (2.2 %) 7 (2.1%) 32 (2.2%) 0.999
Bleeding 31 (1.8%) 5 (1.6%) 26 (1.8%) 0.999
Neurological event 5 (0.3%) 0 (0.0%) 5 (0.4%) 0.591
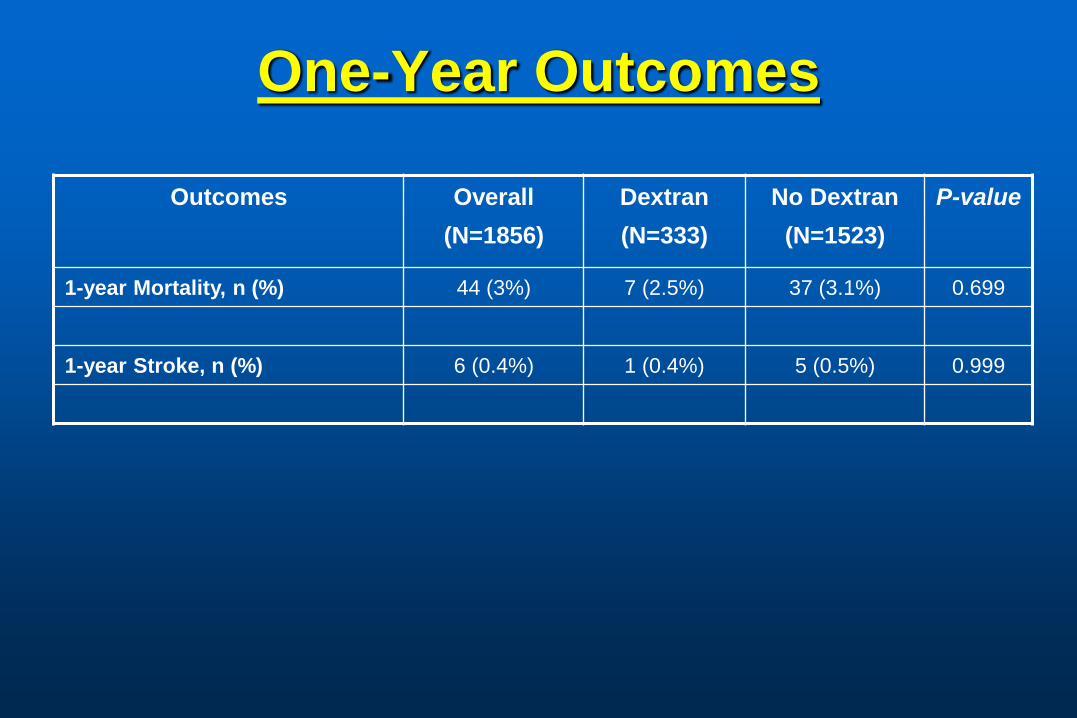
One-Year Outcomes
Outcomes
Overall
(N=1856)
Dextran
(N=333)
No Dextran
(N=1523)
P-value
1-year Mortality, n (%) 44 (3%) 7 (2.5%) 37 (3.1%) 0.699
1-year Stroke, n (%) 6 (0.4%) 1 (0.4%) 5 (0.5%) 0.999

Multivariate Analysis of
Matched Sample

Multivariate Analysis of
Unmatched Sample

Multivariate Analysis
Propensity Score Matched Sample

Summary
Perioperative Dextran during CEA does not affect incidence of perioperative stroke
Perioperative Dextran use is associated with a higher incidence of myocardial infarct and congestive heart failure

Does conduit type influence the outcomes of
lower extremity bypasses at one year?
Donald T. Baril MD1, Scott Fecteau MD2, Philip P. Goodney MD3,
James McPhee MD4, Andres Schanzer MD1
1. Division of Vascular and Endovascular Surgery, University of Massachusetts Medical School, Worcester, MA
2. Saint Francis Hospital & Medical Center, Hartford, CT
3. Division of Vascular Surgery Dartmouth Hitchcock Medical Center, Lebanon, NH
4. Division of Vascular Surgery, Brigham and Women’s Hospital, Boston, MA
VSGNE 17th Semi-Annual Meeting Portland, Maine
November 7, 2011

Introduction
4-10% of the U.S. population has PAD
Treatment paradigms for PAD continue to evolve with increasing use of endovascular therapies
Gold standard for treatment of symptomatic PAD remains surgical bypass
Lower extremity bypass (LEB) continues to have a non-negligible rate of early and late failure

Introduction
Multiple risk factors associated with LEB failures:
• Prior failed endovascular intervention
• Renal dysfunction
• Female gender
• Diabetes
• Poor outflow
• Prior amputation
• Conduit Prosthetic
Alternative vein
Spliced vein
Cadaveric vein

Objective
The purpose of this study is to determine the effect of conduit type used in lower extremity bypasses
Short term outcomes
Long-term outcomes
Primary end-points: • Primary patency, primary-assisted and secondary
patency at one-year post-operatively
• Limb salvage at one-year post-operatively

Methods - Database
Retrospective analysis of patients undergoing infrainguinal bypass grafts between January 1, 2003 and December 31, 2009
12 centers which are members of VSGNE

Study group
Patients undergoing LEB for CLI Indication = rest pain or tissue loss
Infrapopliteal target BK popliteal
TP trunk
Anterior tibial
Posterior tibial
Peroneal
DP ankle
PT ankle

Study group
2768 lower extremity bypasses
1779 (64%) Single segment GSV
701 (25.3%) Prosthetic (PTFE or Dacron)
153 (5.5%) Spliced vein
77 (2.8%) Alternative vein (single piece cephalic, basilic, or SSV)
58 (2.1%) Cadaveric vein

Patient demographics
Single
segment
GSV
(1779)
Alternative
Vein
(77)
Spliced
vein
(153)
Prosthetic
(701)
Cadaveric
vein
(58)
P-value
Age (mean ±SD) 68.1±11.8 70.4±9.8 69.2±12.1 68.8±11.1 74.3±9.3 0.0005
Male gender 72.6 80.5 66.7 64.2 63.8 0.0001
CAD (%) 32.6 52.0 49.0 42.7 51.7 <.0001
COPD (%) 26.0 27.3 29.4 37.5 34.5 <.0001
Hypertension (%) 84.0 96.1 91.5 88.0 93.1 0.007
Tobacco use (%) 55.5 33.8 50.3 55.4 44.8 0.002
Prior ipsilateral bypass (%) 7.7 31.2 20.9 15.1 58.6 <.0001
Prior ipsilateral PVI (%) 16.6 24.7 24.8 20.4 25.9 0.007
Prior major amputation (%) 4.2 3.9 5.9 3.9 8.6 0.427
Graft target
Below knee popliteal (%)
Tibial (%)
49.2
50.8
23.2
76.8
21.1
78.9
75.2
24.8
13.0
87.0
<.0001
<.0001

Primary patency
GSV
++ Prosthetic
-- Alternative vein
-- Spliced vein
++ Cadaveric vein
Pri
mary
pate
ncy (
%)
Time (days)
P<0.0001

Primary patency – GSV vs. alternative vein
Time (days)
Pri
mary
pate
ncy (
%)
GSV 72.4% at one year
-- Alternative vein67.1% at one year P=0.386

Primary patency – GSV vs. spliced vein
Time (days)
Pri
mary
pate
ncy (
%)
GSV 72.4% at one year
-- Spliced vein 54.1% at one year P<0.0001

Primary patency – GSV vs. prosthetic
Time (days)
Pri
mary
pate
ncy (
%)
GSV 72.4% at one year
-- Prosthetic 77.8% at one year P=0.044
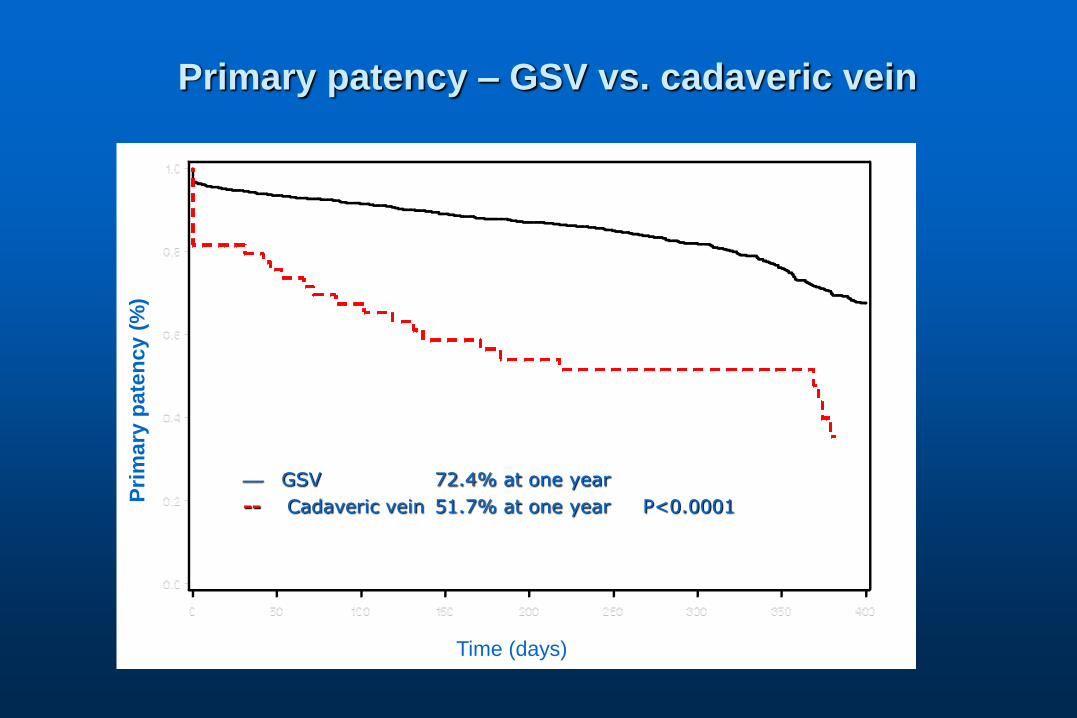
Primary patency – GSV vs. cadaveric vein
Time (days)
Pri
mary
pate
ncy (
%)
GSV 72.4% at one year
-- Cadaveric vein 51.7% at one year P<0.0001

Primary-assisted patency
GSV
++ Prosthetic
-- Alternative vein
-- Spliced vein
++ Cadaveric vein
Pri
mary
-assis
ted
pate
ncy (
%)
Time (days)
P<0.0001

Secondary patency
GSV
++ Prosthetic
-- Alternative vein
-- Spliced vein
++ Cadaveric vein
Seco
nd
ary
pate
ncy (
%)
Time (days)
P<0.0001

Amputation-free survival
GSV
++ Prosthetic
-- Alternative vein
-- Spliced vein
++ Cadaveric vein
Time (days)
Lim
b s
alv
ag
e (
%)
P<0.0001
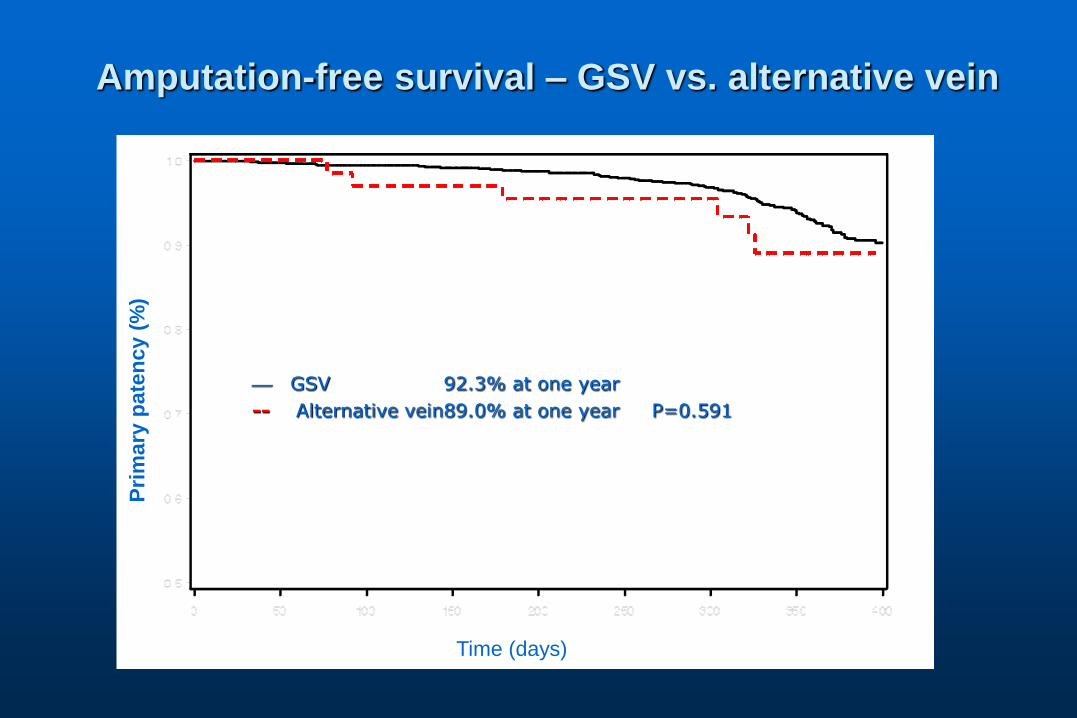
Amputation-free survival – GSV vs. alternative vein
Time (days)
Pri
mary
pate
ncy (
%)
GSV 92.3% at one year
-- Alternative vein89.0% at one year P=0.591

Amputation-free survival – GSV vs. spliced vein
Time (days)
Pri
mary
pate
ncy (
%)
GSV 92.3% at one year
-- Spliced vein 75.7% at one year P<0.0001

Amputation-free survival – GSV vs. prosthetic
Time (days)
Pri
mary
pate
ncy (
%)
GSV 92.3% at one year
-- Prosthetic 92.0% at one year P=0.037

Amputation-free survival – GSV vs. cadaveric vein
Time (days)
Pri
mary
pate
ncy (
%)
GSV 92.3% at one year
-- Cadaveric vein 65.5% at one year P<0.0001

Predictors of
loss of primary patency
HR 95% CI P-value
Cadaveric vein conduit 2.44 1.37-4.35 0.015
Spliced vein conduit 2.38 1.61-3.53 0.0013
Prior contralateral major amputation 2.32 1.51-3.57 0.0001
Prior ipsilateral bypass 1.55 1.17-2.04 0.0020
Female gender 1.28 1.04-1.57 0.0184
Prosthetic conduit 0.71 0.56-0.91 <.0001

Predictors of limb loss
HR 95% CI P-value
Prior contralateral major amputation 4.44 2.50-7.88 <.0001
Cadaveric vein conduit 3.34 1.47-7.59 0.045
Spliced vein conduit 3.33 1.70-6.53 0.019
Hemodialysis dependence 3.02 1.71-5.34 0.0001
Prior ipsilateral bypass 2.20 1.34-3.58 0.0017
IDDM 1.52 1.01-2.28 0.0448

Discussion – Primary patency
At one year, no difference in primary patency rates between GSV and prosthetic conduit
Both GSV and prosthetic conduits have higher primary patency rates at one year compared to alternative vein, spliced vein, and cadaveric vein conduits

Discussion - Secondary patency
At one year, no difference in secondary patency rates between GSV, alternative vein, and prosthetic conduit
Both GSV and prosthetic conduits have higher secondary patency rates at one year compared to spliced vein and cadaveric vein conduit

Discussion – Limb salvage
At one year, LEBs performed with GSV have higher rates of limb salvage compared to LEBs performed with prosthetic, alternative vein, spliced vein, and cadaveric vein conduits

Discussion
In the short term, prosthetic seems to outperform alternative and cadaveric vein conduits
• How do we reconcile this?
• Is this clinically meaningful?
With regards to vein conduits, to maintain patency, some initial extra work may be necessary to achieve what will probably be improved durability

Next steps
Assess if prosthetic conduit truly has higher primary patency rates at 1 year compared to GSV
Analyze data by target vessel Determine if success of prosthetic conduit is due to
BK popliteal target vs. tibial target
Look at more extended follow-up

Completion Imaging after Lower
Extremity Bypass:
Is Routine Use Justified?
On behalf of the Vascular Study Group of New England
Tze-Woei Tan, Jeffrey Kalish,
Naomi Hamburg, Robert Eberhardt, Denis Rybin,
Gheorge Doros, Andres Schanzer,
Jack Cronenwett, Alik Farber

Background
Completion Imaging (Angiography or Duplex) after lower extremity bypass (LEB)
• allows for identification and timely correction of technical problems. May lead to improved patency.
• Is associated with increased operative time, resource utilization, and risk for unnecessary surgical re-exploration.
Selective use is indisputable
Routine use is controversial

Objectives
1. To study the effect of completion imaging use after LEB
2. To compare the strategy of routine use of completion imaging with selective use

Methods
Patient outcome analyses
1.based on whether or not a completion study was performed after LEB
2.based on surgeon completion study strategy
Surgeons were defined as Routine or Selective users of completion studies
Patient cohort grouped according to whether the procedure was performed by a Routine or Selective user

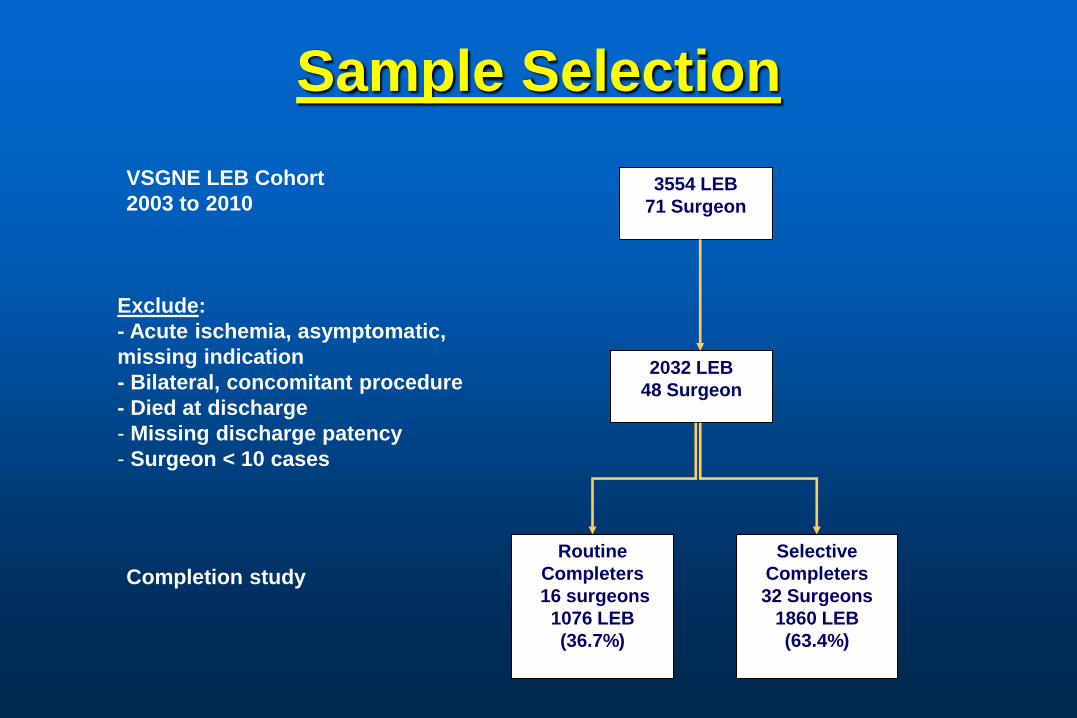
Sample Selection
3554 LEB
71 Surgeon
VSGNE LEB Cohort
2003 to 2010
2032 LEB
48 Surgeon
Exclude:
- Acute ischemia, asymptomatic,
missing indication
- Bilateral, concomitant procedure
- Died at discharge
- Missing discharge patency
- Surgeon < 10 cases
Completion
1368 LEB
(67.3%)
None
664 LEB
(32.7%)
Completion study
- Arteriogram 89%
- Duplex 11%

Demographic Characteristics of Patients
Characteristic Overall
(N=2032)
Completion
(N=1368)
None
(N=664)
P-value
Gender, n (%)
Male 1386 (68.2%) 936 (68.4%) 450 (67.8%) 0.800
Race, n (%)
White 1999 (99.1%) 1347 (99.3%) 652 (98.6%) 0.133
Age (yrs)
Mean ± SD 68.2±11.9 68.5±12.0 67.5±11.8 0.076
Diabetes, n (%) 1064 (52.4%) 742 (54.2%) 322 (48.5%) 0.016
CAD, n (%) 768 (37.8%) 527 (38.5%) 241 (36.4%) 0.380
Dialysis, n (%) 157 (7.7%) 121 (8.8%) 36 (5.4%) 0.011

Clinical Characteristics of Patients
Characteristic Overall
(N=2032)
Completion
(N=1368)
None
(N=664)
P-value
Indication, n (%)
Claudication 544 (26.8%) 340 (24.9%) 204 (30.7%) 0.001
Rest Pain 515 (25.3%) 336 (24.6%) 179 (27.0%)
Tissue Loss 973 (47.9%) 692 (50.6%) 281 (42.3%)
Previous Bypass, n (%) 657 (32.3%) 445 (32.5%) 212 (31.9%) 0.801
Urgency, n (%)
Elective 1673 (82.3%) 1150 (84.1%) 523 (78.8%) 0.002
Urgent 345 (17.0%) 213 (15.6%) 132 (19.9%)

Operative Characteristics of Patients
Characteristic Overall
(N=2032)
Completion
(N=1368)
None
(N=664)
P-
value
Graft Origin, n (%)
CFA/ Profunda/ SFA 1767 (88.8%) 1209 (89.6%) 558 (87.2%) 0.110
AK Pop/BK Pop/Tibial 222 (11.2%) 140 (10.4%) 82 (12.8%)
Graft Recipient, n (%)
AK Pop/BK Pop 1132 (55.8%) 688 (50.3%) 444 (67.1%) <.001
TP Trunk/AT/PT/Peroneal/ DP Ankle/ PT
Ankle/ Tarsal/ Plantar
898 (44.2%) 680 (49.7%) 218 (32.9%)
Graft Type, n (%)
GSV 1364 (67.1%) 979 (71.6%) 385 (58.0%) <.001
Prosthetic 507 (25.0%) 264 (19.3%) 243 (36.6%)

Results

Multivariate Analyses of
Patient Outcomes
Completion vs.
No Completion
*Adjusted
Estimate
95% Lower
CI
95% Upper CI P-value
Discharge Patency 1.11 0.72 1.70 0.640
One-year Patency 1.02 0.77 1.35 0.883
Patency Loss Hazard 0.87 0.65 1.14 0.303
*Adjusted for age, hypertension, indication for surgery (claudication vs. tissue lost), graft origin, graft
recipient, graft type

Summary
No significant difference in patient outcomes based on whether or not a completion study was performed

Surgeon Completion Study Strategy
(Routine vs. Selective

Methods
Outcomes of surgeons based on routine or selective use of completion studies
• Routine Completers (≥ 80% studies)
• Selective Completers (< 80% studies)
Surgeons queried to disclose their completion study strategy
• Electronic survey (5 questions)
Sample Selection
3554 LEB
71 Surgeon
VSGNE LEB Cohort
2003 to 2010
2032 LEB
48 Surgeon
Exclude:
- Acute ischemia, asymptomatic,
missing indication
- Bilateral, concomitant procedure
- Died at discharge
- Missing discharge patency
- Surgeon < 10 cases
Routine
Completers
16 surgeons
1076 LEB
(36.7%)
Selective
Completers
32 Surgeons
1860 LEB
(63.4%)
Completion study

Operative Characteristics of Patients Treated by
Routine vs. Selective Completers
Characteristic Routine
Completers
(N=16)
Selective
Completers
(N=32)
P-value
Surgeon Caseload
10-20 5 (31.3%) 8 (25%) 0.454
21-50 4 (25%) 12 (37.5%)
51-100 3 (18.8%) 9 (28.1%)
>100 4 (25%) 3 (9.4%)

Clinical Characteristics of Patients Treated by
Routine vs. Selective Completers
Characteristic Routine
Completers
(N=792)
Selective
Completers
(N=1240)
P-value
Indication, n (%)
Claudication 211 (26.6%) 333 (26.9%) 0.341
Rest Pain/Tissue Loss 581 (73.3%) 907 (73.2%)
Graft Origin, n (%)
CFA/Profunda/SFA 687 (89.5%) 1080 (88.5%) 0.511
AK Pop/ BK Pop/ Tibial 81 (10.5%) 141 (11.5%)
Graft Recipient, n (%)
AK Pop/ BK Pop 423 (53.5%) 709 (57.2%) 0.099
TP Trunk/Tibial/Tarsal/Plantar 368 (46.5%) 530 (42.8%)
Graft Vein Type, n (%)
GSV 547 (69.1%) 817 (65.9%) 0.028

Multivariate Analyses: Patient Outcomes based on
Surgeon Completion Strategy
(Routine vs. Selective Completers
Adjusted
Estimate*
95% Lower
CI
95% Upper CI P-value
Discharge Patency 0.82 0.59 1.13 0.309
One-year Patency 1.07 0.91 1.23 0.556
*Adjusted for: Indication for surgery, Smoking, Graft origin, Graft recipient, Graft type

Summary
No significant difference in outcomes of surgeons based on their completion study strategy
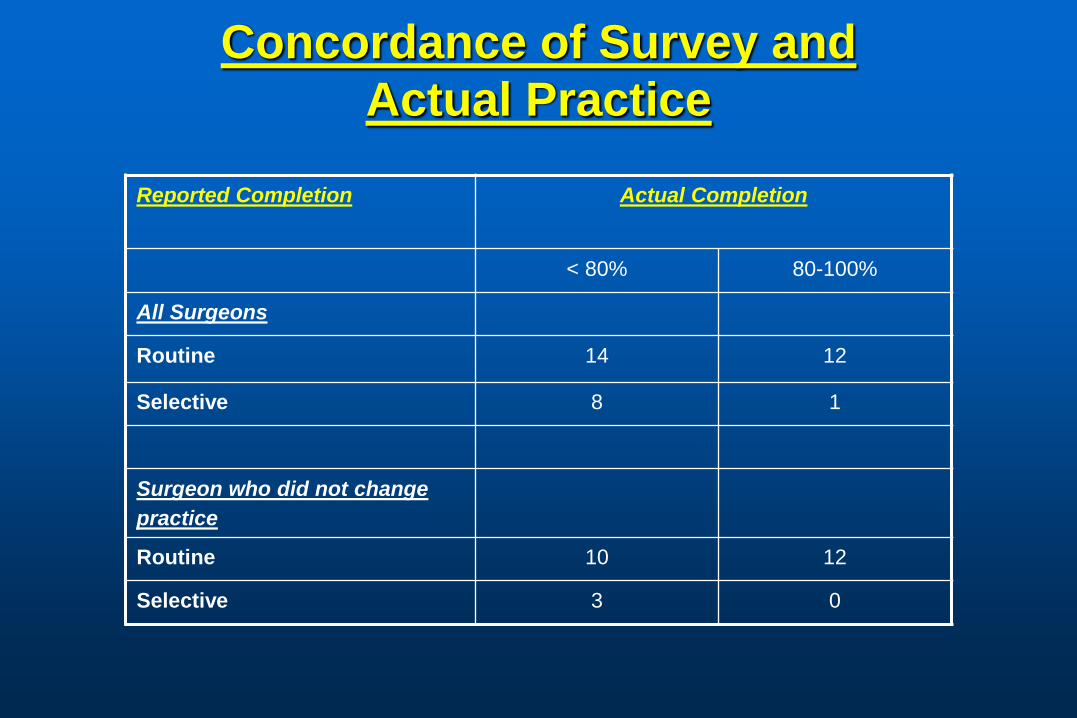
Concordance of Survey and
Actual Practice
Reported Completion
Actual Completion
< 80% 80-100%
All Surgeons
Routine 14 12
Selective 8 1
Surgeon who did not change
practice
Routine 10 12
Selective 3 0

Conclusion
No clear advantage of performing routine completion study after LEB
Surgeons overestimated their completion study utilization

Regional Variation In Length of Stay

Variation Among Centers
Cx: MI, CHF, Dysrhythmia, Pulmonary, Renal, Wound, Ischemia, Bleeding, Stroke, Major Amputation
0% 10% 20% 30% 40% 50% 60% 70%
CEA
LEB
OPEN
EVAR
Mean
Patients with Post-op Complications
Operation: Range
Percentage of Patients with Complications

Complications and Post-op Length of Stay
0
4
8
12
CEA LEB OPEN EVAR
Da
ys
No Yes
Complications:
LOS: Operation date to discharge date
Cx: MI, CHF, Dysrhythmia, Pulmonary, Renal, Wound, Ischemia, Bleeding, Stroke, Major Amputation

Next Meeting
Date: Monday, May 7th
Location: Beth Israel Deaconess, Boston
Time: 10 am – 4 pm