various video clips showing gas leaks from common … point/spring 2011/2011_sata_dan_allen...2...
TRANSCRIPT

1

2
Various video clips showing gas leaks from common places/items: Gas station leaks, a BIC lighter, a gas well pump, a cow belching methane, human-produced methane gas, etc.
3
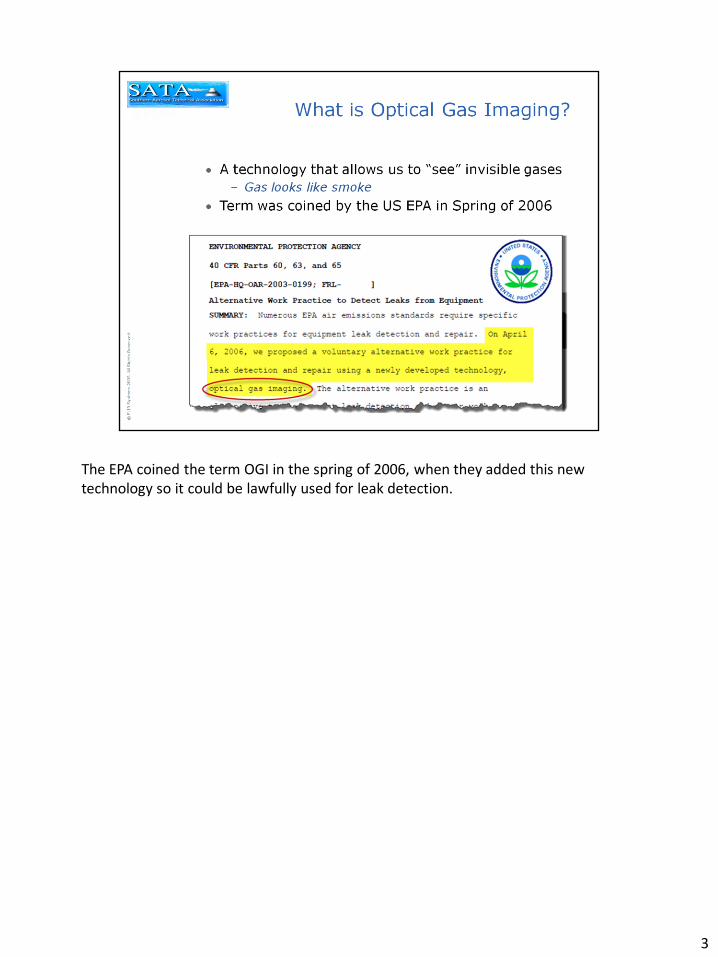
The EPA coined the term OGI in the spring of 2006, when they added this new technology so it could be lawfully used for leak detection.

4
The OGI instrument was defined an instrument that makes invisible gas visible to the naked eye.

5
The term “instrument” actually means an infrared (or thermal) imaging camera.

6
Infrared is a wavelength of energy that is slightly longer than what we can see with our eyes. Humans can only see the “visible” part of the electromagnetic spectrum (0.4-0.7Um), which is only a very small part of what’s around us every day. When we break out the infrared portion, you can see that we have two useful bands of energy – midwave (3-5Um) and longwave (8-14Um).

7
An infrared (or thermal) image is a representative of the amount of IR energy hitting the individual pixels of the camera’s detector. It’s very much like a digital visual camera, except the wavelength of the energy is different. The amount of IR energy is given a shade of color (or B&W) and typically shows the hotter areas as brighter. Note the visual and corresponding thermal images of a power pole with a hot connection. Electrical resistance is causing the connection to heat up.
8
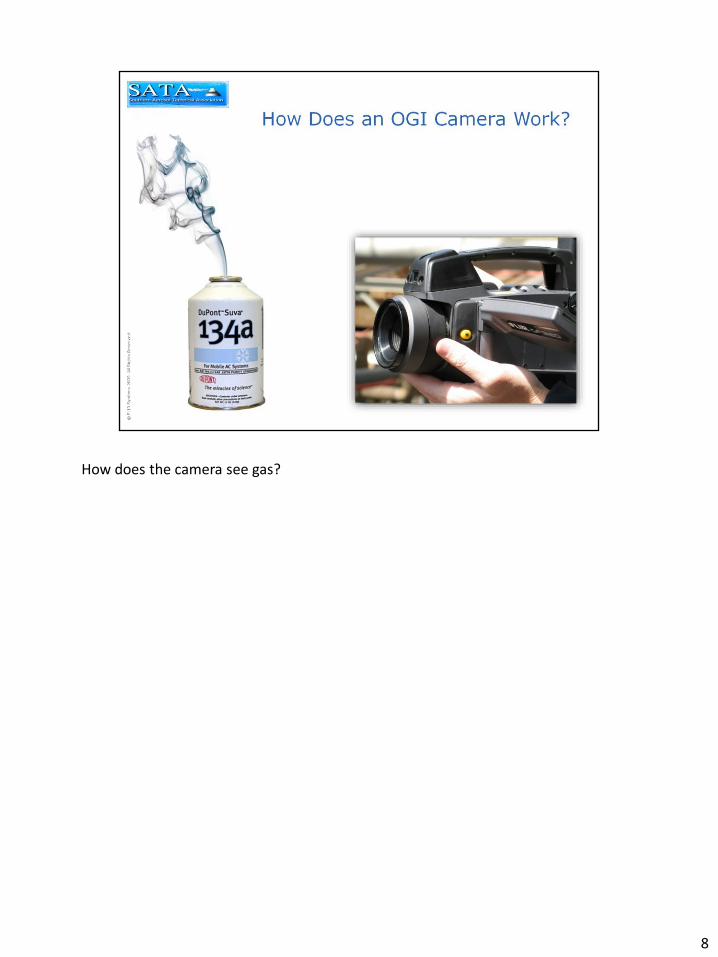
How does the camera see gas?

9
Since it’s a thermal camera, it must “see” the gas due to a temperature difference between the gas and the air around it…right? Nope. Most people think this is the case, but the truth is that we see the gas due to a reduction in background energy, as the gas absorbs IR energy. It’s a little complicated…

10
Things aren’t always what they appear to be. There’s a big difference between object seen in the visible light spectrum verses the infrared spectrum. As an example, here is a visual light image of a white trash bag. To our eyes the trash bag in nearly opaque. But, to a midwave infrared camera, the trash bag is nearly transparent.

11
It also works the other way. Sometimes objects that are transparent in visible light…can have a degree of “opacity” when viewed in the infrared spectrum. This is exactly how we see gas.

12
This is a slide created by Dr. Benson to help us sales guys understand the physics behind how the camera works…
13
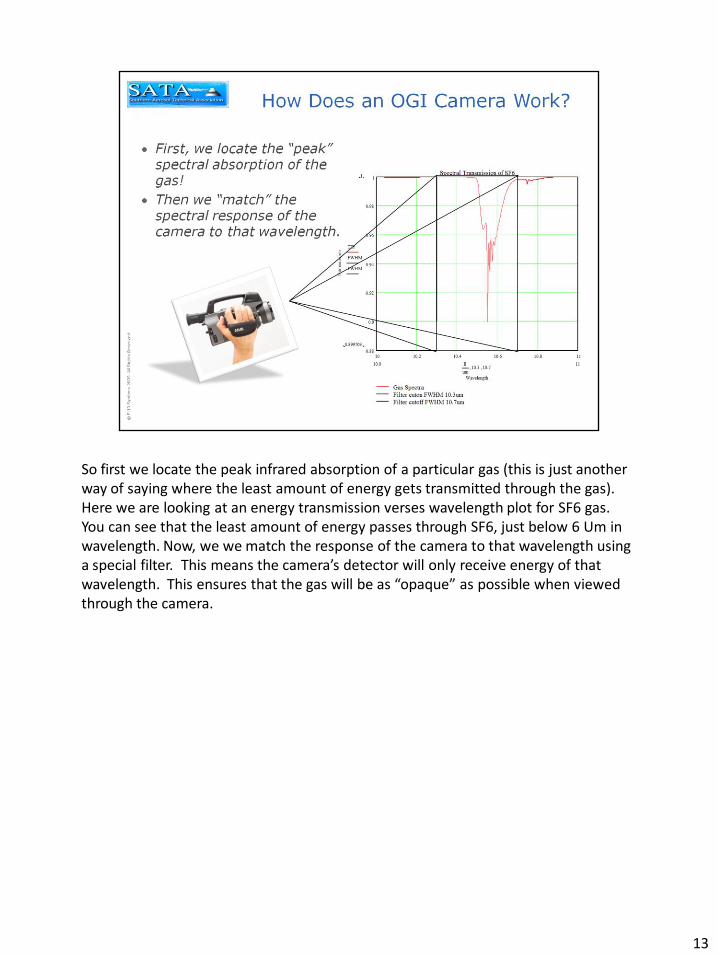
So first we locate the peak infrared absorption of a particular gas (this is just another way of saying where the least amount of energy gets transmitted through the gas). Here we are looking at an energy transmission verses wavelength plot for SF6 gas. You can see that the least amount of energy passes through SF6, just below 6 Um in wavelength. Now, we we match the response of the camera to that wavelength using a special filter. This means the camera’s detector will only receive energy of that wavelength. This ensures that the gas will be as “opaque” as possible when viewed through the camera.

14
Here’s the spectra for propane. You can see the most absorption (the least transmission) occurs in the midwave between 3-4 Um.

15
Here’s Butane. Again, best absorption peak between 3-4 Um.

16
And you see the same thing with Ethane…

17
When you overlay these gases you see a trend for most hydrocarbon gases.

18
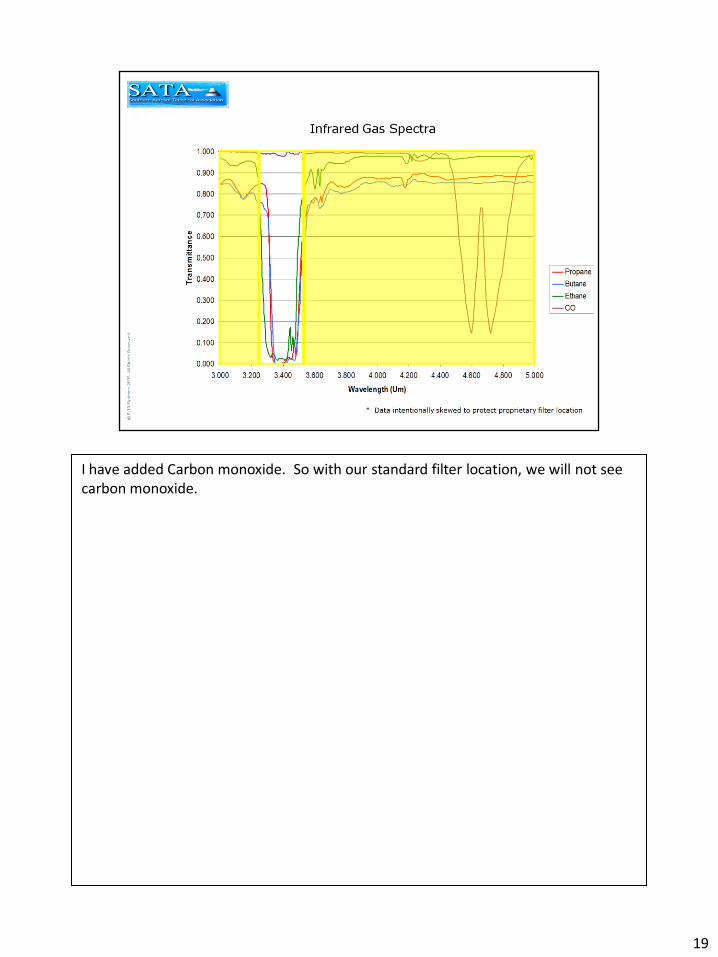
So we use a cold filter to “tune” the camera to this exact wavelength. The only energy that reaches the detector is the energy under these curves. Everything else is blocked. This means the gases that absorb energy in the bandwidth here will essentially absorb/block a portion of the energy from reaching the detector and that will cause them to appear gray (or a different shade of color, depending on the color palette)…just like sunglasses do for our eyes.
19
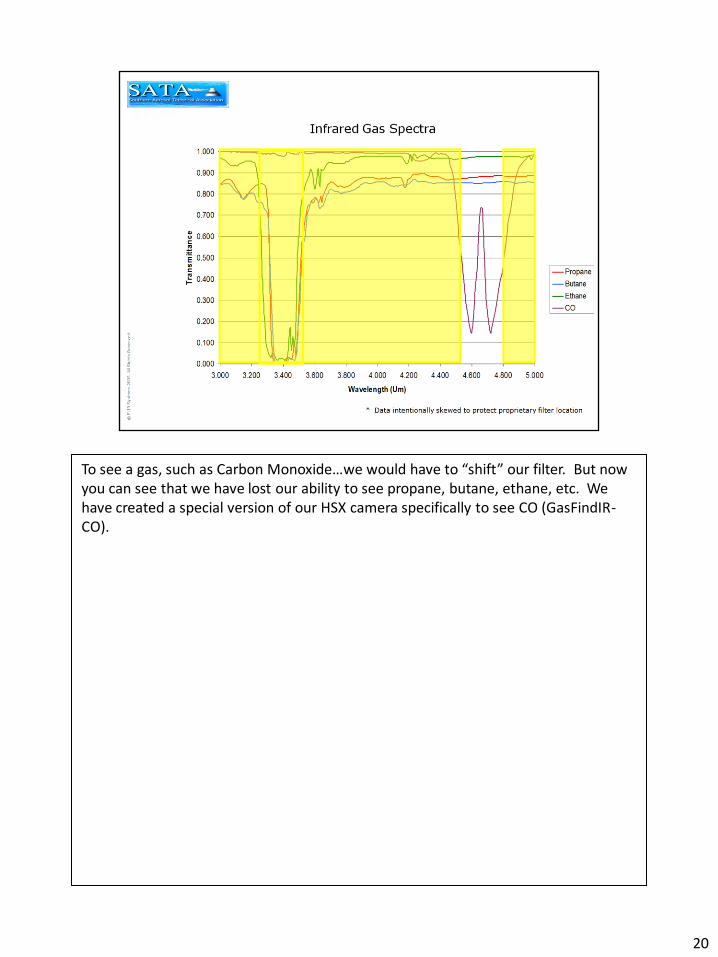
I have added Carbon monoxide. So with our standard filter location, we will not see carbon monoxide.
20
To see a gas, such as Carbon Monoxide…we would have to “shift” our filter. But now you can see that we have lost our ability to see propane, butane, ethane, etc. We have created a special version of our HSX camera specifically to see CO (GasFindIR-CO).

Here’s a list of the midwave gases we have lab certified. There are others that we can see, that were not tested. Butadiene and R-134A are examples.
21

22
These are some of the gases that we can detect with the longwave
camera. Notice that we can see R-134A in both the midwave and
longwave spectra. If you have a particular gas that is not listed here,
our engineers can look up the transmission spectum to determine of it is
theoretically possible to see it.

23
OGI was intended to allow the user to find and trace a leak back to it’s source for quick and safe repair. But, people always want to know the detection limits.

24
Our camera is a “passive” system. It only receives energy – nothing else. With OGI, the only way to determine concentration would be mathematically, and you would have to have EXACT instantaneous information. It is not possible due to the fact that everything is dynamic and changes from instant to instant.

25
Concentration? Well, if we could control all of the previous parameters (in a laboratory environment) we could give a concentration, but it would have to be a concentration over a pathlength (gas thickness). Our engineers developed a test rig to do this and theoretically, we could give a value like, as an example, 850 ppm*m (that’s 850 parts per million per meter thickness of gas)…but as we have seen, this doesn't really mean anything in the real world.. Again, you would have to know the gas cloud thickness

26
So the best way for us to report the detection capability of our system is by using a leak rate (mass flow rate), given in grams per hour.We are the only company to have our camera tested by a third party for minimum detection limits (MDLR’s). We publish this data, and are reporting “worst case” data (meaning that we did not high sensitivity mode to capture this information).
These are a couple of the actual test videos (left is a compound that is a gas at room temperature. Right is a compound that must be heated above room temperature to volatize.)

27
Here are some actual test numbers for the midwave OGI camera operated in standard mode (High Sensitivity Mode was not used). Let’s look at Butane. You will notice that the MDLR for Butane is 0.4 grams/hour. To visualize this size of leak rate, think of a $.99 BIC lighter with a flame that is only ¼ to ½ inch high. To make that size flame, approximately 3-5 grams per hour of Butane is coming out of the lighter.
In the first part of this video (R-134A), you will see some cans being filled with a liquid. Notice how the cans get darker (colder) at first, then start to heat up as the pressure increases. Then the camera pans over to the point where the R-134A propellant is added. Notice how the pressure increase causes the cans to get very warm. The equipment is operating normally (no gas leaks). In the second part of this clip (Propane), you will see the point on a production line where propane is added to the cans. There is an obvious malfunction here.
28

Show the new GF Series CD here (or if you have internet, go to www.goinfrared/see) it has some great videos that are categorized by application. There is a hyperlink (click the video image above) it will automatically start the CD show (as long as the CD is in the drive, and the drive is labeled “D:” )
29

30

31