policy options for reducing natural gas leaks in …
TRANSCRIPT

Policy Options for Reducing Natural Gas Leaks
in Massachusetts
by
Becky Smith
Dean William Chameides, Advisor
May, 2014
Masters project submitted in partial fulfillment of the
requirements for the Master of Environmental Management degree in
the Nicholas School of the Environment of
Duke University
2014

2
Abstract
Massachusetts’ natural gas distribution systems – pipes delivering gas for fuel into homes and
businesses – are leaking large quantities of gas due to aging and crumbling infrastructure – primarily
pipes made of the outdated materials cast iron and unprotected steel. This is problematic in several
ways. First, public safety is at risk from explosions and fires from the leaked gas; second, uncombusted
methane in natural gas is a more potent global warming gas than carbon dioxide – contributing to
climate change; and third, ratepayers bear the cost of the lost gas, as well as the costs of publicly- and
privately-owned trees and shrubs that are harmed by soil health damage near the leaks.
This master’s project explores actions being taken or considered in Massachusetts and in states with
similar gas infrastructure to reduce natural gas leaks, and includes recommendations to achieve further
reductions. A comparative case study approach was used to examine Massachusetts, Pennsylvania,
New York, and federal policy activity. Methods for the case studies included examination of publicly-
available materials as well as interviews with individuals from different areas of expertise or leadership
with respect to gas distribution systems.
Findings indicate that there is no single, simple, or inexpensive solution to eliminating gas leaks from
old, leak-prone infrastructure, but that a combination of approaches from the multiple states studied
may lead to reductions in gas loss if implemented in Massachusetts. Recommendations include:
adoption of consistent measurement and reporting criteria for lost gas from all utilities as modeled by
Pennsylvania’s 2013 regulations revisions; creation or expansion of incentives for utilities to reduce
leakage such as New York’s innovative benchmark and profit incentive for utilities alongside the
federally proposed state revolving loan fund model for capital investments in system upgrade costs; and
incorporation of the value of avoided environmental damage into all cost benefit analyses for aging
pipeline repair and replacement. Finally, caution is needed in any new regulation or practice adopted to
be assured that repair and replacement investments are served, and funding not redirected for
additional natural gas capacity, keeping in mind that overreliance on any single fuel could prove a
foolish gamble.

3
Contents Abstract ..................................................................................................................................................... 2
Acknowledgements ....................................................................................................................................... 4
Introduction .................................................................................................................................................. 5
Purpose and Research Questions ................................................................................................................. 7
Background ................................................................................................................................................... 8
Why are there so many leaks? .................................................................................................................. 8
Why Do Leaks Matter? ............................................................................................................................ 11
Climate ................................................................................................................................................ 11
Costs .................................................................................................................................................... 13
Climate & Costs Meet ......................................................................................................................... 15
Public safety ........................................................................................................................................ 16
Tree health & associated costs ........................................................................................................... 18
Methods & Materials .................................................................................................................................. 20
Results & Observations ............................................................................................................................... 24
Massachusetts ........................................................................................................................................ 24
Pennsylvania ........................................................................................................................................... 32
New York ................................................................................................................................................. 35
Federal .................................................................................................................................................... 37
Discussion, Recommendations, & Conclusion ............................................................................................ 40
Limitations & Questions for Further Research ........................................................................................... 44
References .................................................................................................................................................. 45
Appendices .................................................................................................................................................. 49
Natural Gas Leaks Reduction Strategy Questions ............................................................................... 49
Sample of email interview response ................................................................................................... 52
Massachusetts Gas Leaks Bill: Senate Bill 2073 .................................................................................. 54
Pennsylvania’s Regulation................................................................................................................... 60
Massachusetts Department of Public Utilities’ Current (2014) Study Description & Request for
Quotes ................................................................................................................................................. 72

4
Acknowledgements
I would like to thank Dean Bill Chameides for his guidance and feedback regarding this analysis, as well
as helpful introductions to leaders in the field of gas leaks research and advocacy. I would also like to
thank Dr. Deb Gallagher for her generous support in helping shape and guide my project.
Dr. John Berg of Suffolk University provided leadership and helpful research assistants from his
Environmental Politics and Policy course. Student Team consisted of Nicholas Hutchings, Rahell Nere,
Kyle Spencer, Tyler Chaffee, and Michael Ogunjimi.
Finally, thank you to my Clean Water Action family of colleagues, Dr. Nathan Phillips and his generous
students Bahareh Sanaiemovahed and Margaret Hendrick, Bob Ackley, Shanna Cleveland, Senator Ed
Markey and his diligent staff, Representative Lori Ehrlich, Senator Jamie Eldridge, and activists here in
Massachusetts for working hard on strong gas leaks solutions for the Commonwealth, and to the other
individuals who took the time to speak with me regarding gas leaks from their agencies, organizations,
and states, especially Mr. Nathan Paul in Pennsylvania.

5
Introduction
There are more than 3,300 natural gas leaks in the City of Boston, and at least 20,000
known leaks throughout Massachusetts, releasing at least 1.7 billion cubic feet of natural gas
annually (Phillips et al., 2013; Cleveland, 2012). Massachusetts is losing more natural gas than is
being saved through aggressive energy efficiency retrofitting programs throughout the
commonwealth, and ratepayers bear the burden of nearly $40 million of lost and unaccounted
for gas each year (Cleveland, 2012). The natural gas leaks are threats to public safety, economic
justice, and to greenhouse gas (GHG) reduction strategies for Massachusetts. Current state and
federal policies provide disincentives for pipeline owners to aggressively find and fix these leaks
(Cleveland, 2012).
A team of
researchers from
Boston University and
Duke University, and
led locally by Professor
Nathan Phillips and Bob
Ackley of Gas Safety
USA identified 3,356
methane leaks (Figure 1) that exceeded 2.50 parts per million (ppm), represented above by
their corresponding spikes. These levels are well above the city’s mode background
Figure 1. Methane leaks in the city of Bosto
6
concentration of 2.07 ppm, as measured by the team in the course of mapping Boston’s 785
road miles (Phillips, 2013).
The leaks were measured using a mobile Picarro G2301 Cavity Ring-Down Spectrometer
equipped with an A0491 Mobile Plume Mapping Kit. The leak samples were compared to
samples of methane from nearby landfills, wetlands, and the region’s centralized wastewater
treatment facility, Deer Island, and were found to have a unique enough signature to
differentiate the methane from fugitive gas leaks from these other types of sources that might
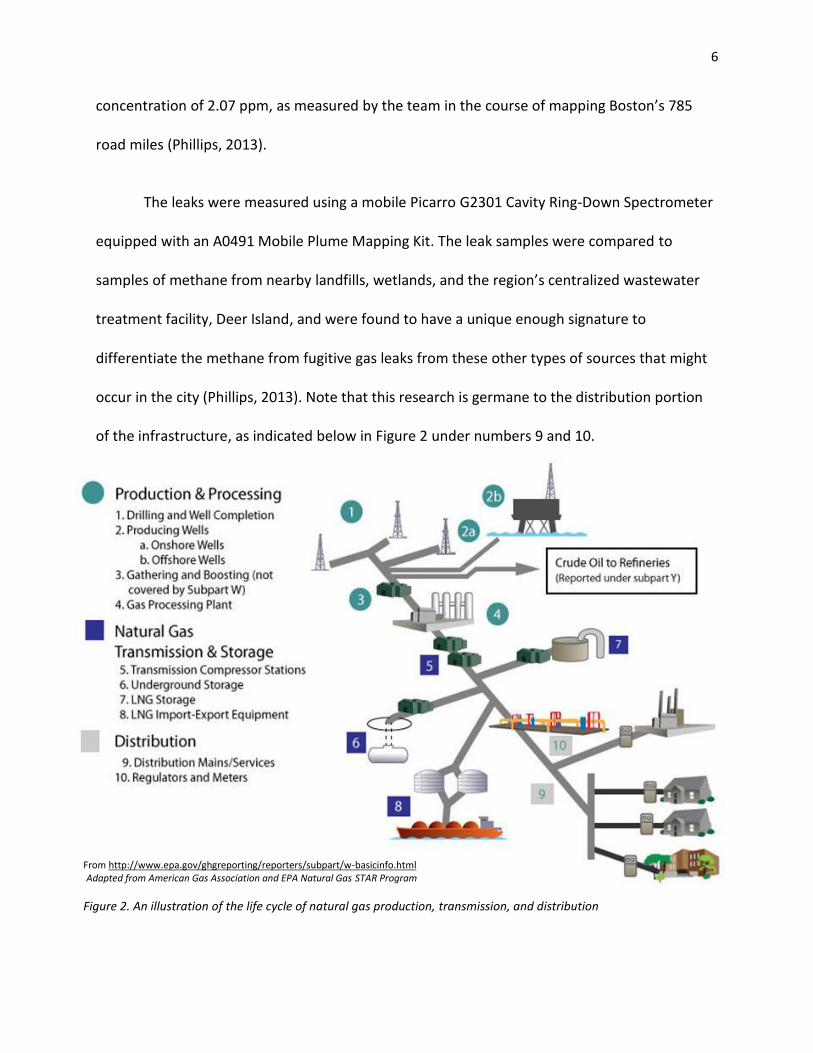
occur in the city (Phillips, 2013). Note that this research is germane to the distribution portion
of the infrastructure, as indicated below in Figure 2 under numbers 9 and 10.
From http://www.epa.gov/ghgreporting/reporters/subpart/w-basicinfo.html Adapted from American Gas Association and EPA Natural Gas STAR Program
Figure 2. An illustration of the life cycle of natural gas production, transmission, and distribution
7
Purpose and Research Questions
This project’s purpose was to identify current practice, existing barriers to, and potential
for, reducing natural gas leaks in Massachusetts’ distribution system; to seek out potential
model solutions from other states, regions, or utilities; and to create a set of recommendations
for Massachusetts to explore for reducing fugitive gas emissions in order to reduce effects on
climate change and ratepayers, and to protect public safety.
Research Questions:
1. What is being done to reduce leaks from Massachusetts’ natural gas distribution
system?
2. What are other states or utilities doing to address leaking gas from their distribution
systems?
3. What are recommended approaches for Massachusetts based on what is being done
currently or pursued in other places?
8
Background
Why are there so many leaks?
Much of Massachusetts’ infrastructure systems
which provide services such as transportation, water,
wastewater, and energy are aging and crumbling,
including the state’s gas delivery systems. Some of the gas
distribution mains are well over 100 years old. In an April,
2011 letter to the U.S. Department of Transportation’s
Pipeline and Hazardous Materials Safety Administration
(PHMSA), the Director for the Massachusetts Department
of Public Utilities (MA DPU) Pipeline Engineering and Safety Division explained that
“The 11 gas distribution operators in the state have over 21,000 miles of gas mains and
over 1 million gas service lines in their systems. Nearly one-third of the mains are
constructed of cast iron or unprotected steel. Some of the cast iron mains were installed
in the 1800s” (Bourne, 2011).
The United States Environmental Protection Agency (US EPA) has identified both cast
iron and unprotected steel as the two most “leak prone” of the gas pipeline materials used in
distribution systems in the United States.
Main means a distribution line that
serves as a common source of
supply for more than one service
line. Service Line means a
distribution line that transports gas
from a common source of supply to
an individual customer, to two
adjacent or adjoining residential or
small commercial customers, or to
multiple residential or small
commercial customers served
through a meter header or manifold.
A service line ends at the outlet of
the customer meter or at the
connection to a customer's piping,
whichever is further downstream, or
at the connection to customer
piping if there is no meter (PHMSA,
Part 192).
9
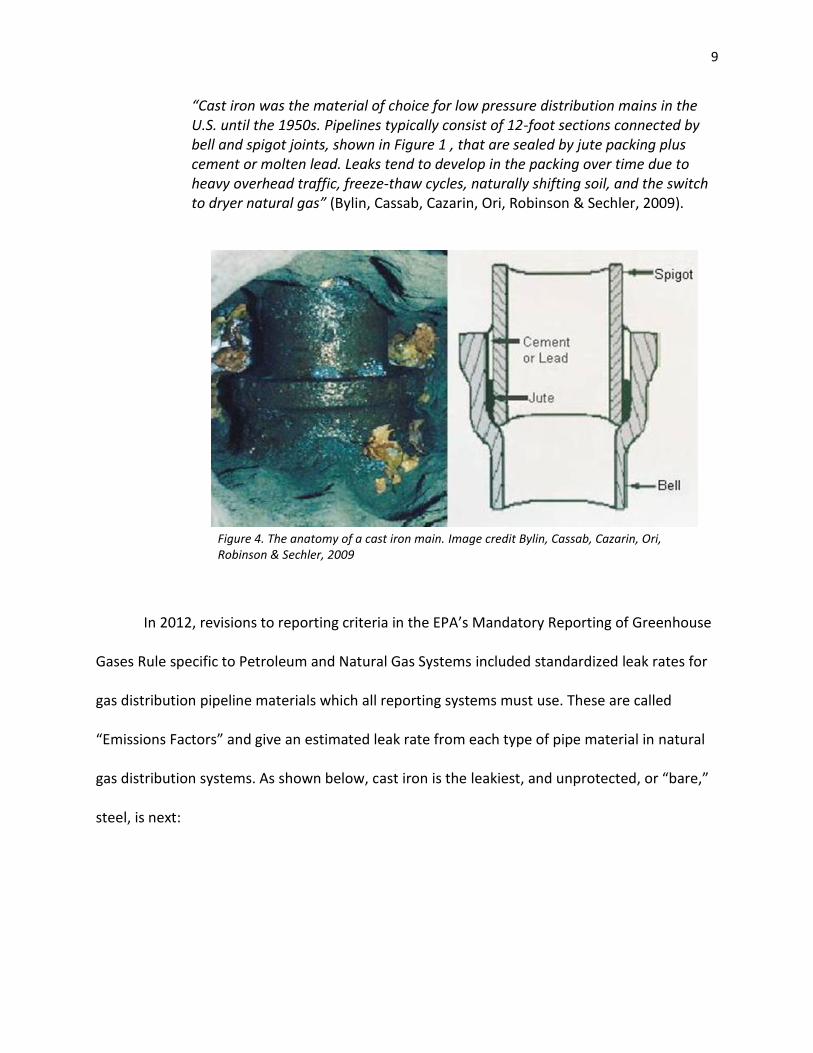
“Cast iron was the material of choice for low pressure distribution mains in the U.S. until the 1950s. Pipelines typically consist of 12-foot sections connected by bell and spigot joints, shown in Figure 1 , that are sealed by jute packing plus cement or molten lead. Leaks tend to develop in the packing over time due to heavy overhead traffic, freeze-thaw cycles, naturally shifting soil, and the switch to dryer natural gas” (Bylin, Cassab, Cazarin, Ori, Robinson & Sechler, 2009).
In 2012, revisions to reporting criteria in the EPA’s Mandatory Reporting of Greenhouse
Gases Rule specific to Petroleum and Natural Gas Systems included standardized leak rates for
gas distribution pipeline materials which all reporting systems must use. These are called
“Emissions Factors” and give an estimated leak rate from each type of pipe material in natural
gas distribution systems. As shown below, cast iron is the leakiest, and unprotected, or “bare,”
steel, is next:
Figure 4. The anatomy of a cast iron main. Image credit Bylin, Cassab, Cazarin, Ori, Robinson & Sechler, 2009
10
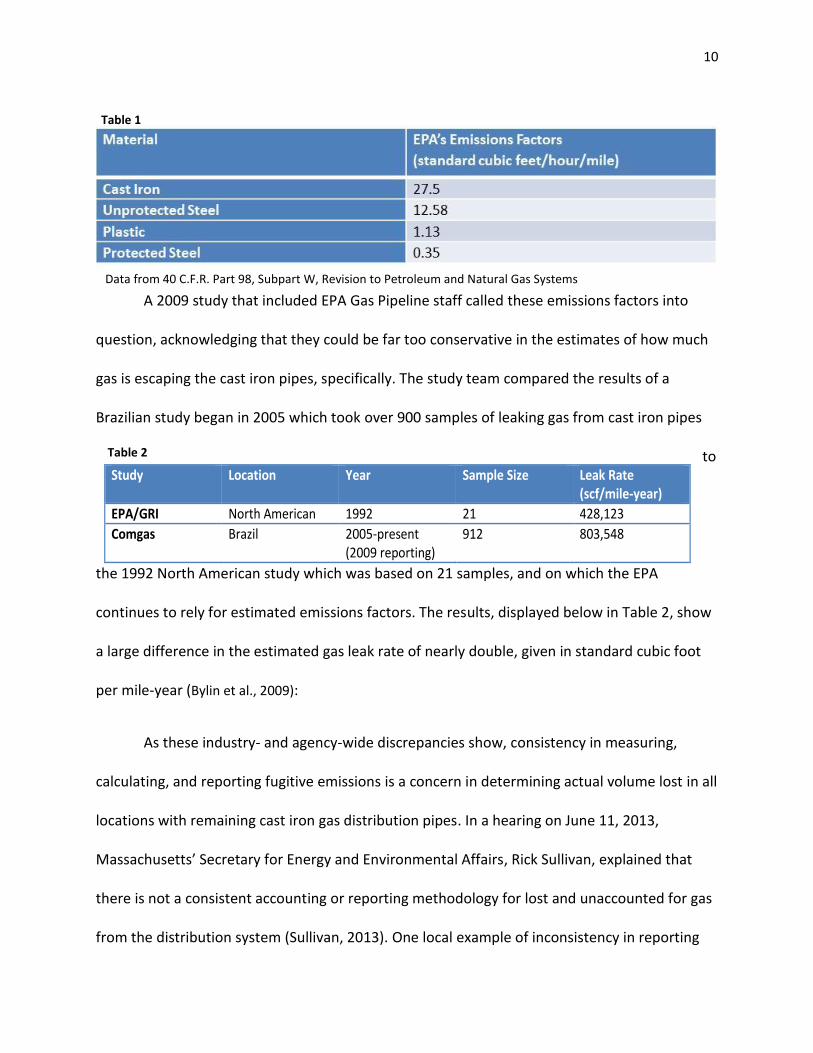
A 2009 study that included EPA Gas Pipeline staff called these emissions factors into
question, acknowledging that they could be far too conservative in the estimates of how much
gas is escaping the cast iron pipes, specifically. The study team compared the results of a
Brazilian study began in 2005 which took over 900 samples of leaking gas from cast iron pipes
to
the 1992 North American study which was based on 21 samples, and on which the EPA
continues to rely for estimated emissions factors. The results, displayed below in Table 2, show
a large difference in the estimated gas leak rate of nearly double, given in standard cubic foot
per mile-year (Bylin et al., 2009):
As these industry- and agency-wide discrepancies show, consistency in measuring,
calculating, and reporting fugitive emissions is a concern in determining actual volume lost in all
locations with remaining cast iron gas distribution pipes. In a hearing on June 11, 2013,
Massachusetts’ Secretary for Energy and Environmental Affairs, Rick Sullivan, explained that
there is not a consistent accounting or reporting methodology for lost and unaccounted for gas
from the distribution system (Sullivan, 2013). One local example of inconsistency in reporting
Table 1
Data from 40 C.F.R. Part 98, Subpart W, Revision to Petroleum and Natural Gas Systems
Table 2
Study Location Year Sample Size Leak Rate (scf/mile-year)
EPA/GRI North American 1992 21 428,123
Comgas Brazil 2005-present (2009 reporting)
912 803,548

11
fugitive emissions from distribution pipelines here in Massachusetts includes 2010 totals
reported to the Massachusetts Department of Environmental Protection (MA DEP) versus
amounts reported to MA DPU. There is a nearly 3 billion metric ton difference in CO2
equivalent calculated and reported (Cleveland, 2012).
Further, in the report America Pays for Gas Leaks recently commissioned by Senator Ed
Markey, “companies frequently report negative volumes of unaccounted for gas to various
agencies – even though it’s physically impossible to dispose of more gas than enters a closed
system” (2013).
There are multiple negative outcomes when gas escapes from distribution systems.
These include, but are not limited to: that potent greenhouse gas methane is released; that
ratepayers are charged for the lost “valuable, non-renewable hydrocarbon resource”; that
public safety is threatened by explosions and any other public health concerns related to
methane exposure or atmospheric increases; and that trees and natural foliage are harmed or
killed by the effects on nearby soil chemistry and create added public and private expense to
the gas leaks equation (Bylin et al., 2009).
Why Do Leaks Matter?
Climate Natural gas has the reputation of being a “cleaner” fuel than coal and oil.
However, US EPA’s analysis confirms that when leaked instead of burned, uncombusted
methane – the main ingredient in natural gas – is worse for the climate than CO2: “Pound for
pound, the comparative impact of CH4 on climate change is over 20 times greater than CO2 over
12
a 100-year period” (EPA, 2014; Shindell et al., 2012). According to EPA’s most recent annual
National Greenhouse Gas Emissions Data reporting, “Energy-related activities were the primary
sources of U.S. anthropogenic greenhouse gas emissions .... This included 40 percent of the
nation's methane (CH4) emissions” (EPA, 2014).
Even more alarming for the prospects of the short term climate implications of leaked
methane is the possibility, suggested by recent projections of the International Panel on
Climate Change (IPCC) that in the short term – a 20-year timespan of effects compared to a
100-year timespan in the widely accepted Shindell study – methane could actually be up to 84-
87 times more potent a than CO2 at trapping heat into earth’s atmosphere, and
“When it escapes into the air, during the first year a pound of methane is 120
times more powerful than a pound of carbon dioxide in trapping heat at the
earth’s surface. Methane is the biggest contributor to short term climate
pollutants that have caused about one-third of the warming that we are
currently experiencing, leading to hotter temperatures, droughts, crop loss, and
more intense storms” (Methane Reduction, 2014).
Depending upon the size of natural gas leaks over its entire life cycle – during
production & processing, transmission & storage, and distribution – the warming from fugitive
emission of methane might actually outweigh the climate benefits of shifting reliance to gas
away from coal or oil. In short, as stated in 2012 by Alvarez et al., “There is a need for the
natural gas industry and science community to help obtain better emissions data and for
increased efforts to reduce methane leakage in order to minimize the climate footprint of
natural gas” (2012).

13
Costs Currently, ratepayers in Massachusetts bear the costs of the lost and unaccounted
for gas from the distribution system – paying for gas which is never delivered or used in their
homes or businesses. This creates a disincentive for utilities to prioritize repairing or replacing
pipes which may be leaking but which may not present an immediate explosion risk. Paying for
these lost and unaccounted for gas volumes is really only one cost associated with these
fugitive emissions. There are also the costs to society from the effects of losing a limited
resource, and from climate change, which is exacerbated by the release of uncombusted
methane. These less direct and often unrecognized expenses to society go essentially
uncalculated while utilities continue to profit from these same consumers.
Ratepayers’ direct cost burden in Massachusetts has been significant. In the period
2000-2011, costs that were passed on to ratepayers for unaccounted for gas ranged from $640
million to $1.5 billion, according to a 2013 report by U.S. Senator Ed Markey’s research staff
(America Pays, 2013). Utilities are able to spread their costs of lost product among their
ratepayers in the form of fees, such as “Gas delivery charges” included in customer bills. See
below from customer bill explanation from National Grid for gas billing to private residential
consumers in Boston:
“Gas delivery charge - This represents the cost of local transportation of gas to your home or business, providing safety services, local pipeline maintenance, meter reading, billing and payment processing, and other business related costs. Every customer pays a Minimum Charge that covers our fixed costs of providing service to you, whether or not you've used gas during the billing period. The Rate
Block Steps show you how your cost per therm decreases as you use more gas. For many commercial customers, there is only one Rate Step after the Minimum Charge.
Gas supply charge - This charge represents the actual cost of gas purchased by Grid from suppliers and delivered to our service area. The price you pay is the price we pay. We are not allowed to mark up the gas supply charge.”
14
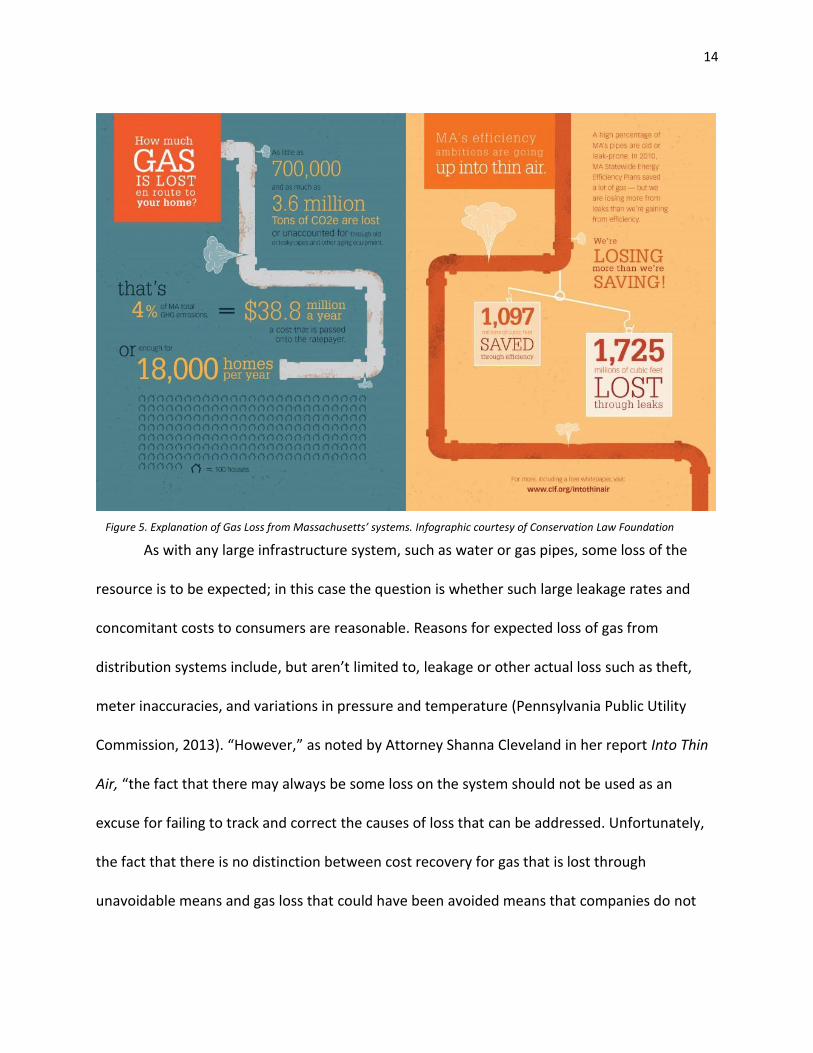
As with any large infrastructure system, such as water or gas pipes, some loss of the
resource is to be expected; in this case the question is whether such large leakage rates and
concomitant costs to consumers are reasonable. Reasons for expected loss of gas from
distribution systems include, but aren’t limited to, leakage or other actual loss such as theft,
meter inaccuracies, and variations in pressure and temperature (Pennsylvania Public Utility
Commission, 2013). “However,” as noted by Attorney Shanna Cleveland in her report Into Thin
Air, “the fact that there may always be some loss on the system should not be used as an
excuse for failing to track and correct the causes of loss that can be addressed. Unfortunately,
the fact that there is no distinction between cost recovery for gas that is lost through
unavoidable means and gas loss that could have been avoided means that companies do not
Figure 5. Explanation of Gas Loss from Massachusetts’ systems. Infographic courtesy of Conservation Law Foundation

15
typically even attempt to quantify whether and how they might reduce their lost and
unaccounted for gas volumes” (2012).
In Massachusetts, the 2008 law known as the Global Warming Solutions Act stipulates
that the Commonwealth must reduce greenhouse gas emissions by 25% by 2020 and 80% by
2050 over 1990 levels. In pursuit of meeting these mandates, there is a customer charge on
every residential and business consumer’s electric or gas bill in Massachusetts which directs
customer dollars to a pool of funds to be used for energy efficiency measures in homes and
businesses. The funds are spent on providing incentives for home and business energy audits
and weatherization retrofitting. This often consists of installing low-energy light bulbs,
programmable thermostats, sealing windows and doors, replacement of the most inefficient
appliances and insulating entire building exterior walls.
In its current 3-year plan cycle, MA’s energy efficiency program—known as Mass Save –
has a $2.25 billion dollar budget, and is ranked as the #1 program in the U.S (American Council
for an Energy-Efficient Economy, 2013). In 2010, according to analysis by the Conservation Law
Foundation, the statewide natural gas efficiency program saved 1,097 million cubic feet (MMcf)
of natural gas. However, the analysis also found that in the same year, MA’s leaky gas
distribution pipes lost at least 1,725 MMcf. “We are losing more on the distribution than we are
saving [through energy efficiency practices], and customers are still paying for those losses”
(Cleveland, 2012). In fact, customers are currently being charged for both – paying into the
energy efficiency savings pool and paying for the lost gas.
Climate & Costs Meet A 2013 report by the Analysis Group calculated the benefits of
several gas utilities’ Targeted Infrastructure Replacement Fund programs (TIRF), including the

16
three which have been approved by MA DPU and initiated in MA. Their calculations of benefits,
“using the most widely accepted assumptions from the EPA for gas leak rates, global warming
potential and the social cost of carbon” were based solely on those of the reduced gas supply
costs and the lowered GHG emissions’ effects on climate and ensuing cost savings to society
when leaks are stopped (Aubuchon & Hibbard, 2013). These benefits are in addition to utilities’
or states’ likely focus on calculating benefits of accelerating repair based on reduced public
safety threats from explosions or fires and those associated costs. The Analysis Group’s report
results indicate that over the full program life of the current TIRF programs – calculated at a
conservative replacement pipe lifetime of 20 years – the accelerated repair programs for old
pipe in these three (out of eleven) MA gas providers leads to total 20-year project lifetime net
ratepayer benefits of $156 million (Aubuchon & Hibbard, 2013).
There is a bottom line message to these multiple threads about costs of natural gas
leaks: consumers are paying locally, globally, financially, and with the failing health of the
planet’s ability to support them.
Public safety Loss of life is the most critical and visible tragedy that occurs when gas leaks
explode or catch fire. In recent years, there have been fatalities in many states across the U.S.,
including those which do not have a spot on the “radar” for high percentages or quantities of
the leakiest types of pipe. In U.S. Senator Ed Markey’s 2013 report, America Pays for Gas Leaks,
he uses data collected and reported by PHMSA to paint this grim, nationwide picture:
“From 2002 to 2012, almost 800 significant incidents on gas distribution pipelines, including several hundred explosions, killed 116 people, injured 465 others, and caused more than $800 million in property damage” (2013).

17
Since deregulation of the U.S. energy market in 1998, “the number of permanent [gas]
company employees has dropped by approximately 25%...while the number of customers per
employee has risen to nearly double in the same time frame from 350 to 700” (New England
Gas Workers Association, 2010). That association makes the case that maintenance is what is
largely failing our public safety in energy infrastructure hazards across states and regions.
NEGWA suggests that replacing all pipes – cast iron, bare steel, or otherwise – would simply
start a ticking clock over again on the lifetime of materials, and that increasing feet on the
ground for inspections and maintenance is what can keep the public safest immediately and in
the future. Their research presents and compares the number of pipeline inspectors per miles
Figure 6. A badly damaged building at 1646 Park Ave. in East Harlem was demolished after a devastating gas
explosion March 12, 2014. From ANTHONY DELMUNDO/NEW YORK DAILY NEWS . Further image credit.
18
of gas mains per state and per number of gas services per state, suggesting a correlation in
incidents and lack of inspection capacity. Pennsylvania is in the worst position, with nearly
8,000 miles of mains per inspector and over 450,000 services per inspector.
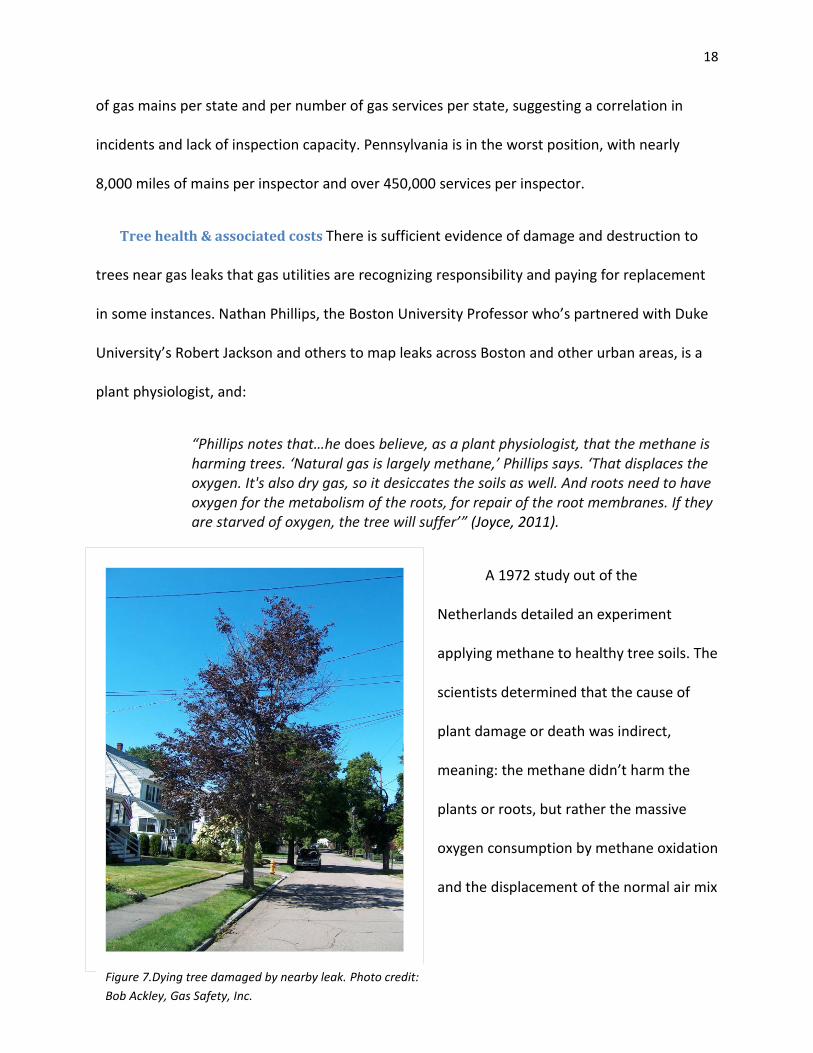
Tree health & associated costs There is sufficient evidence of damage and destruction to
trees near gas leaks that gas utilities are recognizing responsibility and paying for replacement
in some instances. Nathan Phillips, the Boston University Professor who’s partnered with Duke
University’s Robert Jackson and others to map leaks across Boston and other urban areas, is a
plant physiologist, and:
“Phillips notes that…he does believe, as a plant physiologist, that the methane is harming trees. ‘Natural gas is largely methane,’ Phillips says. ‘That displaces the oxygen. It's also dry gas, so it desiccates the soils as well. And roots need to have oxygen for the metabolism of the roots, for repair of the root membranes. If they are starved of oxygen, the tree will suffer’” (Joyce, 2011).
A 1972 study out of the
Netherlands detailed an experiment
applying methane to healthy tree soils. The
scientists determined that the cause of
plant damage or death was indirect,
meaning: the methane didn’t harm the
plants or roots, but rather the massive
oxygen consumption by methane oxidation
and the displacement of the normal air mix
Figure 7.Dying tree damaged by nearby leak. Photo credit:
Bob Ackley, Gas Safety, Inc.
19
within the soil from the dry methane gas did the harm (Hoeks, 1972).
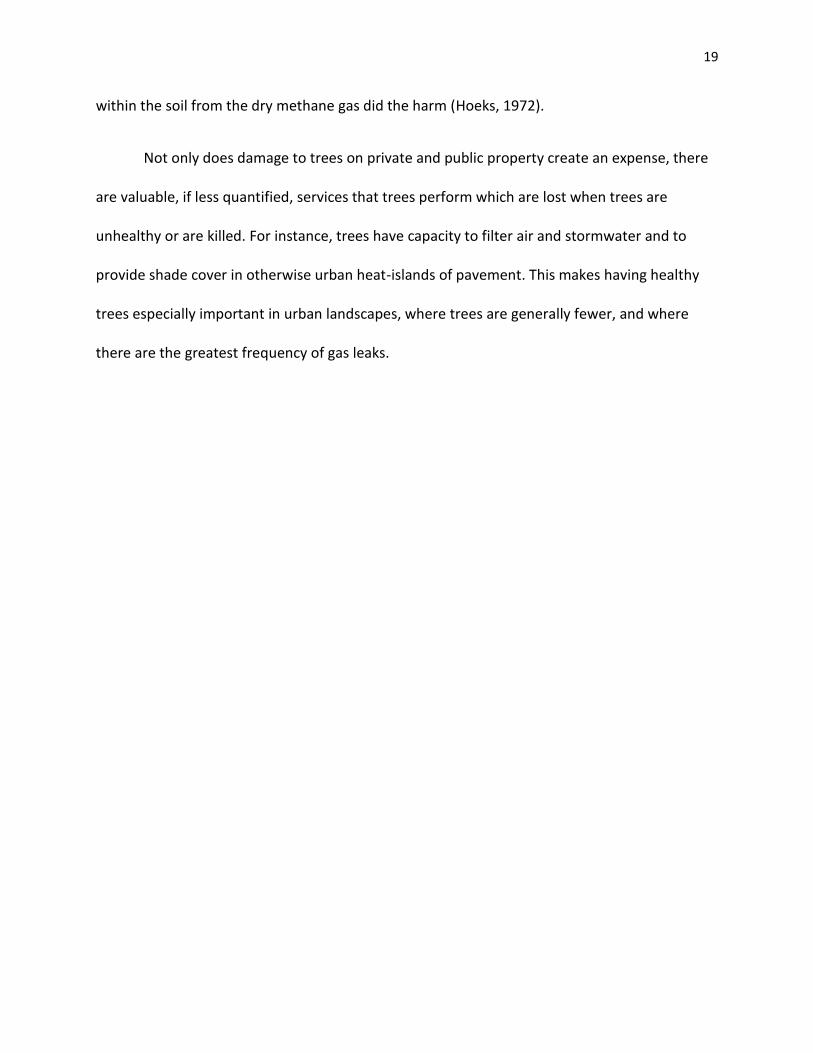
Not only does damage to trees on private and public property create an expense, there
are valuable, if less quantified, services that trees perform which are lost when trees are
unhealthy or are killed. For instance, trees have capacity to filter air and stormwater and to
provide shade cover in otherwise urban heat-islands of pavement. This makes having healthy
trees especially important in urban landscapes, where trees are generally fewer, and where
there are the greatest frequency of gas leaks.

20
Methods & Materials
Comparative case study
While natural gas generates up to 25% of consumer energy nationwide, in some states
this percentage is significantly higher (Phmsa.dot.gov, n.d.). In Massachusetts and New York, for
instance, natural gas makes up 63% and over 37%, respectively, of the consumer electric energy
mix (Eia.gov, 2014). Cast iron gas pipes have been in use since the 1830’s in the U.S., and while
only 3% of the nation’s current gas main lines are cast iron, half of those remain in
Massachusetts, New York, New Jersey, and Pennsylvania (United States Department of
Transportation Pipeline and Hazardous Materials Administration, n.d.).
This information taken together – that a handful of states that rely on natural gas for
much of their consumer energy provisions also maintain the vast majority of the oldest, most
leak-prone infrastructure to support those provisions – underscores the need for attention to
these systems. The fugitive gas emissions and lost and unaccounted for gas, with the
companion concerns of public safety, costs for consumers, and environmental damage are
concentrated in these states, are not representative of the U.S., and are in fact more urgent.
Therefore, this Master’s Project has examined the regional issue with respect to failing natural
gas distribution infrastructure and requisite policies with the intention of elevating best
practices and providing recommendations for Massachusetts’ to achieve speedier remediation
and, secondarily, preventing further global greenhouse gas emissions effects related to fugitive
methane emissions.
21
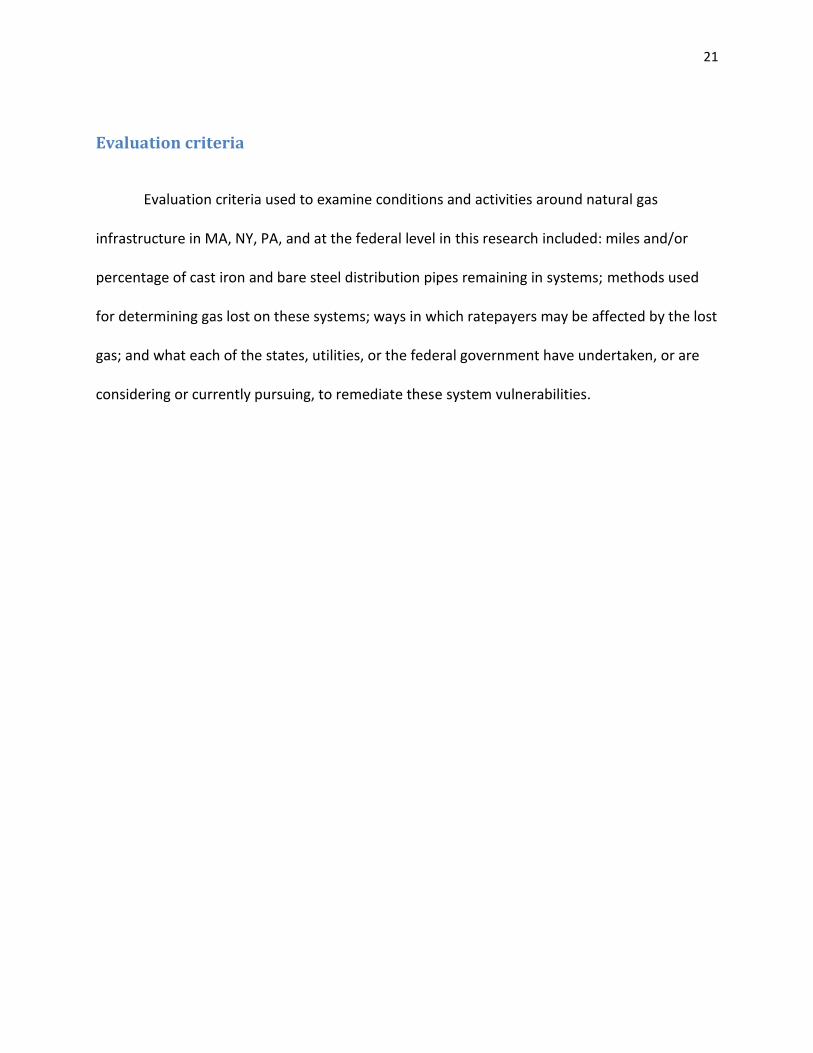
Evaluation criteria
Evaluation criteria used to examine conditions and activities around natural gas
infrastructure in MA, NY, PA, and at the federal level in this research included: miles and/or
percentage of cast iron and bare steel distribution pipes remaining in systems; methods used
for determining gas lost on these systems; ways in which ratepayers may be affected by the lost
gas; and what each of the states, utilities, or the federal government have undertaken, or are
considering or currently pursuing, to remediate these system vulnerabilities.

22
Materials
Materials for the case studies included examination of publicly-available materials such
as policies and regulations, pipeline survey statistics, agency investigations, reports by public
and private entities, and legislative testimony, as well as interviews of individuals – both on the
record and anonymous – from different areas of expertise or leadership with respect to gas
distribution systems.
Addressing leaking gas distribution infrastructure is a current and ongoing topic; is in the
public spotlight especially upon occasions of disaster and tragedy such as happened on March
13, 2014 in New York City; and also carries implications for the future of expansion of domestic
production, transmission, and distribution. For these reasons, I believe, conducting interviews
with public figures was problematic. Individuals were sometimes willing to speak with me on
the basis of anonymity, or only if I agreed that their comments would not be used to represent
their organizations or agencies, but be considered only “background” information. This, and the
fact that I had to disclose the interviewees that I am an environmental advocate for an
organization in Massachusetts known for policy, grassroots, and electoral advocacy may have
affected the responses I received to my questions.
Table 3 is a representation of the combination of resources I was able to employ for each of the selected case studies:
State/Region Public Documents
On-record Interviews Off-record or anonymous interviews
Massachusetts X X X
Pennsylvania X X
New York X
Federal X X
Table 3
23
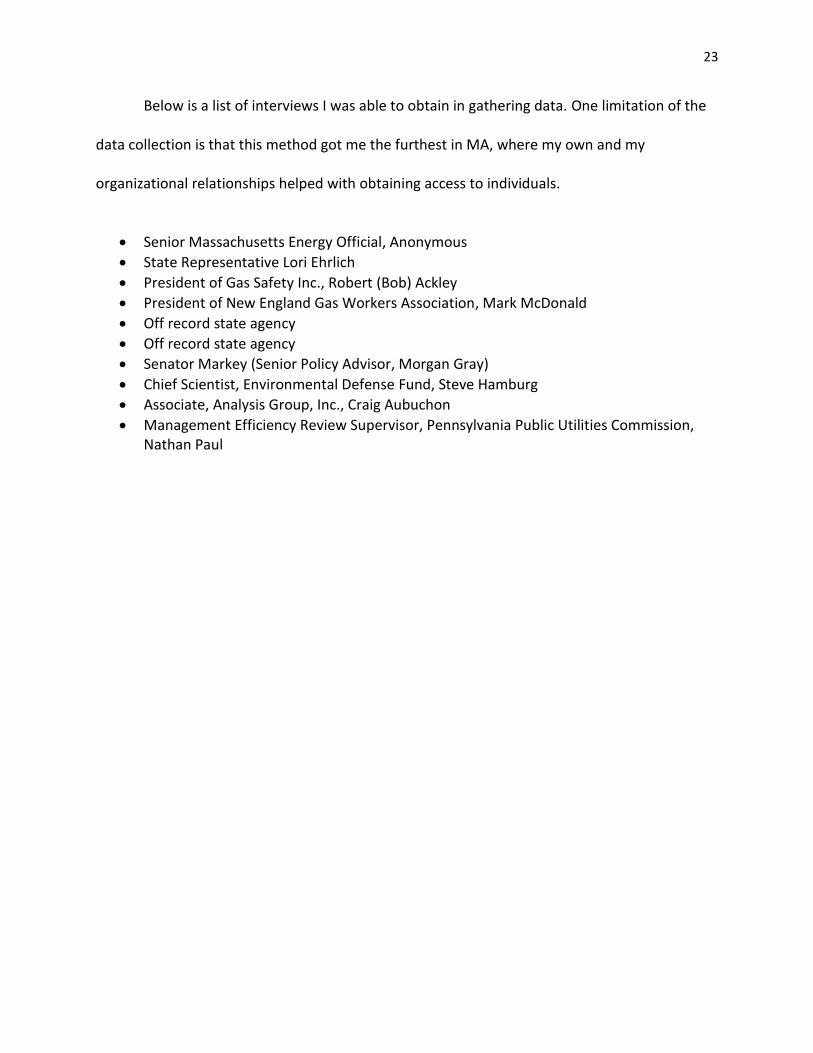
Below is a list of interviews I was able to obtain in gathering data. One limitation of the
data collection is that this method got me the furthest in MA, where my own and my
organizational relationships helped with obtaining access to individuals.
Senior Massachusetts Energy Official, Anonymous
State Representative Lori Ehrlich
President of Gas Safety Inc., Robert (Bob) Ackley
President of New England Gas Workers Association, Mark McDonald
Off record state agency
Off record state agency
Senator Markey (Senior Policy Advisor, Morgan Gray)
Chief Scientist, Environmental Defense Fund, Steve Hamburg
Associate, Analysis Group, Inc., Craig Aubuchon
Management Efficiency Review Supervisor, Pennsylvania Public Utilities Commission, Nathan Paul
24
Results & Observations
Massachusetts
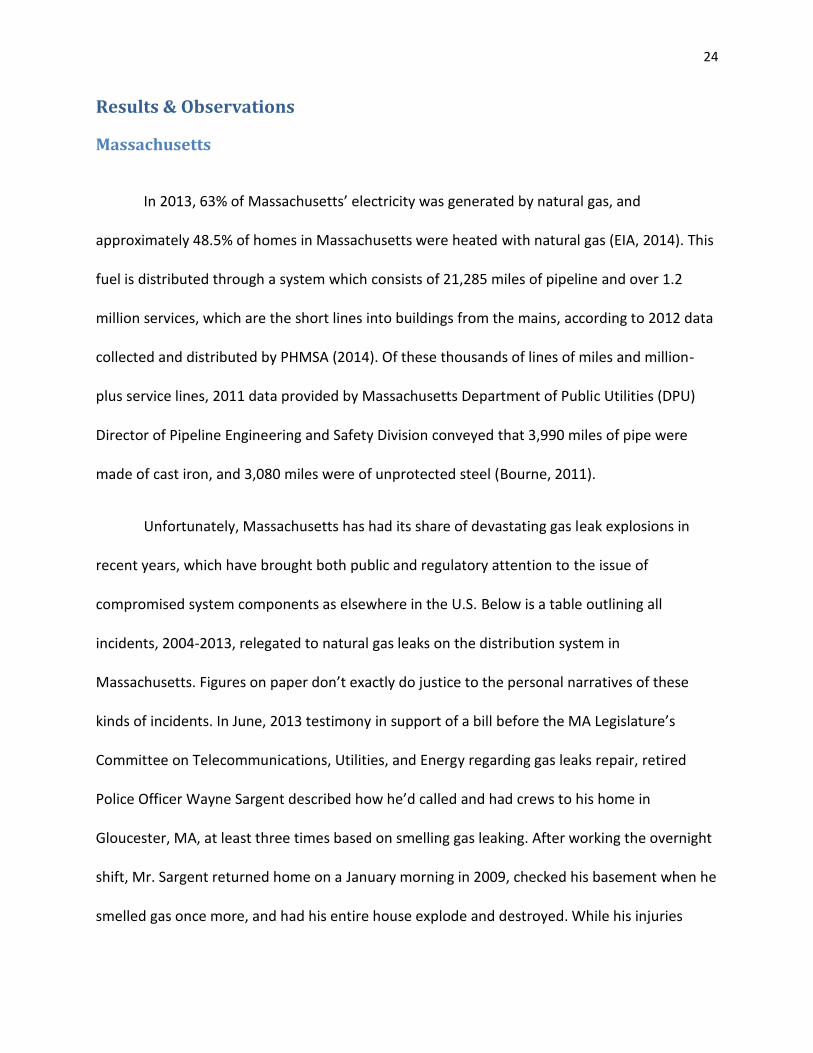
In 2013, 63% of Massachusetts’ electricity was generated by natural gas, and
approximately 48.5% of homes in Massachusetts were heated with natural gas (EIA, 2014). This
fuel is distributed through a system which consists of 21,285 miles of pipeline and over 1.2
million services, which are the short lines into buildings from the mains, according to 2012 data
collected and distributed by PHMSA (2014). Of these thousands of lines of miles and million-
plus service lines, 2011 data provided by Massachusetts Department of Public Utilities (DPU)
Director of Pipeline Engineering and Safety Division conveyed that 3,990 miles of pipe were
made of cast iron, and 3,080 miles were of unprotected steel (Bourne, 2011).
Unfortunately, Massachusetts has had its share of devastating gas leak explosions in
recent years, which have brought both public and regulatory attention to the issue of
compromised system components as elsewhere in the U.S. Below is a table outlining all
incidents, 2004-2013, relegated to natural gas leaks on the distribution system in
Massachusetts. Figures on paper don’t exactly do justice to the personal narratives of these
kinds of incidents. In June, 2013 testimony in support of a bill before the MA Legislature’s
Committee on Telecommunications, Utilities, and Energy regarding gas leaks repair, retired
Police Officer Wayne Sargent described how he’d called and had crews to his home in
Gloucester, MA, at least three times based on smelling gas leaking. After working the overnight
shift, Mr. Sargent returned home on a January morning in 2009, checked his basement when he
smelled gas once more, and had his entire house explode and destroyed. While his injuries

25
were critical, he survived. His dog, of whom he brought pictures to the hearing, was killed,
Massachusetts though that’s not represented in the fatalities shown below, of course (Sargent,
2013).
Table 4 Gas Distribution: 2004-2013
Year Number Fatalities Injuries Property Damage
2004 1 0 0 $182,230
2005 4 1 1 $1,688,467
2006 1 0 1 $22,005
2007 4 0 3 $2,338,989
2008 1 0 0 $163,386
2009 3 1 1 $794,813
2010 4 0 1 $797,578
2011 1 0 0 $106,289
2012 6 1 17 $2,479,788
2013 4 0 0 $954,601
Totals 29 3 24 $9,528,149
2014 YTD 1 0 0 $9,823
3 Year Average (2011-2013) 4 0 6 $1,180,226
5 Year Average (2009-2013) 4 0 4 $1,026,614
10 Year Average (2004-2013) 3 0 2 $952,815
20 Year Average (1994-2013) 3 0 2 $952,815
Table extracted from: http://primis.phmsa.dot.gov/comm/reports/safety/MA_detail1.html
The following section provides descriptions, with outcomes when available, of efforts
ongoing in Massachusetts to reduce fugitive emissions from leaking gas distribution
components.
Targeted Infrastructure Replacement Factor Programs
Three utilities in MA have already initiated programs to accelerate their repair and
replacement of cast iron and bare steel pipes with alterations that allow rate increases to cover

26
their costs ahead of the expenditures. These arrangements are a departure from the usual
order of operations, in which a utility would spend money up front for repairs, and not be able
to recover those costs until the next rate case period. Without these creative arrangements
requested of and agreed upon by MA DPU, the utility typically would be forced to carry the
financial burden for accelerated pipeline repair over time, including interest on loans, which
creates a disincentive for the repair of these risky, leak-prone pipes. Known in MA as Targeted
Infrastructure Replacement Factor programs, or TIRFs, this financing program appears,
anecdotally, to be accelerating line replacement.
Bay State Gas, National Grid, and New England Gas Company collectively replaced just
over 145 miles of leak-prone miles in 2009 as reported by Aubuchon & Hibbard (2013).
According to these researchers from Analysis Group, Inc., the additional funds required to make
these line replacements totaled approximately $9.1 million, which the utilities were able to
charge ratepayers for up front. Below in Table 5 are calculations based on these repairs,
expenditures, and avoided gas leaks reported by Aubuchon and Hibbard:
Table 5
27
Using the above figures and the range of costs per mile of replacement represented
across these three of MA’s eleven local distribution companies (LDC’s), rough estimates of the
cost to replace all remaining miles of cast iron and bare steel pipeline in MA range from about
$176.5 to $717 million; i.e.:
Using MA DPU 2013 data of approximately 6,600 miles of cast iron and bare steel remaining in MA (reduced from 2011’s 7070 miles):
Low range of total replacement costs: 6,600 miles x $26,744 = $176,510,400
High range of total replacement costs: 6,600 x $108,635 = $716,991,000
In an interview, the researcher pointed out that these costs are likely a lower bound
estimate based on the likelihood of expense of replacement increasing incrementally as more
and more pipe is replaced (Aubuchon).
Legislation
Massachusetts Senate Bill 2073 originated as House Bill 3873 authored by State
Representative Lori Ehrlich, who represents the 8th Essex district on MA’s North Shore. The bill
passed through the House and was moved into Senate Ways and Means, chaired by Senator
Stephen Brewer, where the Committee accepted 24 proposed amendments and went to the
Senate floor for debate and vote on April 10, 2014. Approximately one-half of the amendments
were engrossed to the bill, which passed the Senate unanimously in a 38-0 vote. The two
versions of the bill (House and Senate) have been assigned to a Conference Committee made of
several Representatives and Senators whose task will be to hash out the differences and return

28
to the Senate for a new vote on the revised package. (Please see Senate bill 2073 in Appendix
C.) Provisions in the current Senate version of the bill include:
o Development of a uniform calculation and definition for grades1 of gas leaks,
such that:
“Grade 1. A leak that represents an existing or probable hazard to person
or property;
Grade 2. A leak that is recognized as non-hazardous to persons or
property at the time of detection, but justifies scheduled repair based on
probably future hazard;
Grade 3. A leak that is recognized as non-hazardous to person or property
at the time of detection and can be reasonably expected to remain non-
hazardous.”
o A standard timeline for response, continuous monitoring, and mandated
timeline for repair of each of the grades of leak, such that:
“Grade 1 leaks require repair and continuous action until the conditions
are no longer hazardous;
Grade 2 leaks shall be repaired or cleared within 12 months from the
date the leak was classified;
Grade 3 leaks shall be reevaluated during the next scheduled survey , or
within 12 months from the date 1st evaluated, whichever occurs first,
until the leak is eliminated or the main is replaced.
o Required gas pipe inspection beneath any roadway opened for other projects in
order to make simultaneous repairs;
o Elevation of leaks detected within school zones, adjacent to houses of worship,
healthcare and aging care facilities, correctional facilities, rail or subway station,
courthouse or government office to expedite repair schedule;
o Required annual reporting of all leaks detected (grades 1, 2, and 3) and reports
of follow up activities by each utility” (Massachusetts General Court, Senate
Ways and Means Committee, 2014).
Massachusetts Department of Public Utilities Ongoing Study: Quantifying Lost &
Unaccounted for Gas
1 Currently, leaks are “graded” by the utilities based on their likelihood to pose immediate danger or threat of
explosion. There is no federal or statewide standard set for classifying leaks, and utilities are only required to repair “hazardous leaks” according to federal guidelines.
29
Massachusetts DPU is ultimately responsible for the regulation of natural gas and its
infrastructure throughout the Commonwealth of MA. It should be noted that, under this
arrangement, the proposed legislation at the Massachusetts State House, discussed in detail
above, is prescribing regulations that would be proposed, promulgated, carried out, and
enforced by the DPU.
Recognizing that MA has a high percentage of leak prone gas distribution
infrastructure, a representative from MA Executive Office of Energy and Environmental Affairs
stated that, “In July 2013, the DPU hired an independent, third-party consultant to quantify the
amount of gas that is lost and unaccounted for in order to review and identify methods and
procedures to reduce methane emissions” (Buckley, 2013). This study is currently underway,
and is expected to be released in August, 2014. The goals, summarized below, are to review the
reporting requirements from the eleven LDC’s regarding lost and unaccounted for gas to decide
if they are adequate as they stand for evolving reporting needs. A summary of the MA DPU
study is included as Appendix E.
From the publicly-available Request for Quotes distributed at the study’s commissioning,
specific tasks for the report may include:
o “Conducting a mass balance analysis of the fate of gas entering Massachusetts gas
distribution systems in a recent year;
o Recommending methods to increase the accuracy of the reporting of methane
emissions from the natural gas infrastructure by the local gas distribution companies;
o Identifying a reliable method for calculating the amount of lost and unaccounted for
natural gas that escapes from distribution pipelines;
o Recommending policies to promote the reduction of methane emissions and reduce the
costs of lost and unaccounted for gas;

30
o Identifying and preparing preliminary recommendations for possible changes in the
manner in which the DPU obtains information from LDCs;
o Identifying and preparing preliminary recommendations for possible changes in
reporting practices and procedures” (Massachusetts Department of Public Utilities,
2013).
Trees
As detailed above, there is sufficient evidence that methane leaks are affecting soil and tree
health, and that correcting this damage should be considered in recommendations for gas leaks
remediation moving forward.
Here in Massachusetts, Bob Ackley is a teammate of Boston University’s Nathan Phillips’
on urban leaks research, and a 25+ year veteran of detecting leaks for multiple utilities before
heading out on his own to form Gas Safety, Inc. Ackley is also a leader of the Massachusetts
Public Shade Tree Trust. He has done extensive leak detection work in communities across the
Commonwealth, and believes there is proof that fugitive methane emissions are causing up to
$15 million or even $25 million in damages to trees across Massachusetts (Ackley, 2014).
Regarding a pending $1 million law suit against local gas distribution company National
Grid by one community – Brookline, MA – over costs of tree damage and death, spokesman for
the company, David Graves, claims that there is not evidence to support allegations of such
widespread damage to trees from gas leaks. However, Graves notes that, “We work with
communities on individual cases where they believe gas may have damaged a tree,” he says. “If
we can prove gas is responsible, we replace the tree at our cost” (Barlow, 2011).
31
There is legislation filed at the state level in Massachusetts that would require LDCs to
pay back any owner, including private residents and municipalities, for trees damaged or killed
by gas leaking from their pipes. State Representative Lori Ehrlich’s Bill is House Bill 2934 An Act
to Prevent Unnecessary Arboreal Costs Due to Natural Gas Leaks. This bill has not enjoyed the
same level of success as the broader gas leaks bill outlined above, but did garner the support of
a dozen House Members as co-sponsors and had a hearing in June, 2013 before being sent off
to “study” at the Legislature (Ehrlich, 2013).
32
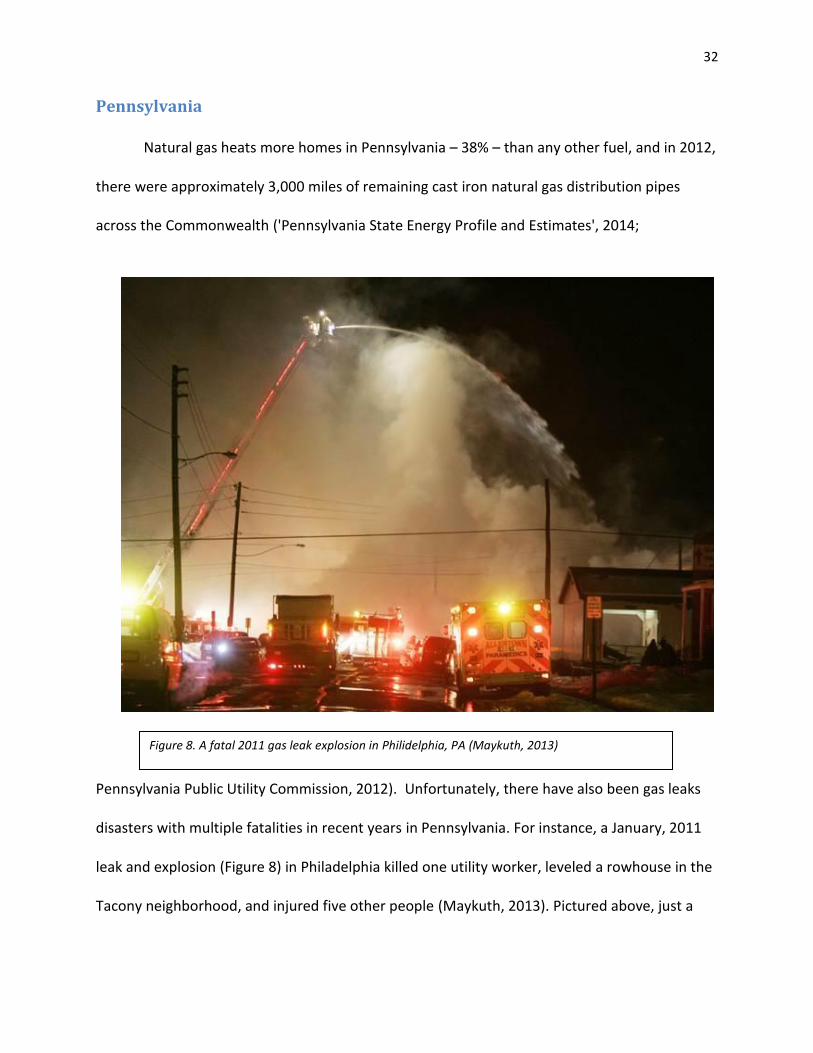
Pennsylvania
Natural gas heats more homes in Pennsylvania – 38% – than any other fuel, and in 2012,
there were approximately 3,000 miles of remaining cast iron natural gas distribution pipes
across the Commonwealth ('Pennsylvania State Energy Profile and Estimates', 2014;
Pennsylvania Public Utility Commission, 2012). Unfortunately, there have also been gas leaks
disasters with multiple fatalities in recent years in Pennsylvania. For instance, a January, 2011
leak and explosion (Figure 8) in Philadelphia killed one utility worker, leveled a rowhouse in the
Tacony neighborhood, and injured five other people (Maykuth, 2013). Pictured above, just a
Figure 8. A fatal 2011 gas leak explosion in Philidelphia, PA (Maykuth, 2013)
33
month later in February of 2011, a massive gas explosion in Allentown flattened two rowhomes
and burned an entire block, killing five people ('5 Dead after Massive PA Gas Blast', 2011).
Additionally, a precedent-setting enforcement action regarding a leaking pipe was
brought against Pennsylvania gas company, UGI Penn Natural Gas Inc., in August, 2013. The
enforcement bureau of the PA Public Utility Commission settled the largest fine against a utility
in PA -- $1 million – for failing to repair a high-pressure, “10-inch-diameter gas main in a busy
commercial area in Wilkes-Barre that was leaking dangerously” (Maykuth, 2013).
In the course of these events, the PA PUC had recognized that across their multiple
Natural Gas Distribution Companies (NGDC’s) there was inconsistency in calculating and
reporting unaccounted-for-gas levels (UFG):
“Unfortunately, the large deviation illustrates that the Commission is not receiving accurate, meaningful, or consistent calculations of UFG levels. In addition, four companies (Columbia, NFG, UGI Utilities, and UGI – Penn Natural) have reported negative UFG in Annual Reports or 1307(f) Filings. A negative UFG percentage indicates a flaw in the measurement, calculation or definition of UFG” (Pennsylvania Public Utility Commission, 2012). This led to PA’s Public Utilities Commission (PUC) developing a joint research team from
their Bureaus of Investigation & Enforcement and Audits to evaluate the impact that the UFG
was having on ratepayers. The report Unaccounted for Gas in the Commonwealth of
Pennsylvania: Joint Report by the Bureau of Investigation and Enforcement and the Bureau of
Audits led to the general conclusions that the PUC “should consider establishing a clear
definition of UFG to eliminate any inconsistencies…[and]… consider establishing specific metrics
to establish and transition to an acceptable level of UFG” (Pennsylvania Public Utility
Commission, 2012).

34
The results of the report facilitated the formation of yet another team from across multiple
bureaus (Law, Office of Special Assistants, Audits, and Technical Utility Services) to explore the
creation of new regulations for UFG. What followed, according to PUC Management Efficiency
Review Supervisor Nathan Paul, was a full rulemaking process with public comment and
response period, a trip for the proposed regulations through PA’s legislative House, and
establishment of a Final Rulemaking Order and new regulations (Paul, 2014). Following is a
summary of the new regulations in PA, adopted April 4, 2013:
The PUC used 66 Pa.C.S. Section 1301 which includes the duty to “ensure that rates remain just and reasonable” to “establish a rebuttable presumption that levels of UFG above certain threshold levels are not just and reasonable expenses and, therefore, not recoverable from consumers.”
The rulemaking and regulations define UFG, establishes the uniform terminology use of UFG and provides for a standardized calculation worksheet for UFG. The brief, 3-page regulations package also contains a metric for distribution system losses which lowers each year what percentage of UFG can be recovered from ratepayers. This begins with a cap at 5% and lowers by one-half percentage point each year to rest at 3% unless a NGDC can provide satisfactory evidence to the PUC to allow cost recovery for UFG at a higher percentage (Pennsylvania Public Utility Commission, 2013).
Explanation for the need for new regulations was provided for in the pre-amble to the
regulation:
“Until now, PUC regulations lacked a uniform definition for UFG. Prior to our establishing a uniform definition of UFG here, each NGDC defined UFG based upon individual company experience. This practice has created inconsistencies that hindered our ability to monitor UFG levels across NGDCs, and to gauge with accuracy the corresponding financial burden UFG imposed on all classes of ratepayers” (Pennsylvania Public Utility Commission, 2013).

35
New York
New York State has approximately 47,880 miles of natural gas distribution pipeline and
over three million service lines running into residence or business buildings. Of these gas
distribution lines, approximately 6,515 miles remain of bare steel, and 4,254 miles of cast or
wrought iron mains, which means that nearly 22.5% of the distribution mains are considered
“leak-prone” by US EPA (Pipeline & Hazardous Materials Safety Administration, 2014). More
than half of New York homes are heated by natural gas, which is in keeping with national
statistics, though NY uses more natural gas to supply household electricity (37.1%) than the
national average of approximately 26% (U.S. Energy Information Administration, 2014).
As mentioned, New York has been in the news for a recent tragedy related to natural
gas leak incidents: On March 12 of this year – 2014 – there was a devastating explosion in
Harlem caused by a 127-year-old leaking cast iron gas pipe. Two buildings were leveled, 8
people lost their lives, and nearly 50 more were injured. Table 6 lists and provides relevant data
on the significant incidences in NY’s gas distribution system as reported by US DOT Pipeline and
Hazardous Materials Safety Administration since 2004. The report does not appear to capture
the very recent (March, 2014) incident. Perhaps this is due to ongoing inspection or
investigation of the suspect lengths of pipeline. (Pipeline & Hazardous Materials Safety
Administration, 2014).

36
Again, while these are perhaps the most visible consequences of failures of infrastructure
and leaks in pipes, they are but one of several. NY’s regulating agencies have long been pursuing
the reductions of fugitive gas emissions and, according to the 2012 Conservation Law
Foundation report Into Thin Air:
“New York is one of the only states that have attempted to tackle this issue through adjustments to the way companies are compensated for [lost and unaccounted for gas] LAUF. The New York Public Service Commission actually establishes an allowed LAUF benchmark during an LDC’s rate case and allows the LDC to recover an incentive for its shareholders if it achieves a lower LAUF than allowed or a penalty that is returned to ratepayers if the company exceeds the allowed LAUF” (Cleveland, 2012).
Table 6

37
This differs from the approach of the new regulations in Pennsylvania, which sets a
percentage cap for which all LDC’s are able to recover costs from ratepayers. By allowing for a
higher cost recovery percentage from some LDC’s than others, the NY law likely creates a
stronger performance incentive than the percentage approach adopted by PA. It also provides
relief to ratepayers who are burdened by overly large fees for LAUF. In fact, the NY program has
resulted in an aggregate net refund of approximately $12 million to NY ratepayers in 2012
(State of New York Department of Public Service, 2012).
The 2013 Staff White Paper on Lost and Unaccounted for (LAUF) Gas, by the New York
State Department of Public Service addressed the issue of standardization of measurements of
LAUF by LDCs. The report noted that utilities use a variety of different methods to calculate
LAUF, which limits the “ability to compare (the LAUFs of) LDC’s” because of the many different
adjustment factors which go into their LAUF calculations (State of New York Department of
Public Service, 2013).The report goes on to state that “The amount of gas metered into the
system and out of the system, based on actual meter reads with the annual reconciliation
period, should be how LAUF is determined.... Basing the LAUF incentive on total metered in and
total metered out is the correct approach.”
Federal
While the amount of pipeline materials which EPA-identifies as most leak-prone remains
disproportionally in a handful of states, there has been growing attention to pipeline safety at
the national level in recent years. This is likely due to the very tragic and shocking nature of
explosions and fires caused nationwide when there are accidents; to the fact that there are

38
many causes of leaks and explosions and can happen anywhere that gas and other combustible
fuels are processed, transported, held, or distributed; and because all of the nation’s
infrastructure ages faster than its components are replaced.
In addition to the nationwide incidents outlined earlier, Senator Ed Markey’s report
details that American consumers paid at least $20 billion from 2000-2011 for lost gas that was
never delivered or used by ratepayers (2013).
The federal government has stepped up activities in the last several years around gas
pipeline safety and education, punctuated by U.S. Department of Transportation Secretary Ray
LaHood’s “Call to Action” in 2011. The requested action was to conduct reviews of gas
distribution pipeline systems, identify high risk pipelines, and rank the most critical pipes as
priorities for repair (U.S. Department of Transportation Office of Public Affairs, 2011).
Adding to tools from the federal government toolbox for gas distribution system
remediation, Senator Ed Markey has also put forward two pieces of legislation:
“The first bill -- the Pipeline Modernization and Consumer Protection Act of 2013 -- would accelerate the repair, rehabilitation, and replacement of natural gas distribution pipelines that are leaking or pose high risks of leaking due to their age, material, or condition. To expedite these upgrades, the bill requires utilities and state regulators to consider adopting policies that prioritize repair timelines to address the leakiest pipes first; cost recovery programs that allow companies to more quickly recover the capital they spend to replace pipelines; and limits on the amount of lost and unaccounted for gas for which utilities can charge consumers.
The second piece of legislation - the Pipeline Revolving Fund and Job Creation Act -- would establish a state revolving loan fund for natural gas pipeline repair and replacement to provide additional tools to states and utilities to address old, leaking pipeline infrastructure. This pipeline revolving fund is modeled on the extremely successful and popular Drinking Water and Clean Water State

39
Revolving Funds. States would identify natural gas pipeline projects and, as with the established state revolving funds, would have to match 20 percent of the federal funds they receive under this program” (Office of Senator Edward
Markey, 2014).
According to an interview with Senior Policy Advisor, Morgan Gray, who contributed
heavily to Senator Markey’s 2013 report, the Senator is especially pleased with the multi-sector
support for his two recent bills working to fix gas leaks (Gray, 2014). A sample list of supporters
includes:
Professional Fire Fighters of Massachusetts, Pipeline Safety Trust, United
Steelworkers, National Grid, BlueGreen Alliance, Conservation Law Foundation,
Consumer Federation of America, Consumers Union, Clean Water Action, New
England Gas Workers Association, Gas Safety USA, Natural Resources Defense
Council, United Association of Plumbers and Pipefitters, Massachusetts Chapter
Sierra Club, American Public Gas Association, and Third Way.
When posed the question about overlap of funding solutions with his State Revolving
Fund loan (SRF) proposal and his urging of support for accelerated repair funding up front for
utilities via their ratemaking authorities, Markey’s senior staff member explained why both are
necessary: Some utilities may be enjoying a generous rate from their consumers, and may not
be willing to open that up for examination before their regulators. Therefore, the prospect of a
low-interest loan for capital investments in their systems may create the impetus those systems
would need for accelerating system remediation.

40
Discussion, Recommendations, & Conclusion
Discussion
Neither of the individual states’ approaches for reducing lost and unaccounted for gas or
gas distribution system disrepair studied here are not identical, nor are they the same as
federal approaches being considered. However, there are commonalities which are valuable to
note, as well as at least one commonly under-addressed concern. First, Massachusetts,
Pennsylvania, New York, and even the federally proposed policy seek to assign a more unified
definition and calculation for leaked gas as a subset of lost gas. By this, they recognize that
reportable levels of gas lost from a distribution system have many causes, and that quantities
actually lost to leaks is but one. Others include theft, meter errors, venting for maintenance
purposes, company use which may not be metered, etc. Greater specificity about the quantity
of gas physically leaking out of old or failed pipes can lead to greater accountability for safety,
repairs, and costs. The Massachusetts’ DPU study, currently underway, represents progress in
the direction that both Pennsylvania and New York have made inasmuch as initiating
consideration of greater standardization for quantifying fugitive gas emissions from the
distribution infrastructure. Following their studies, the recommendations in NY and PA took
divergent paths, and Massachusetts’ eventual set of proposed remediation strategies could
look quite different than either of those, as well.
The under-addressed concern is regarding sheer volume of leaked gas from these
distribution systems. While standardizing characterizations of leaks such as in MA’s proposed

41
legislation may add consistency to utility performance and reporting, it may not accomplish
reductions in the potent greenhouse gas effects of large volumes of leaked gas.
While the costs to ratepayers and the risk of catastrophic explosions already justify
spending to fix leaking distribution pipes in natural gas systems, as state and federal
governments both define and adopt into mainstream calculations the benefits of climate
change mitigation and adaptation practices, the cost-benefit ratio and thus the demand for
more and more drastic action will certainly increase.
However, caution must be taken to protect current ratepayers from bearing the costs of
system expansion for new gas customers in the name of ‘system maintenance.’ Similarly,
caution must be taken for any considered expansion of distribution systems for the reasons of
overreliance on a single fuel as well as the possibility of delivering more and more product into
one end of a pipe, only to be leaking it out as fast along its route. There should be more urgency
and use of technology to fix not only leaks that pose immediate public safety threats, but also
those which are often characterized as “low risk” or “low grade,” but which may be the greatest
volume-losers over time.
Recommendations
Principles for an effective program to reduce gas leaks from distribution systems as part
of lost and unaccounted for gas must recognize that some loss is inevitable while also creating
parameters and incentives for utilities to be responsible for knowledge of leaks on their
systems and accountable to their ratepayers for reducing the product loss. Additionally, volume
of the leaked gas can no longer be ignored, no matter the explosion threat or lack thereof,

42
given emergent science on its potency as a greenhouse gas. Next, cost benefit analyses of
pipeline replacement which seamlessly integrates the additional benefits of reduced
environmental impacts (social cost of carbon, for instance) and savings of a non-renewable
fossil fuel must adopted into ALL calculations. Finally, careful provisions must direct dollars
from ratepayers and other sources which are intended for system repair and upkeep away from
use for system expansion.
Recommendations from other states’ practices and the proposed federal activities that
can help a program in Massachusetts achieve these principles could include a standard
definition and calculation of unaccounted-for-gas which provides for transparent adjustment
factors and rates that might be modeled after Pennsylvania’s 2013 regulations revisions; an
incentive program for increased capture of gas in the distribution system such as New York’s
which provides dividends to shareholders for good performance and penalties for bad; and
access to a pool of resources from which a large sum could be drawn and spent immediately to
begin capturing all of the benefits of pipeline repair right away, such as Senator Markey’s
proposed low-interest State Revolving Fund loan.
Conclusion
It is critical to have U.S. energy infrastructure and resources serve its customers at the
local, regional, national, and global climate scale, so as not lead to great sacrifices in safety,
security, and quality of life at home and abroad at the profit of shareholders and the expense of
ratepayers and consumers. Reducing the leakage of natural gas from old pipes and
infrastructure in states like Massachusetts that are highly dependent upon natural gas and

43
whose infrastructure is no longer adequate is not an option but, rather, an imperative. The cost
of repair and mitigation will be significant; estimated here to be as much or more than $720
million. The recommendations presented here provide a pathway to begin the modernization
of the state’s natural gas infrastructure that will protect ratepayers, incentivize gas companies,
and make Massachusetts safer and more sustainable.
44
Limitations & Questions for Further Research
Some limitations to the research project include that the case study subjects have
changed “behaviors” recently enough so as to make quantifying outcomes difficult or
impossible. This is especially so because reporting, often self-reporting, occurs within multiple
state and federal agencies, and is rarely observable without those agencies acting as conduits of
information, and which often present a time delay.
A question for further research might be to test, through modeling or observation,
whether or not more accurate or standardized calculations of LAUF gas correlates with reducing
the loss, and with reducing leaks, specifically. A further question is one that is currently being
examined, and is: what part does distribution system leaks and loss play in the life cycle analysis
of the true carbon costs and environmental impacts of using natural gas as a fuel for the U.S.?

45
References
5 Dead after Massive PA Gas Blast. (2011). Retrieved from http://www.nbcnews.com/id/41503700/ns/us_news-life/t/dead-after-massive-pa-gas-blast/#.U1Lgj_ldWSp
40 C.F.R. Part 98, Subpart W, Revision to Petroleum and Natural Gas Systems. Retrieved from http://www.epa.gov/ghgreporting/documents/pdf/2012/training/Subpart-W-update.pdf
Ackley, B. (2014). Natural Gas Leaks Reduction Strategies. Interview. Framingham, MA. Alvarez, R., Pacala, S., Winebrake, J., Chameides, W., & Hamburg, S. (2012). Greater focus
needed on methane leakage from natural gas infrastructure. Proceedings of the National Academy of Sciences of the United States of America, 109, 6435-6440.
American Council for an Energy-Efficient Economy. (2013). Massachusetts Most Energy-Efficient
State in 2013 with California Close Behind at #2, Mississippi is Most Improved. [press release] November 6, 2013.
Aubuchon, C. (2014) Interview on Analysis Group, Inc., report Summary of Quantifiable Benefits
and Costs Related to Select Targeted Infrastructure Replacement Programs . Email. Aubuchon, C. & Hibbard, P. (2013). Summary of Quantifiable Benefits and Costs Related to
Select Targeted Infrastructure Replacement Programs. [report] Boston: Analysis Group.Barlow, R. (2011). Natural Gas Leaks Fuel Global Warming, Not Homes. Bostonia, (Fall 2011).
Bourne, Christopher. 2011. Letter on behalf of The Commonwealth of Massachusetts’
Department of Public Utilities to the U.S. Department of Transportation Pipeline and Hazardous Materials Safety Administration. Retrieved from https://opsweb.phmsa.dot.gov/pipelineforum/docs/letters/DPU%20Response%20Letter%20PHMSA%20Administrator%20-%204-12-11.pdf
Bylin, C., Cassab, L., Cazarin, A., Ori, D., Robinson, D., & Sechler, D. (2009). New Measurement
Data Has Implications for Quantifying Natural Gas Losses From Cast Iron Distribution Mains. Pipeline & Gas Journal, 236(9), Retrieved from http://pgjonline.com/new-measurement-data-has-implications-quantifying-natural-gas-losses-cast-iron-distribution-mains
Buckley, P.P. (2013, August 22). Natural Gas Leaks Cost Central Massachusetts Consumers Millions. Go Local Worcester. Retrieved from www.golocalworcester.com

46
Cleveland, Shanna. 2012. Into Thin Air: How Leaking Natural Gas Infrastructure is Harming our
Environment and Wasting a Valuable Resource.
Department of Public Utilities (DPU). (2014). Energy and Environmental Affairs. Retrieved 20 February 2014, from http://www.mass.gov/eea/grants-and-tech-assistance/guidance-technical-assistance/agencies-and-divisions/dpu/
Ehrlich, Lori. (2013). An Act to Prevent Unnecessary Arboreal Costs Due to Natural Gas Leaks.
Boston: Massachusetts Legislature. Environmental Defense Fund. (2014). Climate risks of methane. In How much methane is lost
into the air? Retrieved from http://www.edf.org/climate/methane-studies
Environmental Defense Fund. (2014, February 28). Methane Reduction [Video file]. Retrieved from http://www.youtube.com/watch?v=jSkjXosaQbw
Gray, M. (2014). Senator Ed Markey's Staff Talks Natural Gas Leaks Reduction Strategies. Telephone.
Hoeks, J. (1972). Changes in Composition of Soil Air Near Leaks in Natural Gas Mains. Soil
Science, 113(1), 46-54.
Joyce, C. (2011). Boston's Leaky Gas Lines May Be Tough On the Trees. Retrieved from http://www.npr.org/2011/11/21/142504812/bostons-leaky-gas-lines-may-be-tough-on-the-trees
Massachusetts Department of Public Utilities. (2013). Request for Quotes; State Contract PRF46.
Boston: MA DPU.
Massachusetts General Court, Senate Ways and Means Committee. (2014). Senate Bill 2073 An Act Relative to Natural Gas Leaks. Boston: Massachusetts Legislature.Maykuth, A. 2013). PWG Fined $500,000 for 2011 Fatal Gas Explosion. Philadelphia Inquirer. Retrieved from http://articles.philly.com/2013-07-18/news/40659227_1_pgw-employee-pgw-largest-municipal-gas-utility
New England Gas Workers Association. (2010). Natural Gas Safety/Service Related Issues in
Massachusetts. Boston: NEGWA. Office of Senator Edward J. Markey. (2013). America Pays for Gas Leaks. United States Senate.
Office of Senator Edward Markey. (2014). Markey Urges Consideration of Natural Gas Leaks Legislation.

47
Paul, N. (2014). Interview on Pennsylvania's New Natural Gas Leaks Regulations. Telephone.
Pennsylvania Public Utility Commission. (2013). Annex A. Title 52. Part I. Subpart C. Fixed Service Utilities Chapter 59. Gas Service. Unaccounted-for-Gas. Harrisburg.
Pennsylvania Public Utility Commission. 2012. Letter on behalf of Pennsylvania’s Public Utility
Commission to the U.S. Department of Transportation Pipeline and Hazardous Materials Administration. Retrieved from https://opsweb.phmsa.dot.gov/pipelineforum/docs/letters/Pennsylvania%20PUC%20Aug%207%202012.PDF
Pennsylvania Public Utility Commission. (2013). Rulemaking Re: Establishing a Uniform
Definition and Metrics for Unaccounted-for-Gas: Final Rulemaking Order. Harrisburg.
Pennsylvania Public Utility Commission, Bureau of Investigation and Enforcement and the Bureau of Audits. (2012, February). Unaccounted-for-Gas In the Commonwealth of Pennsylvania: Joint Report by the Bureau of Investigation and Enforcement and the Bureau of Audits. Retrieved from http://www.puc.state.pa.us/transport/gassafe/pdf/UFG_Report_Feb2012.pdf
Pennsylvania State Energy Profile and Estimates. (2014). Eia.gov. Retrieved 4 April 2014, from
http://www.eia.gov/state/?sid=PA#tabs-5 Phillips NG, R Ackley, ER Crosson, A Down, LR Hutyra, M Brondfield, JD Karr, K Zhao, RB Jackson.
2013. Mapping urban pipeline leaks: methane leaks across Boston. Environmental Pollution 173:1-4.
Pipeline and Hazardous Materials Safety Administration. (2014). Natural gas pipelines. Retrieved from http://www.phmsa.dot.gov/pipeline/naturalgas
Pipeline and Hazardous Materials Safety Administration. (2014) Pipeline Safety Stakeholder
Communications: Massachusetts Incident and Mileage Overview. Retrieved from http://primis.phmsa.dot.gov/comm/reports/safety/MA_detail1.html?nocache=6495#_OuterPanel_tab_1
Pipeline & Hazardous Materials Safety Administration. (2014) Pipeline Safety Stakeholder Communications: New York Incident and Milage Overview. U.S. Department of Pipeline & Hazardous Materials Safety Administration. Retrieved from http://primis.phmsa.dot.gov/comm/reports/safety/NY_detail1.html?nocache=8113
Pipeline and Hazardous Materials Safety Administration. Part 192 – Transportation of natural
and other gas by pipeline: minimum federal safety standards. Retrieved from http://phmsadotc.sabanow.net/prodcontent/cninv000000000001082/vspA.htm

48
Sargent, W. (2013). Testimony before Massachusetts Committee on Telecommunications,
Utilities, and Energy. Presentation, Massachusetts State House, Boston. State of New York Department of Public Service. (2012). CASE 12-G-0437 -- In the Matter of the
Filing of Reconciliation of Gas Expenses and Gas Cost Recoveries. State of New York Department of Public Service. Retrieved from file:///C:/Users/crs39/Downloads/%7BB04D162A-0F84-4C8C-B056-573D9B68A008%7D.pdf
State of New York Department of Public Service. (2013). Staff White Paper on Lost and Unaccounted for (LAUF) Gas. State of New York Department of Public Service.
Sullivan, R. (2013, June 11). Testimony before the Joint Committee on Telecommunications,
Utilities, and Energy. Statement at the Massachusetts State House, Boston, MA. United States Department of Transportation Office of Public Affairs. (2011). U.S Transportation
Secretary Ray LaHood Announces Pipeline Safety Action Plan. United States Department of Transportation Pipeline and Hazardous Materials Administration.
(n.d.). Cast Iron Pipeline R&D Projects. Washington, D.C.: PHMSA. United States Energy Information Administration. (2014). New York State Energy Profile. U.S EIA.Retrieved from http://www.eia.gov/state/print.cfm?sid=NY United States Energy Information Administration. Eia.gov. (2014). Electricity Monthly Update.
[online] Retrieved from: http://www.eia.gov/electricity/monthly/update/print_version.cfm [Accessed: 16 Apr 2014].
United States Environmental Protection Agency. (2014). Draft inventory of U.S. Greenhouse Gas
Emissions and Sinks: 1990-2012 (EPA draft). Retrieved from U.S. Environmental Protection Agency: http://www.epa.gov/climatechange/Downloads/ghgemissions/US-GHG-Inventory-2014-Chapter-Upfront.pdf
United States Environmental Protection Agency. (2014). Overview of Greenhouse Gases. In
Methane Emissions. Retrieved from http://epa.gov/climatechange/ghgemissions/gases/ch4.html

49
Appendices
Appendix A
Natural Gas Leaks Reduction Strategy Questions
1. What is the organization for which you work, and what is your role?
2. How do your organization and your position interact with natural gas distribution activities?
3. Do you believe that there is a problem with the rate of leakage or of lost and unaccounted for
gas in this system?
4. For approximately how long have you held the belief that there is or is not a problem with these
rates?
5. Do you have a professional role in working towards reducing fugitive gas emissions? If so, please
describe that role and its origin and motivation.
6. Do you believe that current approaches to limiting gas loss via the distribution system with
which you are familiar are sufficient?
a. Can you give, or point me to, an accounting of the success of these approaches,
quantitatively or qualitatively? (For example, percent reduction of fugitive emissions or
reduction in total.)
b. What, in your opinion or estimation, might be weaknesses or shortcomings of the
approach?
7. Have you heard of or observed systems other than yours which you believe to be doing an
effective job of limiting, or working to limit, gas leaks from their distribution system?
a. If so, please explain your observations.
b. Might these approaches be duplicated or mimicked in whole or in part in other systems
to help achieve reductions in gas loss?
8. My goal is to seek out and understand best practices for reducing gas leaks from distribution
systems, and to draft recommendations for Massachusetts to further reduce our lost and
unaccounted for rates. What other questions should I be asking, in your opinion? Whom else
should I request to speak with, or what written materials do you recommend I include in my
analysis?
50
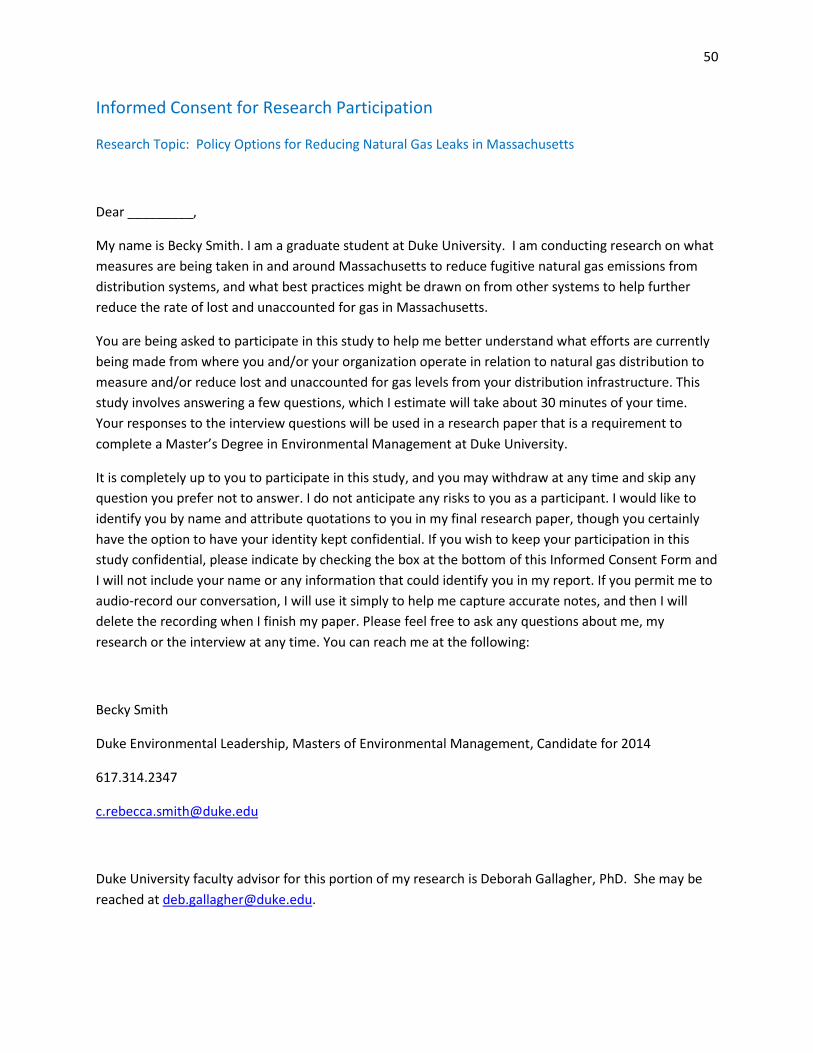
Informed Consent for Research Participation
Research Topic: Policy Options for Reducing Natural Gas Leaks in Massachusetts
Dear _________,
My name is Becky Smith. I am a graduate student at Duke University. I am conducting research on what
measures are being taken in and around Massachusetts to reduce fugitive natural gas emissions from
distribution systems, and what best practices might be drawn on from other systems to help further
reduce the rate of lost and unaccounted for gas in Massachusetts.
You are being asked to participate in this study to help me better understand what efforts are currently
being made from where you and/or your organization operate in relation to natural gas distribution to
measure and/or reduce lost and unaccounted for gas levels from your distribution infrastructure. This
study involves answering a few questions, which I estimate will take about 30 minutes of your time.
Your responses to the interview questions will be used in a research paper that is a requirement to
complete a Master’s Degree in Environmental Management at Duke University.
It is completely up to you to participate in this study, and you may withdraw at any time and skip any
question you prefer not to answer. I do not anticipate any risks to you as a participant. I would like to
identify you by name and attribute quotations to you in my final research paper, though you certainly
have the option to have your identity kept confidential. If you wish to keep your participation in this
study confidential, please indicate by checking the box at the bottom of this Informed Consent Form and
I will not include your name or any information that could identify you in my report. If you permit me to
audio-record our conversation, I will use it simply to help me capture accurate notes, and then I will
delete the recording when I finish my paper. Please feel free to ask any questions about me, my
research or the interview at any time. You can reach me at the following:
Becky Smith
Duke Environmental Leadership, Masters of Environmental Management, Candidate for 2014
617.314.2347
Duke University faculty advisor for this portion of my research is Deborah Gallagher, PhD. She may be
reached at [email protected].

51
If you have any questions about your rights as a participant in this research, please contact the Duke
University Institutional Review Board at [email protected] or 919-684-3030.
Participant Signature_____________________________________Date_____________________
Printed Name of Participant_________________________________________________________
I would like to identify you by name and attribute quotations to you in my final research paper. Check
here if you wish to keep your identifying information confidential.
*Please keep a copy of this consent form for your personal records.
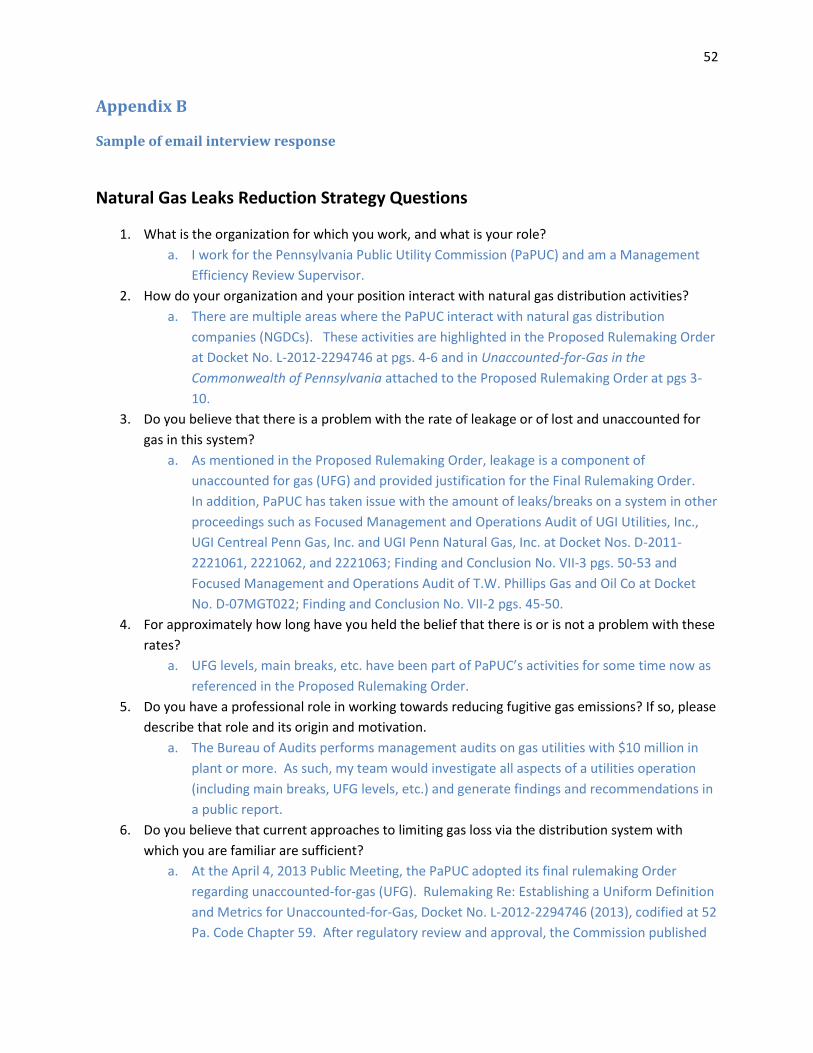
52
Appendix B
Sample of email interview response
Natural Gas Leaks Reduction Strategy Questions
1. What is the organization for which you work, and what is your role?
a. I work for the Pennsylvania Public Utility Commission (PaPUC) and am a Management
Efficiency Review Supervisor.
2. How do your organization and your position interact with natural gas distribution activities?
a. There are multiple areas where the PaPUC interact with natural gas distribution
companies (NGDCs). These activities are highlighted in the Proposed Rulemaking Order
at Docket No. L-2012-2294746 at pgs. 4-6 and in Unaccounted-for-Gas in the
Commonwealth of Pennsylvania attached to the Proposed Rulemaking Order at pgs 3-
10.
3. Do you believe that there is a problem with the rate of leakage or of lost and unaccounted for
gas in this system?
a. As mentioned in the Proposed Rulemaking Order, leakage is a component of
unaccounted for gas (UFG) and provided justification for the Final Rulemaking Order.
In addition, PaPUC has taken issue with the amount of leaks/breaks on a system in other
proceedings such as Focused Management and Operations Audit of UGI Utilities, Inc.,
UGI Centreal Penn Gas, Inc. and UGI Penn Natural Gas, Inc. at Docket Nos. D-2011-
2221061, 2221062, and 2221063; Finding and Conclusion No. VII-3 pgs. 50-53 and
Focused Management and Operations Audit of T.W. Phillips Gas and Oil Co at Docket
No. D-07MGT022; Finding and Conclusion No. VII-2 pgs. 45-50.
4. For approximately how long have you held the belief that there is or is not a problem with these
rates?
a. UFG levels, main breaks, etc. have been part of PaPUC’s activities for some time now as
referenced in the Proposed Rulemaking Order.
5. Do you have a professional role in working towards reducing fugitive gas emissions? If so, please
describe that role and its origin and motivation.
a. The Bureau of Audits performs management audits on gas utilities with $10 million in
plant or more. As such, my team would investigate all aspects of a utilities operation
(including main breaks, UFG levels, etc.) and generate findings and recommendations in
a public report.
6. Do you believe that current approaches to limiting gas loss via the distribution system with
which you are familiar are sufficient?
a. At the April 4, 2013 Public Meeting, the PaPUC adopted its final rulemaking Order
regarding unaccounted-for-gas (UFG). Rulemaking Re: Establishing a Uniform Definition
and Metrics for Unaccounted-for-Gas, Docket No. L-2012-2294746 (2013), codified at 52
Pa. Code Chapter 59. After regulatory review and approval, the Commission published
53
the Final Rulemaking in the Pennsylvania Bulletin on August 10, 2013. 43 PA.B. 4586.
The regulations are now in effect.
7. Can you give, or point me to, an accounting of the success of these approaches, quantitatively or
qualitatively? (For example, percent reduction of fugitive emissions or reduction in total.)
a. As the Final Rulemaking Order became effective in August 2013 and had a one year
grace period, the PaPUC has not recorded any results of the Final Rulemaking Order.
8. What, in your opinion or estimation, might be weaknesses or shortcomings of the approach?
a. Not applicable
9. Have you heard of or observed systems other than yours which you believe to be doing an
effective job of limiting, or working to limit, gas leaks from their distribution system?
i. Gas leaks are the result of various activities/programs by a natural gas utility as
mentioned on page 11 of the Unaccounted-for-Gas in the Commonwealth of
Pennsylvania attached to the Proposed Rulemaking.
b. If so, please explain your observations.
c. Might these approaches be duplicated or mimicked in whole or in part in other systems
to help achieve reductions in gas loss?
i. See the Final Rulemaking Order for some discussion on this concept, particularly
pgs. 11-19.
10. My goal is to seek out and understand best practices for reducing gas leaks from distribution
systems, and to draft recommendations for Massachusetts to further reduce our lost and
unaccounted for rates. What other questions should I be asking, in your opinion? Whom else
should I request to speak with, or what written materials do you recommend I include in my
analysis?
54
Appendix C
Massachusetts Gas Leaks Bill: Senate Bill 2073
SENATE . . . . . . . . . . . . . . No. 2073
The Commonwealth of Massachusetts
_______________
In the Year Two Thousand Fourteen _______________
SECTION 1. Section 105A of chapter 164 of the General Laws, as appearing in the
2012 Official Edition, is hereby amended by striking out the second paragraph and inserting in
place thereof the following paragraph:-
Any person, firm or corporation who violates any provision of any code adopted by the
department pertaining to the safety of pipeline facilities and the transportation of gas, or any
regulation or rule thereunder, at a time when the department has submitted and has in effect the
annual certification to the United States Secretary of Transportation provided for in 49 U.S.C. §
60105 shall be subject to civil penalties as specified in 49 U.S.C. § 60122(a)(1) or any successor
statute enacted into federal law for the same purposes as said § 60122(a)(1).
SECTION 2. Said chapter 164 of the General Laws is hereby further amended by
adding the following 2 sections:-
Section 144. (a) There shall be uniform natural gas leak classification standards in the
commonwealth for all natural gas companies.
(b) Gas companies shall access a grade to all reported gas leaks based on the following
system:
(1) Grade 1. A leak that represents an existing or probable hazard to persons or property.
Grade 1 leaks require repair and continuous action until the conditions are no longer hazardous.
The gas company shall immediately schedule a completion of repairs and the condition shall be
kept under continuous surveillance until the hazard or source of the leak is eliminated. A gas
company shall immediately notify the fire department and chief law enforcement officer in each
city or town where a Grade 1 leak is identified.
(2) Grade 2. A leak that is recognized as non-hazardous to persons or property at the
time of detection, but justifies scheduled repair based on probable future hazard. Grade 2 leaks
The gas company shall be repair or clear Grade 2 leaks within 12 months from the date the leak
was classified. All Grade 2 leaks shall be reevaluated by a gas company at least once every 6
months until eliminated; provided, however, that the frequency of reevaluation shall be

55
determined by the location and magnitude of the leakage condition.
(3) Grade 3. A leak that is recognized as non-hazardous to persons or property at the
time of detection and can be reasonably expected to remain non-hazardous. The gas company
shall reevaluate Grade 3 leaks during the next scheduled survey, or within 12 months from the
date last evaluated, whichever occurs first, until the leak is eliminated or the main is replaced. A
municipal or state public safety official may request a reevaluation of a Grade 3 leak prior to the
next scheduled survey, or sooner than 12 months of the date last evaluated, if the official
reasonably believes the Grade 3 leak poses a threat to public safety.
(c) Upon the undertaking of a significant project involving the repair or paving of a
public way exposing confirmed natural gas infrastructure, a municipality or the commonwealth
shall submit written notification of the project to a gas company. The gas company shall survey
the project area for the presence of Grade 1 or Grade 2 leaks and set repair and replacement
schedules for any known or newly detected Grade 1 or Grade 2 leaks. The gas company shall
ensure that any shut off valve in the project area has a gate box installed upon it and that the shut
off valve is operational and accessible. A gas company may repair any known or newly detected
Grade 3 leaks at its discretion or after consultation with the municipality or the commonwealth.
The repair and replacement schedule of Grade 1 and Grade 2 leaks shall be provided to the
municipality or the commonwealth and shall include a notification of the presence of any Grade
3 leaks that were detected during the survey.
(d) Gas companies shall prioritize any pipeline repairs required under this section for
gas leaks detected within a school zone. For the purposes of this section, the term “school zone”
shall mean on or within 50 feet of the real property comprising a public or private accredited
preschool, accredited Head Start facility, elementary, vocational or secondary school.
(e) As part of the annual service quality standards report required by section 1I, each gas
company shall report to the department the location of each Grade 1, Grade 2 and Grade 3 leak
existing as of the date of the report, the date each Grade 1, Grade 2 and Grade 3 leak was
classified and the dates of repairs performed on each Grade 1, Grade 2 and Grade 3 leak. A gas
company shall specify any reclassification of previously identified leaks in its annual report. Gas
leak information shall be made available to any municipal or state public safety official upon
written request.
(f) The department shall promulgate regulations necessary to implement the uniform
natural gas leak classification standards as specified in this section and shall oversee and monitor
company response and reporting; provided, however, that the regulations shall prevent a gas
company from downgrading a Grade 1 or Grade 2 leak unless the leak is repaired.
Section 145. (a) For the purposes of this section, the following words shall, unless
context clearly requires otherwise, have the following meanings:-
“Customer”, a retail natural gas customer.
“Eligible infrastructure replacement”, a replacement or an improvement of existing
56
infrastructure of a gas company that: (i) is made on or after January 1, 2015; (ii) is designed to
improve public safety or infrastructure reliability; (iii) does not increase the revenue of a gas
company by connecting an improvement for a principal purpose of serving new customers; (iv)
reduces, or has the potential to reduce, lost and unaccounted for natural gas losses through a
reduction in natural gas system leaks; and (v) is not included in the current rate base of the gas
company as determined in the gas company’s most recent rate proceeding or is not included in
any other targeted infrastructure replacement program previously approved by the department.
“Plan”, a targeted infrastructure replacement program construction plan that a gas
company files under subsection (b).
“Project”, an eligible infrastructure replacement project proposed by a gas company in a
plan filed under this section.
(b) A gas company may file with the department a targeted infrastructure replacement
program construction plan to address aging or leaking natural gas infrastructure within the
commonwealth in the interest of public safety and reducing lost and unaccounted for gas through
a reduction in natural gas system leaks.
(c) Any plan filed with the department shall include, but not be limited to: (i) eligible
infrastructure replacement of mains, services, meter sets and other ancillary facilities composed
of non-cathodically protected steel, cast iron and wrought iron, prioritized to implement the
federal gas distribution pipeline integrity management plan annually submitted to the department
and consistent with subpart P of 49 C.F.R. part 192; (ii) an anticipated timeline for the
completion of each project; (iii) the estimated cost of each project; (iv) rate change requests; (v)
a description of customer costs and benefits under the plan; and (vi) any other information the
department considers necessary to evaluate the plan.
(d) Provided that a gas company files a plan on or before October 31 for the subsequent
construction year, the department shall review the plan within 6 months. The plan shall be
effective as of the date of filing, pending department review. The department may modify a plan
prior to approval at the request of a gas company or make other modifications to a plan as a
condition for approval. The department shall consider the costs and benefits of the plan,
including, but not limited to, impacts on ratepayers, reductions of lost and unaccounted for gas
through a reduction in natural gas system leaks and improvements to public safety. The
department shall give priority to plans narrowly tailored to addressing leak-prone infrastructure
most immediately in need of replacement.
(e) If a plan is in compliance with this section and the department determines the plan to
reasonably accelerate eligible infrastructure replacement and provide benefits, the department
shall issue preliminary acceptance of the plan, in whole or in part. A gas company shall then be
permitted to begin recovery of the estimated costs of projects included in the plan beginning on
May 1 of the year following the initial filing and collect any revenue requirement, including
depreciation, property taxes and return associated with the plan.
(f) On or before May 1 of each year, a gas company shall file final project

57
documentation to demonstrate substantial compliance with the plan approved under subsection
(e) and that project costs were reasonably and prudently incurred. The department shall
investigate project costs within 6 months of submission and shall approve and reconcile the
authorized rate factor, if necessary, upon a determination that the costs were reasonable and
prudent. Annual changes in the revenue requirement eligible for recovery shall not exceed 1.5
per cent of the gas company’s most recent calendar year total firm revenues, including gas
revenues attributable to sales and transportation customers. Any revenue requirement approved
by the department in excess of the 1.5 per cent total firm revenue cap may be deferred for
recovery in the following year.
(g) All rate change requests made to the department pursuant to an approved plan shall
be filed annually on a fully reconciling basis. A gas company shall file reconciliation adjustment
rates, which shall be subject to investigation by the department under subsection (f) to determine
whether the company has over-collected or under-collected its requested rate adjustment. The
reconciliation adjustment rates shall become effective pursuant to department order pending the
investigation pursuant to said subsection (f). If the department determines that any of the costs
were not reasonably or prudently incurred, or were not in compliance with the approved plan, the
department shall disallow the costs and shall direct the gas company to refund the full value of
the costs charged to customers in the next reconciliation filing with the appropriate carrying
charges on the over-collected amounts.
(h) The department shall promulgate rules and regulations under this section, which
shall include a procedure that discontinues the replacement program and allows a gas company
to refund any costs charged to customers due to failure to substantially comply with a plan or
failure to reasonably and prudently manage project costs.
SECTION 3. On or before January 1, 2015, the department of public utilities shall
authorize gas companies to design and offer programs to customers which increase the
availability, affordability and feasibility of natural gas service for new customers.
(a) As part of the department’s approval of a program and prior to implementation of a
program, the department shall: (i) review each gas company’s determination that a main or
service extension is economically feasible; (ii) review each gas company’s contribution in aid of
construction policy and methodology; and (iii) consider alternative rate mechanisms or company
project review methodology that facilitate access to natural gas service for new customers,
including, but not limited to, (1) new service-territory-wide surcharges to aid in the financing of
gas service expansion to new off-main customers; (2) new area surcharges applicable only to
zones of new off-main customers to aid in the financing of gas service expansion to new off-
main customers; or (3) both; provided, however, that natural gas distribution system expansion
surcharges shall not unreasonably burden existing customers. Guidelines established under this
subsection shall outline the department’s methods and procedures for reviewing proposals,
including factors the department shall consider for program or policy approval.
(b) Gas companies may petition the department independently, or in coordination with
the department of energy resources, to approve: (i) financing programs for customer natural gas
conversion costs repaid on participating customer bills; (ii) other financing programs developed
58
by a gas company; or (iii) other cost effective programs that reasonably accelerate the expansion
of and conversion to natural gas usage in the commonwealth; provided, however, that the
programs do not unreasonably burden existing natural gas customers.
(c) The department shall issue a decision on gas company expansion programs filed
with the department pursuant to this section within 8 months of the filing date. Gas companies
shall file appropriate tariff changes and otherwise implement any gas expansion programs or
policies approved under this section.
(d) The department shall consider programs that are likely to accelerate the conversion
or expansion to natural gas usage for low-income consumers currently eligible for the federal
Low Income Home Energy Assistance Program, 42 U.S.C. § 8621 et seq., including programs
that exempt new residential low-income heating customers from any new area surcharge
developed under this section. Notwithstanding subsection (b), the department may approve
alternative methods of cost recovery by a gas company for low-income programs, policies or
exemptions including impacts on uncollectible costs.
SECTION 4. Notwithstanding any general or special law to the contrary, the
department of public utilities shall open an investigation into gas operator compliance with the
directives set forth in its Order D.T.E.\D.P.U. 06-48-A. The department shall complete its
investigation and submit its findings to the clerks of the house of representatives and the senate
and the house and senate chairs of the joint committee on telecommunications, utilities and
energy not later than June 1, 2015.
SECTION 5. Notwithstanding any general or special law to the contrary, the
department of public utilities shall, after determination by a gas company or a local or state
public safety official that a gas leak has caused an explosion, issue written findings as to why an
investigation is or is not necessary to determine the cause of the explosion.
SECTION 6. Notwithstanding any general or special law to the contrary, the secretary
of public safety and security or a designee shall issue a report on the adequacy of state
regulations governing the safety standards for utility transformer vaults located within buildings
subject to the state building code. The report shall include, but not necessarily be limited to, an
analysis of the standards for access, structural integrity, ventilation and lighting requirements of
the regulations and the inspection and enforcement requirements, if any, of the regulations. The
report shall further address structural limitations of older buildings containing utility transformer
vaults, any ancillary costs, including the cost of inspections and possible costs to businesses and
municipalities to comply with any proposed new regulations, and any recommendations for
legislation necessary to further implement minimum safety standards for utility transformer
vaults. The report, together with any proposed regulations or legislation necessary to carry out
the recommendations, shall be submitted to the clerks of the house of representatives and the
senate not later than November 15, 2014.
SECTION 7. The department shall investigate whether it should require the winter
surveillance and patrol of cast iron gas pipelines in the commonwealth and shall determine
whether the presence of extended frost cap conditions may result in additional stress on cast iron
59
pipe segments, requiring enhanced surveillance and patrol. The department may establish
minimum uniform procedures for cast iron winter surveillance and patrols consistent with any
federally mandated standards for integrity management programs for distribution pipelines. Gas
companies may establish procedures that exceed any minimum standards, subject to applicable
filing requirements with the department.
SECTION 8. Section 145 of chapter 164 of the General Laws shall take effect on
October 1, 2014.
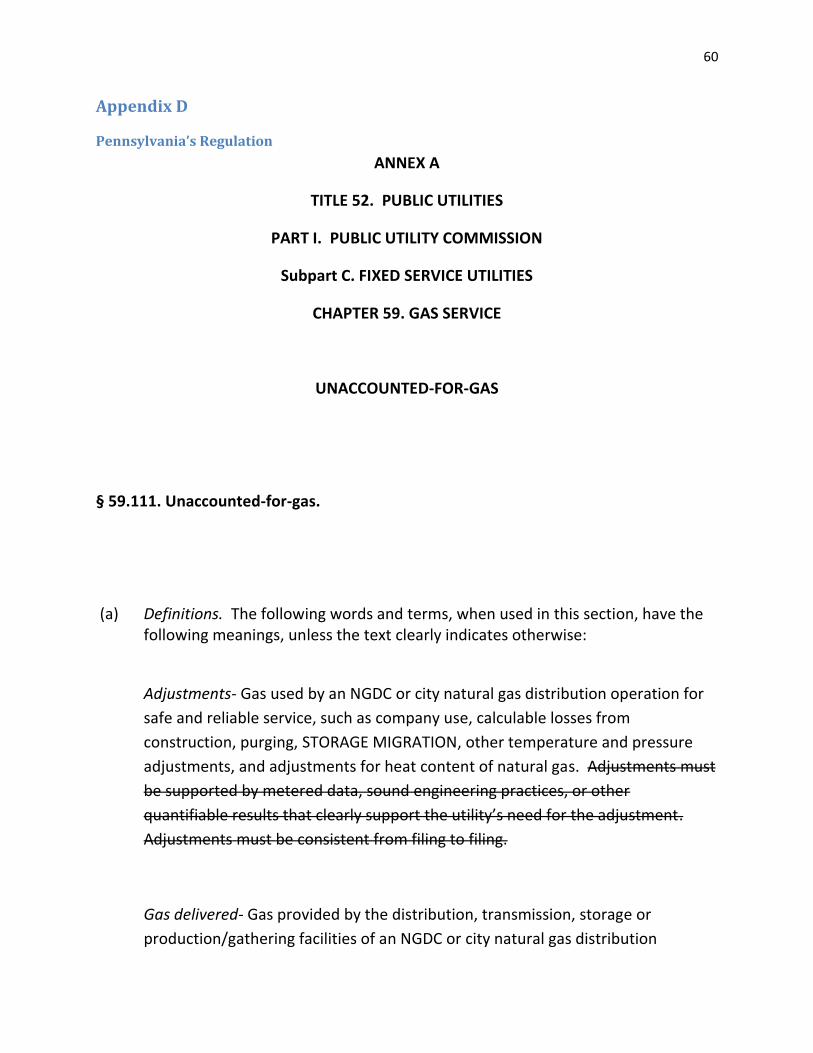
60
Appendix D
Pennsylvania’s Regulation
ANNEX A
TITLE 52. PUBLIC UTILITIES
PART I. PUBLIC UTILITY COMMISSION
Subpart C. FIXED SERVICE UTILITIES
CHAPTER 59. GAS SERVICE
UNACCOUNTED-FOR-GAS
§ 59.111. Unaccounted-for-gas.
(a) Definitions. The following words and terms, when used in this section, have the following meanings, unless the text clearly indicates otherwise:
Adjustments- Gas used by an NGDC or city natural gas distribution operation for
safe and reliable service, such as company use, calculable losses from
construction, purging, STORAGE MIGRATION, other temperature and pressure
adjustments, and adjustments for heat content of natural gas. Adjustments must
be supported by metered data, sound engineering practices, or other
quantifiable results that clearly support the utility’s need for the adjustment.
Adjustments must be consistent from filing to filing.
Gas delivered- Gas provided by the distribution, transmission, storage or
production/gathering facilities of an NGDC or city natural gas distribution
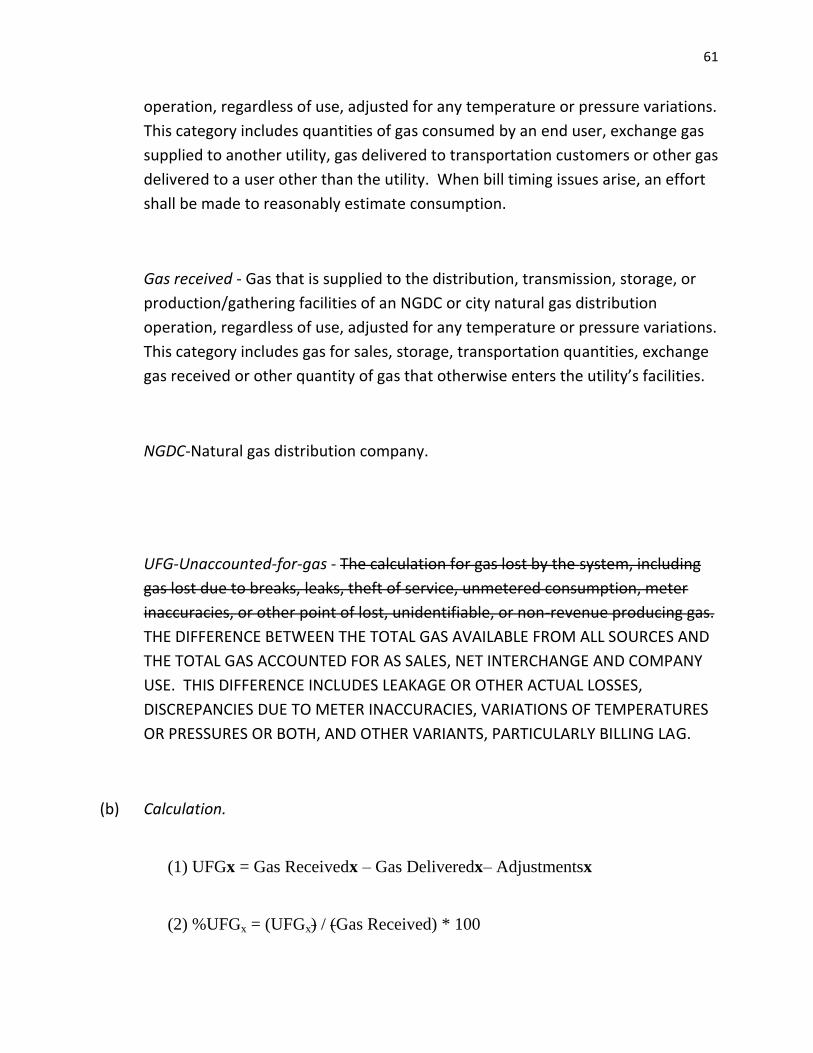
61
operation, regardless of use, adjusted for any temperature or pressure variations.
This category includes quantities of gas consumed by an end user, exchange gas
supplied to another utility, gas delivered to transportation customers or other gas
delivered to a user other than the utility. When bill timing issues arise, an effort
shall be made to reasonably estimate consumption.
Gas received - Gas that is supplied to the distribution, transmission, storage, or
production/gathering facilities of an NGDC or city natural gas distribution
operation, regardless of use, adjusted for any temperature or pressure variations.
This category includes gas for sales, storage, transportation quantities, exchange
gas received or other quantity of gas that otherwise enters the utility’s facilities.
NGDC-Natural gas distribution company.
UFG-Unaccounted-for-gas - The calculation for gas lost by the system, including
gas lost due to breaks, leaks, theft of service, unmetered consumption, meter
inaccuracies, or other point of lost, unidentifiable, or non-revenue producing gas.
THE DIFFERENCE BETWEEN THE TOTAL GAS AVAILABLE FROM ALL SOURCES AND
THE TOTAL GAS ACCOUNTED FOR AS SALES, NET INTERCHANGE AND COMPANY
USE. THIS DIFFERENCE INCLUDES LEAKAGE OR OTHER ACTUAL LOSSES,
DISCREPANCIES DUE TO METER INACCURACIES, VARIATIONS OF TEMPERATURES
OR PRESSURES OR BOTH, AND OTHER VARIANTS, PARTICULARLY BILLING LAG.
(b) Calculation.
(1) UFGx = Gas Receivedx – Gas Deliveredx– Adjustmentsx
(2) %UFGx = (UFGx) / (Gas Received) * 100
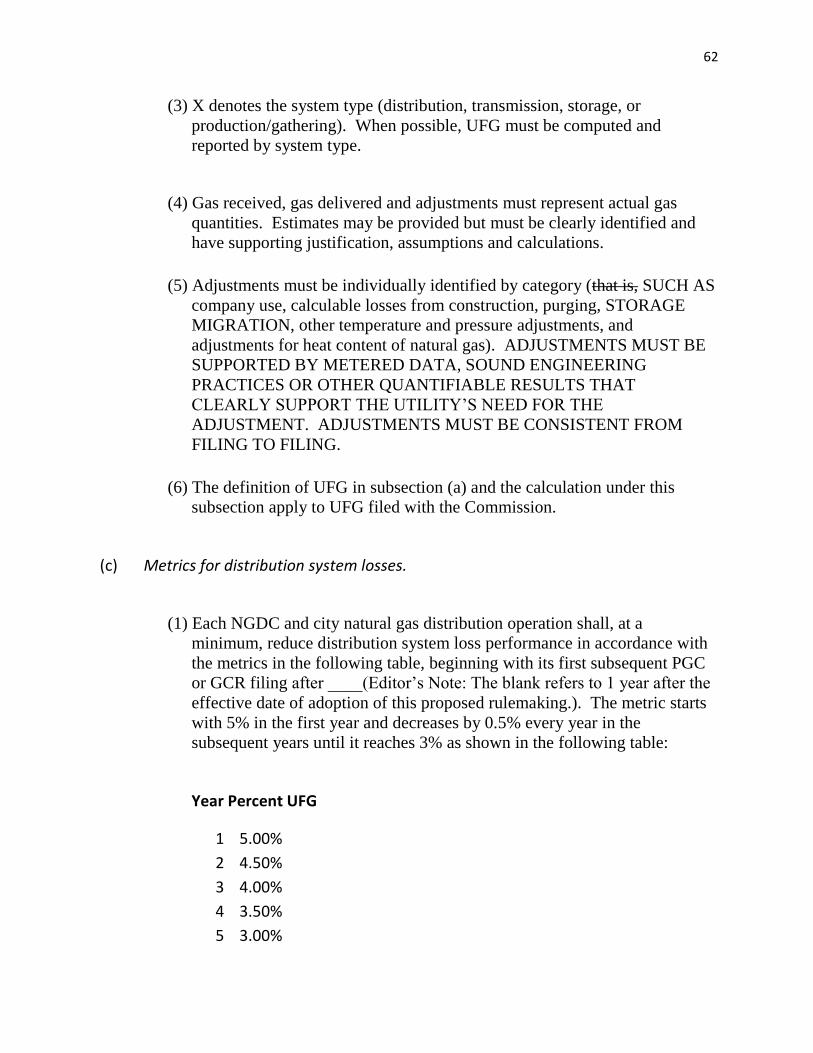
62
(3) X denotes the system type (distribution, transmission, storage, or
production/gathering). When possible, UFG must be computed and
reported by system type.
(4) Gas received, gas delivered and adjustments must represent actual gas
quantities. Estimates may be provided but must be clearly identified and
have supporting justification, assumptions and calculations.
(5) Adjustments must be individually identified by category (that is, SUCH AS
company use, calculable losses from construction, purging, STORAGE
MIGRATION, other temperature and pressure adjustments, and
adjustments for heat content of natural gas). ADJUSTMENTS MUST BE
SUPPORTED BY METERED DATA, SOUND ENGINEERING
PRACTICES OR OTHER QUANTIFIABLE RESULTS THAT
CLEARLY SUPPORT THE UTILITY’S NEED FOR THE
ADJUSTMENT. ADJUSTMENTS MUST BE CONSISTENT FROM
FILING TO FILING.
(6) The definition of UFG in subsection (a) and the calculation under this
subsection apply to UFG filed with the Commission.
(c) Metrics for distribution system losses.
(1) Each NGDC and city natural gas distribution operation shall, at a
minimum, reduce distribution system loss performance in accordance with
the metrics in the following table, beginning with its first subsequent PGC
or GCR filing after ____(Editor’s Note: The blank refers to 1 year after the
effective date of adoption of this proposed rulemaking.). The metric starts
with 5% in the first year and decreases by 0.5% every year in the
subsequent years until it reaches 3% as shown in the following table:
Year Percent UFG
1 5.00%
2 4.50%
3 4.00%
4 3.50%
5 3.00%
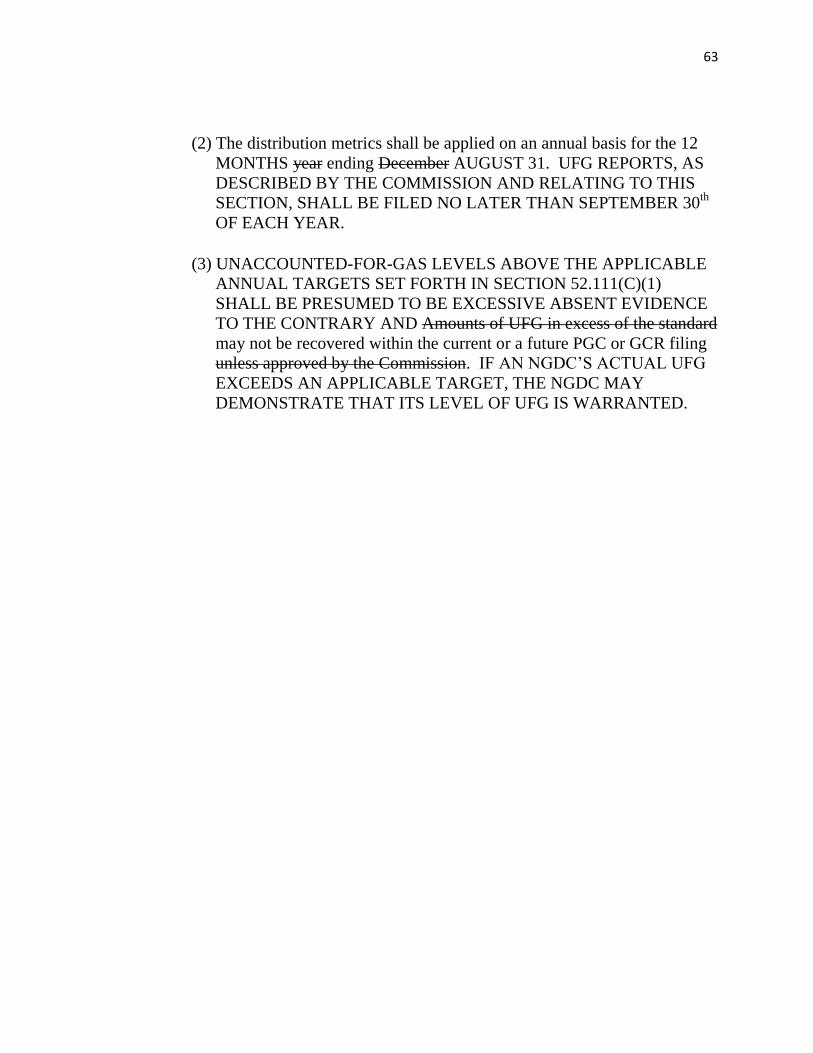
63
(2) The distribution metrics shall be applied on an annual basis for the 12
MONTHS year ending December AUGUST 31. UFG REPORTS, AS
DESCRIBED BY THE COMMISSION AND RELATING TO THIS
SECTION, SHALL BE FILED NO LATER THAN SEPTEMBER 30th
OF EACH YEAR.
(3) UNACCOUNTED-FOR-GAS LEVELS ABOVE THE APPLICABLE
ANNUAL TARGETS SET FORTH IN SECTION 52.111(C)(1)
SHALL BE PRESUMED TO BE EXCESSIVE ABSENT EVIDENCE
TO THE CONTRARY AND Amounts of UFG in excess of the standard
may not be recovered within the current or a future PGC or GCR filing
unless approved by the Commission. IF AN NGDC’S ACTUAL UFG
EXCEEDS AN APPLICABLE TARGET, THE NGDC MAY
DEMONSTRATE THAT ITS LEVEL OF UFG IS WARRANTED.
Appendix A
Reporting Unaccounted-For-Gas
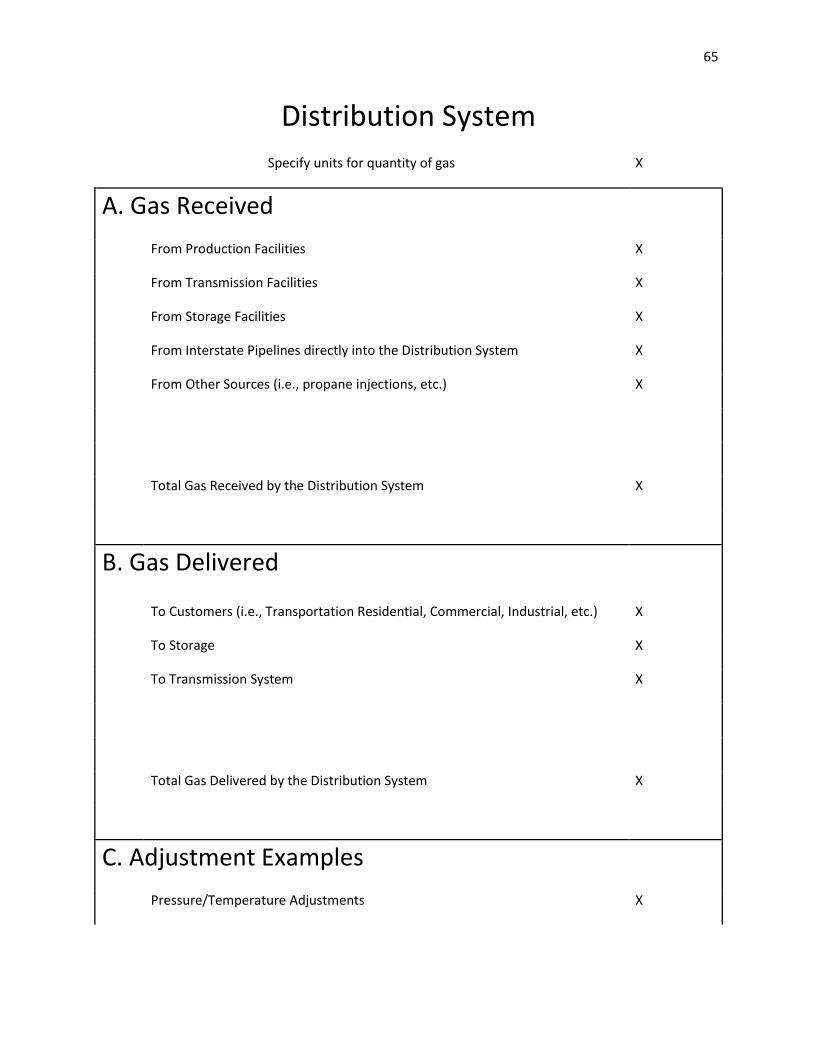
65
Distribution System
Specify units for quantity of gas X
A. Gas Received
From Production Facilities X
From Transmission Facilities X
From Storage Facilities X
From Interstate Pipelines directly into the Distribution System X
From Other Sources (i.e., propane injections, etc.) X
Total Gas Received by the Distribution System X
B. Gas Delivered
To Customers (i.e., Transportation Residential, Commercial, Industrial, etc.) X
To Storage X
To Transmission System X
Total Gas Delivered by the Distribution System X
C. Adjustment Examples
Pressure/Temperature Adjustments X

66
Located & Repaired Breaks in Mains & Services X
Company use X
Purging/Other Construction activities X
Heat Content X
Meter Read Cycle Adjustments X
Other X
Total Adjustments X
D. Distribution UFG
Total A-B-C
E. Percent UFG
Percentage (D/A)*100%
Note: Additional categories can be added in sections A, B and C. However, a brief explanation of the
added field is needed.
Transmission System Losses
Specify units for quantity of gas X
A. Gas Received
From Interstate Pipelines X
From Storage X
From Distribution System X
From Production/Gathering System X
From Other X

67
Total Gas Received by the Transmission System X
B. Gas Delivered
To Distribution System X
To Customers/sold X
To Interstate Pipeline X
To Storage
Total Gas Delivered by the Transmission System X
C. Adjustment Examples
Pressure/Temperature Adjustments X
Located & Repaired Breaks in Mains & Services X
Company use X
Purging/Other Construction activities X
Heat Content X
Meter Read Cycle Adjustments X
Other X
Total Adjustments X
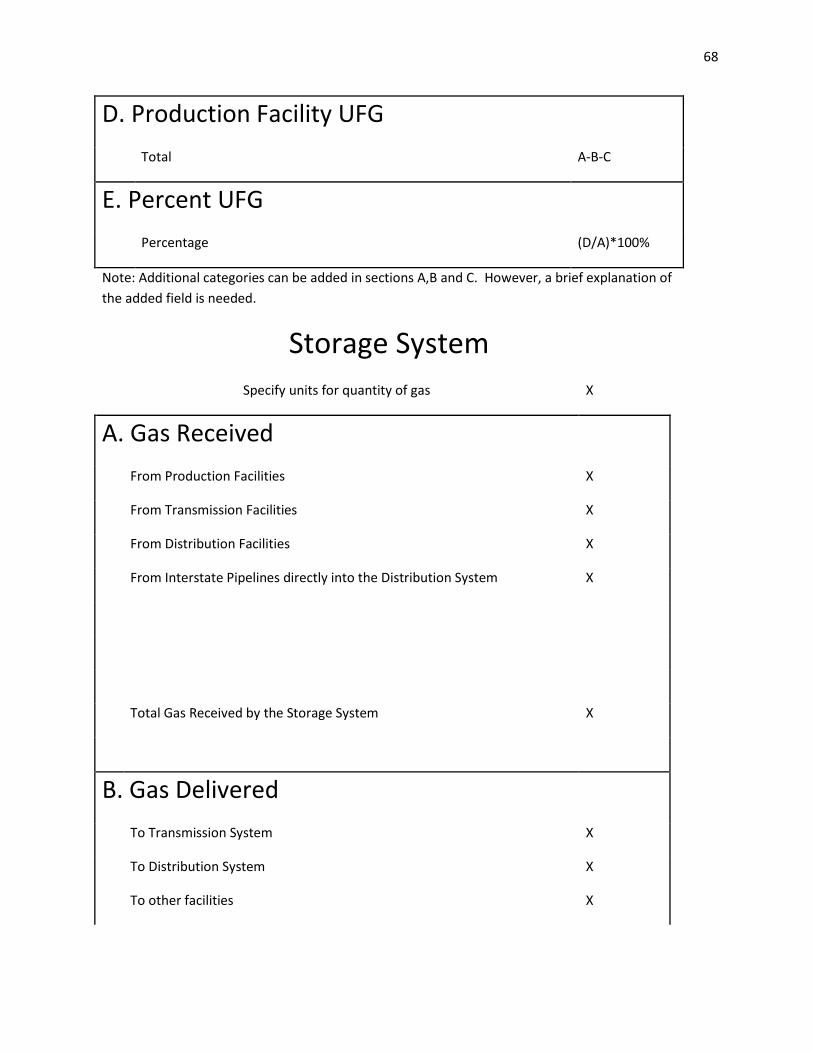
68
D. Production Facility UFG
Total A-B-C
E. Percent UFG
Percentage (D/A)*100%
Note: Additional categories can be added in sections A,B and C. However, a brief explanation of
the added field is needed.
Storage System
Specify units for quantity of gas X
A. Gas Received
From Production Facilities X
From Transmission Facilities X
From Distribution Facilities X
From Interstate Pipelines directly into the Distribution System X
Total Gas Received by the Storage System X
B. Gas Delivered
To Transmission System X
To Distribution System X
To other facilities X

69
Sold X
Total Gas Delivered by the Storage System X
C. Adjustment Examples
Company use X
Storage Migration (+/-) X
Heat Content X
Located & Repaired Breaks X
Other X
Total Adjustments X
D. Storage UFG
Total A-B-C
E. Percent UFG
Percentage (D/A)*100%
Note: Additional categories can be added in sections A,B and C. However, a brief explanation
of the added field is needed.
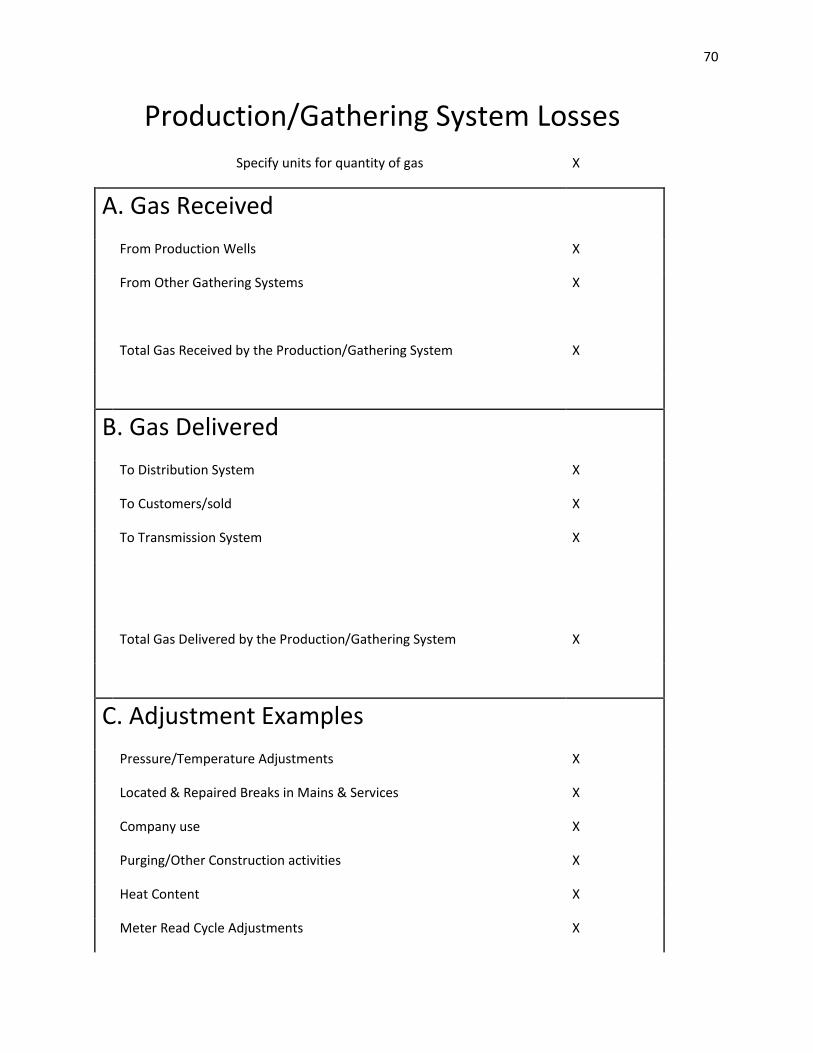
70
Production/Gathering System Losses
Specify units for quantity of gas X
A. Gas Received
From Production Wells X
From Other Gathering Systems X
Total Gas Received by the Production/Gathering System X
B. Gas Delivered
To Distribution System X
To Customers/sold X
To Transmission System X
Total Gas Delivered by the Production/Gathering System X
C. Adjustment Examples
Pressure/Temperature Adjustments X
Located & Repaired Breaks in Mains & Services X
Company use X
Purging/Other Construction activities X
Heat Content X
Meter Read Cycle Adjustments X

71
Other X
Total Adjustments X
D. Production Facility UFG
Total A-B-C
E. Percent UFG
Percentage (D/A)*100%
Note: Additional categories can be added in sections A,B and C. However, a brief explanation
of the added field is needed.
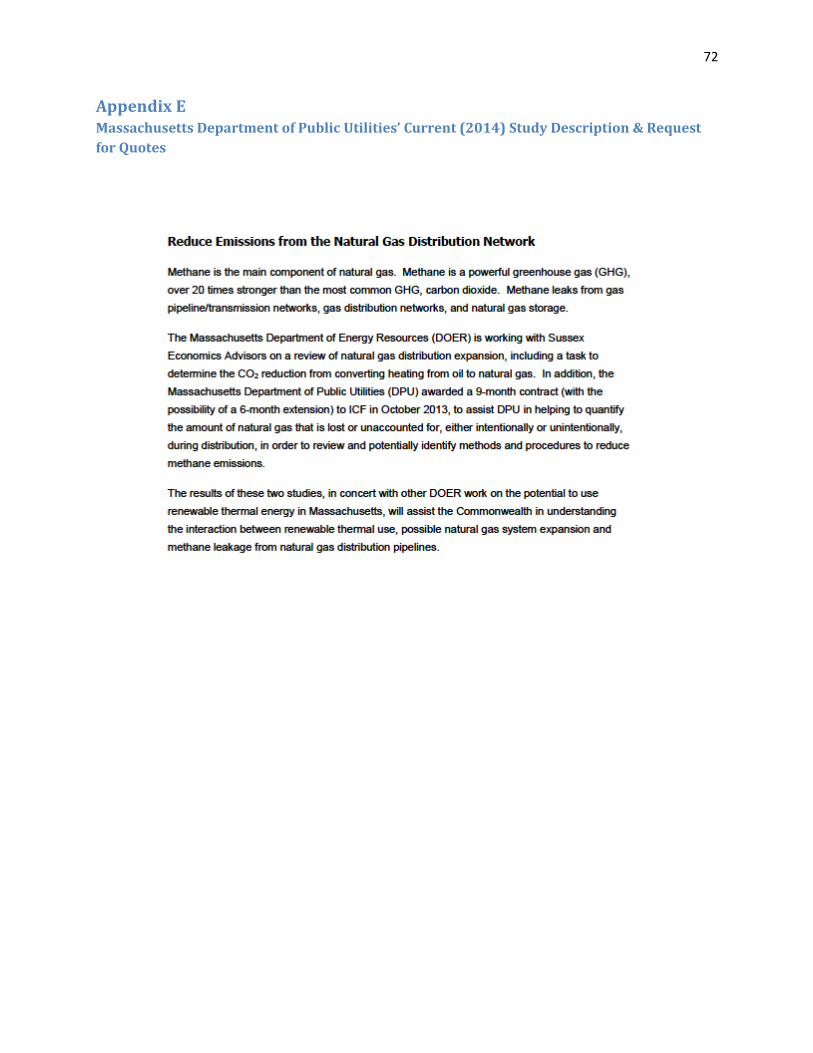
72
Appendix E Massachusetts Department of Public Utilities’ Current (2014) Study Description & Request
for Quotes
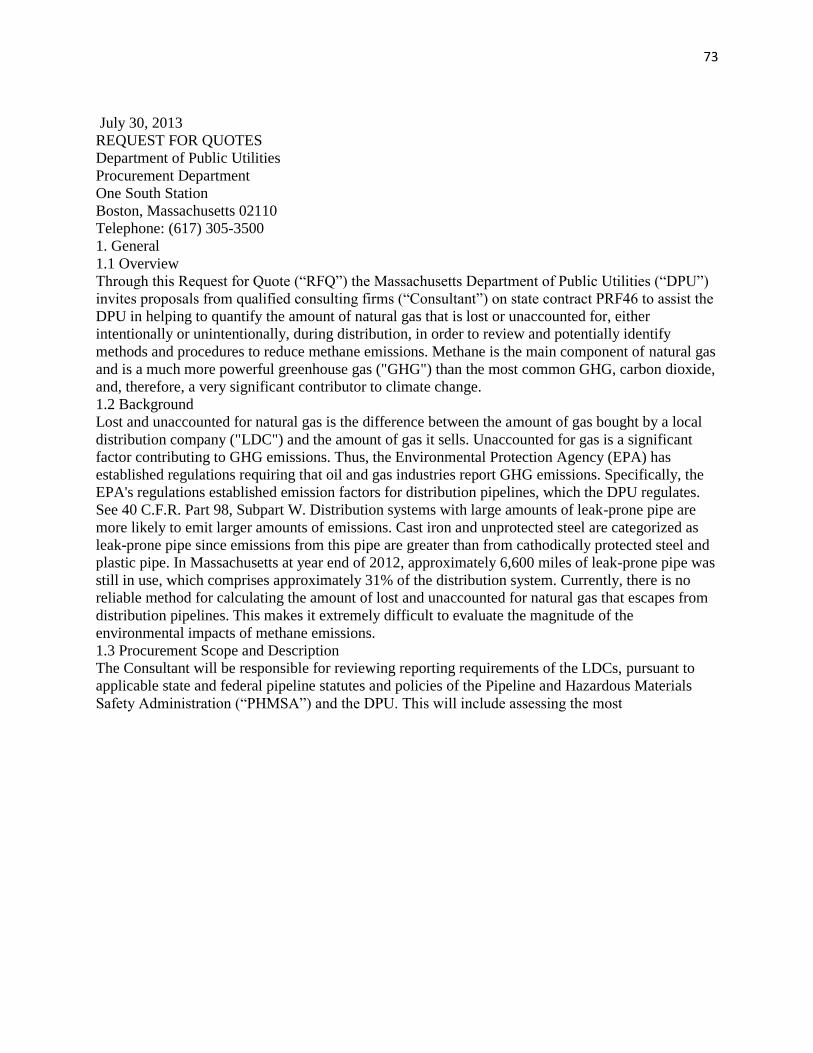
73
July 30, 2013
REQUEST FOR QUOTES
Department of Public Utilities
Procurement Department
One South Station
Boston, Massachusetts 02110
Telephone: (617) 305-3500
1. General
1.1 Overview
Through this Request for Quote (“RFQ”) the Massachusetts Department of Public Utilities (“DPU”)
invites proposals from qualified consulting firms (“Consultant”) on state contract PRF46 to assist the
DPU in helping to quantify the amount of natural gas that is lost or unaccounted for, either
intentionally or unintentionally, during distribution, in order to review and potentially identify
methods and procedures to reduce methane emissions. Methane is the main component of natural gas
and is a much more powerful greenhouse gas ("GHG") than the most common GHG, carbon dioxide,
and, therefore, a very significant contributor to climate change.
1.2 Background
Lost and unaccounted for natural gas is the difference between the amount of gas bought by a local
distribution company ("LDC") and the amount of gas it sells. Unaccounted for gas is a significant
factor contributing to GHG emissions. Thus, the Environmental Protection Agency (EPA) has
established regulations requiring that oil and gas industries report GHG emissions. Specifically, the
EPA's regulations established emission factors for distribution pipelines, which the DPU regulates.
See 40 C.F.R. Part 98, Subpart W. Distribution systems with large amounts of leak-prone pipe are
more likely to emit larger amounts of emissions. Cast iron and unprotected steel are categorized as
leak-prone pipe since emissions from this pipe are greater than from cathodically protected steel and
plastic pipe. In Massachusetts at year end of 2012, approximately 6,600 miles of leak-prone pipe was
still in use, which comprises approximately 31% of the distribution system. Currently, there is no
reliable method for calculating the amount of lost and unaccounted for natural gas that escapes from
distribution pipelines. This makes it extremely difficult to evaluate the magnitude of the
environmental impacts of methane emissions.
1.3 Procurement Scope and Description
The Consultant will be responsible for reviewing reporting requirements of the LDCs, pursuant to
applicable state and federal pipeline statutes and policies of the Pipeline and Hazardous Materials
Safety Administration (“PHMSA”) and the DPU. This will include assessing the most

74
efficient way for the LDCs to obtain and provide to the DPU accurate records pertaining to their gas
distribution systems and operations. The goal is to determine if the LDCs' records and corresponding
reporting procedures are adequate to support accurate reporting of unaccounted for gas loss.
Specific responsibilities may include:
systems in a recent year, through its1: 1 Many of these leak categories are from the US EPA GHG Reporting Rule at 40 CFR Part 98 Subpart W, Tables W-5 and W-7, see
http://www.gpo.gov/fdsys/pkg/CFR-2012-title40-vol22/pdf/CFR-2012-title40-vol22-part98-
subpartW.pdf.
o use by customers (including a range accounting for meter inaccuracy),
o use by distribution companies (including a range accounting for meter inaccuracy),
o theft,
o venting due to maintenance,
o venting from storage tanks,
o venting due to other causes,
o leaks from liquefied natural gas (LNG) storage valves,
o leaks from LNG storage pump seals,
o leaks from LNG storage connectors,
o leaks from LNG storage equipment other than connectors, pump or valves,
o leaks from LNG storage compressors,
o leaks from connectors,
o leaks from block valves,
o leaks from control valves,
o leaks from pressure release valves,
o leaks from orifice meters,
o leaks from regulators,
o leaks from open-ended lines,
o leaks from below grade metering stations (by inlet pressure >3000 psig, 100-300 psig and <100
psig),
o leaks from distribution mains (by unprotected steel, protected steel, plastic and cast iron), and
o leaks from distribution services (by unprotected steel, protected steel, plastic and cast iron).
of methane emissions from the
natural gas infrastructure by the local gas distribution companies;
that escapes from distribution pipelines;
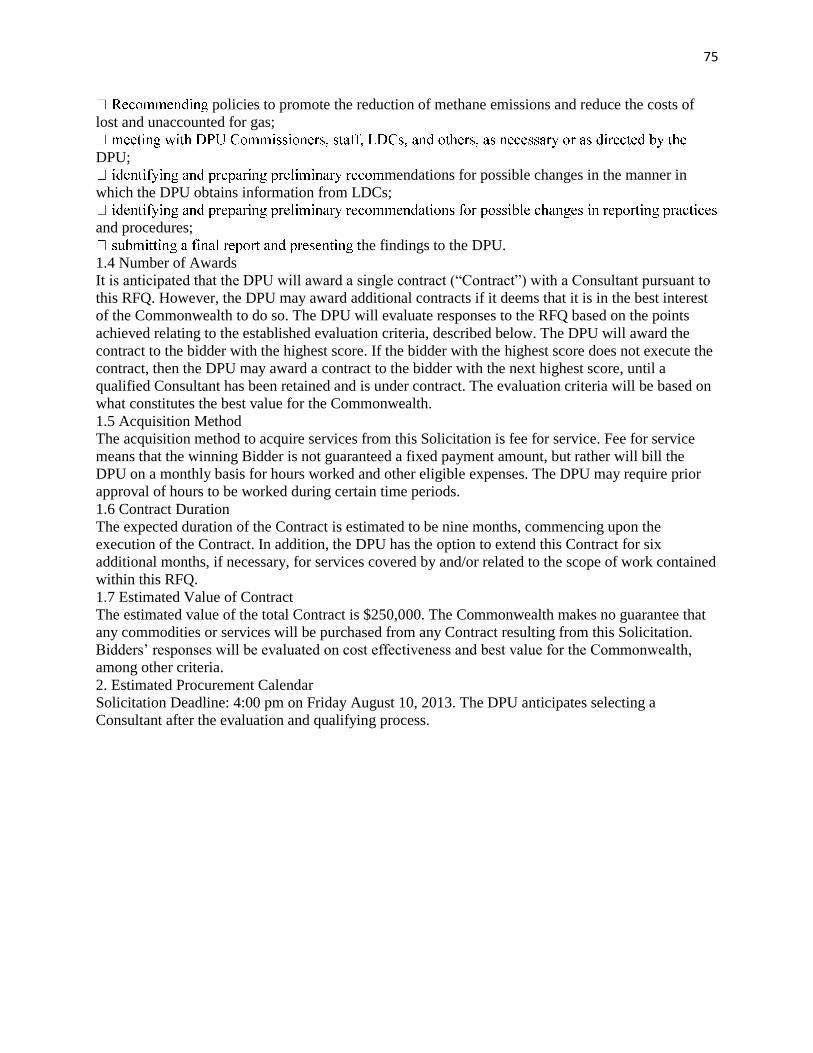
75
policies to promote the reduction of methane emissions and reduce the costs of
lost and unaccounted for gas;
DPU;
mendations for possible changes in the manner in
which the DPU obtains information from LDCs;
and procedures;
he findings to the DPU.
1.4 Number of Awards
It is anticipated that the DPU will award a single contract (“Contract”) with a Consultant pursuant to
this RFQ. However, the DPU may award additional contracts if it deems that it is in the best interest
of the Commonwealth to do so. The DPU will evaluate responses to the RFQ based on the points
achieved relating to the established evaluation criteria, described below. The DPU will award the
contract to the bidder with the highest score. If the bidder with the highest score does not execute the
contract, then the DPU may award a contract to the bidder with the next highest score, until a
qualified Consultant has been retained and is under contract. The evaluation criteria will be based on
what constitutes the best value for the Commonwealth.
1.5 Acquisition Method
The acquisition method to acquire services from this Solicitation is fee for service. Fee for service
means that the winning Bidder is not guaranteed a fixed payment amount, but rather will bill the
DPU on a monthly basis for hours worked and other eligible expenses. The DPU may require prior
approval of hours to be worked during certain time periods.
1.6 Contract Duration
The expected duration of the Contract is estimated to be nine months, commencing upon the
execution of the Contract. In addition, the DPU has the option to extend this Contract for six
additional months, if necessary, for services covered by and/or related to the scope of work contained
within this RFQ.
1.7 Estimated Value of Contract
The estimated value of the total Contract is $250,000. The Commonwealth makes no guarantee that
any commodities or services will be purchased from any Contract resulting from this Solicitation.
Bidders’ responses will be evaluated on cost effectiveness and best value for the Commonwealth,
among other criteria.
2. Estimated Procurement Calendar
Solicitation Deadline: 4:00 pm on Friday August 10, 2013. The DPU anticipates selecting a
Consultant after the evaluation and qualifying process.
76
3. Specifications
3.1 Bidder Qualifications – General experience and expertise of selected PRF46 vendor. The DPU
requires the services of a Consultant experienced in natural gas pipeline systems, federal gas pipeline
safety requirements, and state and federal regulatory requirements for LDCs. Bidders should also
demonstrate their experience with, and knowledge of, the following areas:
management;
latory requirements applicable to pipeline safety; and
Bidders should also have outstanding oral and written communication skills.
3.2 Service Specifications
The Consultant will work on-site at the DPU as required, as directed by the DPU, and as reflected in
an agreed-upon schedule. Occasional night or weekend work may be required. The Consultant will
work under the supervision of the DPU’s Director of Pipeline Engineering and Safety.
3.3 Environmental Specifications
Environmental Purchasing Policy: Per Executive Order 515, issued October 27, 2009, Executive
Departments are required to reduce their impact on the environment and enhance public health by
procuring environmentally preferable product and services (EPPs) whenever such product and
services perform to satisfactory standards and represent best value. EPPs are considered to be
products and services that help to conserve natural resources, reduce waste, protect public health and
the environment, and promote the use of clean technologies, recycled materials and less toxic
products.
3.5 Compensation structure
The winning bidder will submit monthly invoices with verification that goods and/or services have
been received.
4.0 Confidentiality
The Consultant shall not divulge to third parties any confidential information obtained by the
Consultant or its agents, distributors, resellers, subcontractors, officers or employees in the course of
performing Contract work, including, but not limited to, security procedures, business operations
information, personally identifiable information, or commercial proprietary information in the
possession of the DPU. The Consultant shall not divulge to third parties any internal DPU
deliberations.

77
4.1 Conflicts of Interest
Bidders should explain whether they are presently providing or anticipate that they will soon be
providing consulting or other services to a natural gas pipeline owner or operator, gas company or
electric company or any other entity on a matter pending before the DPU.
4.2 Failure to perform contractual obligations may result in termination.
4.3 Evaluation Criteria
A. EXPERIENCE: In this section, the Bidder must demonstrate its capability to provide the services
described in the scope of work as outlined in Number 1.3 of this RFQ. The Bidder shall address the
required services within the scope of work, and may address other services that are not specifically
required. The Bidder must demonstrate its critical understanding of the work required under this RFQ
and its capabilities and experience in performing the required services. The information provided
must demonstrate that the Bidder possesses the expertise to deliver quality work products on
schedule and within budget. The Bidder must include information on prior projects it considers both
representative of its qualifications and project experience relevant to the scope of this RFQ.
Each prior project set forth must include the following basic information so that the DPU may verify
the performance of the Bidder: a brief description of the project, the client’s full business name,
address and telephone number including the name, email address and telephone number of the
contact person responsible for the project. The DPU may, as part of its evaluation, contact the person
identified, and Bidders are advised that the inability of the DPU to contact this person as a result of
the Bidder providing incorrect contact information may result in a lower score. The DPU reserves the
right to rely on the information provided by the Bidder in its proposal, and may elect not to seek or
consider additional or updated information from the Bidder after the deadline for responses to the
RFQ.
B. PERSONNEL: The Bidder shall identify each member of the Consultant’s intended team and
provide resumes and/or biographical information describing each individual’s education, work
experience and qualifications relevant to the scope of work of this RFQ. The Bidder shall describe
the anticipated hours or proportional contributions anticipated of individual members of the
consulting team. Substitutions of personnel or significant changes in the distribution of
responsibilities among team members presented in the response to the RFQ may be made only with
prior written consent of the DPU.
C. PROJECT UNDERSTANDING AND APPROACH: Bidders shall describe their understanding of
the project, demonstrating familiarity with both the RFQ and the

78
regulatory context in which it is being procured. Respondents shall present an intended scope of
work and general approach and specific tasks intended to successfully complete this engagement.
D. RATES AND TOTAL COST: The Bidder must provide estimated hourly labor rates for proposed
personnel and the total cost for providing the requested services, including proposed staffing of tasks.
5.0 Selection Criteria
Responses will be evaluated by a Selection Committee consisting of, or appointed by, the DPU. The
Selection Committee will evaluate and rank responses to the RFQ pursuant to the following scoring
method, based on a maximum total score of 100 points, and submit the results of this ranking to the
DPU for its review and determination of the Contract award:
rience [30 points]
6.0 Proposal Submission
All bids must be submitted on line through Comm-Pass and received by the DPU no later than 4:00
p.m. on Friday, August 10, 2013.