value focus fintech industry - mercer capitalfintech - technology 35.8 28.5 27.1 21.8 17.7 15.0 4.0...
TRANSCRIPT

www.mercercapital.com
VALUE FOCUS
FinTech Industry
First Quarter 2018
The first quarter of 2018 got off to a slow start for broader
equity markets as volatility returned to the market and inves-
tors were reintroduced to the idea that markets can decline.
Publicly traded FinTech companies bucked this trend by get-
ting off to a relatively fast start as all three FinTech niches that
we track outperformed the broader markets in January 2018
and then were only down slightly for February and March.
Valuation multiples of publicly traded FinTech companies
also expanded further in 2017 and 2018 and remain elevated
relative to broader markets and financials.
Contrasting the above-market returns of publicly traded Fin-
Techs thus far in 2018, the private markets were relatively
flat. While M&A activity was relatively flat in 1Q18, there were
a few notable larger deals that pulled average FinTech deal
values higher.
While interest in the FinTech sector remains high, the outlook
remains uncertain as competitive pressures, continuing tech-
nological change, and regulatory/policy uncertainty remain.
Only time will tell if the strong 2017 and 1Q18 in the publicly
traded FinTechs drives a pick-up in exit/IPO activity and val-
uations in the private FinTech market or if the divergence in
performance will persist.
Contact Us
BUSINESS VALUATION & FINANCIAL ADVISORY SERVICESFinTech Industry Services
Mercer Capital provides financial technology companies with valuation, financial
advisory, and consulting services.
Services Provided
• Valuation of financial technology companies
• Financial advisory/valuations for acquisitions and divestitures
• Valuations for purchase accounting and impairment testing
• Fairness and solvency opinions
• Litigation support for economic damages and valuation and shareholder disputes
• Consulting and board presentations for corporate and strategic planning
Jay D. Wilson, CFA, ASA, CBA
901.322.9725
Jeff K. Davis, CFA
615.345.0350
Rohan Bose
214.206.3796
Daniel P. McLeod
901.322.9716
Learn More about Mercer Capital &
our FinTech Services at
http://mer.cr/1fiOndr
Copyright © 2018 Mercer Capital Management, Inc. All rights reserved. It is illegal under Federal law to reproduce this publication or any portion of its contents without the
publisher’s permission. Media quotations with source attribution are encouraged. Reporters requesting additional information or editorial comment should contact Barbara
Walters Price at 901.685.2120. Mercer Capital’s Industry Focus is published quarterly and does not constitute legal or financial consulting advice. It is offered as an informa-
tion service to our clients and friends. Those interested in specific guidance for legal or accounting matters should seek competent professional advice. Inquiries to discuss
specific valuation matters are welcomed. To add your name to our mailing list to receive this complimentary publication, visit our web site at www.mercercapital.com.
In This Issue
Follow Mercer Capital@MercerFinTech @MercerCapital Mercer Capital
Takeaways from FinXTech 2018: The Rise of Bank and FinTech Partnerships 1
FinTech Industry Overview 3
Public Market Indicators 3
Valuation Multiples 4
FinTech M&A 5
Publicly Traded FinTech Companies 6
Payments 6
Solutions 8
Technology 10
© 2018 Mercer Capital // www.mercercapital.com 1
Mercer Capital’s Value Focus: FinTech IndustryFirst Quarter 2018
@MercerFinTech
Takeaways from FinXTech 2018 The Rise of Bank and FinTech Partnerships
I recently attended FinXTech, an industry event where the hosts at
Bank Director bring together FinTech founders and bank directors
and executives for productive conversations about the road ahead as
partners (and competitors).
Those discussions occurred against a backdrop in which FinTech, as
a concept to enhance the customer experience and to drive operating
efficiencies, is widely accepted by bank management, shareholders,
and regulators. How “FinTech” is implemented varies depending upon
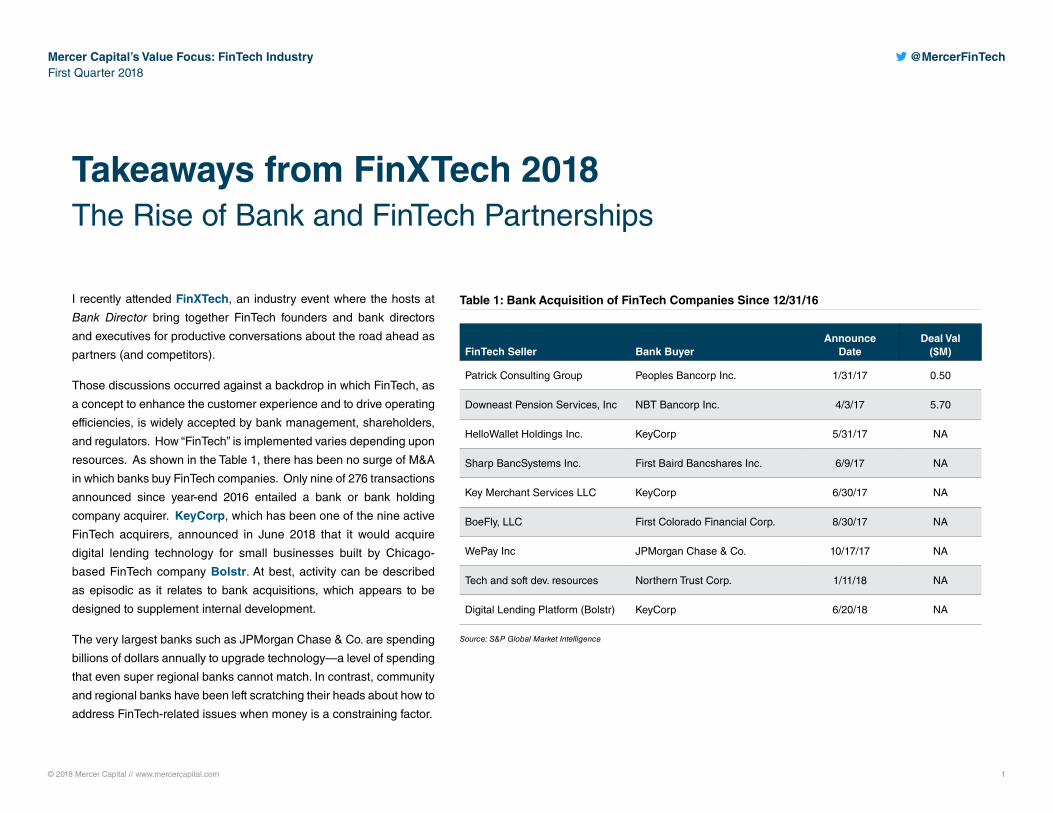
resources. As shown in the Table 1, there has been no surge of M&A
in which banks buy FinTech companies. Only nine of 276 transactions
announced since year-end 2016 entailed a bank or bank holding
company acquirer. KeyCorp, which has been one of the nine active
FinTech acquirers, announced in June 2018 that it would acquire
digital lending technology for small businesses built by Chicago-
based FinTech company Bolstr. At best, activity can be described
as episodic as it relates to bank acquisitions, which appears to be
designed to supplement internal development.
The very largest banks such as JPMorgan Chase & Co. are spending
billions of dollars annually to upgrade technology—a level of spending
that even super regional banks cannot match. In contrast, community
and regional banks have been left scratching their heads about how to
address FinTech-related issues when money is a constraining factor.
Table 1: Bank Acquisition of FinTech Companies Since 12/31/16
FinTech Seller Bank BuyerAnnounce
DateDeal Val
($M)
Patrick Consulting Group Peoples Bancorp Inc. 1/31/17 0.50
Downeast Pension Services, Inc NBT Bancorp Inc. 4/3/17 5.70
HelloWallet Holdings Inc. KeyCorp 5/31/17 NA
Sharp BancSystems Inc. First Baird Bancshares Inc. 6/9/17 NA
Key Merchant Services LLC KeyCorp 6/30/17 NA
BoeFly, LLC First Colorado Financial Corp. 8/30/17 NA
WePay Inc JPMorgan Chase & Co. 10/17/17 NA
Tech and soft dev. resources Northern Trust Corp. 1/11/18 NA
Digital Lending Platform (Bolstr) KeyCorp 6/20/18 NA
Source: S&P Global Market Intelligence

© 2018 Mercer Capital // www.mercercapital.com 2
Mercer Capital’s Value Focus: FinTech IndustryFirst Quarter 2018
@MercerFinTech
valuation of banks that effectively leverage technology to achieve strategic objectives
such as growing low-cost core deposits, opening new lending venues, and improving
efficiency. One would think the answer will be “yes” if the impact can be measured
and is meaningful.
Another trend to look for will be whether smaller banks become more active as
investors in FinTech companies. For the most part, investments by community and
regional banks in FinTech companies remains sporadic at best even though FinTech
companies raised nearly $16 billion of equity capital between year-end 2016 and
June 2018 in both private and public offerings. An interesting transaction we
observed was a $16 million Series A financing by Greenlight Financial Technology,
Inc., a creator of smart debit cards, in which the investors included SunTrust Bank,
Amazon Alexa Fund, and $619 million asset NBKC Bank, among others.
FinXTech 2018 included several sessions related to due diligence for FinTech
partnerships; however, with limited M&A and investing activity by banks there was little
discussion about valuation issues, which can be challenging for FinTech companies
and differs markedly from methods employed to value a bank.
Not surprisingly, we have lots of thoughts on the subject.
With the emerging partnership theme from FinXTech 2018 in mind, view our
complimentary webinar “How to Value an Early-Stage FinTech Company.”
Additionally, if you have questions, reach out to one of our professionals to discuss
your needs in confidence.
Jay D. Wilson, Jr., CFA, ASA, CBA
469.778.5860
During the FinXTech 2018, the focus shifted from the potential disruption of a
bank’s franchise by FinTech to the potential to partner with FinTech companies,
which stood out to me as a marked change from prior years.
Both banks and FinTech companies realize that they need each other to some
degree. For banks, FinTech offers the potential to leverage innovation and new
technologies to meet customer expectations, enhance efficiency, and compete
more effectively against the biggest banks. For FinTech companies, the benefits
from bank partnerships can include the potential to leverage the bank’s customer
relationships to scale more quickly, access to funding, and regulatory/compliance
expertise. Several examples of successful partnerships between banks and
FinTech companies were highlighted at the FinXTech event. (You can read more
about some of them here.)
The FinTech/Bank partnership theme also was evident in GreenSky’s recent
IPO, a FinTech company based in Atlanta. GreenSky arranges loans primarily
for home improvement projects. Bank partners pay GreenSky to generate and
service the loans while the bank funds and holds the loans on their balance sheet.
As more partnerships emerge, it will be interesting to see if FinTech impacts the
What We’re Reading
RegTech-The Greatest Opportunity in FinTech
Medici, by Elena Mesropyan
Banking + Fintech Collaboration: More Important than Ever
The Financial Brand, by Jim Marous
March 2018 FinTech Funding – Lending Neobanks Top the Charts
Medici, by Diwakar Mandal

© 2018 Mercer Capital // www.mercercapital.com 3
Mercer Capital’s Value Focus: FinTech IndustryFirst Quarter 2018
@MercerFinTech
80
90
100
110
120
130
140
150
Mar
ch 3
1, 2
017
= 10
0
S&P 500 FinTech - SolutionsFinTech - Payments FinTech - Technology
Source: S&P Global Market Intelligence
Public Market IndicatorsFrom 1Q17 to 1Q18, all three FinTech niches of Payments,
Technology and Solutions outperformed the market.
• The Payments, Solutions, and Technology niches all had
a positive last twelve months, up 36%, 26%, and 30%
respectively.
• All three niches outperformed the S&P 500 which was up
14% in the last twelve months.
The FinTech IPO drought that started in 2016 continued into
2017 with no new IPOs in 2017 or 1Q18.
Strategic mergers and acquisitions continue to dominate exit
activity in the FinTech industry as companies look beyond IPO
plans. However, there are a few notable IPOs teed up for the
remainder of 2018.
FINTECH NEWSLETTER: PUBLIC MARKET INDICATORS
Each quarter, the FinTech newsletter reviews the public FinTech
market.
To receive quarterly updates, follow the link below.
Subscribe
Median Total Returnas of March 31, 2018
Segment MTD 18 1Q18 LTM 3/18
FinTech - Payments -1.3% 7.8% 36.2%
FinTech - Solutions 1.2% 6.8% 26.4%
FinTech - Technology 2.5% 9.7% 30.2%
S&P 500 -2.5% -0.8% 14.0%
Source: S&P Global Market Intelligence
© 2018 Mercer Capital // www.mercercapital.com 4
Mercer Capital’s Value Focus: FinTech IndustryFirst Quarter 2018
@MercerFinTech
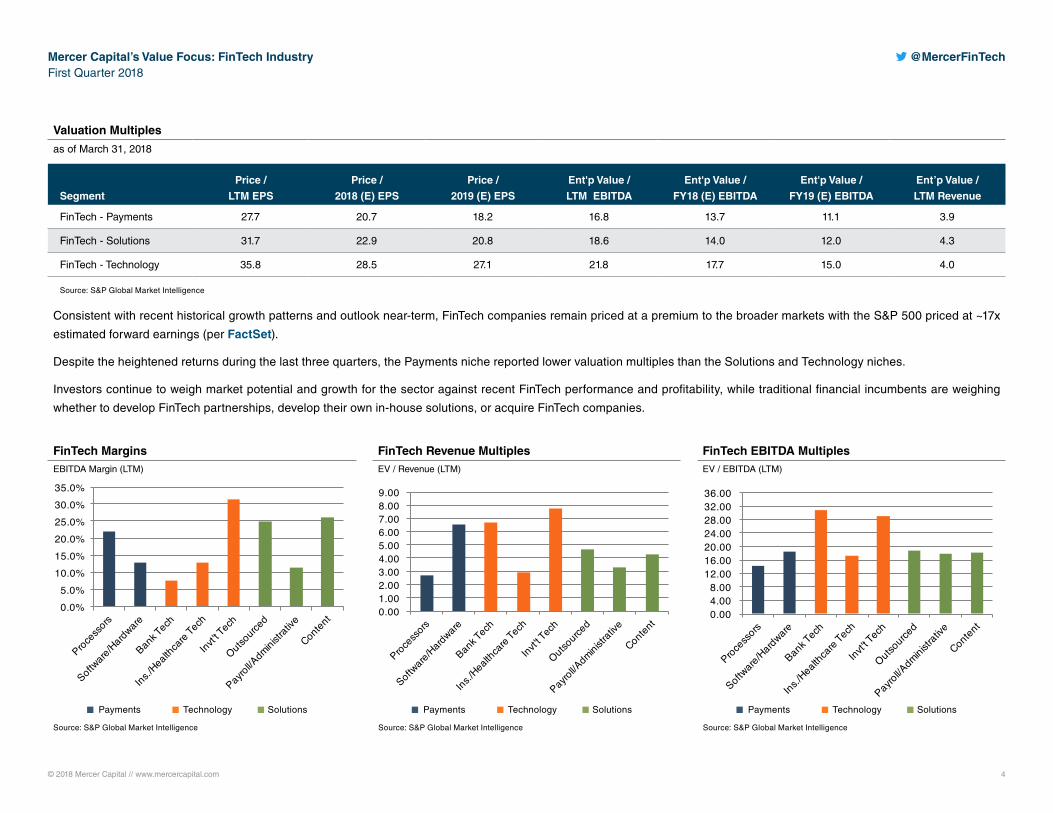
Valuation Multiples
as of March 31, 2018
Segment
Price /
LTM EPS
Price /
2018 (E) EPS
Price /
2019 (E) EPS
Ent'p Value /
LTM EBITDA
Ent'p Value /
FY18 (E) EBITDA
Ent'p Value /
FY19 (E) EBITDA
Ent’p Value /
LTM Revenue
FinTech - Payments 27.7 20.7 18.2 16.8 13.7 11.1 3.9
FinTech - Solutions 31.7 22.9 20.8 18.6 14.0 12.0 4.3
FinTech - Technology 35.8 28.5 27.1 21.8 17.7 15.0 4.0
Source: S&P Global Market Intelligence
Consistent with recent historical growth patterns and outlook near-term, FinTech companies remain priced at a premium to the broader markets with the S&P 500 priced at ~17x
estimated forward earnings (per FactSet).
Despite the heightened returns during the last three quarters, the Payments niche reported lower valuation multiples than the Solutions and Technology niches.
Investors continue to weigh market potential and growth for the sector against recent FinTech performance and profitability, while traditional financial incumbents are weighing
whether to develop FinTech partnerships, develop their own in-house solutions, or acquire FinTech companies.
FinTech MarginsEBITDA Margin (LTM)
FinTech Revenue MultiplesEV / Revenue (LTM)
FinTech EBITDA MultiplesEV / EBITDA (LTM)
0.00 4.00 8.00
12.00 16.00 20.00 24.00 28.00 32.00 36.00
0.00 1.00 2.00 3.00 4.00 5.00 6.00 7.00 8.00 9.00
0.0% 5.0%
10.0% 15.0% 20.0% 25.0% 30.0% 35.0%
Source: S&P Global Market Intelligence Source: S&P Global Market Intelligence Source: S&P Global Market Intelligence
Payments Technology Solutions Payments Technology Solutions Payments Technology Solutions

© 2018 Mercer Capital // www.mercercapital.com // Source: S&P Global Market Intelligence 5
Mercer Capital’s Value Focus: FinTech IndustryFirst Quarter 2018
@MercerFinTech
FinTech M&A
First Quarter 2018
The number and median reported deal value of M&A deals for
1Q18 is on pace with 2017 levels. Due to some larger deals,
total FinTech deal value increased sharply in 1Q18.
• The first quarter of 2018 saw some larger deals compared
to the first quarter of 2017.
• The Technology niche is on track to exceed activity levels
in 2017.
Pricing multiples were down relative to 2017 and 2016 levels.
However, pricing multiples were relatively stable when com-
pared to 1Q18.
Deal Activity
1Q 2018 1Q 2017 2017
% Change
1Q18 / 1Q17
# of Deals 46 47 180 -2.1%
Total Reported Deal Value ($M) $26,615.9 $5,552.6 $17,265.8 379.3%
Median Reported Deal Value ($M) $94.0 $88.5 $65.0 6.2%
Deal Activity by FinTech Industry Niche
# of Deals
% Change1Q 2018 1Q 2017 2017
Payments Total 12 13 44 -7.7%
Technology Total 24 22 37 9.1%
Solutions Total 10 12 99 -16.7%
Median Pricing Metrics
1Q 2018 1Q 2017 2017 % Change
Deal Value / Revenue 1.59 1.58 3.13 0.6%
Deal Value Greater than $1BN 3 1 4
Deal Value Greater than $500M 3 1 9
Deal Value Greater than $50M 6 7 37
Median Deal Value ($M)
1Q 2018 1Q 2017 2017
Payments $1,531.6 $126.0 $167.0
Technology $27.5 na $140.0
Solutions $447.5 $75.0 $89.5
FINTECH NEWSLETTER: M&A
Each quarter, the FinTech newsletter reviews FinTech M&A
activity. Mercer Capital provides valuation and transaction
advisory services (M&A, fairness opinions, and consulting) to
FinTech companies.
View Past Issues or Subscribe

© 2018 Mercer Capital // www.mercercapital.com // Source: S&P Global Market Intelligence 6
Mercer Capital’s Value Focus: FinTech IndustryFirst Quarter 2018
@MercerFinTech
Publicly Traded Payments Companies
Ticker Name3/31/18 Price
Market Cap ($M)
Ent’p Val ($M)
Price / Earnings Ent’p Value / EBITDA EV / LTM LTM Total LTM Margins
LTM FY18E FY19E LTM FY18E FY19E RevenueRevenue
($M)EBITDA
($M) EBITDA Net Inc.
Payment Processors
ADS Alliance Data Systems Corporation 212.86 11,805 32,952 15.1 9.4 8.2 19.2 15.2 13.9 4.3 7,725 1,734 22% 10%
HAWK Blackhawk Network Holdings, Inc. 44.70 2,440 2,007 NM 22.4 19.8 10.6 7.5 6.7 0.9 2,232 189 8% -7%
CATM Cardtronics plc 22.31 1,024 1,889 NM 15.1 13.4 5.7 7.4 7.1 1.3 1,508 333 22% -10%
PMTS CPI Card Group Inc. 3.02 34 314 NM NM NM 15.9 11.7 9.3 1.2 255 20 8% -9%
DLX Deluxe Corporation 74.01 3,539 4,189 15.7 12.9 12.2 8.6 7.8 7.5 2.1 1,966 485 25% 12%
EEFT Euronet Worldwide, Inc. 78.92 4,058 3,700 27.7 15.1 13.2 9.4 7.8 6.9 1.6 2,252 395 18% 7%
EVRI Everi Holdings Inc. 6.57 452 1,482 NM 82.1 45.3 7.2 6.5 6.1 1.5 975 206 21% -5%
EVTC EVERTEC, Inc. 16.35 1,184 1,753 21.5 11.9 10.0 12.5 10.2 9.0 4.3 407 139 34% 14%
FDC First Data Corporation 16.00 14,820 36,454 10.3 11.6 10.3 11.8 11.0 10.4 4.5 8,129 2,875 35% 18%
FLT FleetCor Technologies, Inc. 202.50 18,186 21,791 25.6 19.6 17.2 19.4 16.2 14.3 9.7 2,250 1,120 50% 33%
GPN Global Payments Inc. 111.52 17,789 21,919 37.0 22.0 19.0 19.8 16.0 14.1 5.5 3,975 1,105 28% 12%
GDOT Green Dot Corporation 64.16 3,290 2,440 39.9 22.3 19.7 17.7 10.2 9.1 2.7 890 138 16% 10%
MA Mastercard Incorporated 175.16 184,161 181,903 48.0 29.4 25.0 25.1 21.4 18.7 14.6 12,497 7,248 58% 31%
MGI MoneyGram International, Inc. 8.62 468 1,186 NM 7.7 6.7 5.4 4.3 4.0 0.7 1,602 222 14% -2%
SQ Square, Inc. 49.20 19,501 19,000 NM 108.1 64.4 NM 75.5 44.6 8.6 2,214 (24) -1% -3%
TSS Total System Services, Inc. 86.26 15,676 18,535 27.3 20.6 18.2 18.1 13.9 12.9 3.8 4,928 982 20% 12%
JTPY JetPay Corporation 2.45 38 107 NM NM - 26.3 15.7 - 1.4 76 4 5% -4%
PAY VeriFone Systems, Inc. 15.38 1,698 2,416 NM 9.6 8.4 10.7 7.7 - 1.3 1,854 229 12% -8%
V Visa Inc. 119.62 269,971 280,517 39.7 26.0 22.2 21.9 19.0 16.9 15.0 18,759 12,837 68% 38%
WU The Western Union Company 19.23 8,857 11,050 NM 10.4 9.9 8.5 7.9 7.7 2.0 5,524 1,303 24% -10%
WEX WEX Inc. 156.62 6,740 8,652 42.1 20.6 17.9 19.6 14.5 13.0 6.9 1,251 441 35% 13%
Median 4,058 4,189 27.5 19.6 15.3 14.2 11.0 9.1 2.7 2,214 395 22% 10%
© 2018 Mercer Capital // www.mercercapital.com // Source: S&P Global Market Intelligence 7
Mercer Capital’s Value Focus: FinTech IndustryFirst Quarter 2018
@MercerFinTech
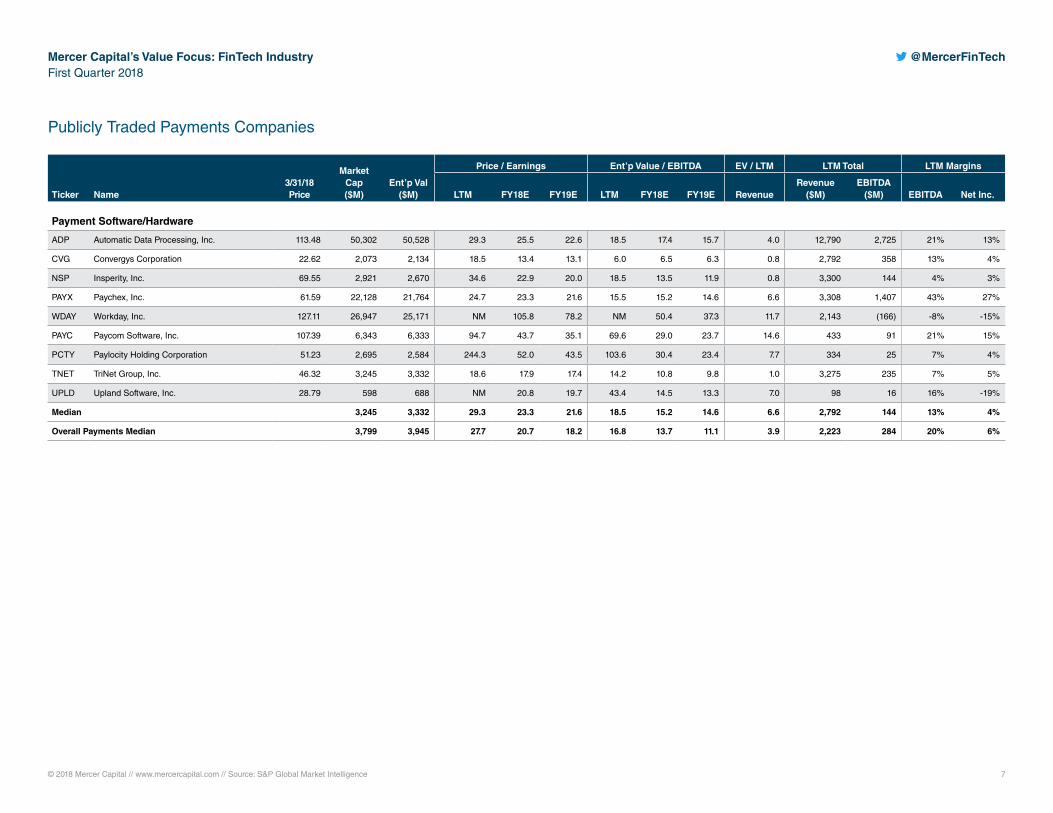
Publicly Traded Payments Companies
Ticker Name3/31/18 Price
Market Cap ($M)
Ent’p Val ($M)
Price / Earnings Ent’p Value / EBITDA EV / LTM LTM Total LTM Margins
LTM FY18E FY19E LTM FY18E FY19E RevenueRevenue
($M)EBITDA
($M) EBITDA Net Inc.
Payment Software/Hardware
ADP Automatic Data Processing, Inc. 113.48 50,302 50,528 29.3 25.5 22.6 18.5 17.4 15.7 4.0 12,790 2,725 21% 13%
CVG Convergys Corporation 22.62 2,073 2,134 18.5 13.4 13.1 6.0 6.5 6.3 0.8 2,792 358 13% 4%
NSP Insperity, Inc. 69.55 2,921 2,670 34.6 22.9 20.0 18.5 13.5 11.9 0.8 3,300 144 4% 3%
PAYX Paychex, Inc. 61.59 22,128 21,764 24.7 23.3 21.6 15.5 15.2 14.6 6.6 3,308 1,407 43% 27%
WDAY Workday, Inc. 127.11 26,947 25,171 NM 105.8 78.2 NM 50.4 37.3 11.7 2,143 (166) -8% -15%
PAYC Paycom Software, Inc. 107.39 6,343 6,333 94.7 43.7 35.1 69.6 29.0 23.7 14.6 433 91 21% 15%
PCTY Paylocity Holding Corporation 51.23 2,695 2,584 244.3 52.0 43.5 103.6 30.4 23.4 7.7 334 25 7% 4%
TNET TriNet Group, Inc. 46.32 3,245 3,332 18.6 17.9 17.4 14.2 10.8 9.8 1.0 3,275 235 7% 5%
UPLD Upland Software, Inc. 28.79 598 688 NM 20.8 19.7 43.4 14.5 13.3 7.0 98 16 16% -19%
Median 3,245 3,332 29.3 23.3 21.6 18.5 15.2 14.6 6.6 2,792 144 13% 4%
Overall Payments Median 3,799 3,945 27.7 20.7 18.2 16.8 13.7 11.1 3.9 2,223 284 20% 6%

© 2018 Mercer Capital // www.mercercapital.com // Source: S&P Global Market Intelligence 8
Mercer Capital’s Value Focus: FinTech IndustryFirst Quarter 2018
@MercerFinTech
Publicly Traded Solutions Companies
Ticker Name3/31/18 Price
Market Cap ($M)
Ent’p Val ($M)
Price / Earnings Ent’p Value / EBITDA EV / LTM LTM Total LTM Margins
LTM FY18E FY19E LTM FY18E FY19E RevenueRevenue
($M)EBITDA
($M) EBITDA Net Inc.
Outsourced
ACXM Acxiom Corporation 22.71 1,787 1,839 184.6 22.7 18.2 22.5 9.5 8.3 2.0 897 82 9% 1%
CSGS CSG Systems International, Inc. 45.29 1,514 1,585 24.2 16.2 14.9 11.3 8.7 8.2 2.0 790 141 18% 8%
EFX Equifax Inc. 117.81 14,152 16,584 24.4 19.9 18.3 14.9 14.0 12.9 4.9 3,362 1,116 33% 17%
EXLS ExlService Holdings, Inc. 55.77 1,907 1,703 40.1 20.2 18.3 15.3 11.4 10.1 2.2 762 112 15% 6%
FICO Fair Isaac Corporation 169.37 5,093 5,663 46.0 26.7 23.0 26.2 20.6 19.1 6.0 948 216 23% 12%
FIS Fidelity National Information Services, Inc. 96.30 31,893 40,100 24.5 18.6 16.7 16.0 12.8 12.0 4.4 9,123 2,507 27% 14%
FISV Fiserv, Inc. 71.31 29,466 34,041 25.0 22.9 20.3 18.7 16.1 15.2 6.0 5,696 1,788 31% 22%
INTU Intuit Inc. 173.35 44,397 44,774 47.5 31.6 26.2 27.4 20.4 18.6 8.2 5,434 1,637 30% 17%
PRGX PRGX Global, Inc. 9.45 212 206 45.5 49.7 33.8 18.7 8.2 6.9 1.3 162 11 7% 2%
SSNC SS&C Technologies Holdings, Inc. 53.64 11,084 13,065 34.6 23.6 21.1 20.8 17.3 14.6 7.8 1,675 629 38% 20%
Median 8,089 9,364 37.4 22.8 19.3 18.7 13.4 12.5 4.7 1,312 422 25% 13%

© 2018 Mercer Capital // www.mercercapital.com // Source: S&P Global Market Intelligence 9
Mercer Capital’s Value Focus: FinTech IndustryFirst Quarter 2018
@MercerFinTech
Publicly Traded Solutions Companies
Ticker Name3/31/18 Price
Market Cap ($M)
Ent’p Val ($M)
Price / Earnings Ent’p Value / EBITDA EV / LTM LTM Total LTM Margins
LTM FY18E FY19E LTM FY18E FY19E RevenueRevenue
($M)EBITDA
($M) EBITDA Net Inc.
Payroll/Administration
ACIW ACI Worldwide, Inc. 23.72 2,749 3,368 NM 36.5 25.3 18.9 12.8 11.1 3.3 1,024 178 17% 1%
EPAY Bottomline Technologies (de), Inc. 38.75 1,576 1,652 NM 32.0 25.5 39.6 18.0 15.4 4.5 366 42 11% -4%
BR Broadridge Financial Solutions, Inc. 109.69 12,796 13,652 35.2 26.4 23.0 17.3 16.4 15.1 3.2 4,292 794 19% 9%
CDK CDK Global, Inc. 63.34 8,523 10,250 28.2 17.4 13.6 16.2 11.7 10.6 4.6 2,249 633 28% 14%
DBD Diebold Nixdorf, Incorporated 15.40 1,170 2,939 NM 13.2 9.9 9.8 7.4 6.7 0.6 4,609 292 6% -5%
NCR NCR Corporation 31.52 3,737 7,019 31.2 9.4 8.6 7.6 6.1 5.9 1.1 6,516 919 14% 4%
NTWK NetSol Technologies, Inc. 4.60 52 67 NM - - 18.6 - - 1.1 60 4 7% -4%
PEGA Pegasystems Inc. 60.65 4,737 4,513 151.6 50.0 41.8 71.2 32.3 25.9 5.4 841 63 8% 4%
WK Workiva Inc. 23.70 1,009 952 NM NM NM NM NM NM 4.6 208 (39) -19% -21%
Median 2,749 3,368 33.2 21.9 18.3 17.9 12.2 10.8 3.3 1,024 178 11% 1%
Content
CLGX CoreLogic, Inc. 45.23 3,688 5,323 25.8 17.4 15.7 13.9 11.2 10.6 2.9 1,851 385 21% 8%
CSGP CoStar Group, Inc. 362.68 13,091 12,159 99.1 50.8 37.5 47.4 32.2 24.4 12.3 1,012 266 26% 15%
DNB The Dun & Bradstreet Corporation 117.00 4,339 5,591 30.7 14.3 13.7 12.1 10.7 10.4 3.2 1,743 458 26% 8%
FDS FactSet Research Systems Inc. 199.42 7,782 8,092 31.8 22.9 20.8 18.9 17.5 16.3 6.2 1,303 428 33% 19%
TRU TransUnion 56.78 10,441 12,783 24.5 24.6 21.9 18.1 15.5 14.1 6.7 2,016 735 36% 22%
FORR Forrester Research, Inc. 41.45 749 615 49.9 29.3 22.2 17.6 15.3 11.1 1.8 338 35 10% 4%
IT Gartner, Inc. 117.62 10,684 13,424 NM 30.2 25.4 35.1 17.3 15.4 4.1 3,311 382 12% 0%
MORN Morningstar, Inc. 95.52 4,059 3,886 30.0 - - 16.7 - - 4.3 912 235 26% 15%
VRSK Verisk Analytics, Inc. 104.00 17,162 20,025 31.6 26.0 23.5 20.3 17.5 16.1 9.3 2,145 987 46% 26%
Median 7,782 8,092 31.2 24.6 21.9 18.1 15.5 14.1 4.3 1,743 385 26% 15%
Overall Solutions Median 4,538 5,627 31.7 22.9 20.8 18.6 14.0 12.0 4.3 1,489 337 20% 8%
© 2018 Mercer Capital // www.mercercapital.com // Source: S&P Global Market Intelligence 10
Mercer Capital’s Value Focus: FinTech IndustryFirst Quarter 2018
@MercerFinTech
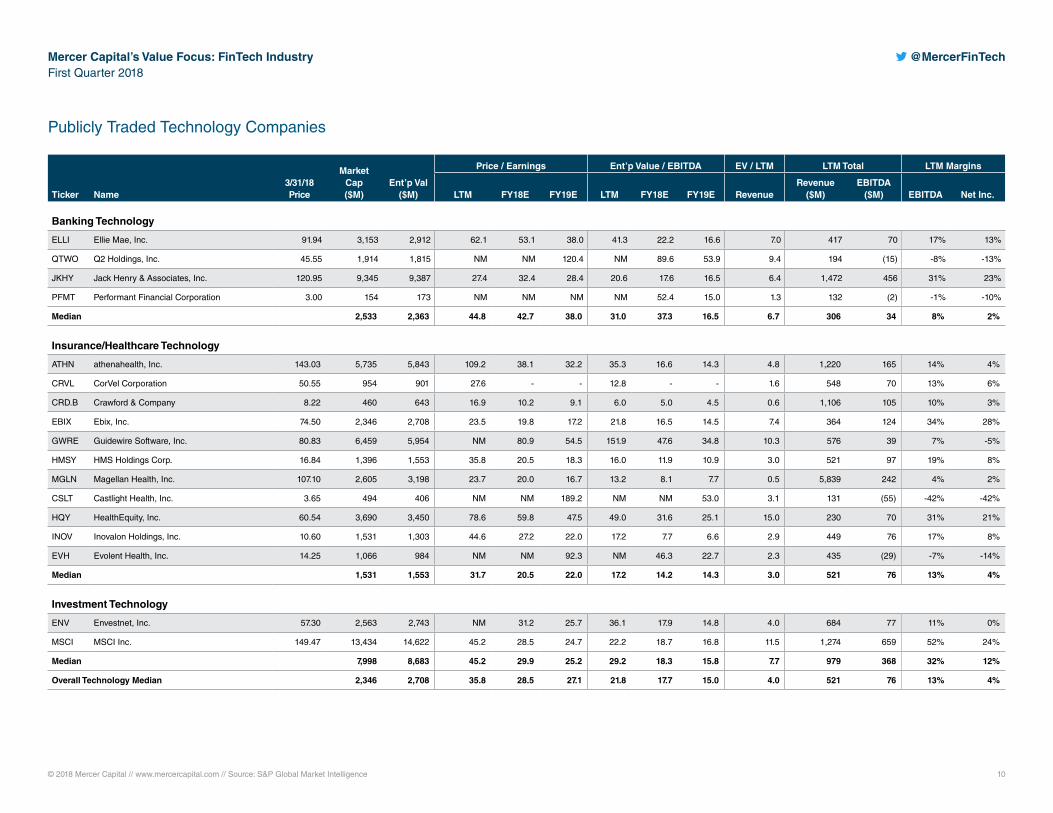
Publicly Traded Technology Companies
Ticker Name3/31/18 Price
Market Cap ($M)
Ent’p Val ($M)
Price / Earnings Ent’p Value / EBITDA EV / LTM LTM Total LTM Margins
LTM FY18E FY19E LTM FY18E FY19E RevenueRevenue
($M)EBITDA
($M) EBITDA Net Inc.
Banking Technology
ELLI Ellie Mae, Inc. 91.94 3,153 2,912 62.1 53.1 38.0 41.3 22.2 16.6 7.0 417 70 17% 13%
QTWO Q2 Holdings, Inc. 45.55 1,914 1,815 NM NM 120.4 NM 89.6 53.9 9.4 194 (15) -8% -13%
JKHY Jack Henry & Associates, Inc. 120.95 9,345 9,387 27.4 32.4 28.4 20.6 17.6 16.5 6.4 1,472 456 31% 23%
PFMT Performant Financial Corporation 3.00 154 173 NM NM NM NM 52.4 15.0 1.3 132 (2) -1% -10%
Median 2,533 2,363 44.8 42.7 38.0 31.0 37.3 16.5 6.7 306 34 8% 2%
Insurance/Healthcare Technology
ATHN athenahealth, Inc. 143.03 5,735 5,843 109.2 38.1 32.2 35.3 16.6 14.3 4.8 1,220 165 14% 4%
CRVL CorVel Corporation 50.55 954 901 27.6 - - 12.8 - - 1.6 548 70 13% 6%
CRD.B Crawford & Company 8.22 460 643 16.9 10.2 9.1 6.0 5.0 4.5 0.6 1,106 105 10% 3%
EBIX Ebix, Inc. 74.50 2,346 2,708 23.5 19.8 17.2 21.8 16.5 14.5 7.4 364 124 34% 28%
GWRE Guidewire Software, Inc. 80.83 6,459 5,954 NM 80.9 54.5 151.9 47.6 34.8 10.3 576 39 7% -5%
HMSY HMS Holdings Corp. 16.84 1,396 1,553 35.8 20.5 18.3 16.0 11.9 10.9 3.0 521 97 19% 8%
MGLN Magellan Health, Inc. 107.10 2,605 3,198 23.7 20.0 16.7 13.2 8.1 7.7 0.5 5,839 242 4% 2%
CSLT Castlight Health, Inc. 3.65 494 406 NM NM 189.2 NM NM 53.0 3.1 131 (55) -42% -42%
HQY HealthEquity, Inc. 60.54 3,690 3,450 78.6 59.8 47.5 49.0 31.6 25.1 15.0 230 70 31% 21%
INOV Inovalon Holdings, Inc. 10.60 1,531 1,303 44.6 27.2 22.0 17.2 7.7 6.6 2.9 449 76 17% 8%
EVH Evolent Health, Inc. 14.25 1,066 984 NM NM 92.3 NM 46.3 22.7 2.3 435 (29) -7% -14%
Median 1,531 1,553 31.7 20.5 22.0 17.2 14.2 14.3 3.0 521 76 13% 4%
Investment Technology
ENV Envestnet, Inc. 57.30 2,563 2,743 NM 31.2 25.7 36.1 17.9 14.8 4.0 684 77 11% 0%
MSCI MSCI Inc. 149.47 13,434 14,622 45.2 28.5 24.7 22.2 18.7 16.8 11.5 1,274 659 52% 24%
Median 7,998 8,683 45.2 29.9 25.2 29.2 18.3 15.8 7.7 979 368 32% 12%
Overall Technology Median 2,346 2,708 35.8 28.5 27.1 21.8 17.7 15.0 4.0 521 76 13% 4%

BUSINESS VALUATION & FINANCIAL ADVISORY SERVICES
Memphis
5100 Poplar Avenue, Suite 2600Memphis, Tennessee 38137
901.685.2120
Dallas
12201 Merit Drive, Suite 480Dallas, Texas 75251
214.468.8400
Nashville
102 Woodmont Blvd., Suite 231Nashville, Tennessee 37205
615.345.0350
www.mercercapital.com