value chain analysis - pubs.iclarm.netpubs.iclarm.net/resource_centre/wf_3575.pdf · value chain...
TRANSCRIPT

VALUE CHAIN ANALYSISSHRIMP, PRAWN and TILAPIA from the SOUTHERN REGION of BANGLADESH&FEASIBILITY ANALYSISBRACKISH WATER SEA-BASS in the SOUTHERN REGION in BANGLADESHOctober 2012

| 2
Acknowledgement .................................................................................................................................................................................... 5
Abbreviations ............................................................................................................................................................................................ 6
Executive Summary .................................................................................................................................................................................. 7
Introduction ............................................................................................................................................................................................. 13
Methodology ........................................................................................................................................................................................... 15
Chapter 2: Methodology ........................................................................................................................................................................ 15
2.1 Secondary Literature Review .......................................................................................................................................................... 15
2.2 In Depth Qualitative Study .............................................................................................................................................................. 15
2.3 Quantitative Study ............................................................................................................................................................................ 16
2.4 Location of the Study ....................................................................................................................................................................... 17
CHAPTER 3: SHRIMP AND PRAWN VALUE CHAIN ................................................................................................................................ 18
3.1 End Market Analysis ......................................................................................................................................................................... 18
3.1.1 Main markets and market trends ................................................................................................................................................ 18
3.2.2 Competition, Market Prospects and Challenges ....................................................................................................................... 20
3.2 Production Trends in the Southern Region ................................................................................................................................... 20
3.2.1 Species............................................................................................................................................................................................. 21
3.2.2 Regional distribution of production, growth trends and opportunities for expansion ....................................................... 21
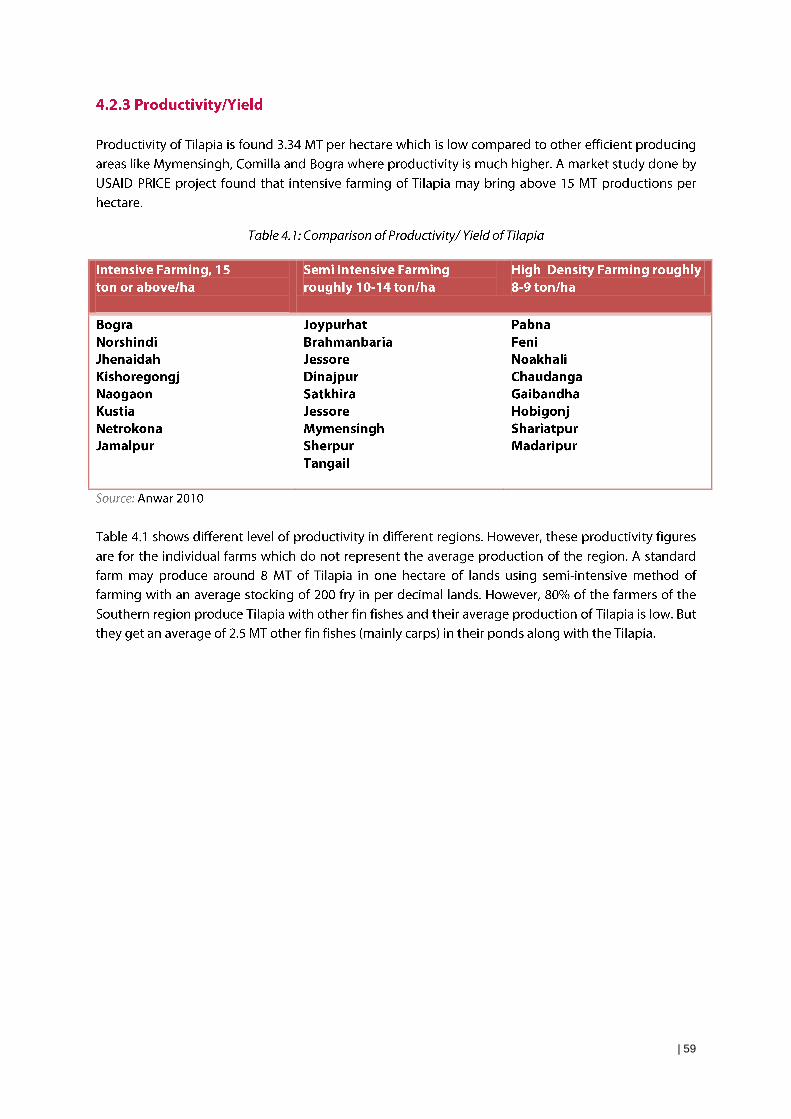
3.2.3 Productivity/Yield .......................................................................................................................................................................... 24
3.3 Description of the Value Chain ........................................................................................................................................................ 25
3.3.1 Functions, Actors and their Roles ................................................................................................................................................ 25
3.3.2 Vertical and Horizontal Integration ............................................................................................................................................. 28
3.3.3 Involvement of Women ................................................................................................................................................................ 28
3.4 Value Chain Performance and Scope for Upgrading ................................................................................................................... 33
3.3.1 Brood Collection, PL Supply and Nursing ................................................................................................................................... 33
3.3.2 Supply and Use of Feed and Aqua-chemical ............................................................................................................................. 36
3.3.3 Grow-out ......................................................................................................................................................................................... 37
3.3.4 Trading, Processing and Exporting ............................................................................................................................................. 39
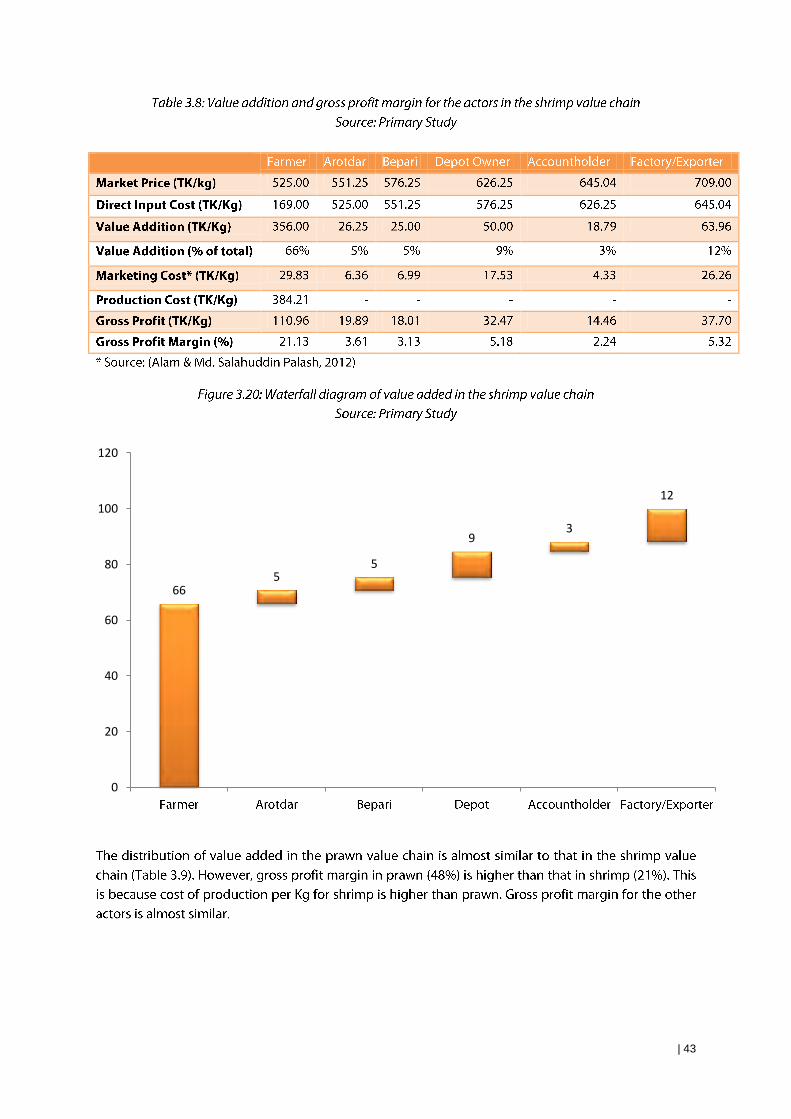
3.3.4 Margins and Value Added ............................................................................................................................................................ 42
3.4 Assessment of Business and Financial Services ............................................................................................................................ 45
3.4.1 Research .......................................................................................................................................................................................... 45
3.4.2 Quality assurance and certification ............................................................................................................................................. 45
3.4.3 Training and Information on Technical Issues ........................................................................................................................... 45
Table of Content Table of Content

| 3
3.4.4 Cooperative, group and associations .......................................................................................................................................... 45
3.4.5 Market/ business information ...................................................................................................................................................... 46
3.4.6 Transportation and Packaging ..................................................................................................................................................... 46
3.6.7 Access to Finance ........................................................................................................................................................................... 47
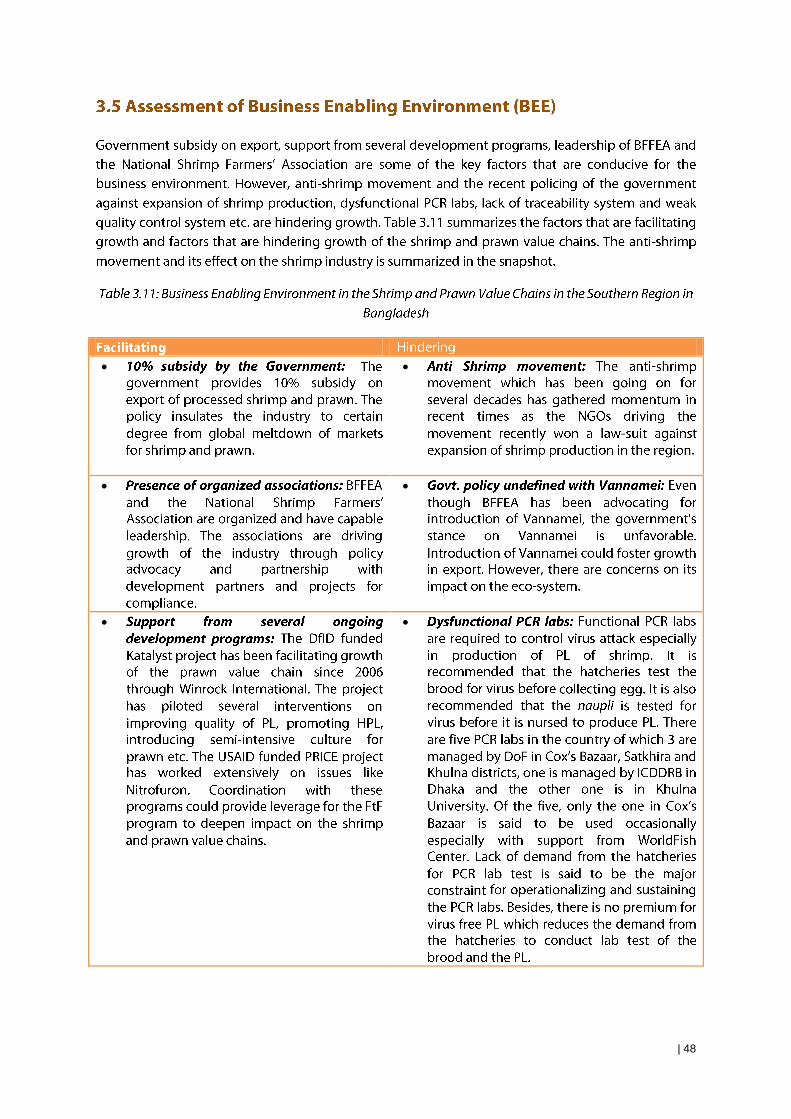
3.5 Assessment of Business Enabling Environment (BEE) ................................................................................................................. 48
3.6 SWOT Analysis ................................................................................................................................................................................... 50
3.6.1 SWOT for Shrimp Value Chain ...................................................................................................................................................... 50
3.6.2 SWOT for Prawn Value Chain ....................................................................................................................................................... 51
3.7 Summary of Constraints................................................................................................................................................................... 53
3.7.1 Constraints in the Shrimp Value Chain ....................................................................................................................................... 53
3.7.2 Constraints in the Prawn Value Chain ......................................................................................................................................... 53
3.8 Recommendations ............................................................................................................................................................................ 54
3.8.1 Value Chain Upgrading Strategy for Shrimp Value Chain ........................................................................................................ 54
3.8.1 Value Chain Upgrading Strategy for Prawn Value Chain ......................................................................................................... 54
CHAPTER 4: TILAPIA VALUE CHAIN ....................................................................................................................................................... 56
4.1 End Market Analysis ......................................................................................................................................................................... 56
4.1.1 Main markets and buyers ............................................................................................................................................................. 56
4.1.2 Market Prospect ............................................................................................................................................................................. 56
4.2 Production Trends ............................................................................................................................................................................ 57
4.2.1 Species............................................................................................................................................................................................. 57
4.2.2 Regional distribution, growth trends, and opportunities for expansion ............................................................................... 58
4.2.3 Productivity/Yield .......................................................................................................................................................................... 59
4.3 Description of the Value Chain ........................................................................................................................................................ 60
4.3.1 Functions, Actors and their Roles ................................................................................................................................................ 60
4.3 Value Chain performance ................................................................................................................................................................ 61
4.3.1 Hatchery, Nursery and Fry Traders .............................................................................................................................................. 61
4.3.2 Feeding practice, Aqua-Chemicals and other Inputs................................................................................................................ 62
4.3.3 Grow out ......................................................................................................................................................................................... 63
4.3.4 Trading ............................................................................................................................................................................................ 64
4.4.5 Channels ......................................................................................................................................................................................... 64
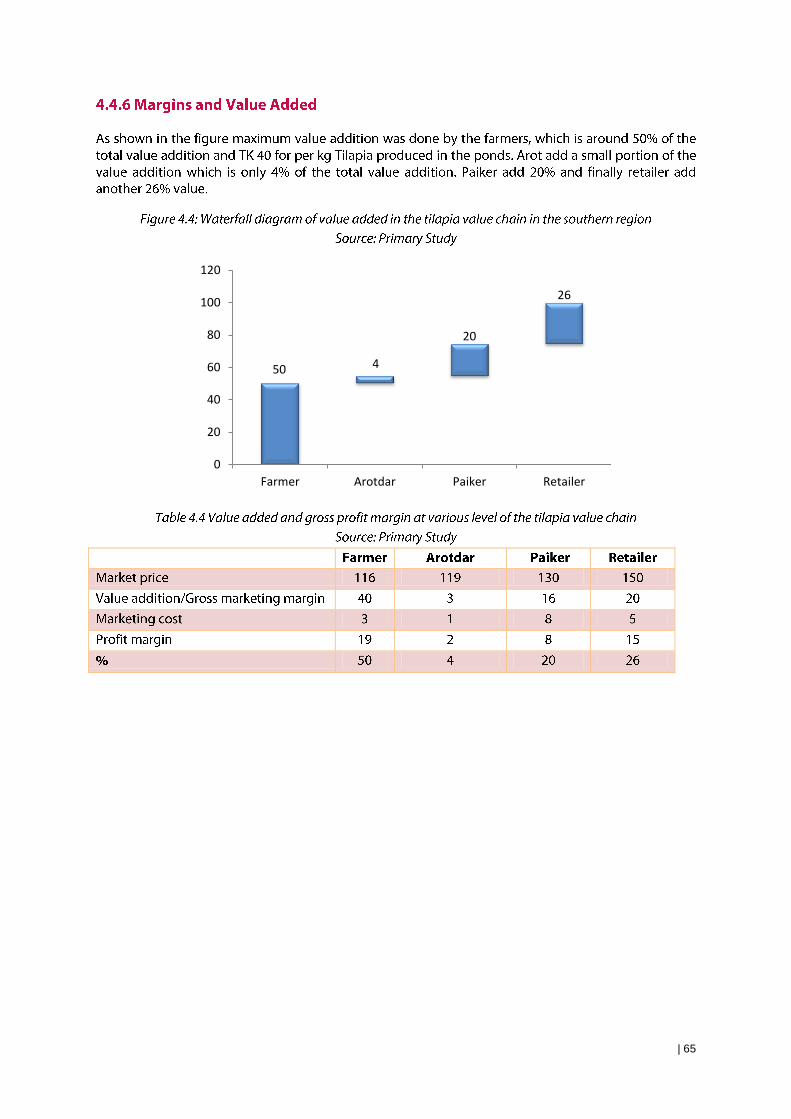
4.4.6 Margins and Value Added ............................................................................................................................................................ 65
4.4 Assessment of Business and Financial Services ............................................................................................................................ 67
4.4.1 Research .......................................................................................................................................................................................... 67
4.6.2 Quality assurance and certification ............................................................................................................................................. 67
4.6.3 Training ........................................................................................................................................................................................... 67
4.6.4 Cooperative, group and associations .......................................................................................................................................... 67

| 4
4.6.5 Market/ business information ...................................................................................................................................................... 68
4.6.6 Transportation and Packaging ..................................................................................................................................................... 68
4.5 Assessment of Business Enabling Environment ........................................................................................................................... 68
4.6 Involvement of Women ................................................................................................................................................................... 69
4.7 SWOT Analysis ................................................................................................................................................................................... 70
4.8 Summary of Constraints................................................................................................................................................................... 71
4.9 Recommendations ............................................................................................................................................................................ 72
Chapter 5: Feasibility of Commercial Culture of Brackish Water Sea-Bass ...................................................................................... 73
5.1 Overview ............................................................................................................................................................................................ 73
5.2 Market Prospect ................................................................................................................................................................................ 73
5.2.1 Favorable demand in the domestic market ............................................................................................................................... 73
5.2.2 Higher market price ....................................................................................................................................................................... 74
5.3 Production prospect ......................................................................................................................................................................... 74
5.3.1 Higher profitability than whitefish and Tilapia ......................................................................................................................... 74
5.3.2 Suitable ecosystem for sea-bass production in South-Eastern region ................................................................................... 75
5.3 Comparative advantage / disadvantage ....................................................................................................................................... 75
5.4 Farmers’ capacity for sea-bass culture ........................................................................................................................................... 76
5.5.1 Affordability .................................................................................................................................................................................... 76
5.5.2 Knowledge about culture ............................................................................................................................................................. 76
5.5.3 Site suitability ................................................................................................................................................................................. 77
5.5 Current Practices for Culture ........................................................................................................................................................... 77
5.6 Recommendation ............................................................................................................................................................................. 79
BIBLIOGRAPHY ......................................................................................................................................................................................... 80
| 5
Photo: Innovision
Acknow
ledgement
Acknowledgement

| 6
Abbreviations
Abbreviations

| 7
Executive Summ
ary
Executive Summary

| 8

| 9

| 10
| 11

| 12

| 13
CHA
PTER 1: INTRO
DU
CTION
Introduction
| 14

| 15
HA
PTER 2: METH
OD
OLO
GY
C
METHODOLOGY

| 16

| 17

| 18
CHA
PTER 3: SHRIM
P AN
D PRA
WN
VALU
E CHA
IN
SHRIMP AND PRAWN VALUE CHAIN

| 19

| 20

| 21
Chittagong Southern National
17269 MT
38244 MT
55513 MT

| 22

| 23
Fari
dp
ur
Go
pal
gan
j
Mad
arip
ur
Pat
uak
hal
i
Bo
rgu
na
Bar
isal
Bh
ola
Pir
ojp
ur
Jhal
akh
ati
Jess
ore
Jhe
nai
dah
Kh
uln
a
Mag
ura
Nar
ail
Satk
hir
a
Bag
erh
at
6 1178
46
1980
139 357 25 766
16
7525
1
8409
5 1165
5231
12829

| 24

| 25

| 26

| 27

| 28

| 29

| 30

| 31
Figure 3.9: Shrimp Value Chain in the Southern Region in Bangladesh
Source: Primary Study
Involvement of Women
High
Medium
Low
PL
an
d O
the
r
inp
ut sup
ply
Gro
w-o
ut
Tra
din
g
Pro
cessin
g
an
d E
xp
ort
En
d
Ma
rke
t
Fertilizer& Chemical Retailer
(3200)
Brood Supplier (100) 35000 brood/yr
Large Farmer (5200)
35000 MT
Small Farmer
(4300)
6000 MT
Hatchery (60)
National-7billion PL/yr
Southern region-5.9
billion/yr
Faria or Small
trader (2400)
1800 MT
Bepari or Large (3000) Trader-
29000 MT
Dep
ot-
(1
00
0)
31
00
0 M
T
Arotdar or Commission
Agent (500)
25000 MT
Account Holder (19) 40000 MT
Factory or processing plant (149)
40000 MT
Local Market
1500 MT
International Market
31000 MT (headless)
100
%
100
%
100
%
5%
84
%
Bro
od
supply
Nurs
ing
16
%
80
%
20
%
30
%
30%
65%
70%
30%
100
%
100
%
70
%

| 32
Figure 3.10: Prawn Value Chain in the Southern Region in Bangladesh
Source: Primary Study
60%
PL a
nd O
ther
inpu
t supp
ly
Nurs
ing a
nd
Gro
w-
out
Tra
din
g
Pro
cessin
g
and E
xport
End
Mark
et
Feed, Fertilizer & Chemical Retailer (3200) (80,000 MT Feed)
Brood Supplier (100) 15000 brood/yr
Medium and Large Farmer (greater than
1ha)(23,000)
20,000 MT
)
Small Farmer
(less than 1ha)
(64,000)
12,000 MT
Hatchery (30)
50 million
Faria or Small
trader (2400)
3600 MT
Bepari or Large Trader (3000)
26000 MT
Same bepari serve the shrimp value chain
Dep
ot-
(1
00
0)
21
,00
0 M
T
Sam
e d
ep
ots
se
rve
th
e s
hri
mp
val
ue
ch
ain
Arotdar or Commission
Agent (500) 26,000 MT
Same arotdar serve the shrimp value chain
Account Holder (19) 26,000 MT
Same account holder serve the shrimp value chain
Factory or processing plant (149)
26,000 MT *Same processors serve the shrimp value chain
Local Market
5,000 MT(head on)
International Market
14,000(headless)
100
%
100
%
100
%
20%
51%
Bro
od
supply
62%
49% 38%
70%
20%
100
%
100
%
PL Trader (1200)
900 million Wild PL
Paikar/wholesalers(10
0)
850 million PL
Wild PL Accumulator (500)
Southern-500 million PL
Others-350 million PL
Wild PL collector (350,000)
Southern-500 million PL
Others-350 million PL
100% 100%
100%
70
%
30%
100%
30%
Involvement of Women
High-
Medium-
Low-
100%

| 33
Satisfied Not satisfied
41% 59%
80%
20%
Shrimp Prawn

| 34
-
-
High mortality Low quality PL Not availablewhen needed
14%
86%
0%
20%
60%
20%
Shrimp Prawn

| 35
Lowmortality
rate
Highgrowth rate
Less diseaseprone
Bigger PLSize
UniformSize
86%
21%
57%
14%
79%
41% 35%
14% 22%
49%
Shrimp Prawn
Figure 3.12: Quality parameters for shrimp and prawn PL for the
farmers
Source: Primary Study

| 36
Supplementaryfeed (factory made)
Local feed (fromfeed crushers)
Do not use any feed Supplementary andlocal feed
0 0
100%
0
30% 22%
0
48%
Shrimp Prawn

| 37
Shrimp Prawn
45%
74%
55%
26%
Shrimp Prawn
15%
40%
85%
60%

| 38

| 39

| 40

| 41

| 42
At most450
451-500 501-550 551-600 600+
7%
52%
10%
21%
14%
Atmost700
701-800 801-900 901-1000 1000+
21%
5%
18%
48%
10%
| 43
66 5
5
9 3
12
0
20
40
60
80
100
120

| 44

| 45
| 46

| 47
| 48

| 49

| 50
-
-
-
-
-
-
-
-
-
-
-
-
-
-
-
-
-
-
-
-
-
-
-
-
-
-
-
-
-

| 51
-
-
-
-
-
-
-
-
-
-
-
-
-
-
-
-
-
-
-
-
-
-
-
-
-
-

| 52
-
-
-
-
-
-
-
-
-
-
-
-
-
-
-
-
-
-
-
-
-
-
-
-
-

| 53

| 54
- -
-
-
-
- - -
-
-
- -
- -
-
-
-

| 55
-
-
- - -
-
-
- -

| 56
CHA
PTER 4: TILAPIA
VALU
E CHA
IN
TILAPIA VALUE CHAIN

| 57

| 58
30 790 2,963
2,963
3,536
1,027
1,007 1,975
12,641
7,160
Faridpur Madaripur Borguna
Barisal Jessore Jhenaidah
Kustia Magura Satkhira
Chuadanga
| 59

| 60

| 61

| 62
21
3
17
38 34
27 23 23
36 36
Small farmer Large farmer

| 63
8%
79%
1%
3% 4% 5%

| 64
Farmer Rural Arots Rural Paiker Rural Retailer Consumer
Farmer Rural Arots Rural Paiker
Urban Paiker
Urban Retailer
Consumer
| 65
50 4
20
26
0
20
40
60
80
100
120
Farmer Arotdar Paiker Retailer

| 66

| 67
Among the respondents only
15% of the small farmers feel
the need of training whereas
50% of the large farmers feel
the same. One of the important
reasons behind the
unwillingness of the small
farmers is that they feel the
technological up-gradation
would need more capital
incentive technology which is
true in many cases

| 68

| 69

| 70
-
-
-
-
-
-
-
-
-
-
-
-
-
-
-
-
-
-
-
-
-
-
-
-
-
-
-
-
-
-
-
-

| 71
| 72
-
-
-
- -
-
-
- -
-
-
-

| 73
CHA
PTER 5: FEASIBILITY O
F COM
MERCIA
L CULTU
RE OF BRA
CKISH W
ATER SEA
-BASS
Feasibility of Commercial Culture
of Brackish Water Sea-Bass

| 74

| 75

| 76
| 77
-
-
-

| 78

| 79

| 80
BIBLIOG
RAPH
Y
BIBLIOGRAPHY

| 81