!valuation:!dreams!and! delusions! - nyu
TRANSCRIPT
VALUATION: DREAMS AND DELUSIONS Aswath Damodaran h:p://www.damodaran.com
Aswath Damodaran 1
2
Intrinsic Value: Three Basic ProposiEons
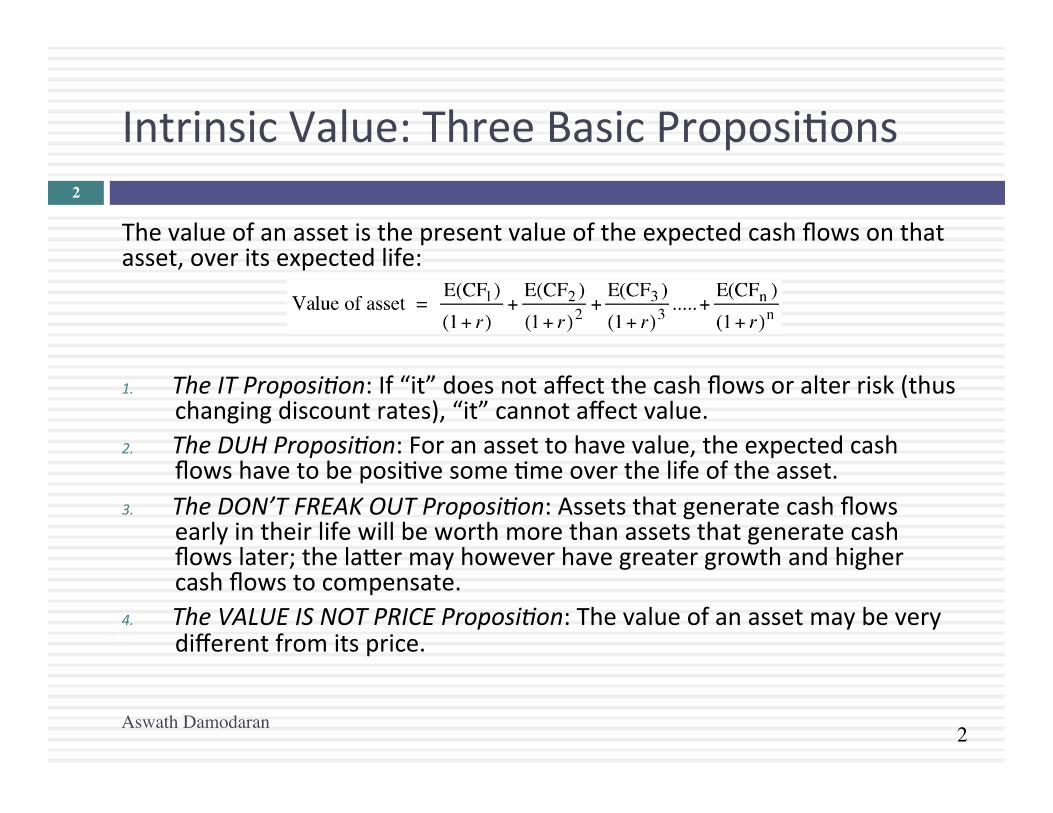
The value of an asset is the present value of the expected cash flows on that asset, over its expected life:
1. The IT Proposi.on: If “it” does not affect the cash flows or alter risk (thus
changing discount rates), “it” cannot affect value. 2. The DUH Proposi.on: For an asset to have value, the expected cash
flows have to be posiEve some Eme over the life of the asset. 3. The DON’T FREAK OUT Proposi.on: Assets that generate cash flows
early in their life will be worth more than assets that generate cash flows later; the la:er may however have greater growth and higher cash flows to compensate.
4. The VALUE IS NOT PRICE Proposi.on: The value of an asset may be very different from its price.
Aswath Damodaran
2
3
Price versus Value
Aswath Damodaran
3
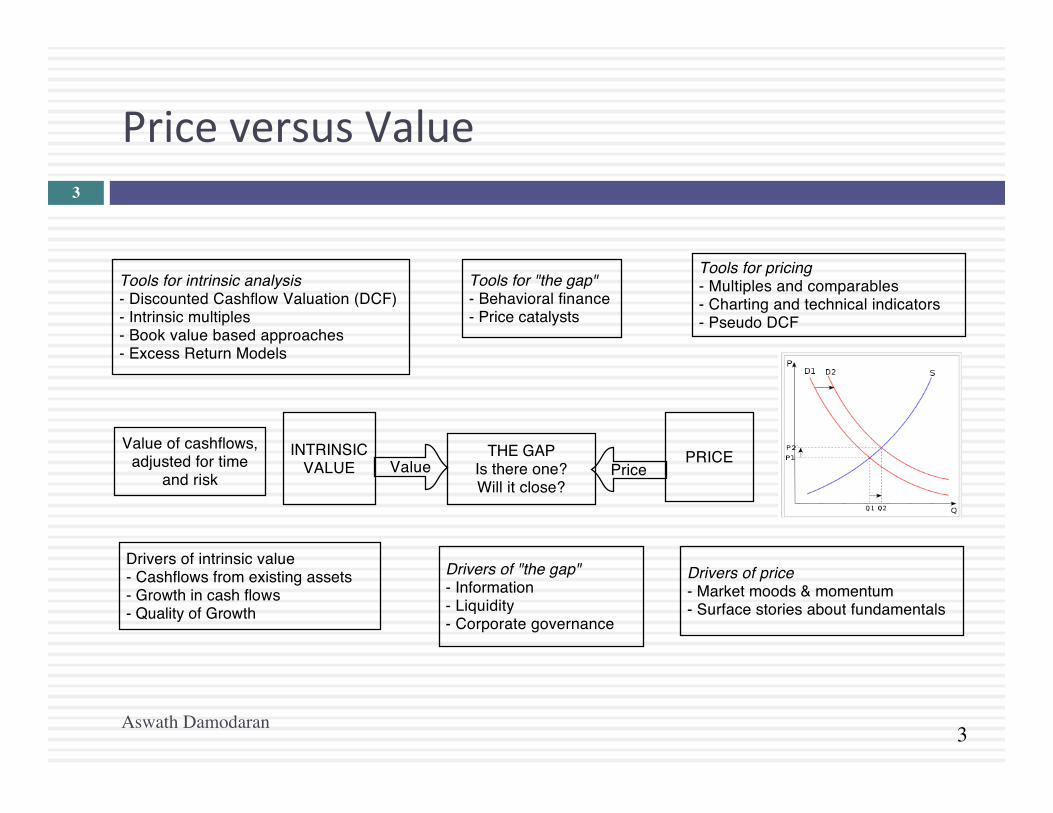
INTRINSIC VALUE PRICEValue Price
THE GAPIs there one?Will it close?
Drivers of intrinsic value- Cashflows from existing assets- Growth in cash flows- Quality of Growth
Drivers of price- Market moods & momentum- Surface stories about fundamentals
Tools for pricing- Multiples and comparables- Charting and technical indicators- Pseudo DCF
Tools for intrinsic analysis- Discounted Cashflow Valuation (DCF)- Intrinsic multiples- Book value based approaches- Excess Return Models
Tools for "the gap"- Behavioral finance- Price catalysts
Drivers of "the gap"- Information- Liquidity- Corporate governance
Value of cashflows, adjusted for time
and risk
4
The traditional accounting balance sheet…
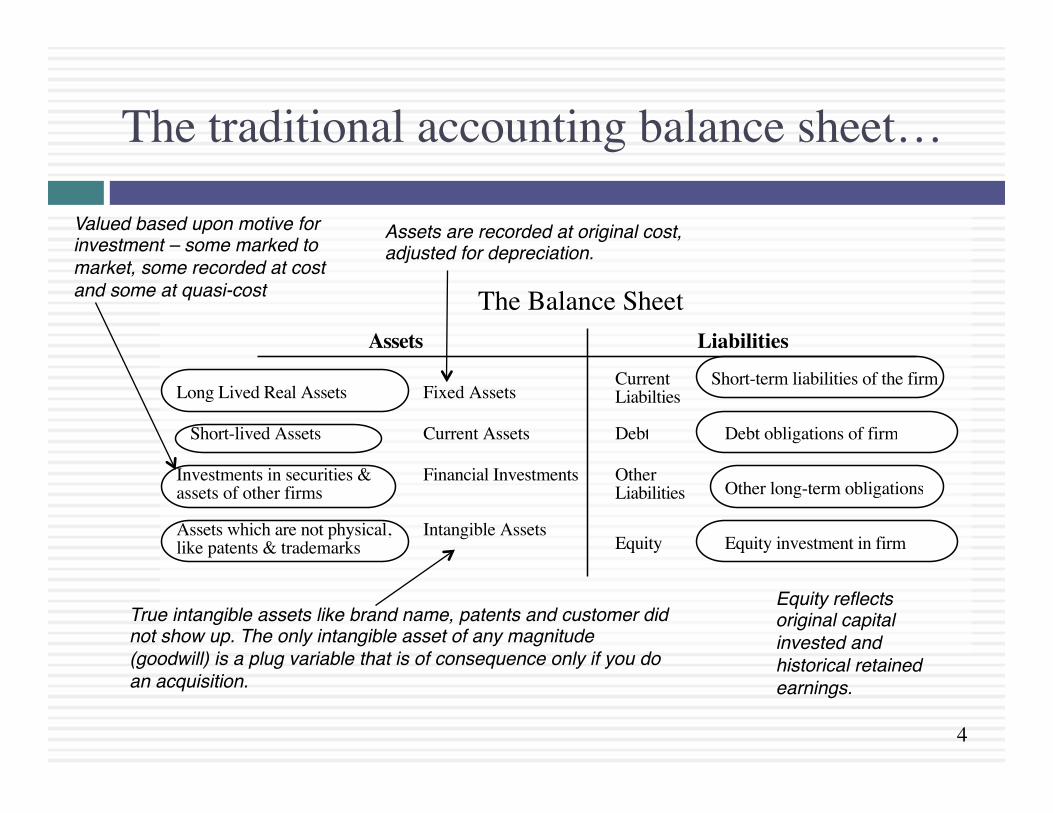
Assets Liabilities
Fixed Assets
Debt
Equity
Short-term liabilities of the firm
Intangible Assets
Long Lived Real Assets
Assets which are not physical,like patents & trademarks
Current Assets
Financial InvestmentsInvestments in securities &assets of other firms
Short-lived Assets
Equity investment in firm
Debt obligations of firm
Current Liabilties
Other Liabilities Other long-term obligations
The Balance Sheet
Assets are recorded at original cost, adjusted for depreciation. "
True intangible assets like brand name, patents and customer did not show up. The only intangible asset of any magnitude (goodwill) is a plug variable that is of consequence only if you do an acquisition."
Valued based upon motive for investment – some marked to market, some recorded at cost and some at quasi-cost "
Equity reflects original capital invested and historical retained earnings. "
5
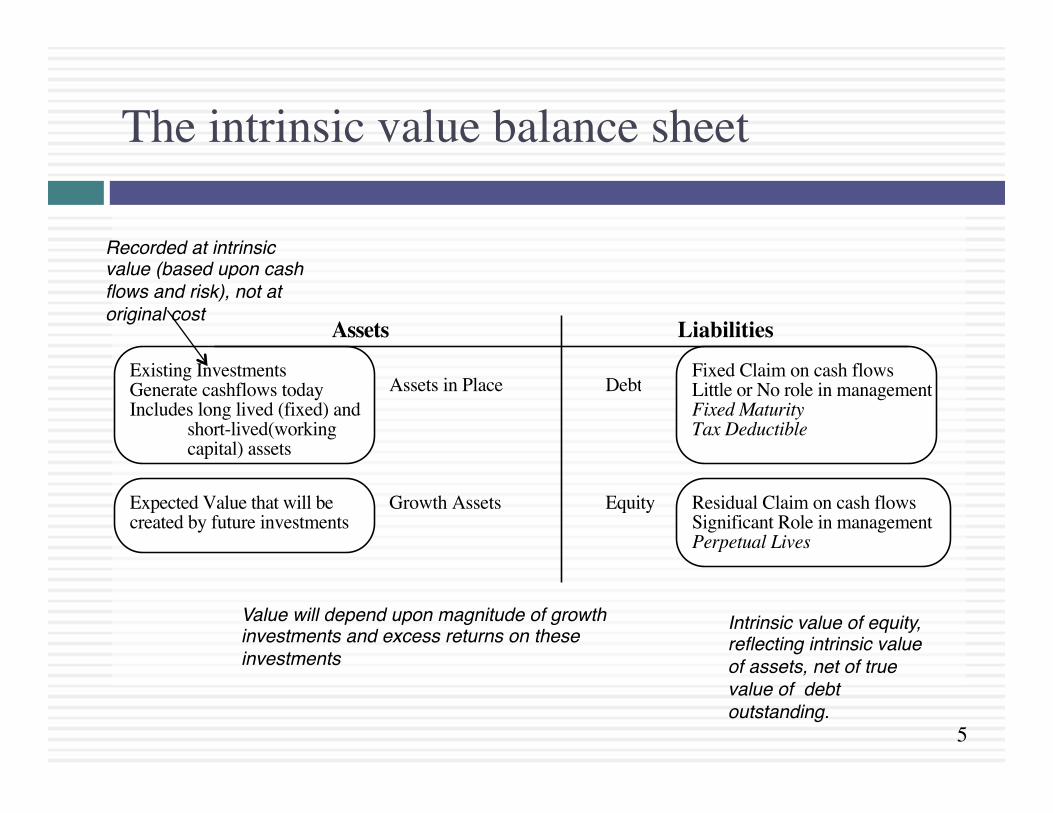
The intrinsic value balance sheet
Assets Liabilities
Assets in Place Debt
Equity
Fixed Claim on cash flowsLittle or No role in managementFixed MaturityTax Deductible
Residual Claim on cash flowsSignificant Role in managementPerpetual Lives
Growth Assets
Existing InvestmentsGenerate cashflows todayIncludes long lived (fixed) and
short-lived(working capital) assets
Expected Value that will be created by future investments
Recorded at intrinsic value (based upon cash flows and risk), not at original cost"
Value will depend upon magnitude of growth investments and excess returns on these investments"
Intrinsic value of equity, reflecting intrinsic value of assets, net of true value of debt outstanding."
6
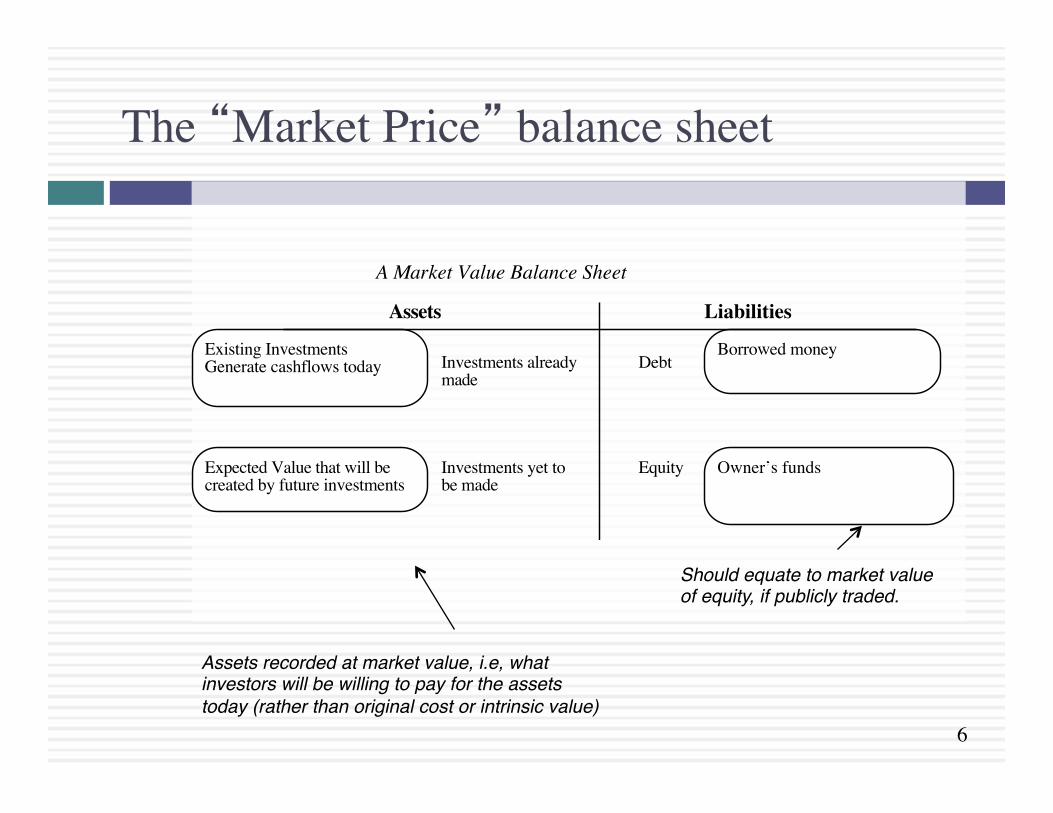
The “Market Price” balance sheet
Assets Liabilities
Investments alreadymade
Debt
Equity
Borrowed money
Owner’s fundsInvestments yet tobe made
Existing InvestmentsGenerate cashflows today
Expected Value that will be created by future investments
A Market Value Balance Sheet
Assets recorded at market value, i.e, what investors will be willing to pay for the assets today (rather than original cost or intrinsic value)"
Should equate to market value of equity, if publicly traded."
7
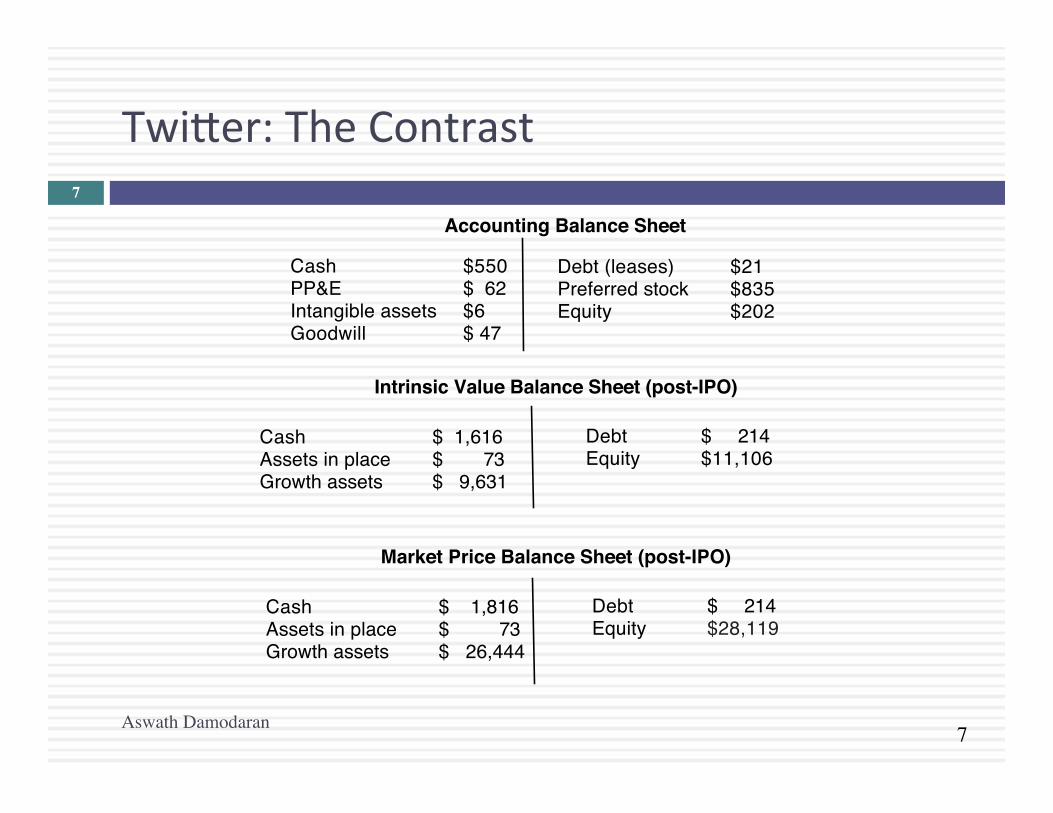
Twi:er: The Contrast
Aswath Damodaran
7
Cash $550PP&E $ 62Intangible assets $6Goodwill $ 47
Debt (leases) $21Preferred stock $835Equity $202
Accounting Balance Sheet
Intrinsic Value Balance Sheet (post-IPO)
Cash $ 1,616Assets in place $ 73Growth assets $ 9,631
Debt $ 214Equity $11,106
Market Price Balance Sheet (post-IPO)
Cash $ 1,816Assets in place $ 73Growth assets $ 26,444
Debt $ 214Equity $28,119
8
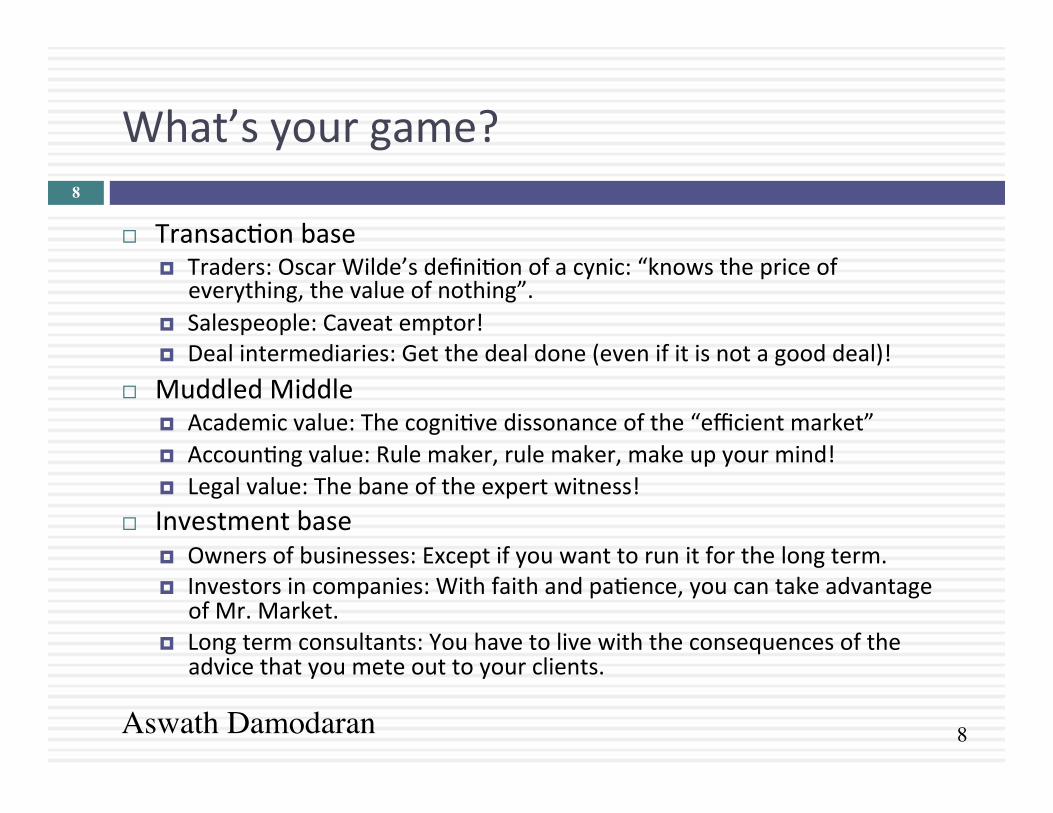
What’s your game?
¨ TransacEon base ¤ Traders: Oscar Wilde’s definiEon of a cynic: “knows the price of
everything, the value of nothing”. ¤ Salespeople: Caveat emptor! ¤ Deal intermediaries: Get the deal done (even if it is not a good deal)!
¨ Muddled Middle ¤ Academic value: The cogniEve dissonance of the “efficient market” ¤ AccounEng value: Rule maker, rule maker, make up your mind! ¤ Legal value: The bane of the expert witness!
¨ Investment base ¤ Owners of businesses: Except if you want to run it for the long term. ¤ Investors in companies: With faith and paEence, you can take advantage
of Mr. Market. ¤ Long term consultants: You have to live with the consequences of the
advice that you mete out to your clients.
Aswath Damodaran
8
9
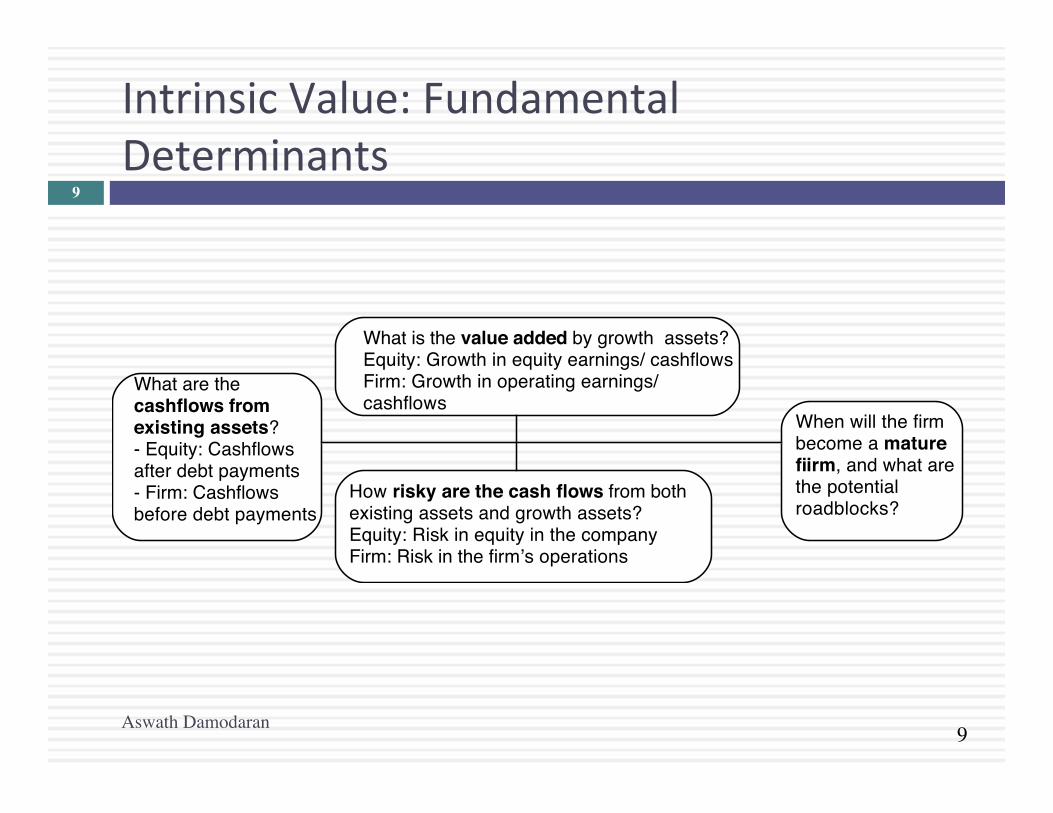
Intrinsic Value: Fundamental Determinants
What are the cashflows from existing assets?- Equity: Cashflows after debt payments- Firm: Cashflows before debt payments
What is the value added by growth assets?Equity: Growth in equity earnings/ cashflowsFirm: Growth in operating earnings/ cashflows
How risky are the cash flows from both existing assets and growth assets?Equity: Risk in equity in the companyFirm: Risk in the firm’s operations
When will the firm become a mature fiirm, and what are the potential roadblocks?
Aswath Damodaran
9
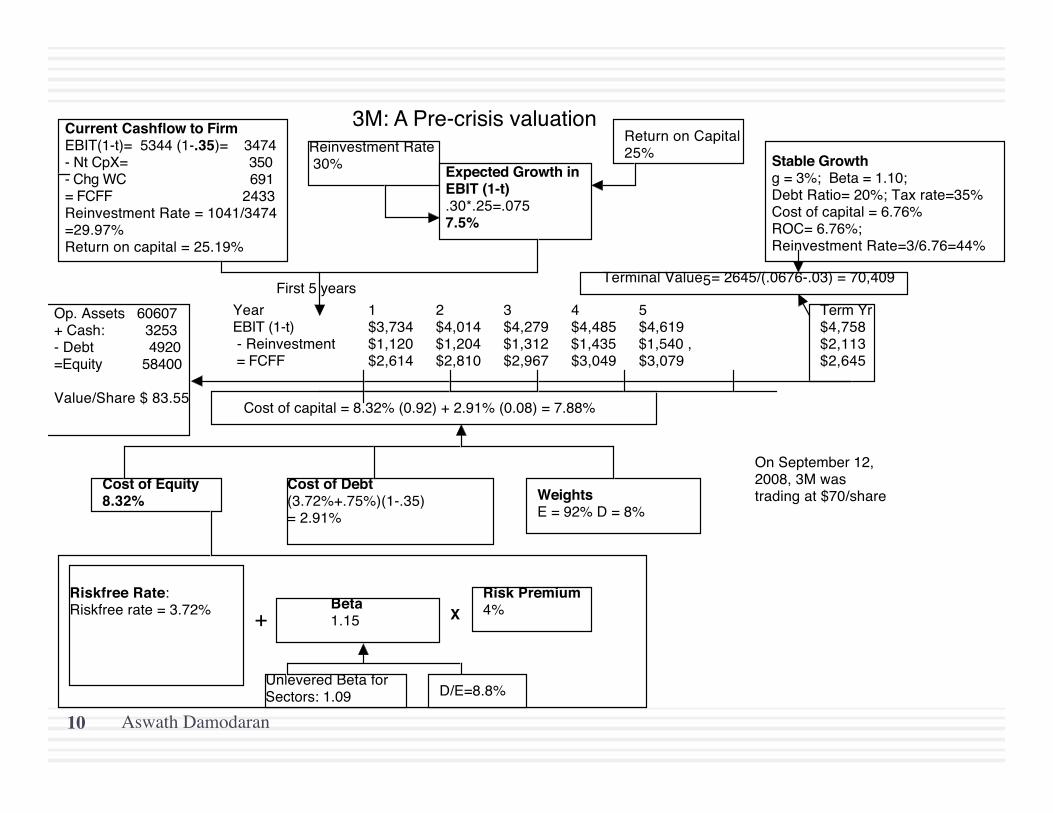
Current Cashflow to FirmEBIT(1-t)= 5344 (1-.35)= 3474- Nt CpX= 350 - Chg WC 691= FCFF 2433Reinvestment Rate = 1041/3474 =29.97%Return on capital = 25.19%
Expected Growth in EBIT (1-t).30*.25=.0757.5%
Stable Growthg = 3%; Beta = 1.10;Debt Ratio= 20%; Tax rate=35%Cost of capital = 6.76% ROC= 6.76%; Reinvestment Rate=3/6.76=44%
Terminal Value5= 2645/(.0676-.03) = 70,409
Cost of Equity8.32%
Cost of Debt(3.72%+.75%)(1-.35)= 2.91%
WeightsE = 92% D = 8%
Op. Assets 60607+ Cash: 3253- Debt 4920=Equity 58400
Value/Share $ 83.55
Riskfree Rate:Riskfree rate = 3.72% +
Beta 1.15 X
Risk Premium4%
Unlevered Beta for Sectors: 1.09
3M: A Pre-crisis valuationReinvestment Rate 30%
Return on Capital25%
Term Yr$4,758$2,113$2,645
On September 12, 2008, 3M was trading at $70/share
First 5 years
D/E=8.8%
Cost of capital = 8.32% (0.92) + 2.91% (0.08) = 7.88%
Year 1 2 3 4 5EBIT (1-t) $3,734 $4,014 $4,279 $4,485 $4,619 - Reinvestment $1,120 $1,204 $1,312 $1,435 $1,540 , = FCFF $2,614 $2,810 $2,967 $3,049 $3,079
Aswath Damodaran 10
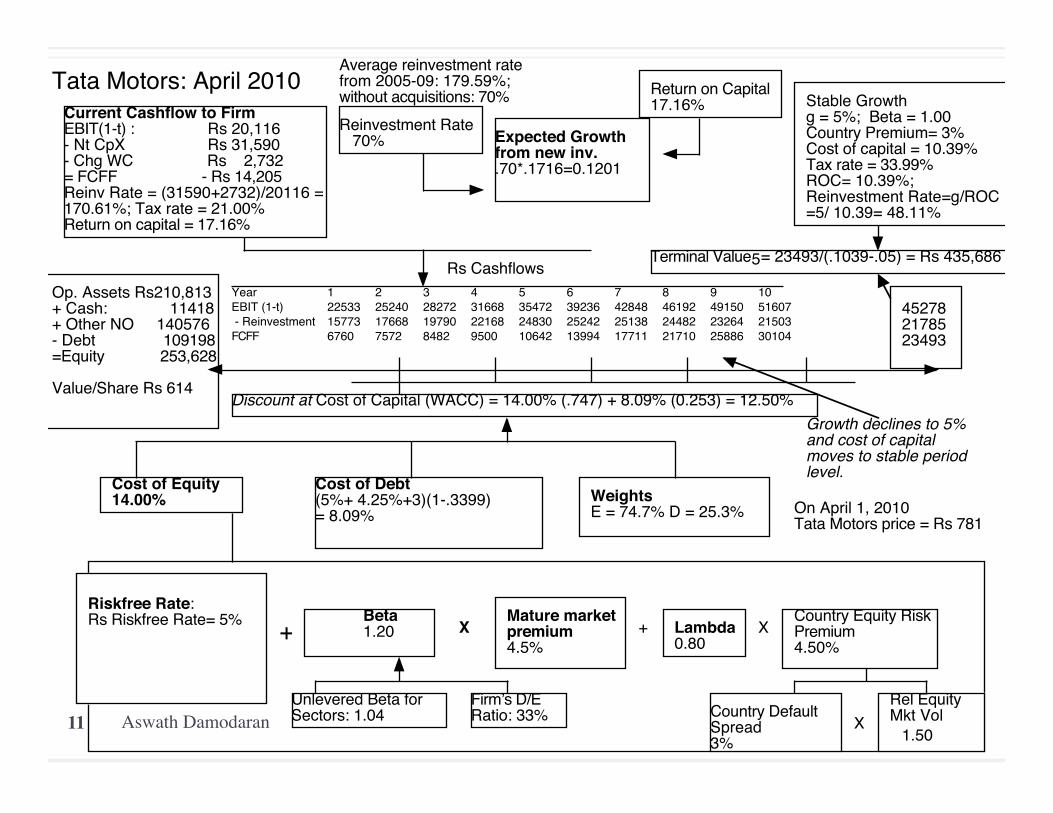
Current Cashflow to FirmEBIT(1-t) : Rs 20,116- Nt CpX Rs 31,590 - Chg WC Rs 2,732= FCFF - Rs 14,205Reinv Rate = (31590+2732)/20116 = 170.61%; Tax rate = 21.00%Return on capital = 17.16%
Expected Growth from new inv..70*.1716=0.1201
Stable Growthg = 5%; Beta = 1.00Country Premium= 3%Cost of capital = 10.39%Tax rate = 33.99% ROC= 10.39%; Reinvestment Rate=g/ROC =5/ 10.39= 48.11%
Terminal Value5= 23493/(.1039-.05) = Rs 435,686
Cost of Equity14.00%
Cost of Debt(5%+ 4.25%+3)(1-.3399)= 8.09%
WeightsE = 74.7% D = 25.3%
Discount at Cost of Capital (WACC) = 14.00% (.747) + 8.09% (0.253) = 12.50%
Op. Assets Rs210,813+ Cash: 11418+ Other NO 140576- Debt 109198=Equity 253,628
Value/Share Rs 614
Riskfree Rate:Rs Riskfree Rate= 5% +
Beta 1.20 X
Mature market premium 4.5%
Unlevered Beta for Sectors: 1.04
Firmʼs D/ERatio: 33%
Tata Motors: April 2010 Reinvestment Rate 70%
Return on Capital17.16%
452782178523493
+ Lambda0.80
XCountry Equity RiskPremium4.50%
Country Default Spread3%
XRel Equity Mkt Vol
1.50
On April 1, 2010Tata Motors price = Rs 781
Rs Cashflows
Average reinvestment rate from 2005-09: 179.59%; without acquisitions: 70%
Growth declines to 5% and cost of capital moves to stable period level.
Year 1 2 3 4 5 6 7 8 9 10EBIT (1-t) 22533 25240 28272 31668 35472 39236 42848 46192 49150 51607 - Reinvestment 15773 17668 19790 22168 24830 25242 25138 24482 23264 21503FCFF 6760 7572 8482 9500 10642 13994 17711 21710 25886 30104
Aswath Damodaran 11
Aswath Damodaran 12
Forever
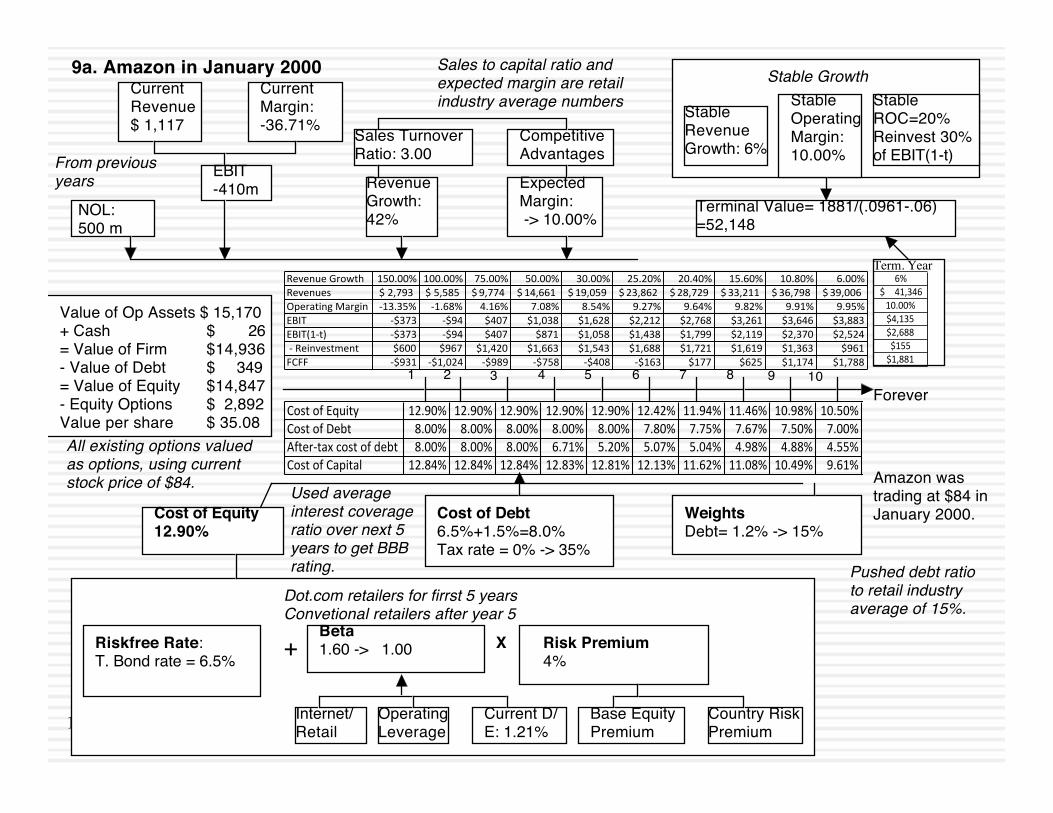
Terminal Value= 1881/(.0961-.06)=52,148
Cost of Equity12.90%
Cost of Debt6.5%+1.5%=8.0%Tax rate = 0% -> 35%
WeightsDebt= 1.2% -> 15%
Value of Op Assets $ 15,170+ Cash $ 26= Value of Firm $14,936- Value of Debt $ 349= Value of Equity $14,847- Equity Options $ 2,892Value per share $ 35.08
Riskfree Rate:T. Bond rate = 6.5% +
Beta1.60 -> 1.00 X Risk Premium
4%
Internet/Retail
Operating Leverage
Current D/E: 1.21%
Base EquityPremium
Country RiskPremium
CurrentRevenue$ 1,117
CurrentMargin:-36.71% Sales Turnover
Ratio: 3.00CompetitiveAdvantages
Revenue Growth:42%
Expected Margin: -> 10.00%
Stable Growth
StableRevenueGrowth: 6%
StableOperatingMargin: 10.00%
Stable ROC=20%Reinvest 30% of EBIT(1-t)
EBIT-410m
NOL:500 m
Term. Year
2 43 51 6 8 9 107
9a. Amazon in January 2000
Amazon was trading at $84 in January 2000.
Dot.com retailers for firrst 5 yearsConvetional retailers after year 5
Used average interest coverage ratio over next 5 years to get BBB rating. Pushed debt ratio
to retail industry average of 15%.
From previous years
Sales to capital ratio and expected margin are retail industry average numbers
All existing options valued as options, using current stock price of $84.
Cost%of%Equity 12.90% 12.90% 12.90% 12.90% 12.90% 12.42% 11.94% 11.46% 10.98% 10.50%Cost%of%Debt 8.00% 8.00% 8.00% 8.00% 8.00% 7.80% 7.75% 7.67% 7.50% 7.00%After<tax%cost%of%debt 8.00% 8.00% 8.00% 6.71% 5.20% 5.07% 5.04% 4.98% 4.88% 4.55%Cost%of%Capital% 12.84% 12.84% 12.84% 12.83% 12.81% 12.13% 11.62% 11.08% 10.49% 9.61%
Revenue&Growth 150.00% 100.00% 75.00% 50.00% 30.00% 25.20% 20.40% 15.60% 10.80% 6.00%Revenues 2,793$&& 5,585$&& 9,774$& 14,661$& 19,059$& 23,862$& 28,729$& 33,211$& 36,798$& 39,006$&Operating&Margin B13.35% B1.68% 4.16% 7.08% 8.54% 9.27% 9.64% 9.82% 9.91% 9.95%EBIT B$373 B$94 $407 $1,038 $1,628 $2,212 $2,768 $3,261 $3,646 $3,883EBIT(1Bt) B$373 B$94 $407 $871 $1,058 $1,438 $1,799 $2,119 $2,370 $2,524&B&Reinvestment $600 $967 $1,420 $1,663 $1,543 $1,688 $1,721 $1,619 $1,363 $961FCFF B$931 B$1,024 B$989 B$758 B$408 B$163 $177 $625 $1,174 $1,788
6%41,346$(((((
10.00%$4,135$2,688$155$1,881
Aswath Damodaran 13
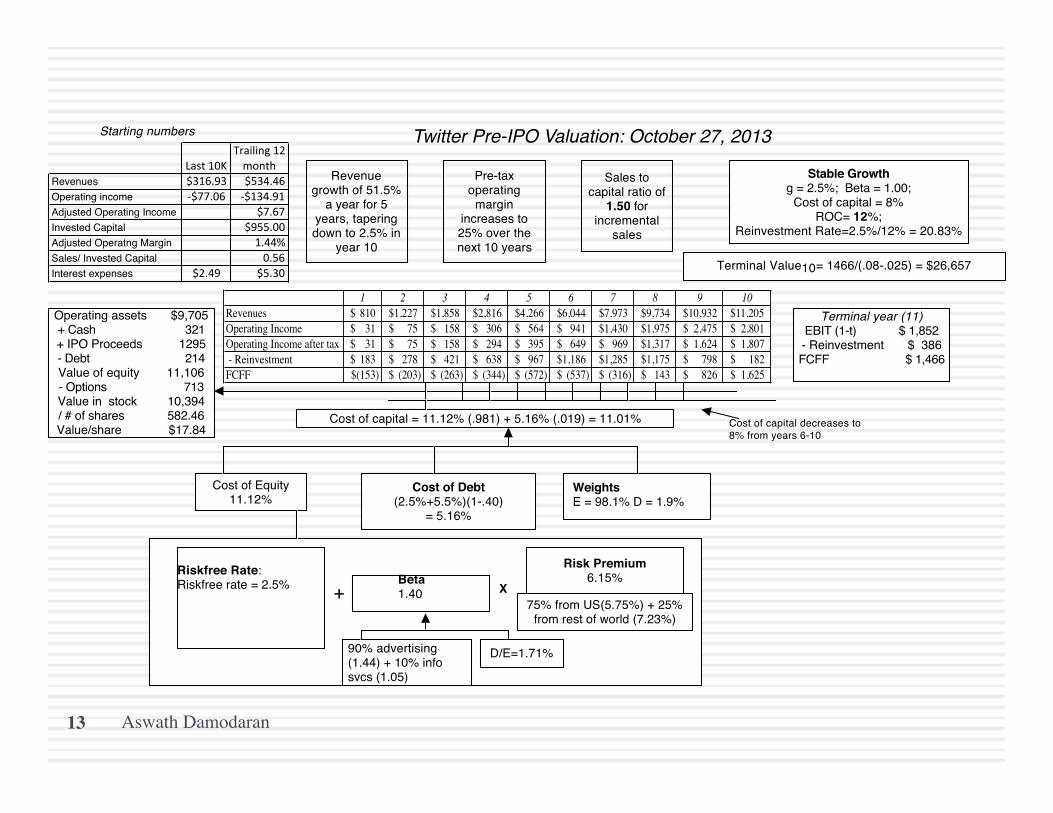
Terminal year (11)EBIT (1-t) $ 1,852- Reinvestment $ 386FCFF $ 1,466
Terminal Value10= 1466/(.08-.025) = $26,657
Cost of capital = 11.12% (.981) + 5.16% (.019) = 11.01%
90% advertising (1.44) + 10% info svcs (1.05)
Risk Premium6.15%
Operating assets $9,705+ Cash 321+ IPO Proceeds 1295- Debt 214Value of equity 11,106- Options 713Value in stock 10,394/ # of shares 582.46Value/share $17.84
Cost of Debt(2.5%+5.5%)(1-.40)
= 5.16%
Cost of Equity11.12%
Stable Growthg = 2.5%; Beta = 1.00;
Cost of capital = 8% ROC= 12%;
Reinvestment Rate=2.5%/12% = 20.83%
WeightsE = 98.1% D = 1.9%
Riskfree Rate:Riskfree rate = 2.5% +
Beta 1.40 X
Cost of capital decreases to 8% from years 6-10
D/E=1.71%
Twitter Pre-IPO Valuation: October 27, 2013
Revenue growth of 51.5%
a year for 5 years, tapering down to 2.5% in
year 10
Pre-tax operating
margin increases to 25% over the next 10 years
Sales to capital ratio of
1.50 for incremental
sales
Starting numbers
75% from US(5.75%) + 25% from rest of world (7.23%)
Last%10KTrailing%12%month
Revenues $316.93 $534.46Operating income :$77.06 :$134.91Adjusted Operating Income $7.67Invested Capital $955.00Adjusted Operatng Margin 1.44%Sales/ Invested Capital 0.56Interest expenses $2.49 $5.30
1 2 3 4 5 6 7 8 9 10Revenues 810$ 1,227$ 1,858$ 2,816$ 4,266$ 6,044$ 7,973$ 9,734$ 10,932$ 11,205$ Operating Income 31$ 75$ 158$ 306$ 564$ 941$ 1,430$ 1,975$ 2,475$ 2,801$ Operating Income after tax 31$ 75$ 158$ 294$ 395$ 649$ 969$ 1,317$ 1,624$ 1,807$ - Reinvestment 183$ 278$ 421$ 638$ 967$ 1,186$ 1,285$ 1,175$ 798$ 182$ FCFF (153)$ (203)$ (263)$ (344)$ (572)$ (537)$ (316)$ 143$ 826$ 1,625$
14
Golden Rule 1: MoEve ma:ers and Bias rules
¨ PreconcepEons and priors: When you start on the valuaEon of a company, you almost never start with a blank slate. Instead, your valuaEon is shaped by your prior views of the company in quesEon. ¤ Corollary 1: The more you know about a company, the more likely it is that you will be biased, when valuing the company.
¤ Corollary 2: The “closer” you get to the management/owners of a company, the more biased your valuaEon of the company will become.
¨ Value first, valuaEon to follow: In principle, you should do your valuaEon first before you decide how much to pay for an asset. In pracEce, people oben decide what to pay and do the valuaEon aberwards.
15
The drivers of bias!
¨ The power of the subconscious: We are human, aber all, and as a consequence are suscepEble to ¤ Herd behavior: For instance, there is the “market price” magnet in valuaEon, where
esEmates of intrinsic value move towards the market price with each iteraEon. ¤ Hindsight bias: If you know the outcome of a sequence of events, it will affect your
valuaEon. (That is why teaching valuaEon with cases is an exercise in fuElity) ¨ The power of suggesEon: Hearing what others think a company is worth
will color your thinking, and if you view those others as more informed/smarter than you are, you will be influenced even more.
¨ The power of money: If you have an economic stake in the outcome of a valuaEon, bias will almost always follow. ¤ Corollary 1: Your bias in a valuaEon will be directly proporEonal to who pays you
to do the valuaEon and how much you get paid. ¤ Corollary 2: You will be more biased when valuing a company where you already
have a posiEon (long or short) in the company.
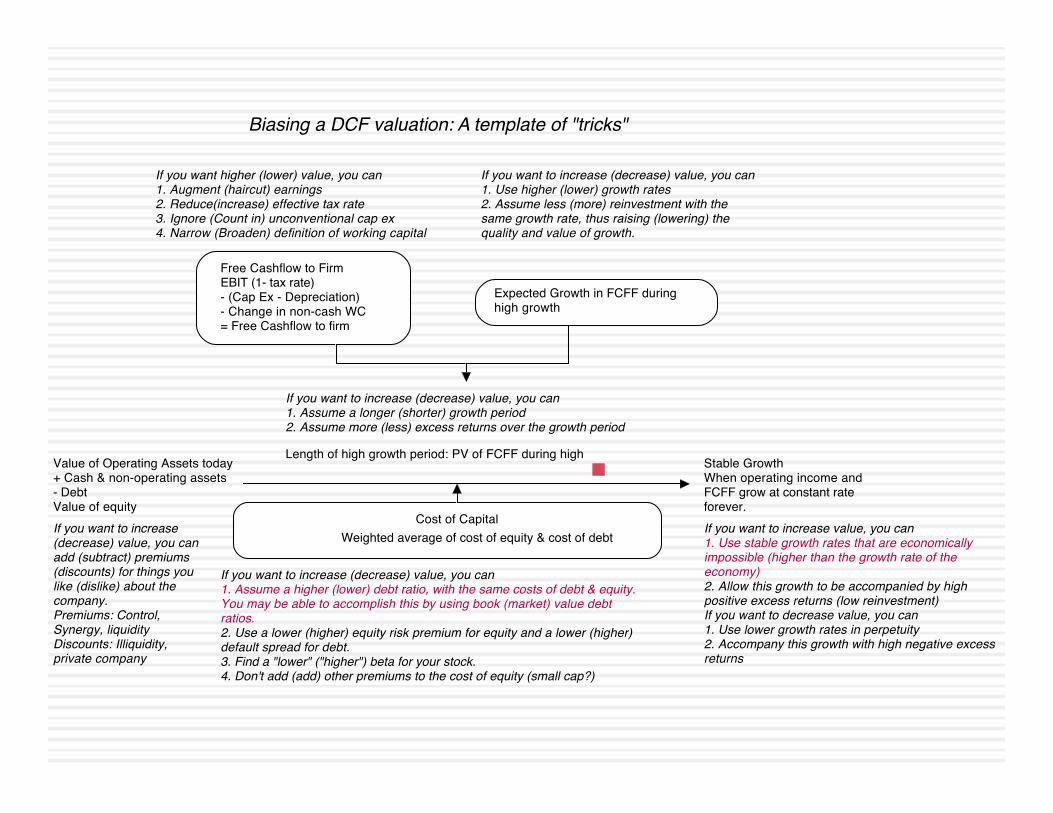
Free Cashflow to FirmEBIT (1- tax rate)- (Cap Ex - Depreciation)- Change in non-cash WC= Free Cashflow to firm
Cost of Capital
Expected Growth in FCFF during high growth
Length of high growth period: PV of FCFF during high Stable GrowthWhen operating income and FCFF grow at constant rate forever.
Value of Operating Assets today+ Cash & non-operating assets- DebtValue of equity
Weighted average of cost of equity & cost of debt
If you want higher (lower) value, you can1. Augment (haircut) earnings2. Reduce(increase) effective tax rate3. Ignore (Count in) unconventional cap ex4. Narrow (Broaden) definition of working capital
If you want to increase (decrease) value, you can1. Use higher (lower) growth rates 2. Assume less (more) reinvestment with the same growth rate, thus raising (lowering) the quality and value of growth.
If you want to increase (decrease) value, you can1. Assume a higher (lower) debt ratio, with the same costs of debt & equity. You may be able to accomplish this by using book (market) value debt ratios.2. Use a lower (higher) equity risk premium for equity and a lower (higher) default spread for debt.3. Find a "lower" ("higher") beta for your stock.4. Don't add (add) other premiums to the cost of equity (small cap?)
If you want to increase (decrease) value, you can1. Assume a longer (shorter) growth period2. Assume more (less) excess returns over the growth period
If you want to increase (decrease) value, you can add (subtract) premiums (discounts) for things you like (dislike) about the company.Premiums: Control, Synergy, liquidityDiscounts: Illiquidity, private company
If you want to increase value, you can1. Use stable growth rates that are economically impossible (higher than the growth rate of the economy)2. Allow this growth to be accompanied by high positive excess returns (low reinvestment)If you want to decrease value, you can1. Use lower growth rates in perpetuity2. Accompany this growth with high negative excess returns
Biasing a DCF valuation: A template of "tricks"
17
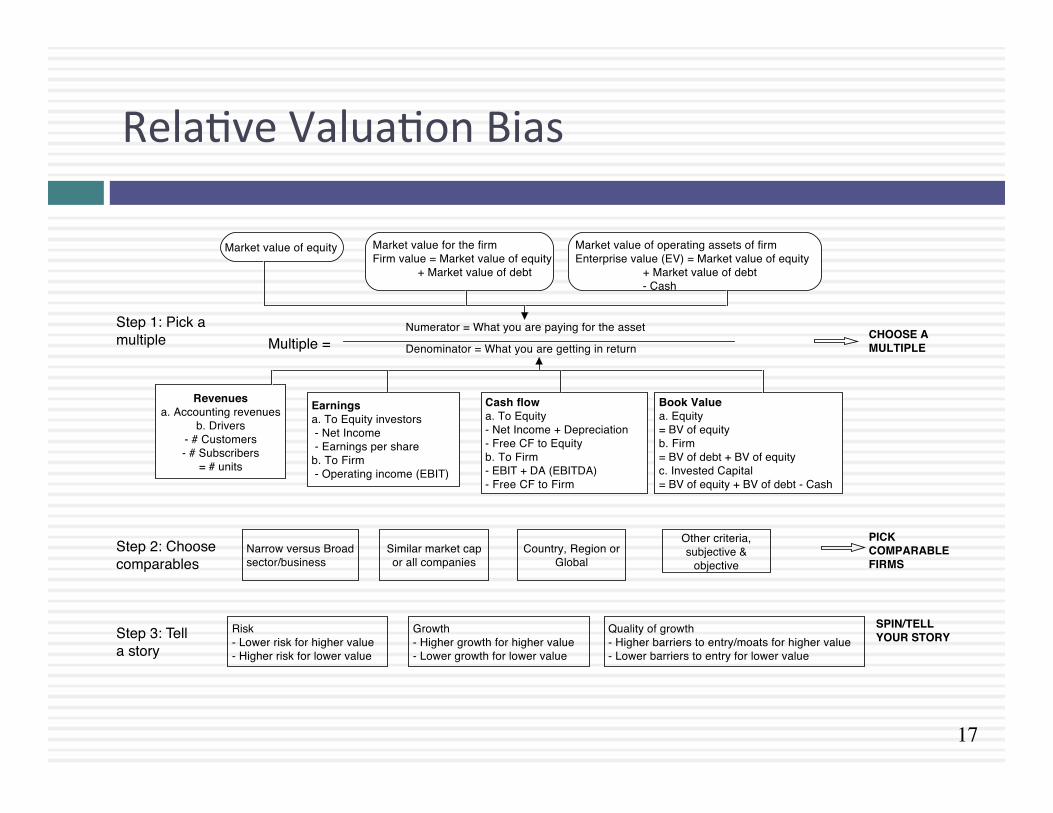
RelaEve ValuaEon Bias
Book Valuea. Equity= BV of equityb. Firm= BV of debt + BV of equityc. Invested Capital= BV of equity + BV of debt - Cash
Cash flowa. To Equity- Net Income + Depreciation- Free CF to Equityb. To Firm- EBIT + DA (EBITDA)- Free CF to Firm
Earningsa. To Equity investors - Net Income - Earnings per shareb. To Firm - Operating income (EBIT)
Revenuesa. Accounting revenues
b. Drivers- # Customers- # Subscribers
= # units
Numerator = What you are paying for the asset
Denominator = What you are getting in return
Market value of equity Market value for the firmFirm value = Market value of equity
+ Market value of debt
Market value of operating assets of firmEnterprise value (EV) = Market value of equity
+ Market value of debt- Cash
Multiple =Step 1: Pick a multiple
Step 2: Choose comparables
Narrow versus Broad sector/business
Similar market cap or all companies
Country, Region or Global
Other criteria, subjective &
objective
CHOOSE A MULTIPLE
PICK COMPARABLE FIRMS
Step 3: Tell a story
Risk- Lower risk for higher value- Higher risk for lower value
Growth- Higher growth for higher value- Lower growth for lower value
Quality of growth- Higher barriers to entry/moats for higher value- Lower barriers to entry for lower value
SPIN/TELL YOUR STORY
18
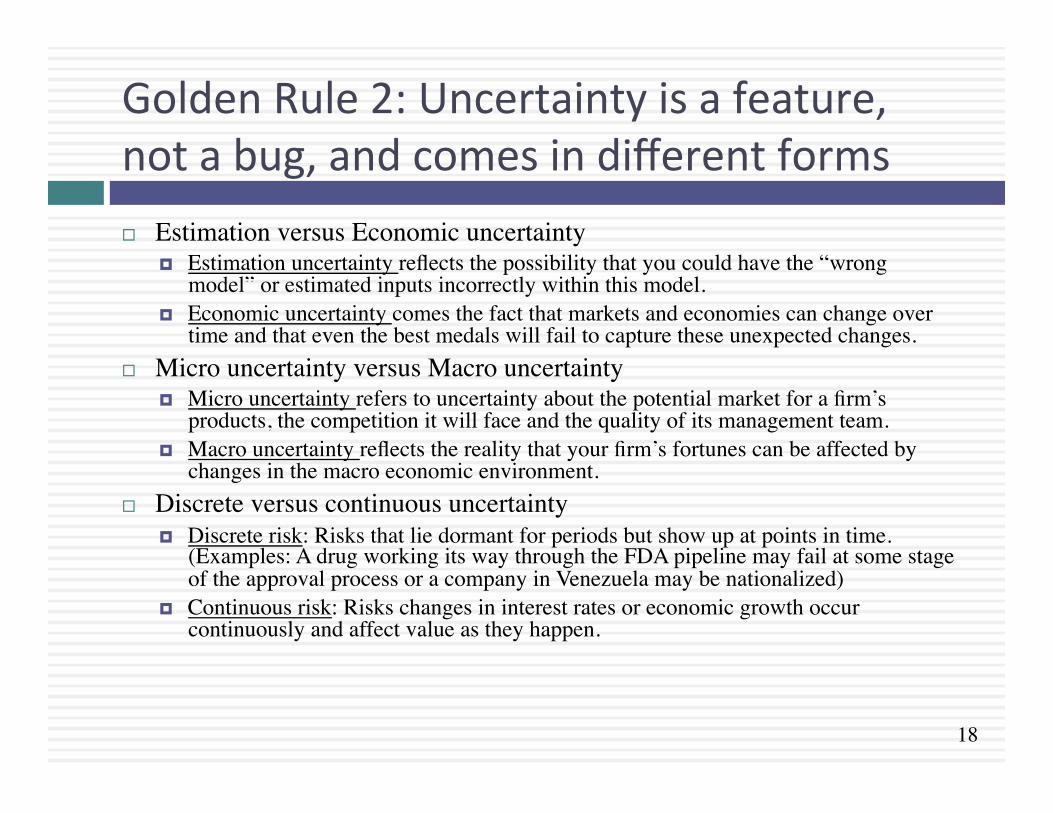
Golden Rule 2: Uncertainty is a feature, not a bug, and comes in different forms ¨ Estimation versus Economic uncertainty
¤ Estimation uncertainty reflects the possibility that you could have the “wrong model” or estimated inputs incorrectly within this model.
¤ Economic uncertainty comes the fact that markets and economies can change over time and that even the best medals will fail to capture these unexpected changes.
¨ Micro uncertainty versus Macro uncertainty ¤ Micro uncertainty refers to uncertainty about the potential market for a firm’s
products, the competition it will face and the quality of its management team. ¤ Macro uncertainty reflects the reality that your firm’s fortunes can be affected by
changes in the macro economic environment. ¨ Discrete versus continuous uncertainty
¤ Discrete risk: Risks that lie dormant for periods but show up at points in time. (Examples: A drug working its way through the FDA pipeline may fail at some stage of the approval process or a company in Venezuela may be nationalized)
¤ Continuous risk: Risks changes in interest rates or economic growth occur continuously and affect value as they happen.
19
Unhealthy ways of dealing with uncertainty
¨ Paralysis & Denial: When faced with uncertainty, some of us get paralyzed. Accompanying the paralysis is the hope that if you close your eyes to it, the uncertainty will go away
¨ Mental short cuts (rules of thumb): Behavioral economists note that investors faced with uncertainty adopt mental short cuts that have no basis in reality. And here is the clincher. More intelligent people are more likely to be prone to this.
¨ Herding: When in doubt, it is safest to go with the crowd.. The herding instinct is deeply engrained and very difficult to fight.
¨ Outsourcing: Assuming that there are experts out there who have the answers does take a weight off your shoulders, even if those experts have no idea of what they are talking about.
20
Ten suggesEons for dealing with uncertainty…
1. Less is more (the rule on detail….) (Revenue & margin forecasts) 2. Build in internal checks on reasonableness… (reinvestment and ROC) 3. Use the offsegng principle (risk free rates & inflaEon at Tata Motors) 4. Draw on economic first principles (Terminal value at all the companies ) 5. Use the “market” as a crutch (equity risk premiums, country risk
premiums) 6. Use the law of large numbers (Beta for all companies 7. Don’t let the discount rate become the receptacle for all uncertainEes. 8. Confront uncertainty, if you can 9. Don’t look for precision 10. Keep your perspecEve. It’s only money!
Aswath Damodaran
20
21
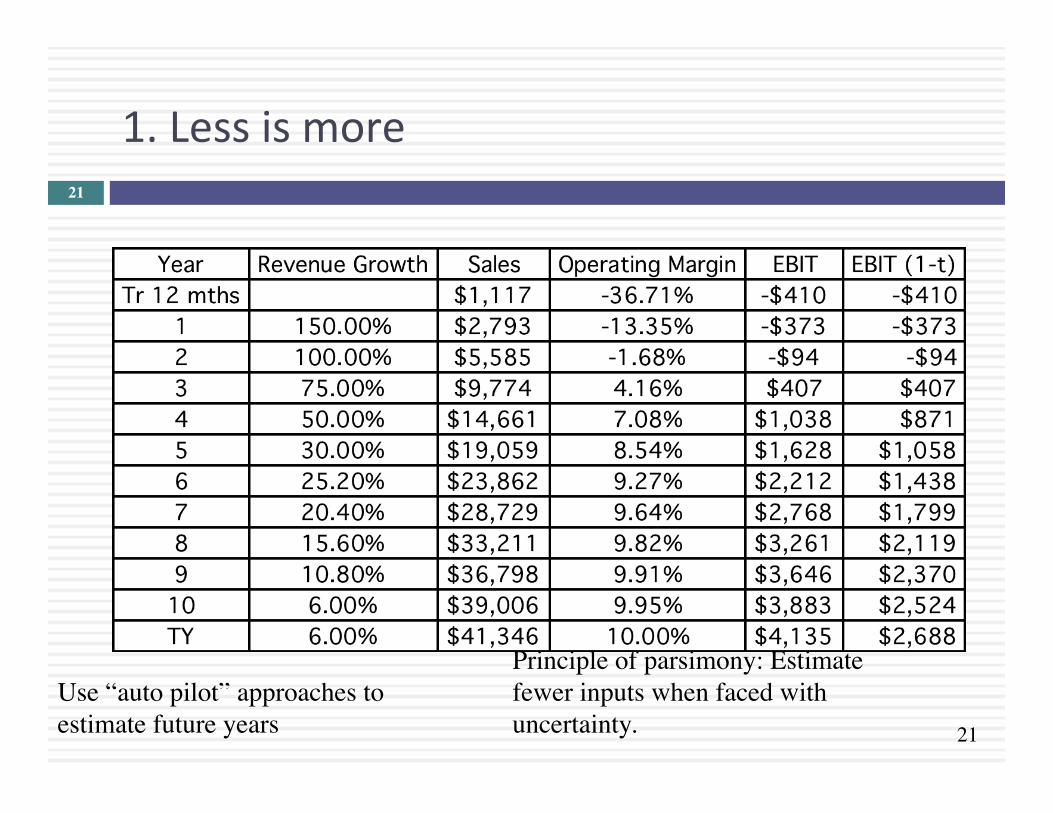
1. Less is more 21
Principle of parsimony: Estimate fewer inputs when faced with uncertainty.
Use “auto pilot” approaches to estimate future years
22
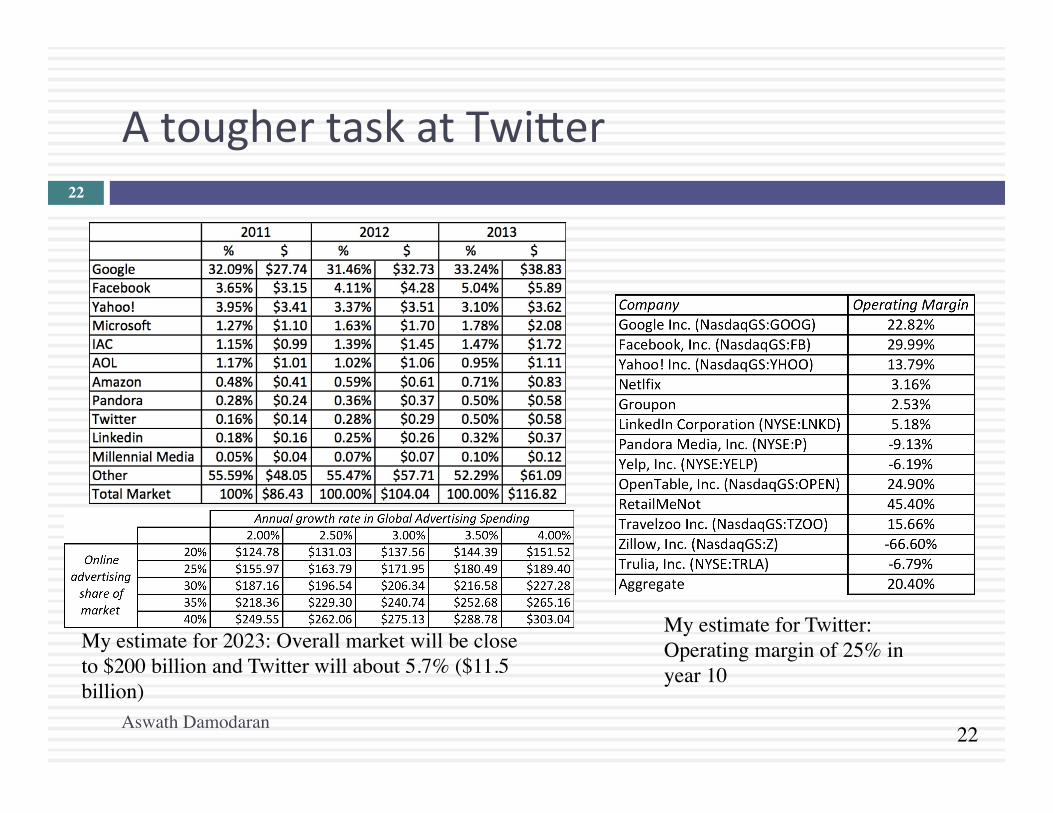
A tougher task at Twi:er
Aswath Damodaran
22
My estimate for 2023: Overall market will be close to $200 billion and Twitter will about 5.7% ($11.5 billion)
My estimate for Twitter: Operating margin of 25% in year 10
23
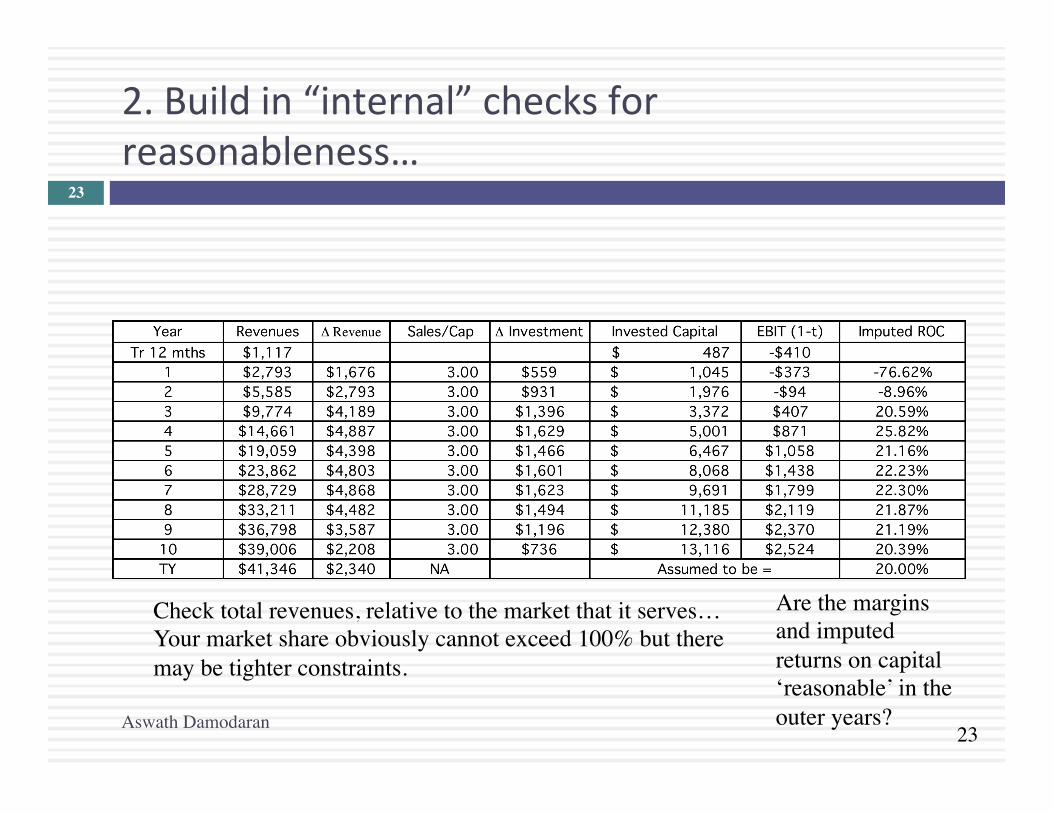
2. Build in “internal” checks for reasonableness…
Aswath Damodaran
23
Check total revenues, relative to the market that it serves… Your market share obviously cannot exceed 100% but there may be tighter constraints.
Are the margins and imputed returns on capital ‘reasonable’ in the outer years?
24
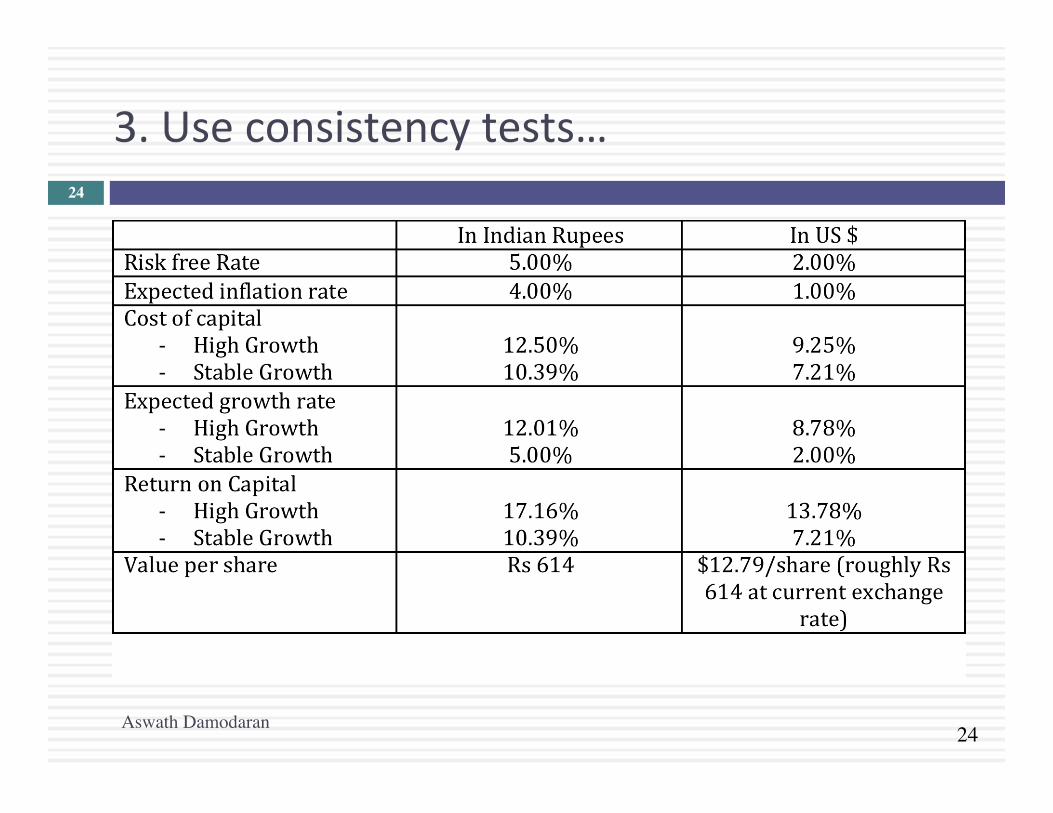
3. Use consistency tests…
Aswath Damodaran
24
25
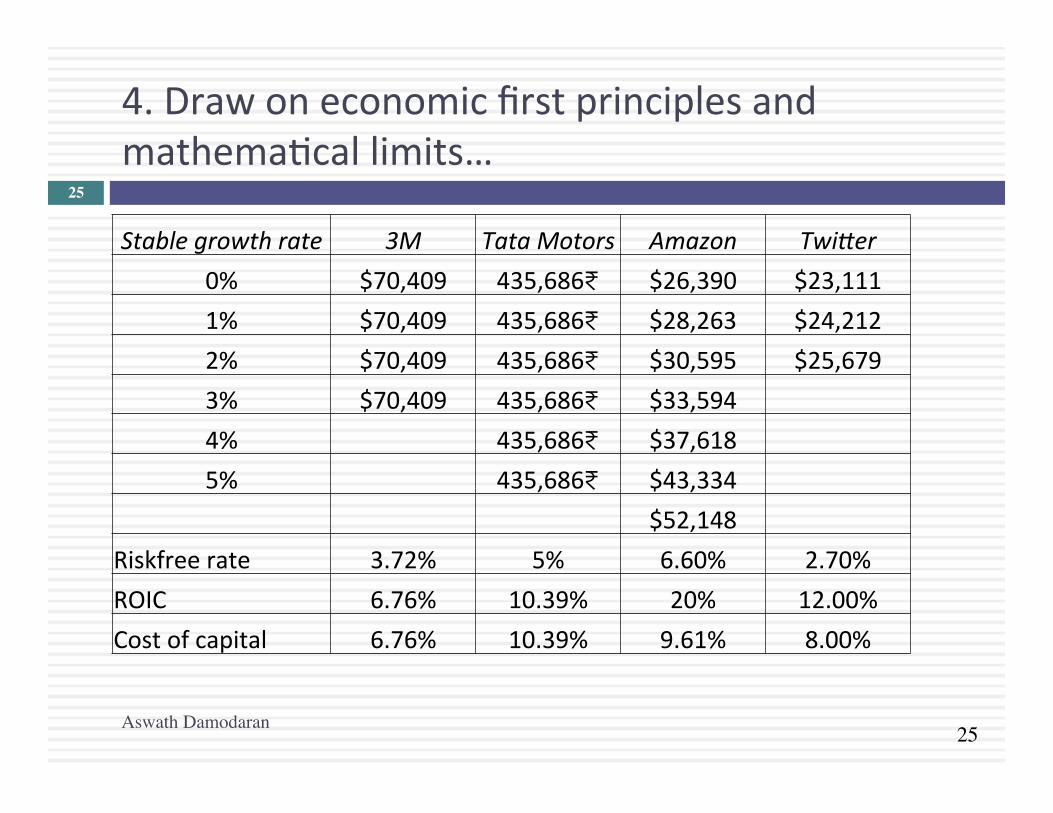
4. Draw on economic first principles and mathemaEcal limits…
Aswath Damodaran
25
Stable growth rate 3M Tata Motors Amazon TwiKer 0% $70,409 435,686₹ $26,390 $23,111 1% $70,409 435,686₹ $28,263 $24,212 2% $70,409 435,686₹ $30,595 $25,679 3% $70,409 435,686₹ $33,594 4% 435,686₹ $37,618 5% 435,686₹ $43,334 $52,148
Riskfree rate 3.72% 5% 6.60% 2.70% ROIC 6.76% 10.39% 20% 12.00% Cost of capital 6.76% 10.39% 9.61% 8.00%
26
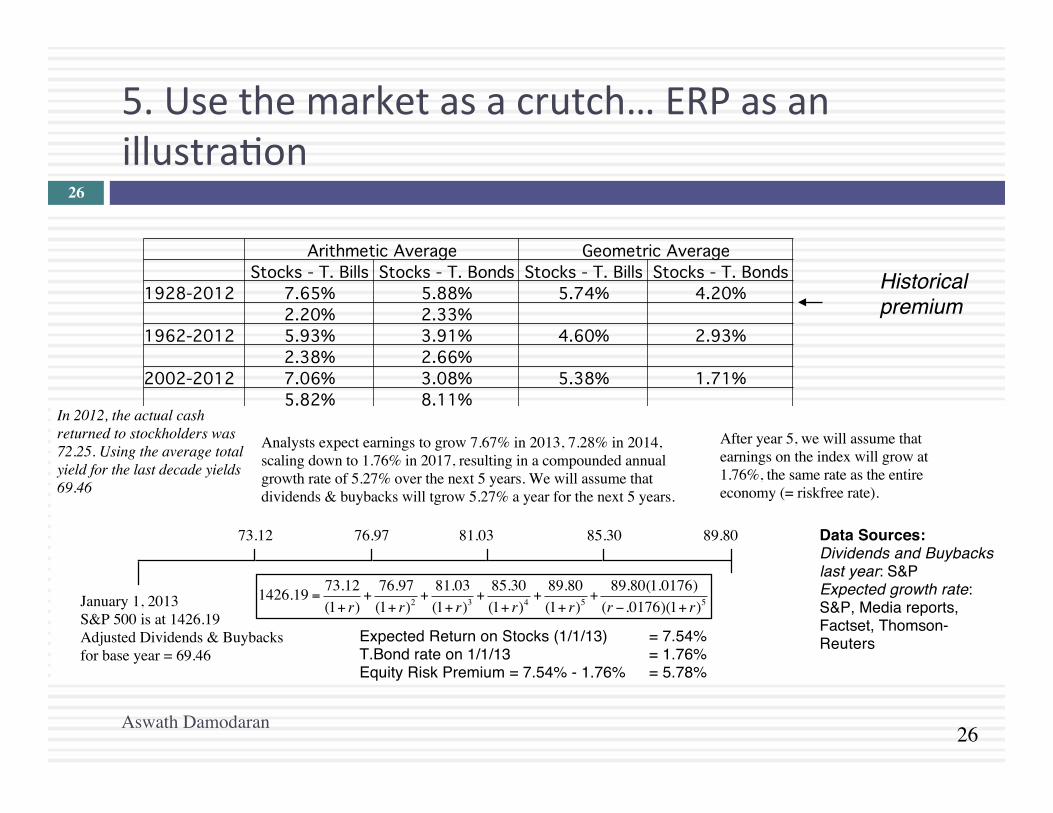
5. Use the market as a crutch… ERP as an illustraEon
Historical premium"
Aswath Damodaran
26
" Arithmetic Average" Geometric Average" " Stocks - T. Bills" Stocks - T. Bonds" Stocks - T. Bills" Stocks - T. Bonds"1928-2012" 7.65%" 5.88%" 5.74%" 4.20%" " 2.20%" 2.33%" " "1962-2012" 5.93%" 3.91%" 4.60%" 2.93%" " 2.38%" 2.66%" " "2002-2012" 7.06%" 3.08%" 5.38%" 1.71%" " 5.82%" 8.11%" " "
January 1, 2013S&P 500 is at 1426.19Adjusted Dividends & Buybacks for base year = 69.46
In 2012, the actual cash returned to stockholders was 72.25. Using the average total yield for the last decade yields 69.46
Analysts expect earnings to grow 7.67% in 2013, 7.28% in 2014, scaling down to 1.76% in 2017, resulting in a compounded annual growth rate of 5.27% over the next 5 years. We will assume that dividends & buybacks will tgrow 5.27% a year for the next 5 years.
After year 5, we will assume that earnings on the index will grow at 1.76%, the same rate as the entire economy (= riskfree rate).
76.97 81.03 85.30 89.80
Expected Return on Stocks (1/1/13) = 7.54%T.Bond rate on 1/1/13 = 1.76%Equity Risk Premium = 7.54% - 1.76% = 5.78%
73.12 Data Sources:Dividends and Buybacks last year: S&PExpected growth rate: S&P, Media reports, Factset, Thomson- Reuters
1426.19 = 73.12(1+ r)
+76.97(1+ r)2
+81.03(1+ r)3
+85.30(1+ r)4
+89.80(1+ r)5
+89.80(1.0176)(r −.0176)(1+ r)5
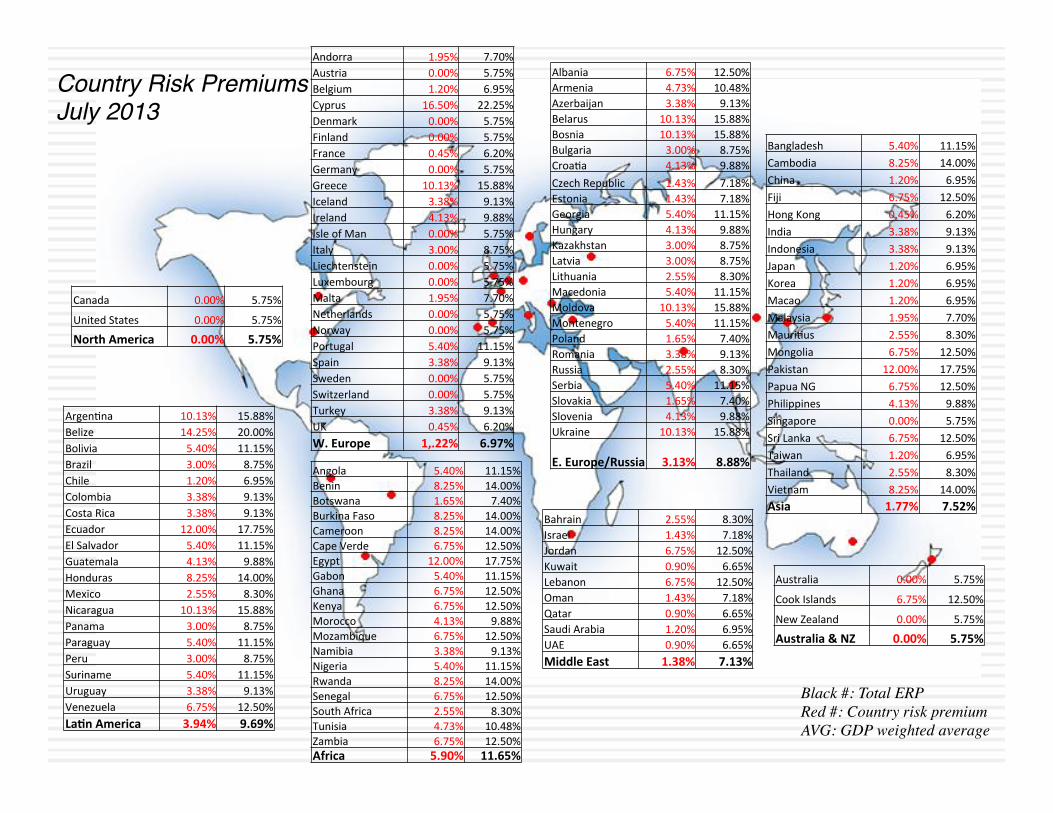
Country Risk Premiums"July 2013"
Black #: Total ERP Red #: Country risk premium AVG: GDP weighted average
Angola 5.40% 11.15% Benin 8.25% 14.00% Botswana 1.65% 7.40% Burkina Faso 8.25% 14.00% Cameroon 8.25% 14.00% Cape Verde 6.75% 12.50% Egypt 12.00% 17.75% Gabon 5.40% 11.15% Ghana 6.75% 12.50% Kenya 6.75% 12.50% Morocco 4.13% 9.88% Mozambique 6.75% 12.50% Namibia 3.38% 9.13% Nigeria 5.40% 11.15% Rwanda 8.25% 14.00% Senegal 6.75% 12.50% South Africa 2.55% 8.30% Tunisia 4.73% 10.48% Zambia 6.75% 12.50% Africa 5.90% 11.65%
Andorra 1.95% 7.70% Austria 0.00% 5.75% Belgium 1.20% 6.95% Cyprus 16.50% 22.25% Denmark 0.00% 5.75% Finland 0.00% 5.75% France 0.45% 6.20% Germany 0.00% 5.75% Greece 10.13% 15.88% Iceland 3.38% 9.13% Ireland 4.13% 9.88% Isle of Man 0.00% 5.75% Italy 3.00% 8.75% Liechtenstein 0.00% 5.75% Luxembourg 0.00% 5.75% Malta 1.95% 7.70% Netherlands 0.00% 5.75% Norway 0.00% 5.75% Portugal 5.40% 11.15% Spain 3.38% 9.13% Sweden 0.00% 5.75% Switzerland 0.00% 5.75% Turkey 3.38% 9.13% UK 0.45% 6.20% W. Europe 1,.22% 6.97%
ArgenEna 10.13% 15.88% Belize 14.25% 20.00% Bolivia 5.40% 11.15% Brazil 3.00% 8.75% Chile 1.20% 6.95% Colombia 3.38% 9.13% Costa Rica 3.38% 9.13% Ecuador 12.00% 17.75% El Salvador 5.40% 11.15% Guatemala 4.13% 9.88% Honduras 8.25% 14.00% Mexico 2.55% 8.30% Nicaragua 10.13% 15.88% Panama 3.00% 8.75% Paraguay 5.40% 11.15% Peru 3.00% 8.75% Suriname 5.40% 11.15% Uruguay 3.38% 9.13% Venezuela 6.75% 12.50% La9n America 3.94% 9.69%
Canada 0.00% 5.75%
United States 0.00% 5.75%
North America 0.00% 5.75%
Albania 6.75% 12.50% Armenia 4.73% 10.48% Azerbaijan 3.38% 9.13% Belarus 10.13% 15.88% Bosnia 10.13% 15.88% Bulgaria 3.00% 8.75% CroaEa 4.13% 9.88% Czech Republic 1.43% 7.18% Estonia 1.43% 7.18% Georgia 5.40% 11.15% Hungary 4.13% 9.88% Kazakhstan 3.00% 8.75% Latvia 3.00% 8.75% Lithuania 2.55% 8.30% Macedonia 5.40% 11.15% Moldova 10.13% 15.88% Montenegro 5.40% 11.15% Poland 1.65% 7.40% Romania 3.38% 9.13% Russia 2.55% 8.30% Serbia 5.40% 11.15% Slovakia 1.65% 7.40% Slovenia 4.13% 9.88% Ukraine 10.13% 15.88%
E. Europe/Russia 3.13% 8.88%
Bahrain 2.55% 8.30% Israel 1.43% 7.18% Jordan 6.75% 12.50% Kuwait 0.90% 6.65% Lebanon 6.75% 12.50% Oman 1.43% 7.18% Qatar 0.90% 6.65% Saudi Arabia 1.20% 6.95% UAE 0.90% 6.65% Middle East 1.38% 7.13%
Australia 0.00% 5.75%
Cook Islands 6.75% 12.50%
New Zealand 0.00% 5.75%
Australia & NZ 0.00% 5.75%
Bangladesh 5.40% 11.15% Cambodia 8.25% 14.00% China 1.20% 6.95% Fiji 6.75% 12.50% Hong Kong 0.45% 6.20% India 3.38% 9.13% Indonesia 3.38% 9.13% Japan 1.20% 6.95% Korea 1.20% 6.95% Macao 1.20% 6.95% Malaysia 1.95% 7.70% MauriEus 2.55% 8.30% Mongolia 6.75% 12.50% Pakistan 12.00% 17.75% Papua NG 6.75% 12.50% Philippines 4.13% 9.88% Singapore 0.00% 5.75% Sri Lanka 6.75% 12.50% Taiwan 1.20% 6.95% Thailand 2.55% 8.30% Vietnam 8.25% 14.00% Asia 1.77% 7.52%
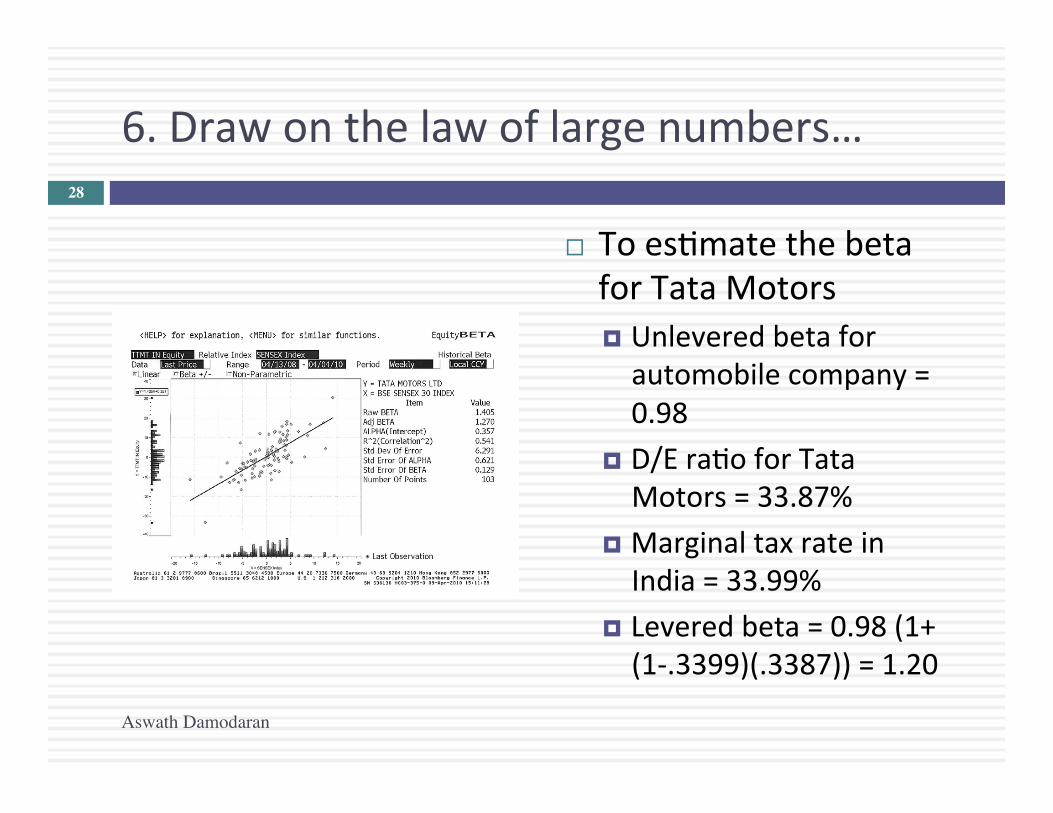
6. Draw on the law of large numbers…
¨ To esEmate the beta for Tata Motors ¤ Unlevered beta for automobile company = 0.98
¤ D/E raEo for Tata Motors = 33.87%
¤ Marginal tax rate in India = 33.99%
¤ Levered beta = 0.98 (1+ (1-‐.3399)(.3387)) = 1.20
28
Aswath Damodaran
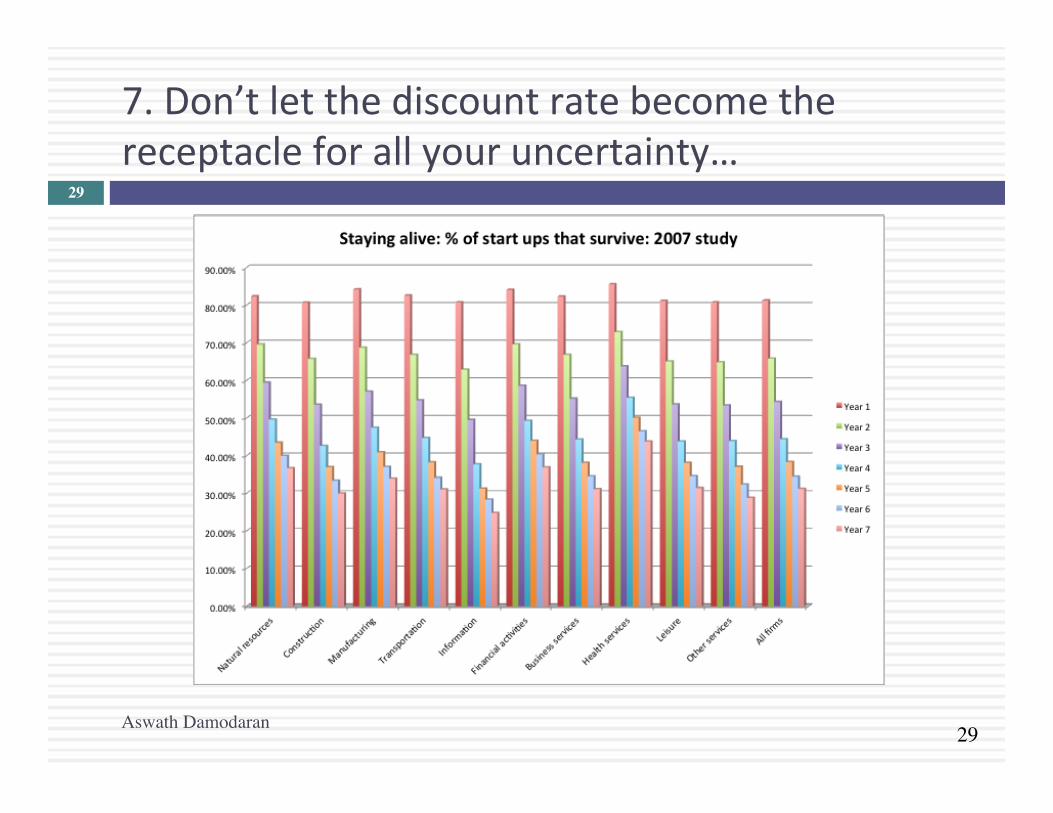
29
7. Don’t let the discount rate become the receptacle for all your uncertainty…
Aswath Damodaran
29
30
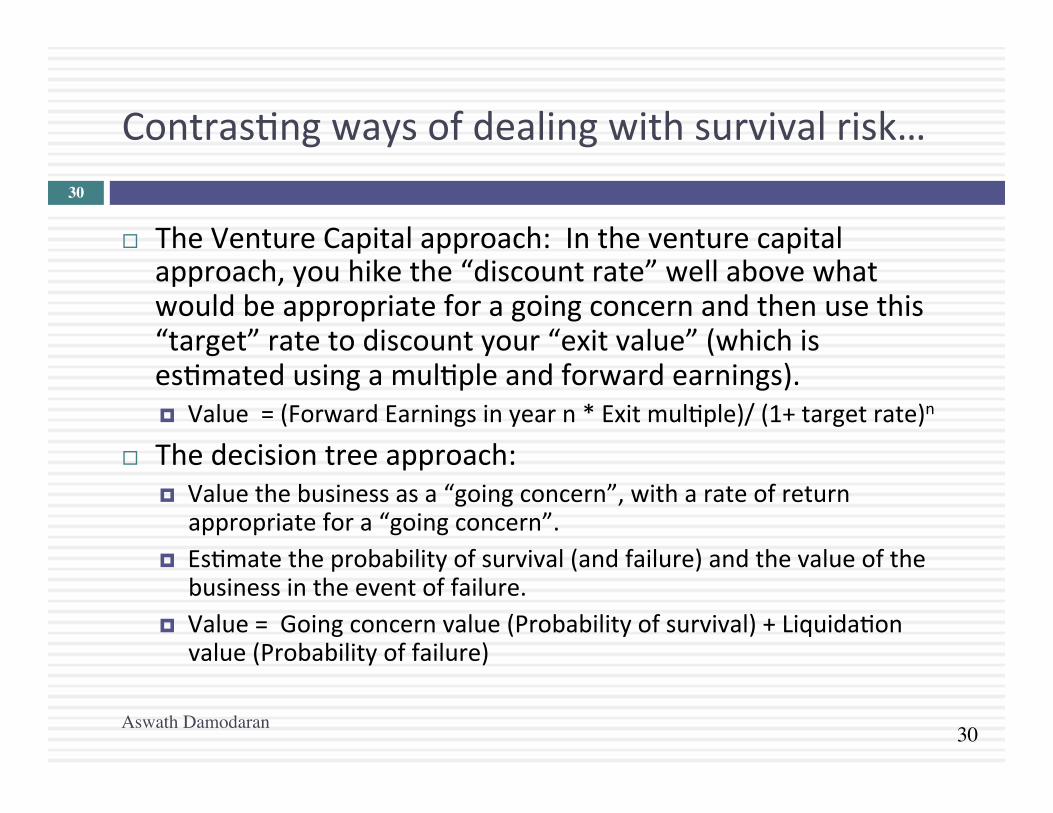
ContrasEng ways of dealing with survival risk…
¨ The Venture Capital approach: In the venture capital approach, you hike the “discount rate” well above what would be appropriate for a going concern and then use this “target” rate to discount your “exit value” (which is esEmated using a mulEple and forward earnings). ¤ Value = (Forward Earnings in year n * Exit mulEple)/ (1+ target rate)n
¨ The decision tree approach: ¤ Value the business as a “going concern”, with a rate of return
appropriate for a “going concern”. ¤ EsEmate the probability of survival (and failure) and the value of the
business in the event of failure. ¤ Value = Going concern value (Probability of survival) + LiquidaEon
value (Probability of failure)
Aswath Damodaran
30
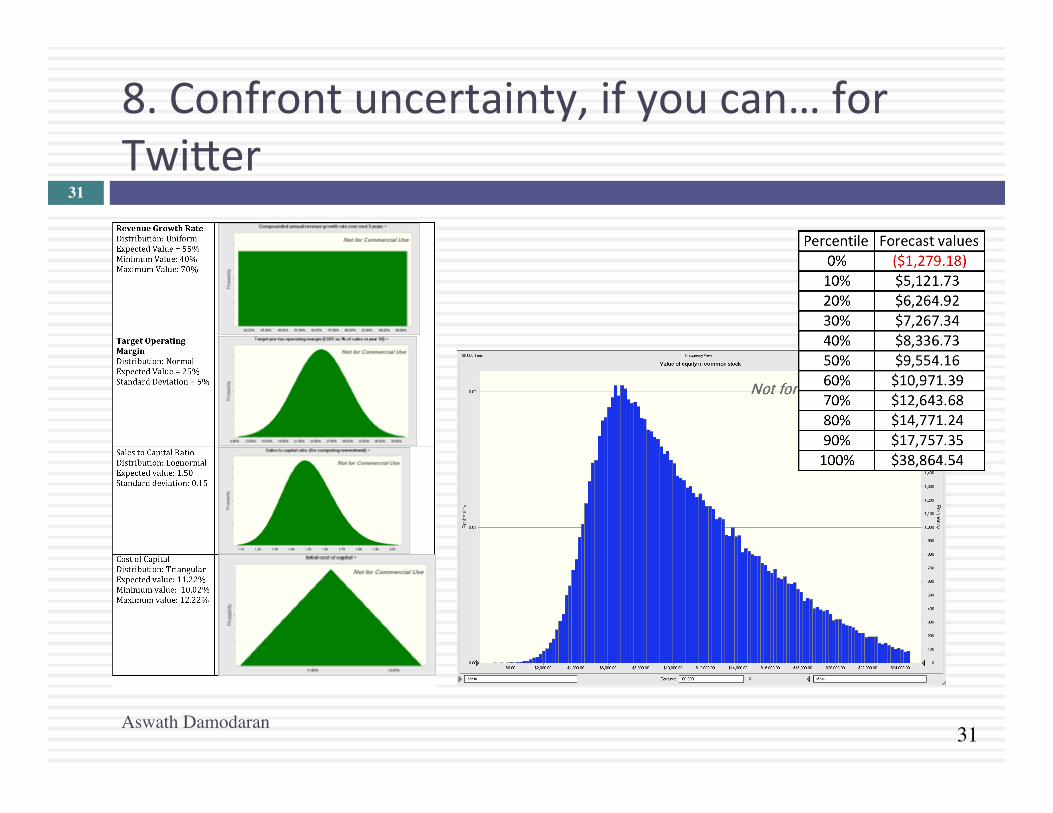
31
8. Confront uncertainty, if you can… for Twi:er
Aswath Damodaran
31
32
9. Don’t look for precision..
¨ No ma:er how careful you are in gegng your inputs and how well structured your model is, your esEmate of value will change both as new informaEon comes out about the company, the business and the economy.
¨ As informaEon comes out, you will have to adjust and adapt your model to reflect the informaEon. Rather than be defensive about the resulEng changes in value, recognize that this is the essence of risk.
Aswath Damodaran
32
33
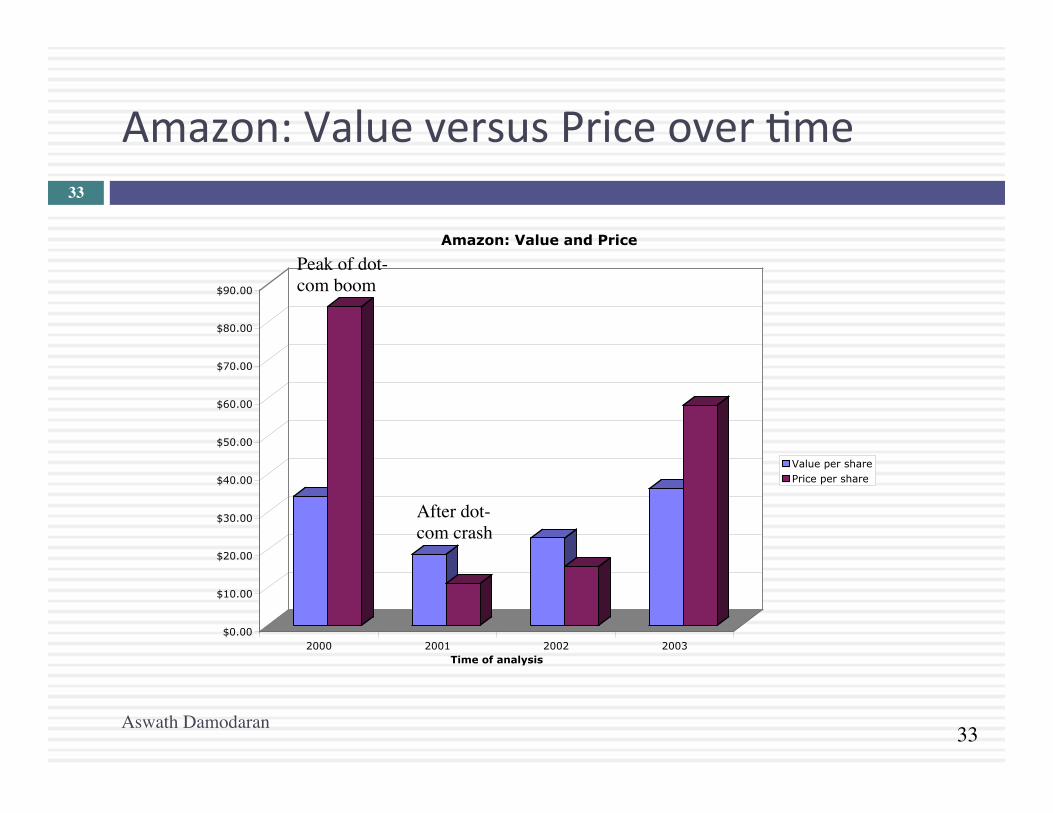
Amazon: Value versus Price over Eme
$0.00
$10.00
$20.00
$30.00
$40.00
$50.00
$60.00
$70.00
$80.00
$90.00
2000 2001 2002 2003Time of analysis
Amazon: Value and Price
Value per sharePrice per share
Aswath Damodaran
33
Peak of dot-com boom
After dot-com crash
34
10. Keep your perspecEve
¨ “It’s only a valuaEon.” Nothing in valuaEon is worth losing sleep or developing ulcers over.
¨ “It’s be:er to be lucky than good”. Luck is the dominant paradigm in financial markets, separaEng the winners from the losers. Skill and hard word are distant seconds.
Aswath Damodaran
34