exploring randomness: delusions and opportunities 1
TRANSCRIPT
Exploring Randomness: Delusions and Opportunities
1
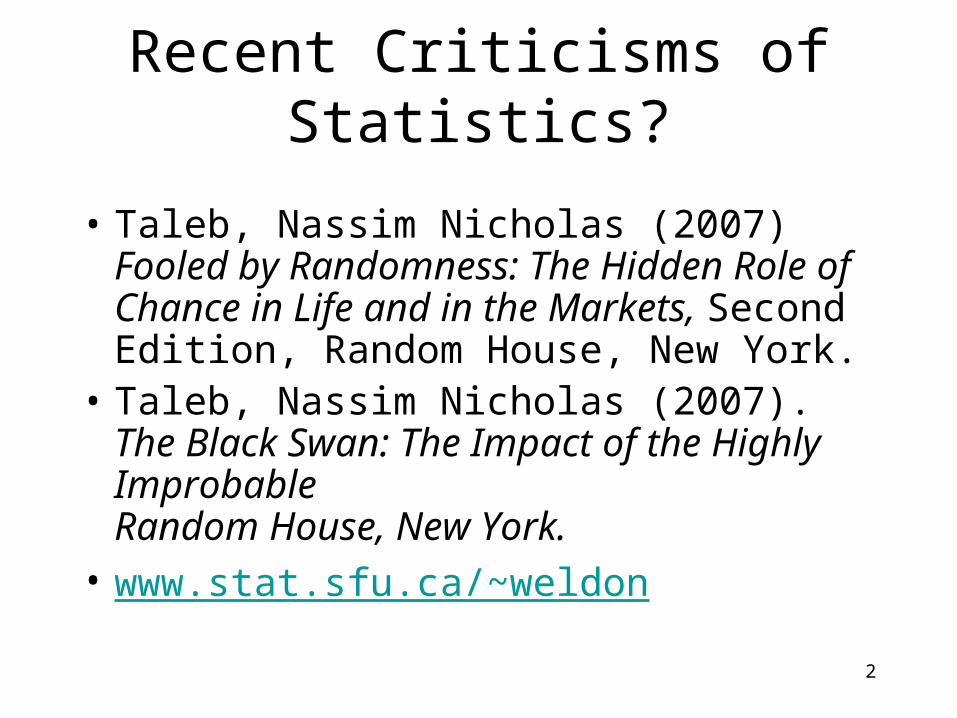
Recent Criticisms of Statistics?
• Taleb, Nassim Nicholas (2007) Fooled by Randomness: The Hidden Role of Chance in Life and in the Markets, Second Edition, Random House, New York.
• Taleb, Nassim Nicholas (2007). The Black Swan: The Impact of the Highly ImprobableRandom House, New York.
• www.stat.sfu.ca/~weldon
2
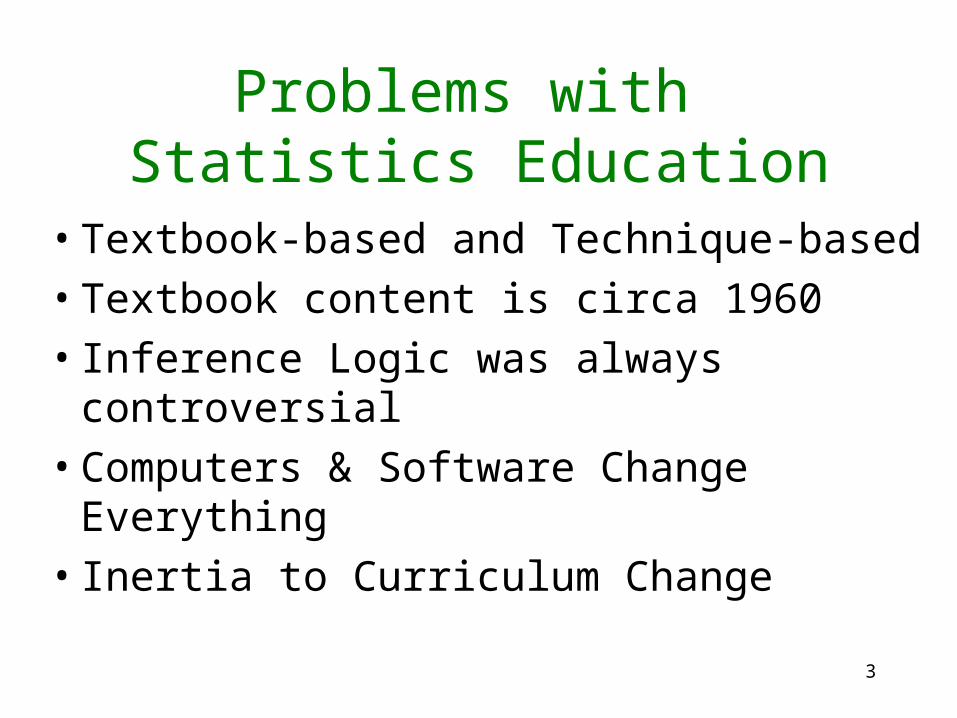
Problems with Statistics Education
• Textbook-based and Technique-based
• Textbook content is circa 1960
• Inference Logic was always controversial
• Computers & Software Change Everything
• Inertia to Curriculum Change
3
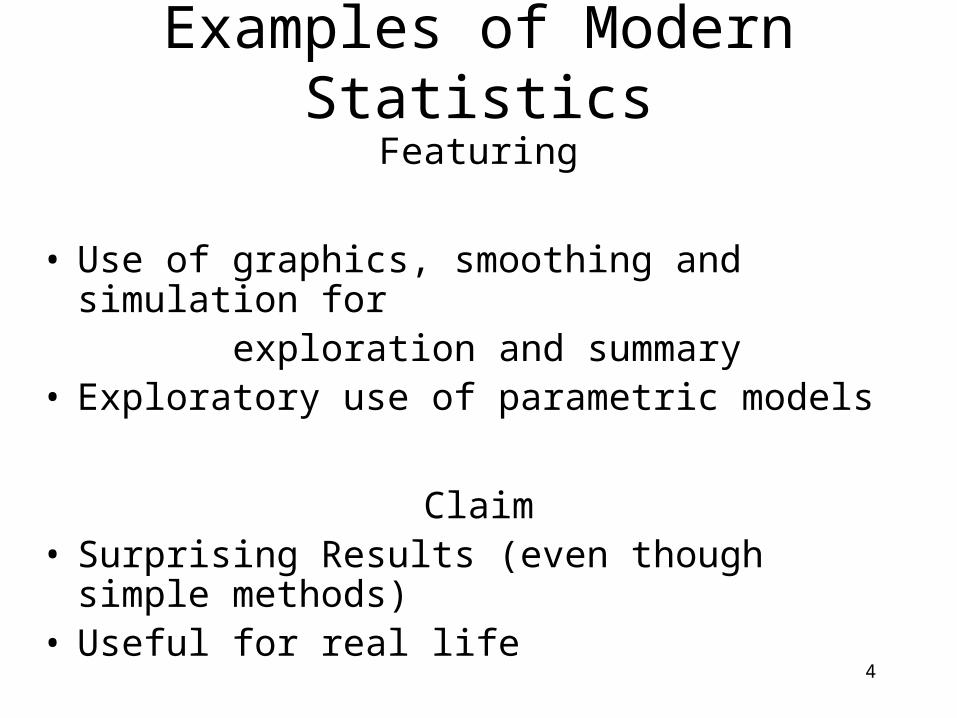
Examples of Modern Statistics
Featuring
• Use of graphics, smoothing and simulation for exploration and summary
• Exploratory use of parametric models
Claim• Surprising Results (even though simple methods)• Useful for real life
4
Example 1 - When is Success just
Good Luck?
An example from the world of Professional Sport
5
6
His team: Geelong
7
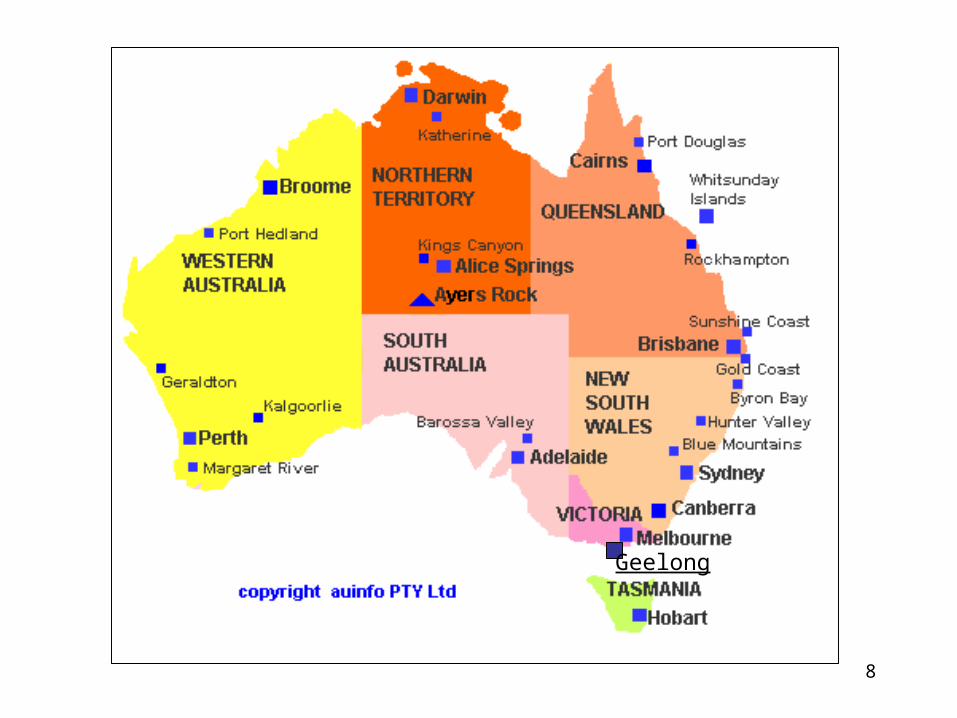
Geelong
8
Recent News Report
“A crowd of 97,302 has witnessed Geelong breakits 44-year premiership drought by crushing a hapless Port Adelaide by a record 119 points in Saturday's grand final at the MCG.” (2007 Season)
9

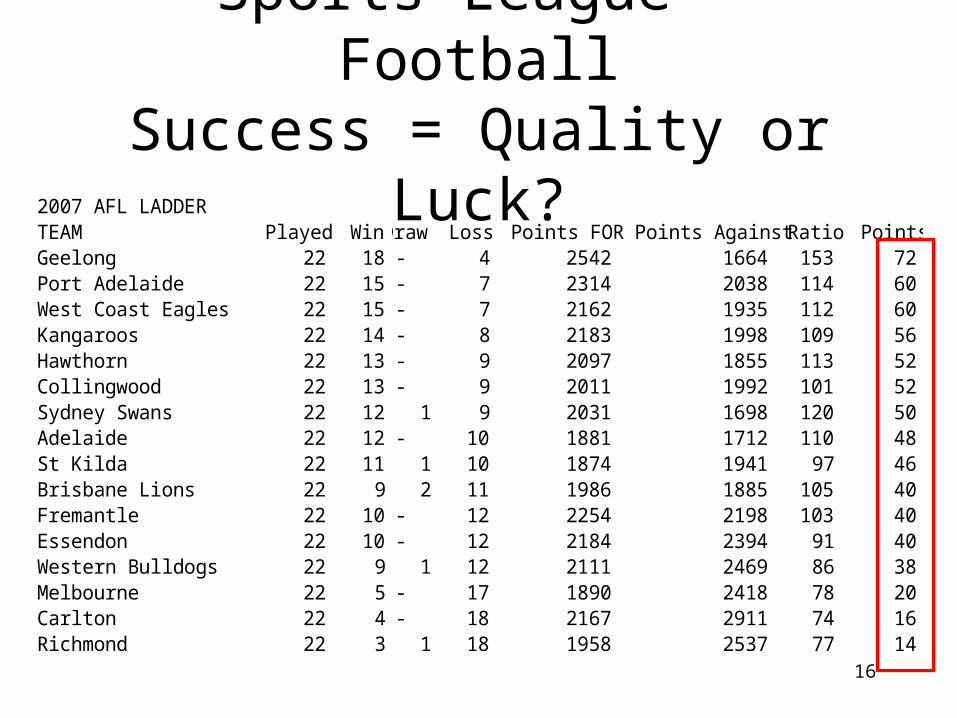
Sports League - FootballSuccess = Quality or Luck?
2007 AFL LADDERTEAM Played WinDraw Loss Points FOR Points Against Ratio PointsGeelong 22 18 - 4 2542 1664 153 72Port Adelaide 22 15 - 7 2314 2038 114 60West Coast Eagles 22 15 - 7 2162 1935 112 60Kangaroos 22 14 - 8 2183 1998 109 56Hawthorn 22 13 - 9 2097 1855 113 52Collingwood 22 13 - 9 2011 1992 101 52Sydney Swans 22 12 1 9 2031 1698 120 50Adelaide 22 12 - 10 1881 1712 110 48St Kilda 22 11 1 10 1874 1941 97 46Brisbane Lions 22 9 2 11 1986 1885 105 40Fremantle 22 10 - 12 2254 2198 103 40Essendon 22 10 - 12 2184 2394 91 40Western Bulldogs 22 9 1 12 2111 2469 86 38Melbourne 22 5 - 17 1890 2418 78 20Carlton 22 4 - 18 2167 2911 74 16Richmond 22 3 1 18 1958 2537 77 14
10
Are there better teams?
• How much variation in the league points table would you expect IFevery team had the same chance of winning every game? i.e. every game is 50-50.
• Try the experiment with 5 teams. H=Win T=Loss (ignore Ties for now)
11
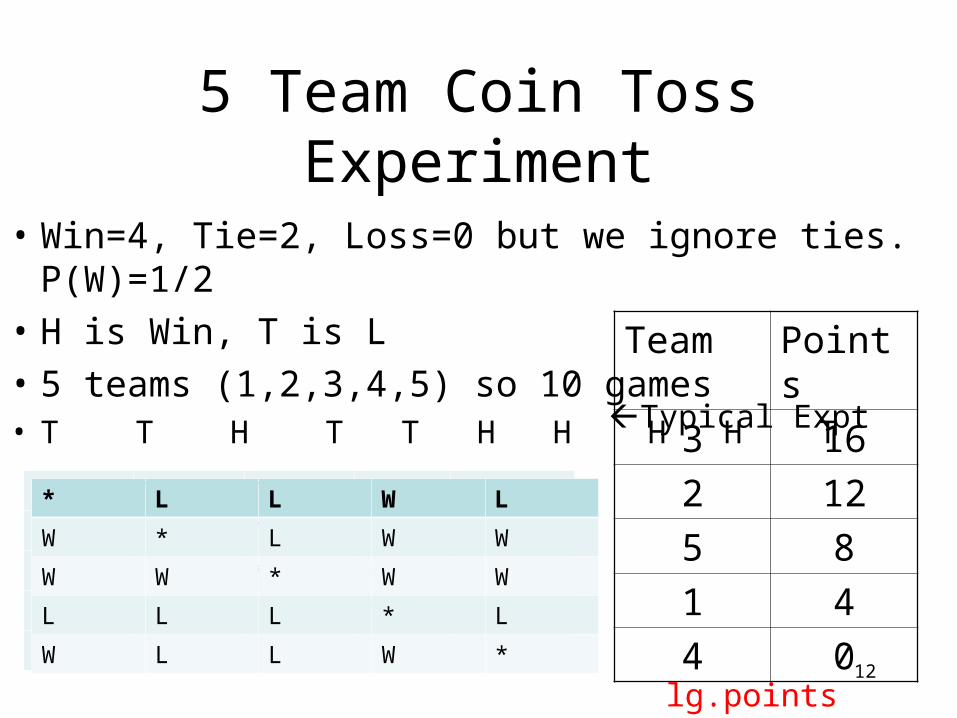
5 Team Coin Toss Experiment
• Win=4, Tie=2, Loss=0 but we ignore ties. P(W)=1/2
• H is Win, T is L
• 5 teams (1,2,3,4,5) so 10 games• T T H T T H H H H T
* T T H T
* T H H
* H H
* T
*
Team Points
3 16
2 12
5 8
1 4
4 0
* L L W L
W * L W W
W W * W W
L L L * L
W L L W *
Typical Expt
lg.points12
Implications?
• “Equal” teams can produce unequal points
• Some point-spread due to chance
• How much?
13

Sports League - FootballSuccess = Quality or Luck?
2007 AFL LADDERTEAM Played WinDraw Loss Points FOR Points Against Ratio PointsGeelong 22 18 - 4 2542 1664 153 72Port Adelaide 22 15 - 7 2314 2038 114 60West Coast Eagles 22 15 - 7 2162 1935 112 60Kangaroos 22 14 - 8 2183 1998 109 56Hawthorn 22 13 - 9 2097 1855 113 52Collingwood 22 13 - 9 2011 1992 101 52Sydney Swans 22 12 1 9 2031 1698 120 50Adelaide 22 12 - 10 1881 1712 110 48St Kilda 22 11 1 10 1874 1941 97 46Brisbane Lions 22 9 2 11 1986 1885 105 40Fremantle 22 10 - 12 2254 2198 103 40Essendon 22 10 - 12 2184 2394 91 40Western Bulldogs 22 9 1 12 2111 2469 86 38Melbourne 22 5 - 17 1890 2418 78 20Carlton 22 4 - 18 2167 2911 74 16Richmond 22 3 1 18 1958 2537 77 14
14
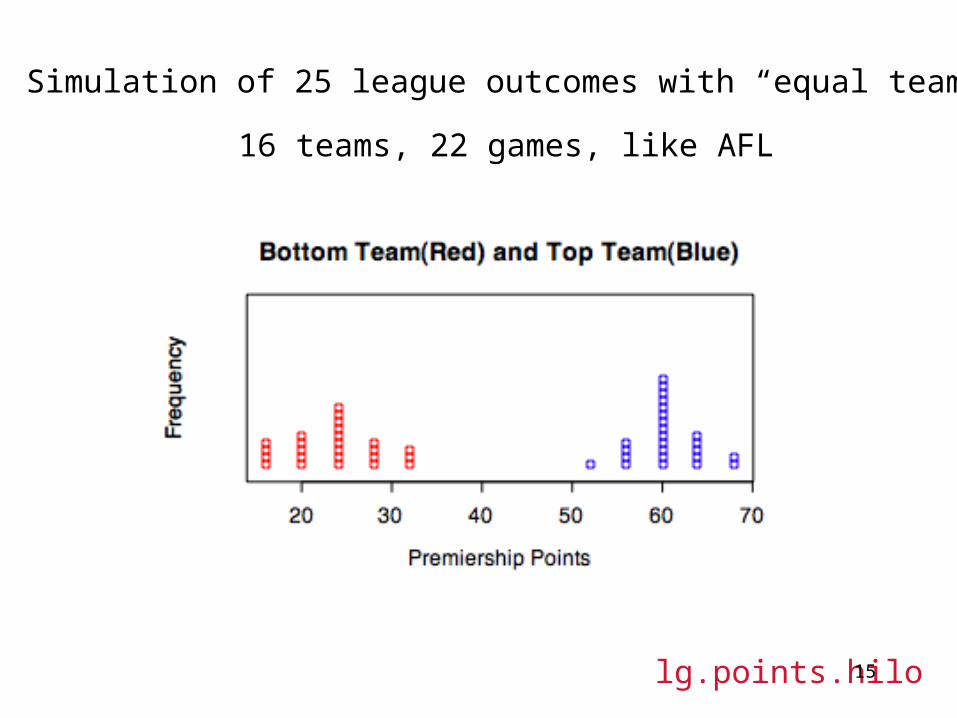
Simulation of 25 league outcomes with “equal teams”
16 teams, 22 games, like AFL
lg.points.hilo15
Sports League - FootballSuccess = Quality or Luck?
2007 AFL LADDERTEAM Played WinDraw Loss Points FOR Points Against Ratio PointsGeelong 22 18 - 4 2542 1664 153 72Port Adelaide 22 15 - 7 2314 2038 114 60West Coast Eagles 22 15 - 7 2162 1935 112 60Kangaroos 22 14 - 8 2183 1998 109 56Hawthorn 22 13 - 9 2097 1855 113 52Collingwood 22 13 - 9 2011 1992 101 52Sydney Swans 22 12 1 9 2031 1698 120 50Adelaide 22 12 - 10 1881 1712 110 48St Kilda 22 11 1 10 1874 1941 97 46Brisbane Lions 22 9 2 11 1986 1885 105 40Fremantle 22 10 - 12 2254 2198 103 40Essendon 22 10 - 12 2184 2394 91 40Western Bulldogs 22 9 1 12 2111 2469 86 38Melbourne 22 5 - 17 1890 2418 78 20Carlton 22 4 - 18 2167 2911 74 16Richmond 22 3 1 18 1958 2537 77 14
16
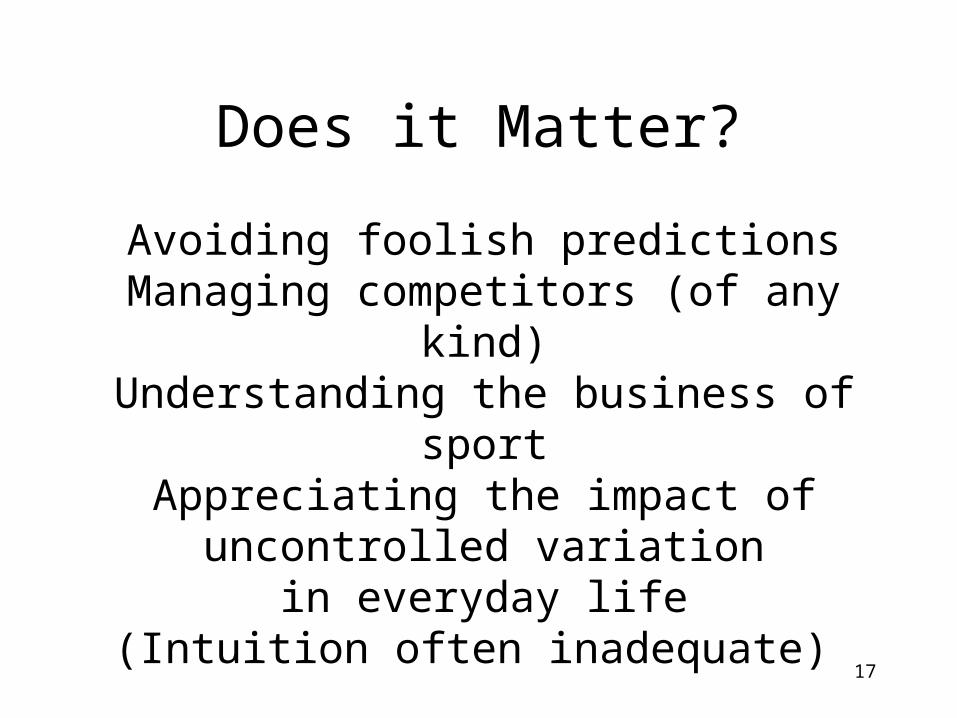
Does it Matter?
Avoiding foolish predictionsManaging competitors (of any kind)Understanding the business of sport
Appreciating the impact of uncontrolled variationin everyday life
(Intuition often inadequate)
17
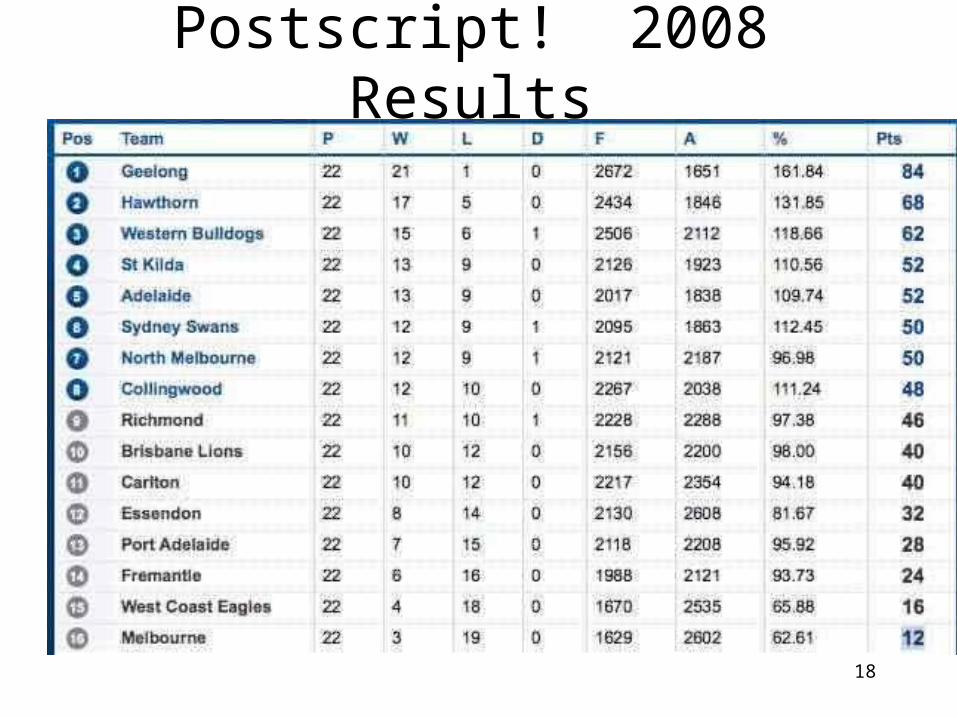
Postscript! 2008 Results
18
Example 2 - Order from Apparent Chaos
An example from some personal data collection
19
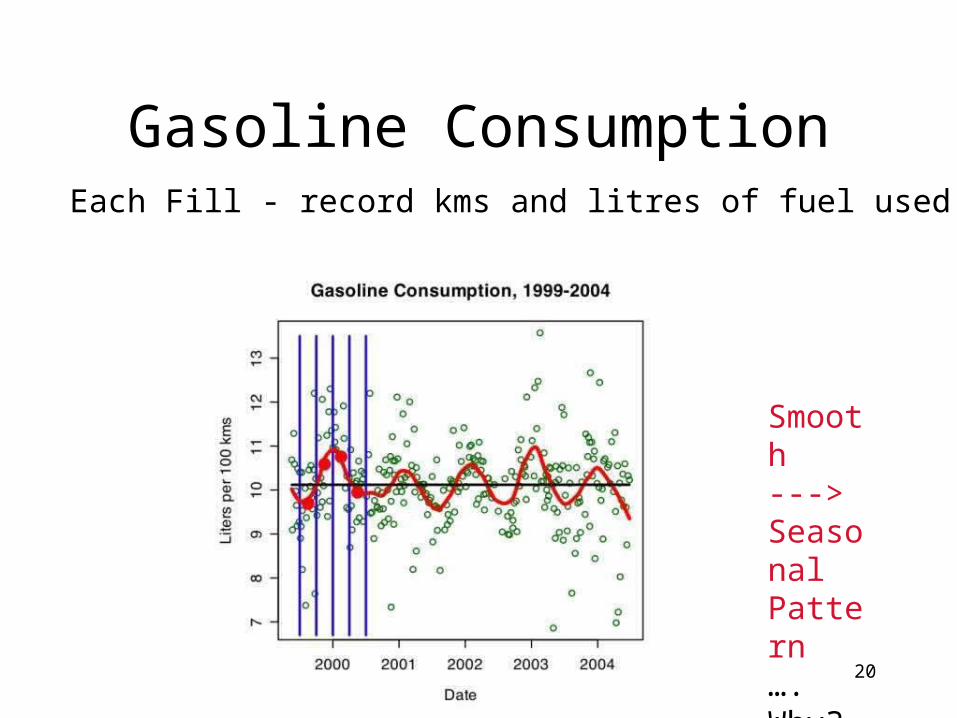
Gasoline ConsumptionEach Fill - record kms and litres of fuel used
Smooth--->SeasonalPattern….Why?
20
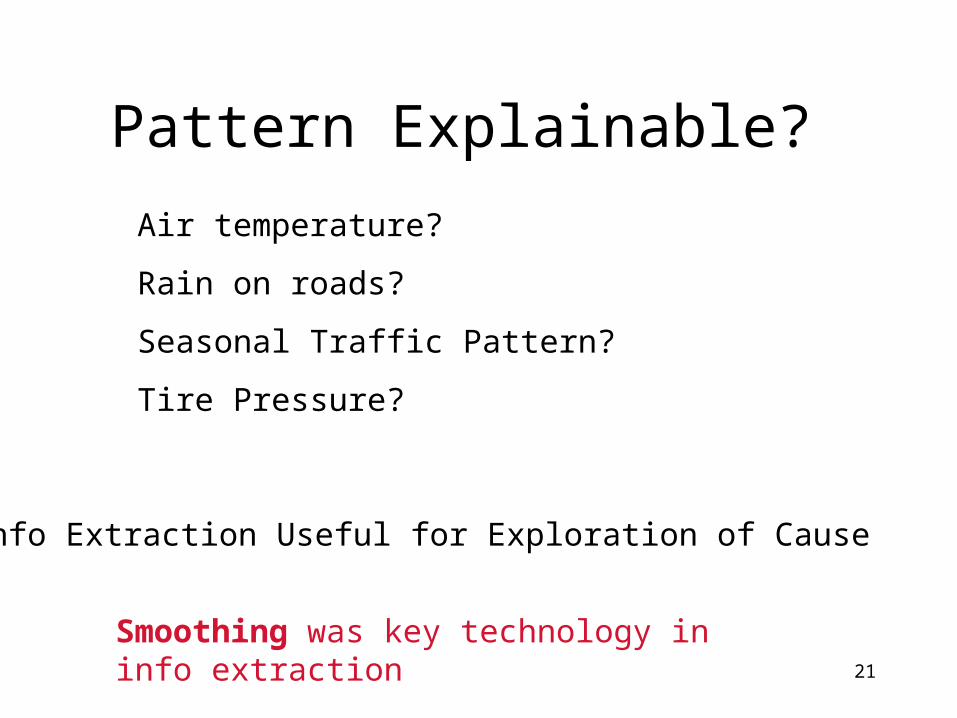
Pattern Explainable?
Air temperature?
Rain on roads?
Seasonal Traffic Pattern?
Tire Pressure?
Info Extraction Useful for Exploration of Cause
Smoothing was key technology in info extraction21
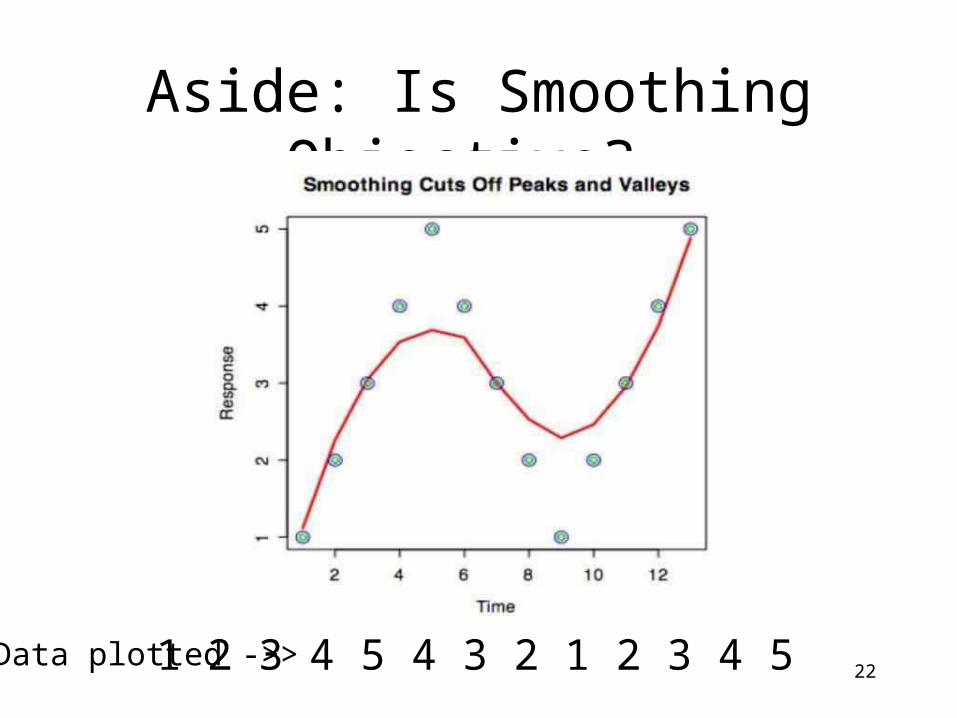
Aside: Is Smoothing Objective?
1 2 3 4 5 4 3 2 1 2 3 4 5Data plotted ->>22
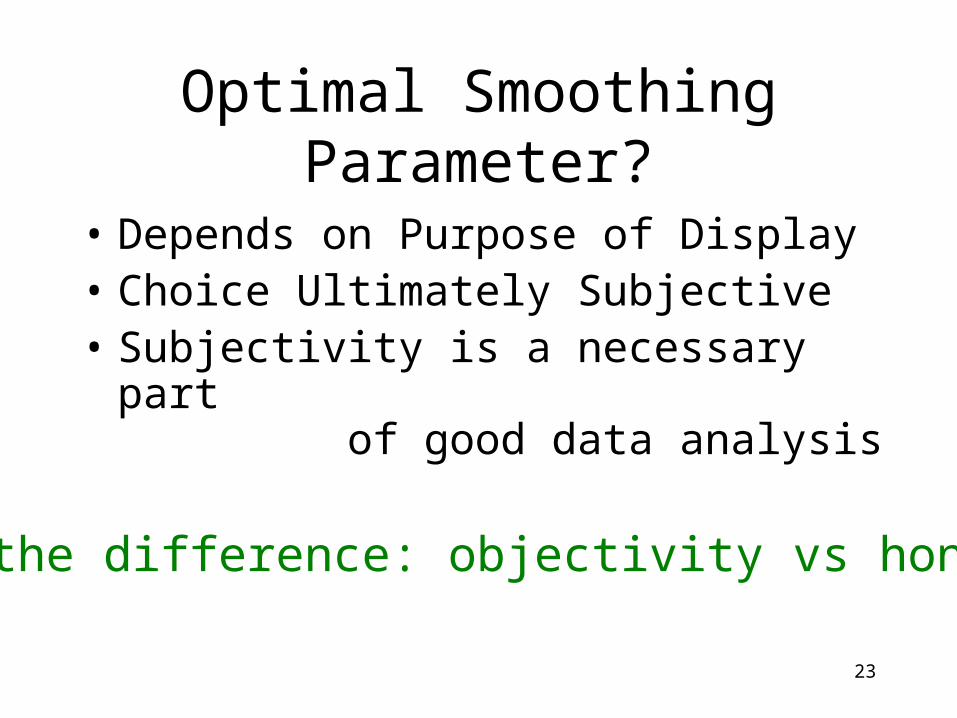
Optimal Smoothing Parameter?
• Depends on Purpose of Display• Choice Ultimately Subjective• Subjectivity is a necessary part
of good data analysis
Note the difference: objectivity vs honesty!
23
Summary of this Example
• Surprising? Order from Chaos …
• Principle - Smoothing and Averaging reveal patterns encouraging investigation of cause
24
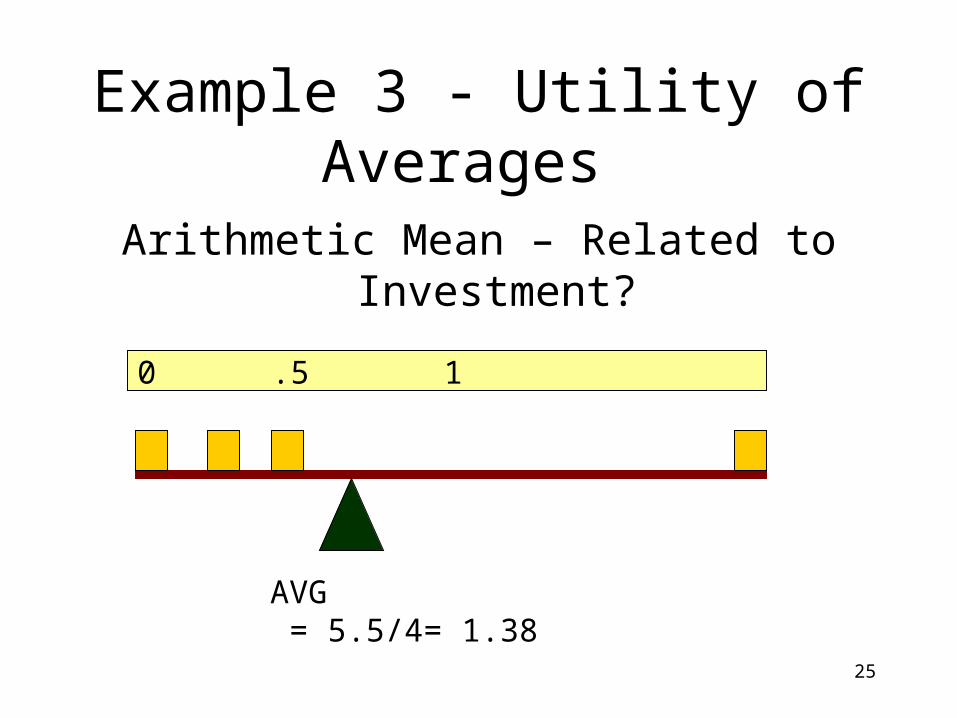
Example 3 - Utility of Averages
Arithmetic Mean – Related to Investment?
0 .5 1 4
AVG = 5.5/4= 1.38
25
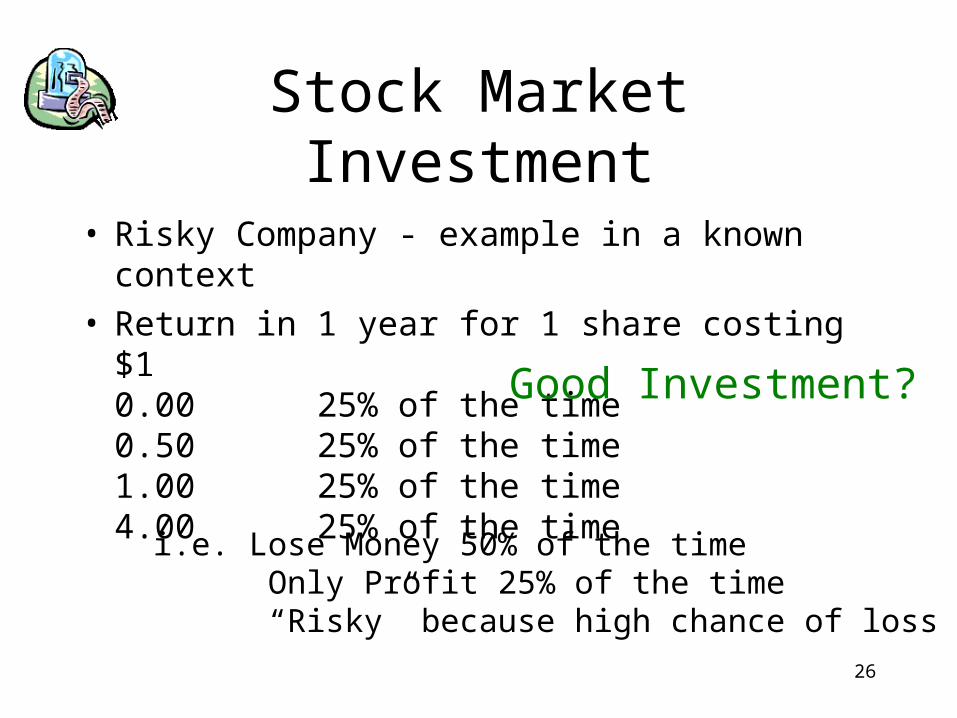
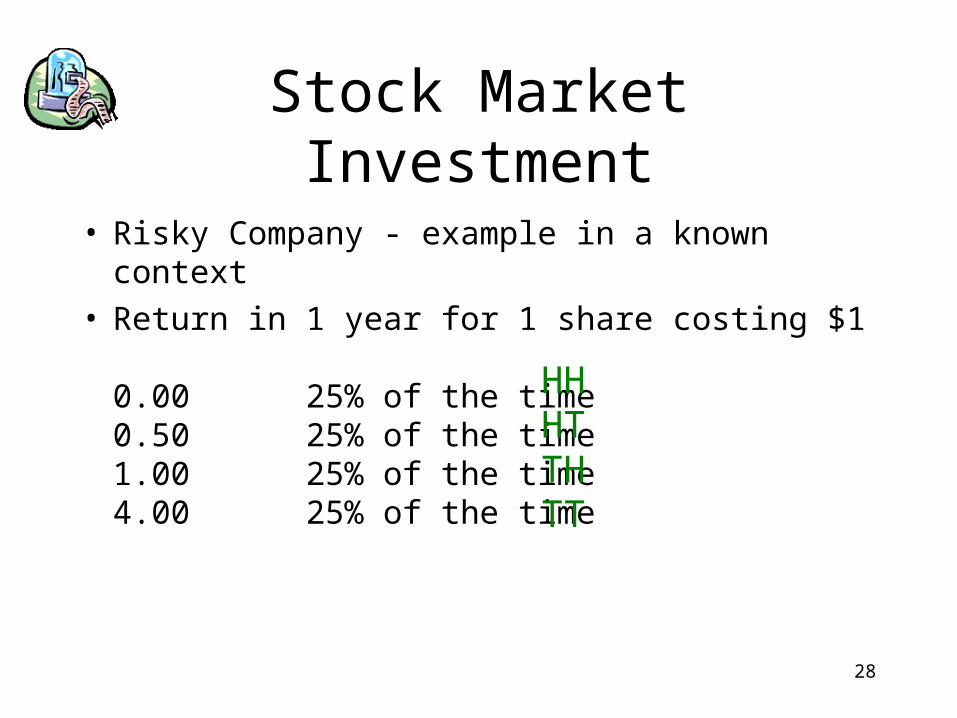
Stock Market Investment
• Risky Company - example in a known context• Return in 1 year for 1 share costing $1
0.00 25% of the time0.50 25% of the time1.00 25% of the time4.00 25% of the time
i.e. Lose Money 50% of the time Only Profit 25% of the time “Risky” because high chance of loss
Good Investment?
26
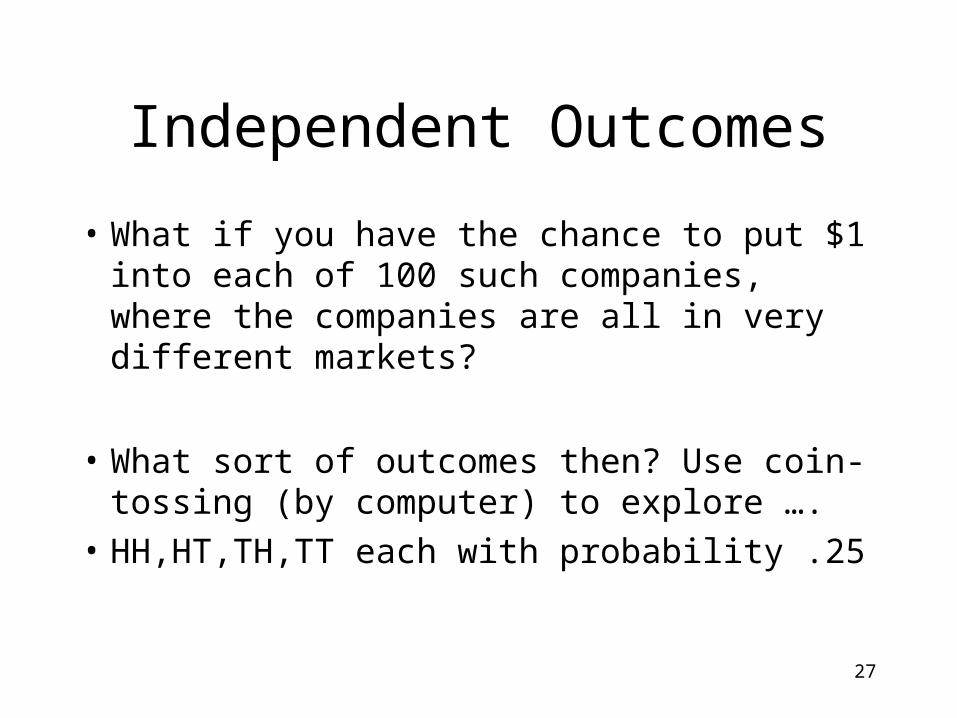
Independent Outcomes
• What if you have the chance to put $1 into each of 100 such companies, where the companies are all in very different markets?
• What sort of outcomes then? Use coin-tossing (by computer) to explore ….
• HH,HT,TH,TT each with probability .25
27
Stock Market Investment
• Risky Company - example in a known context• Return in 1 year for 1 share costing $1
0.00 25% of the time 0.50 25% of the time1.00 25% of the time4.00 25% of the time
HHHTTHTT
28
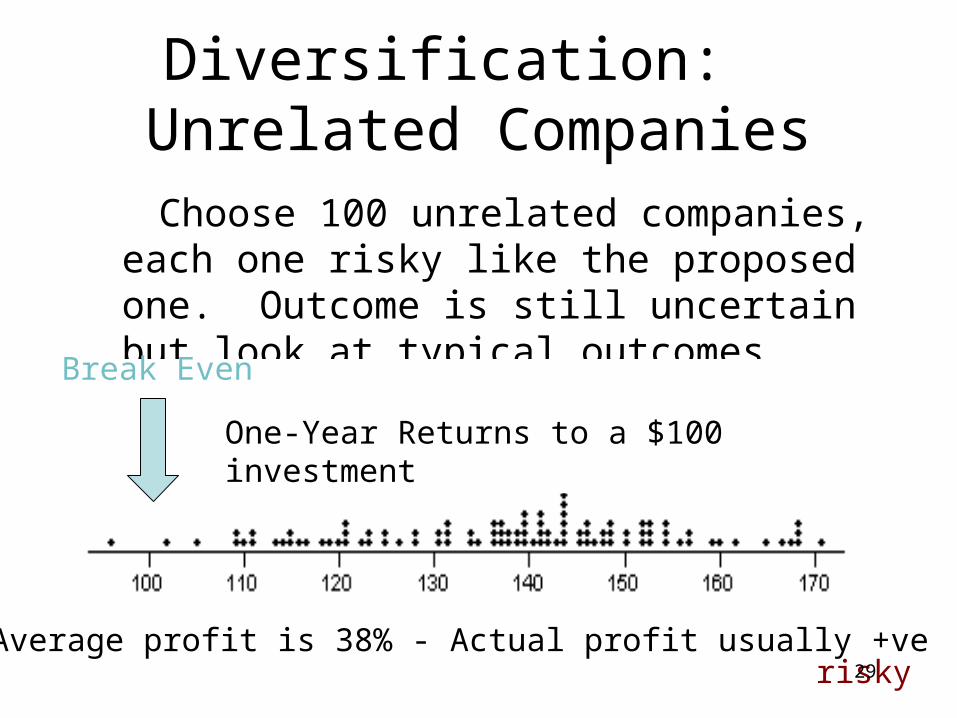
Diversification: Unrelated Companies
Choose 100 unrelated companies, each one risky like the proposed one. Outcome is still uncertain but look at typical outcomes ….
One-Year Returns to a $100 investment
Break Even
Average profit is 38% - Actual profit usually +verisky29
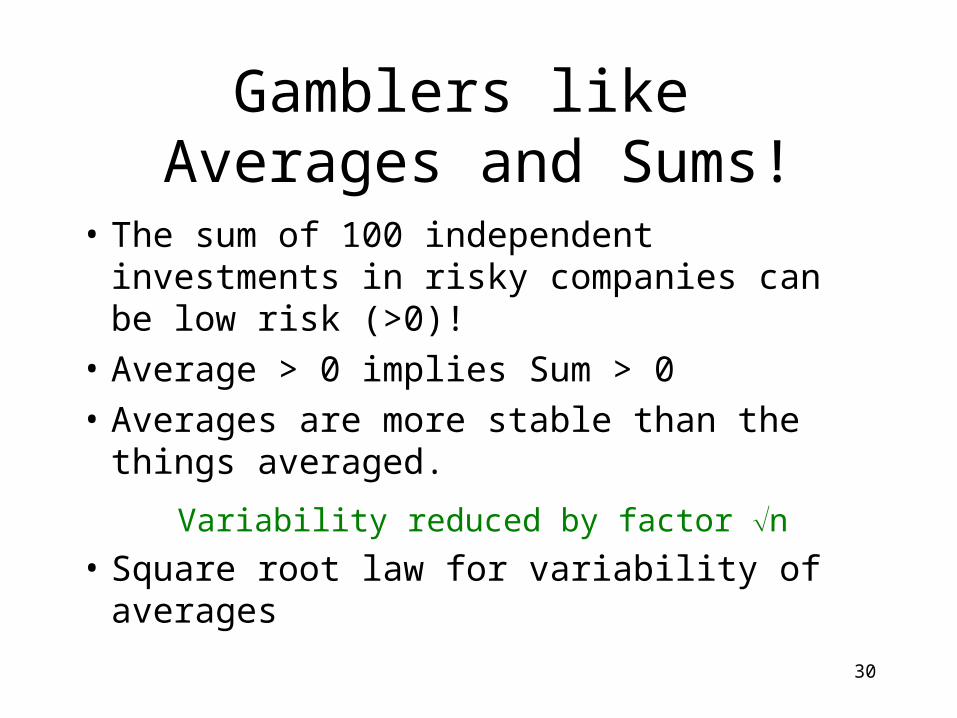
Gamblers like Averages and Sums!
• The sum of 100 independent investments in risky companies can be low risk (>0)!
• Average > 0 implies Sum > 0
• Averages are more stable than the things averaged.
• Square root law for variability of averages
Variability reduced by factor n
30
Summary of Example 3
• Diversification of investments allows tolerance of risky investments
• Simulation and graphics allow study of this phenomenon
31
Example 7 - Survival Assessment
• Personal Data is always hard to get.
• Need to make careful use of minimal data
• Here is an example ….
32
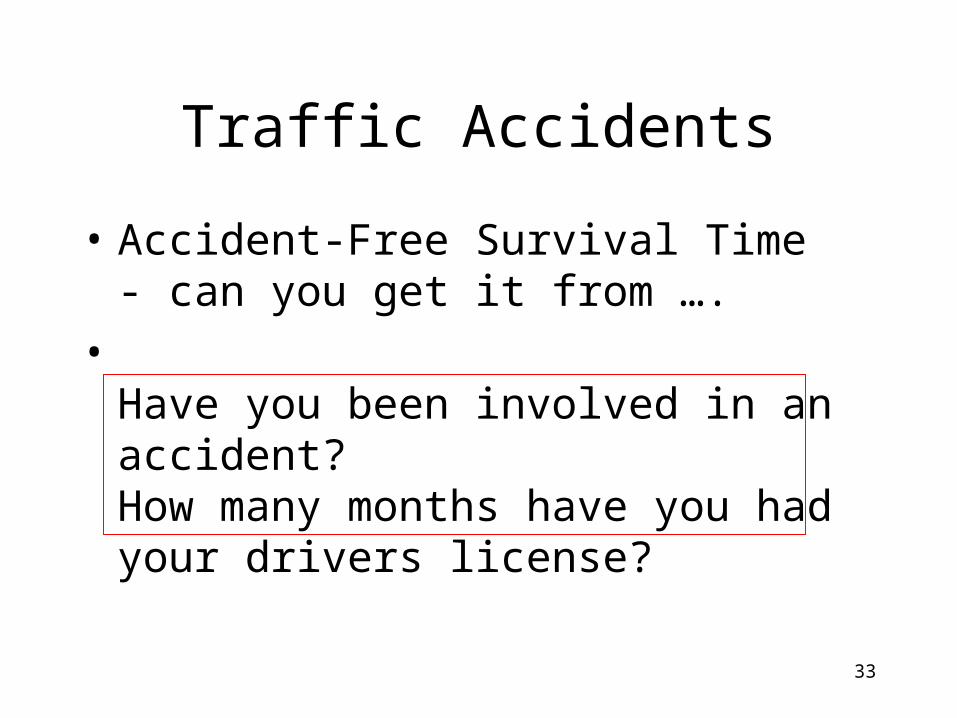
Traffic Accidents
• Accident-Free Survival Time- can you get it from ….
•Have you been involved in an accident?How many months have you had your drivers license?
33
Accident Free Survival Time
Probability that
34
Accident Next Month
Can show that, for my 2002 class of 100 students,chance of accident next month
was about 1%.
35
Summary of Example 7
• Very Simple Survey produced useful information about driving risk
• Survival Analysis, based on empirical risk rates and smoothing, is a general way to summarize duration information
36
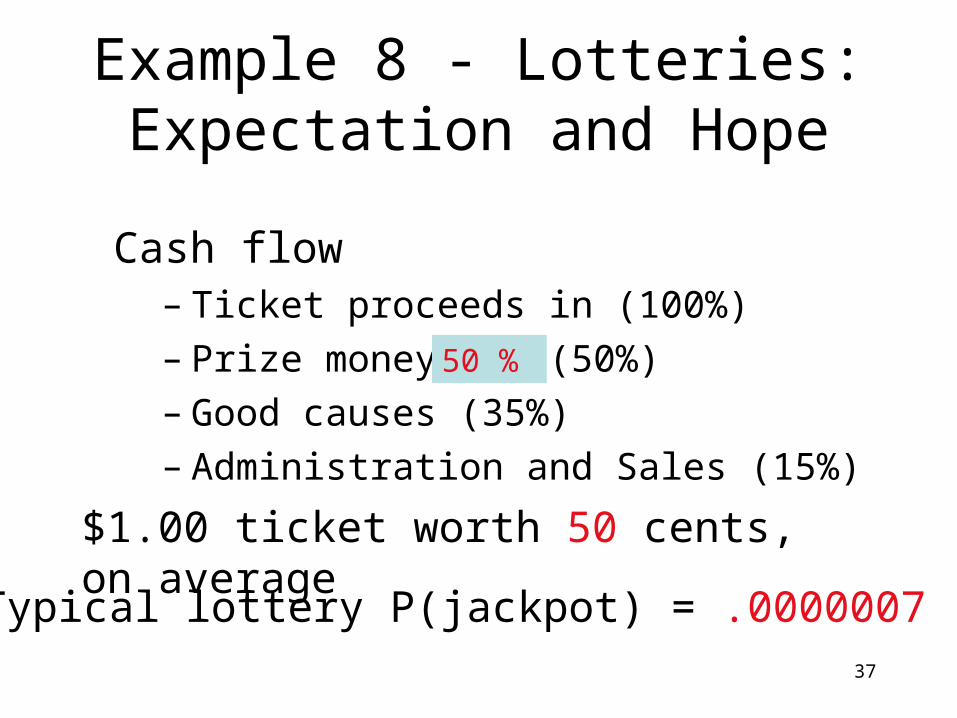
Example 8 - Lotteries:Expectation and Hope
Cash flow – Ticket proceeds in (100%)– Prize money out (50%)– Good causes (35%)– Administration and Sales (15%)
50 %
$1.00 ticket worth 50 cents, on average
Typical lottery P(jackpot) = .000000737
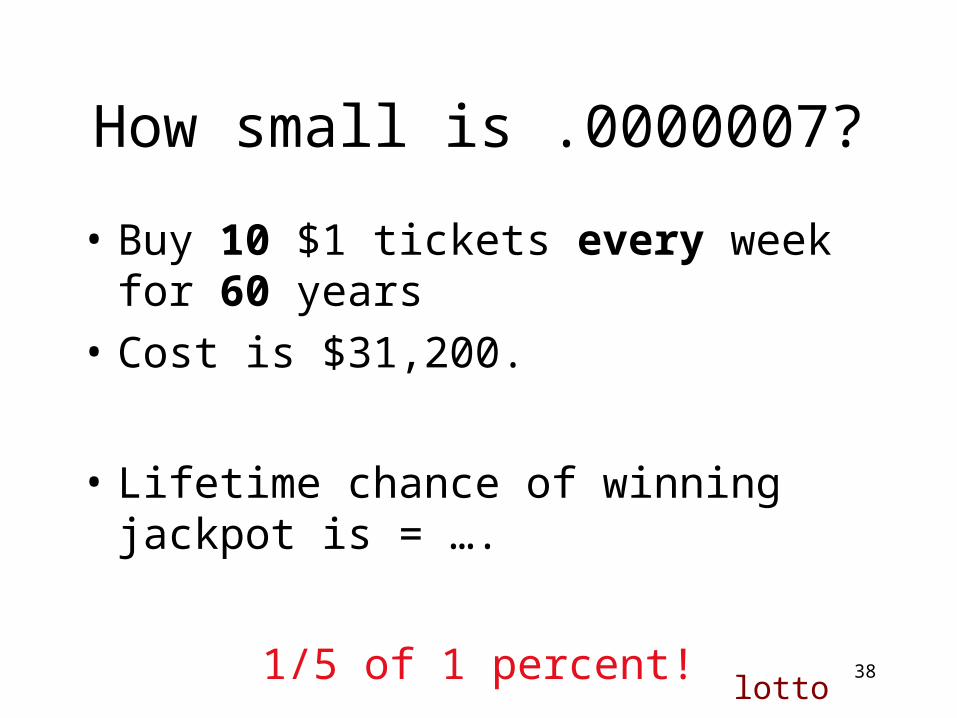
How small is .0000007?
• Buy 10 $1 tickets every week for 60 years
• Cost is $31,200.
• Lifetime chance of winning jackpot is = ….
1/5 of 1 percent!
lotto38
Summary
•Surprising that lottery tickets provide so little hope!
•Key technology is exploratory use of a probability model
39
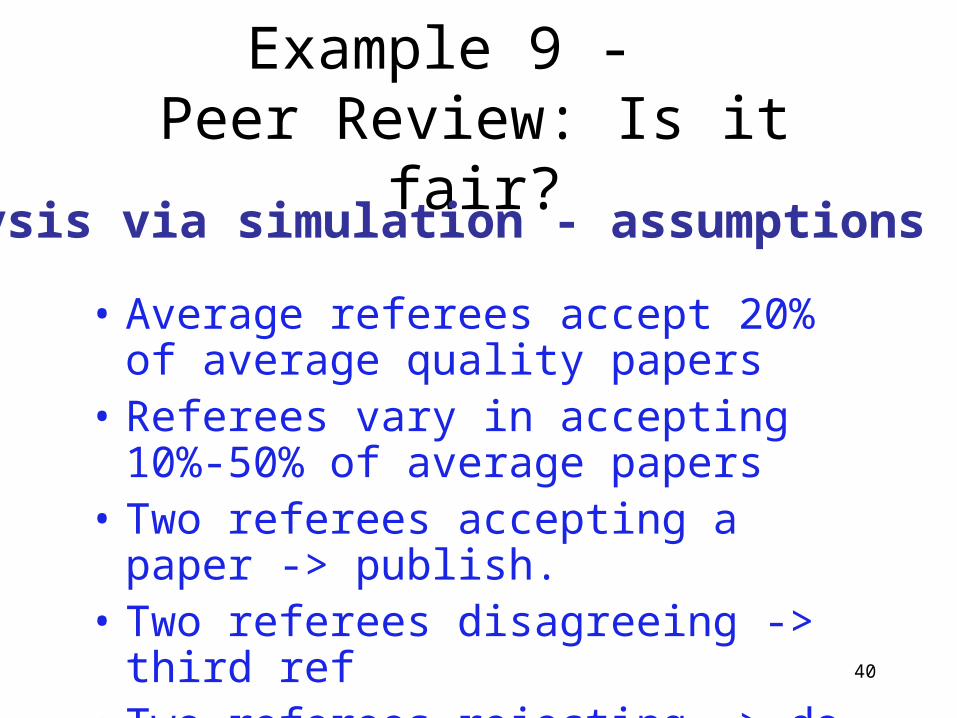
Example 9 - Peer Review: Is it fair?
• Average referees accept 20% of average quality papers
• Referees vary in accepting 10%-50% of average papers
• Two referees accepting a paper -> publish.• Two referees disagreeing -> third ref• Two referees rejecting -> do not publish
Analysis via simulation - assumptions are:
40
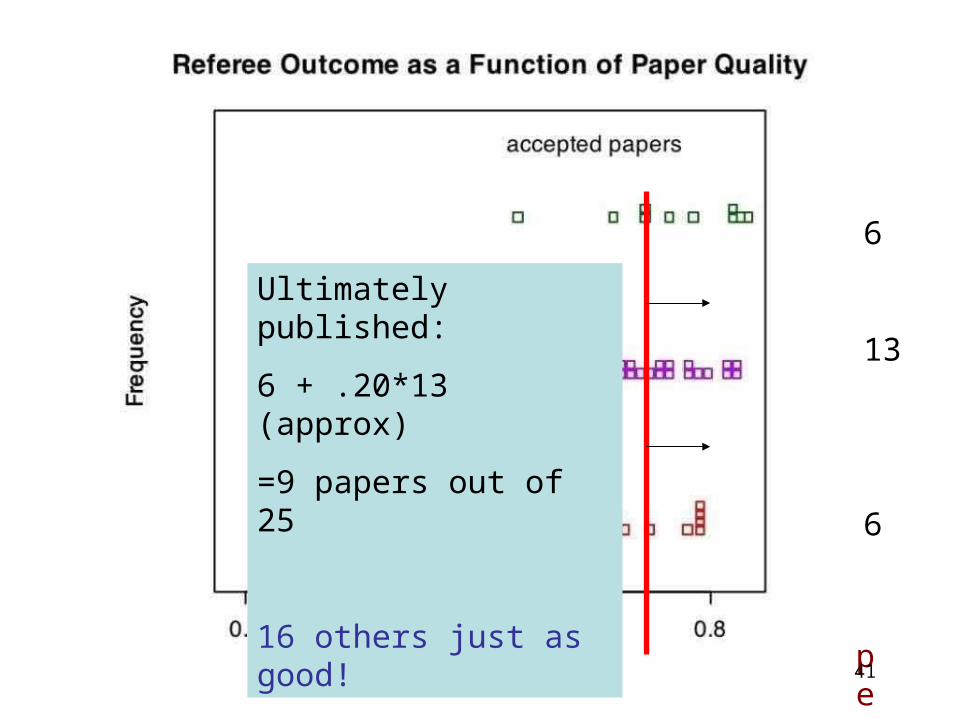
6
13
6
Ultimately published:
6 + .20*13 (approx)
=9 papers out of 25
16 others just as good!
peer
41
Peer Review Fair?
• Does select some of the best papers but
• Does not select most of the best papers
• Similar property of school admission systems, competition review boards, etc.
42
Summary of Example 9
•Surprising that peer review is so dependent on chance
•Key procedure is to use simulationto explore effect of randomness inthis context
43
Example 10 - Investment:Back-the-winner fallacy
• Mutual Funds - a way of diversifying a small investment
• Which mutual fund?
• Look at past performance?
• Experience from symmetric random walk …
44
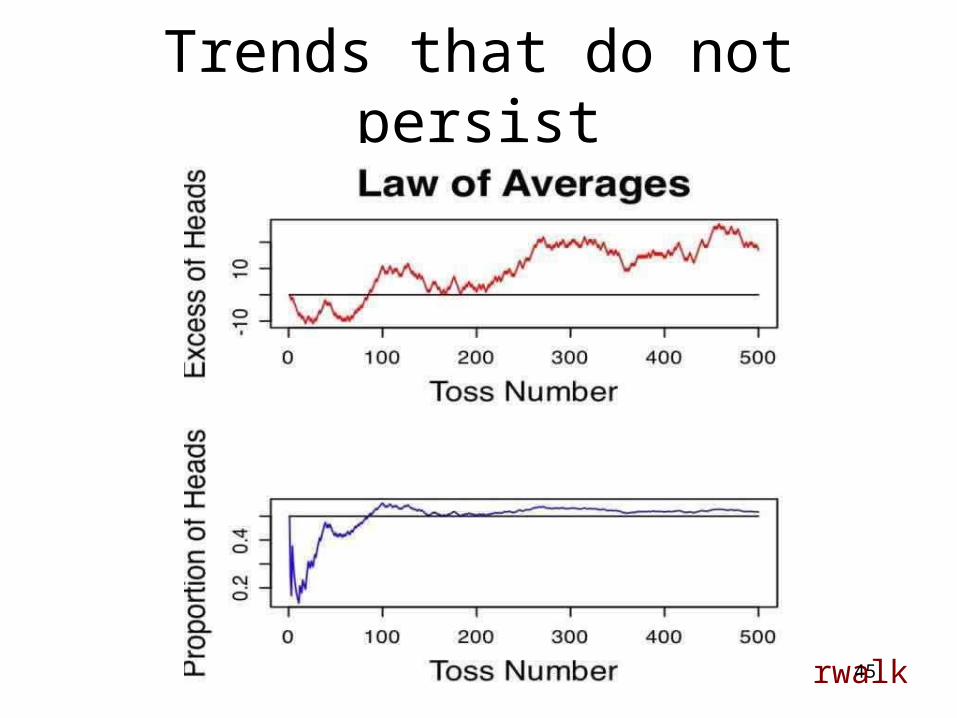
Trends that do not persist
rwalk45
Implication from Random Walk …?
• Stock market trends may not persist
• Past might not be a good guide to future
• Some fund managers better than others?
• A small difference can result in a big difference over a long time …
46
A simulation experiment to determine the value of past
performance data
• Simulate good and bad managers
• Pick the best ones based on 5 years data
• Simulate a future 5-yrs for these select managers
47
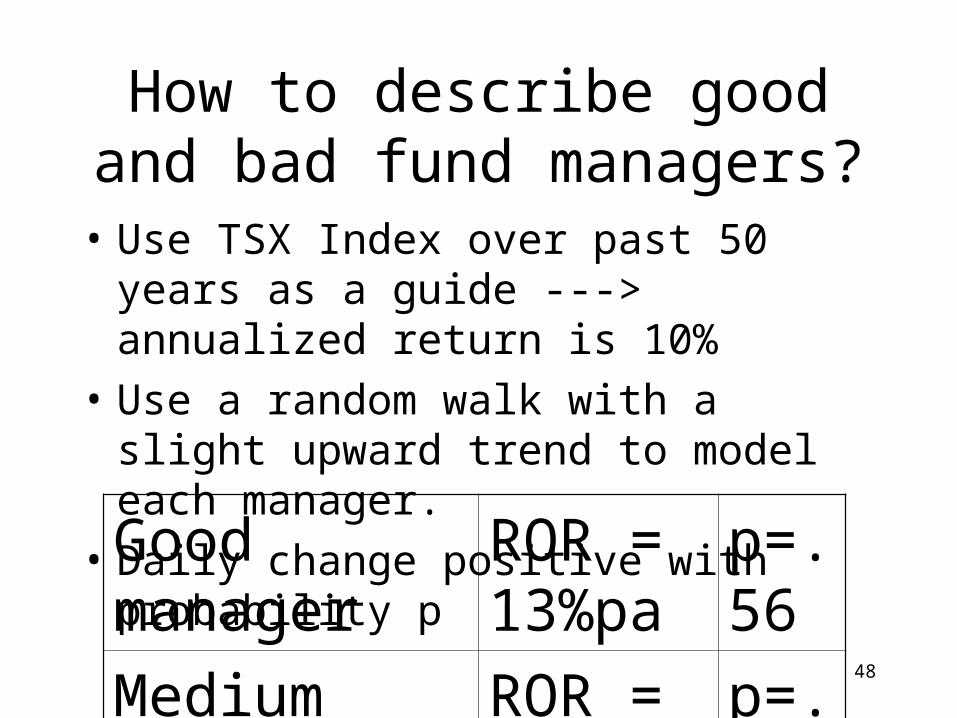
How to describe good and bad fund managers?
• Use TSX Index over past 50 years as a guide ---> annualized return is 10%
• Use a random walk with a slight upward trend to model each manager.
• Daily change positive with probability p
Good manager ROR = 13%pa
p=.56
Medium manager
ROR = 10%pa
p=.55
Poor manager ROR = 8% pa
p=.54
48
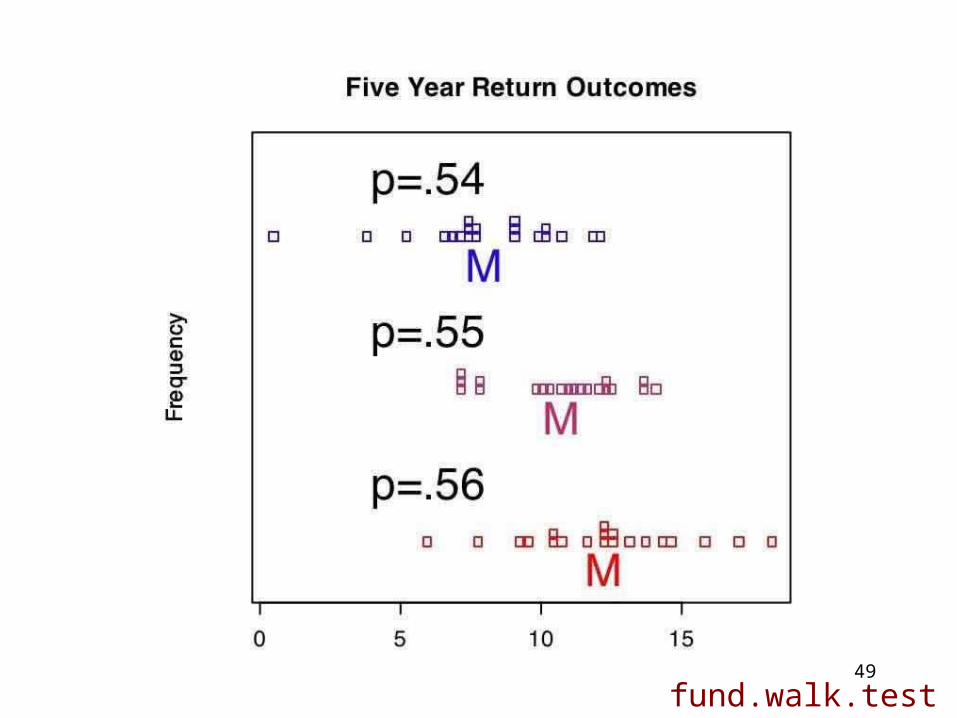
fund.walk.test49
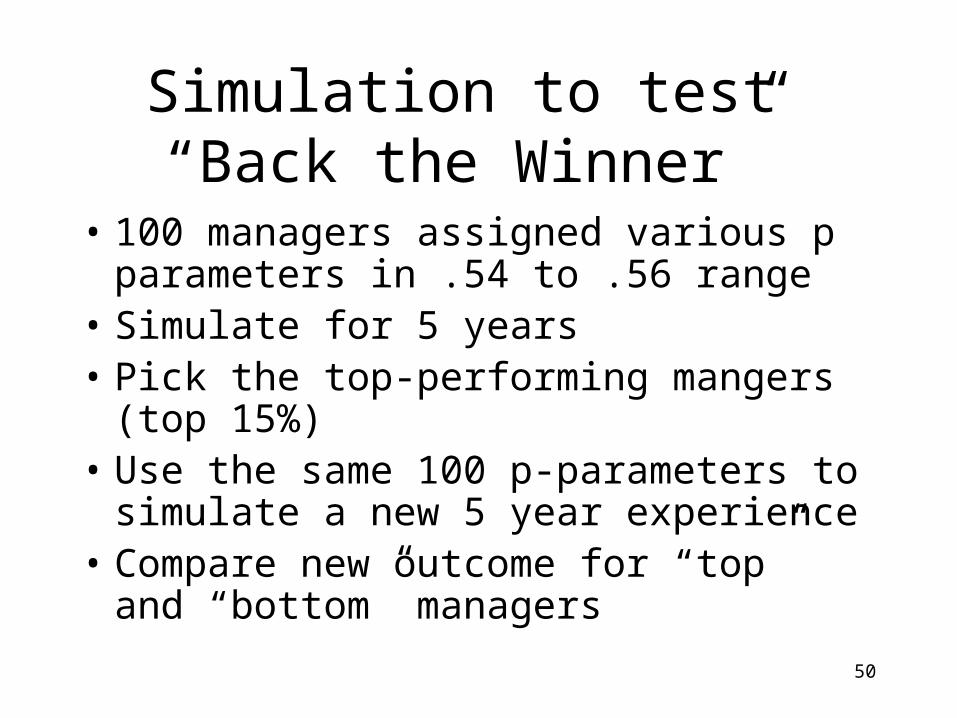
Simulation to test “Back the Winner”
• 100 managers assigned various p parameters in .54 to .56 range
• Simulate for 5 years• Pick the top-performing mangers (top 15%)• Use the same 100 p-parameters to simulate
a new 5 year experience• Compare new outcome for “top” and
“bottom” managers
50
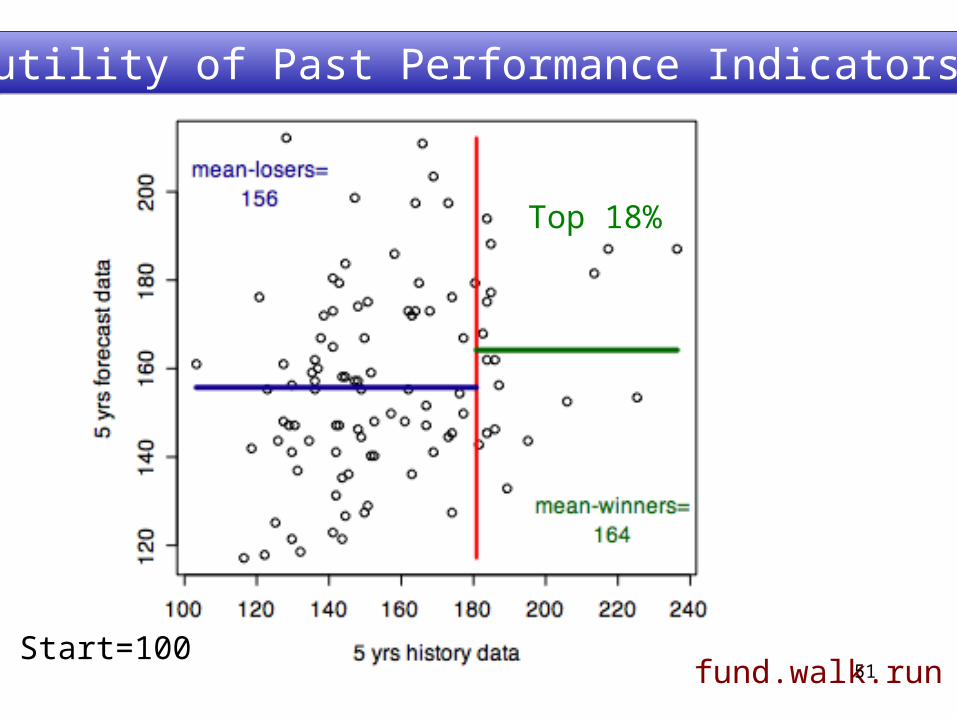
Top 18%
Start=100fund.walk.run
Futility of Past Performance IndicatorsFutility of Past Performance Indicators
51
Mutual Fund Advice?
Don’t expect past relative performance to be a good indicator of future relative performance.
Again - need to give due allowance for randomness (i.e. LUCK)
52
Summary of Example 10
• Surprising that Past Performance is such a poor indicator of Future Performance (not enough for “due diligence”)
• Simulation is the key to exploring this issue
53
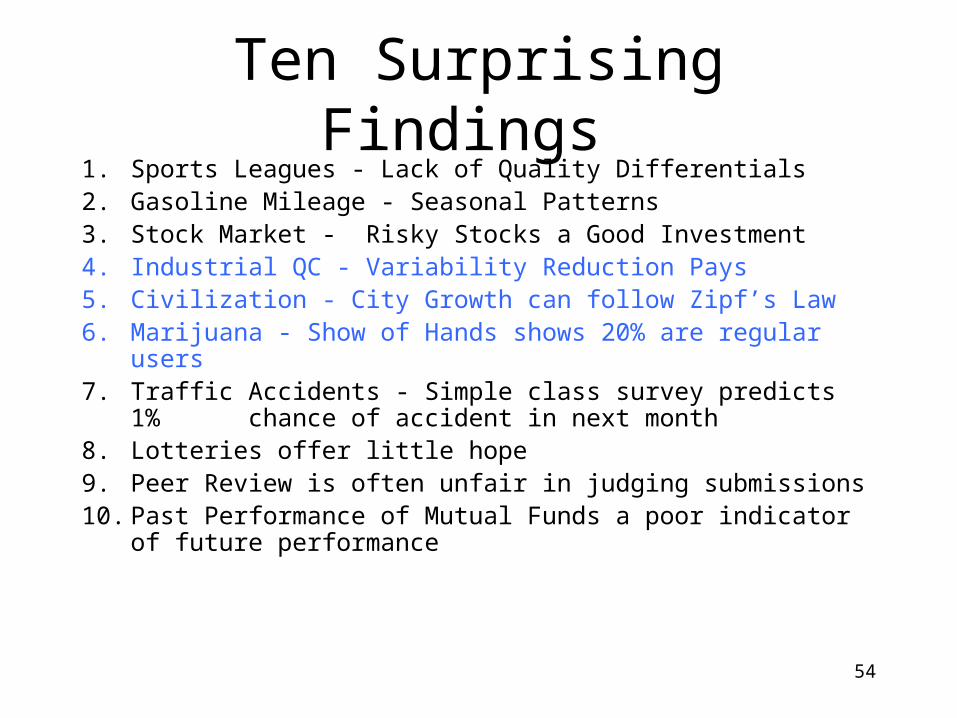
Ten Surprising Findings 1. Sports Leagues - Lack of Quality Differentials 2. Gasoline Mileage - Seasonal Patterns 3. Stock Market - Risky Stocks a Good Investment4. Industrial QC - Variability Reduction Pays5. Civilization - City Growth can follow Zipf’s Law6. Marijuana - Show of Hands shows 20% are regular users7. Traffic Accidents - Simple class survey predicts 1% chance
of accident in next month8. Lotteries offer little hope9. Peer Review is often unfair in judging submissions10. Past Performance of Mutual Funds a poor indicator of future
performance
54
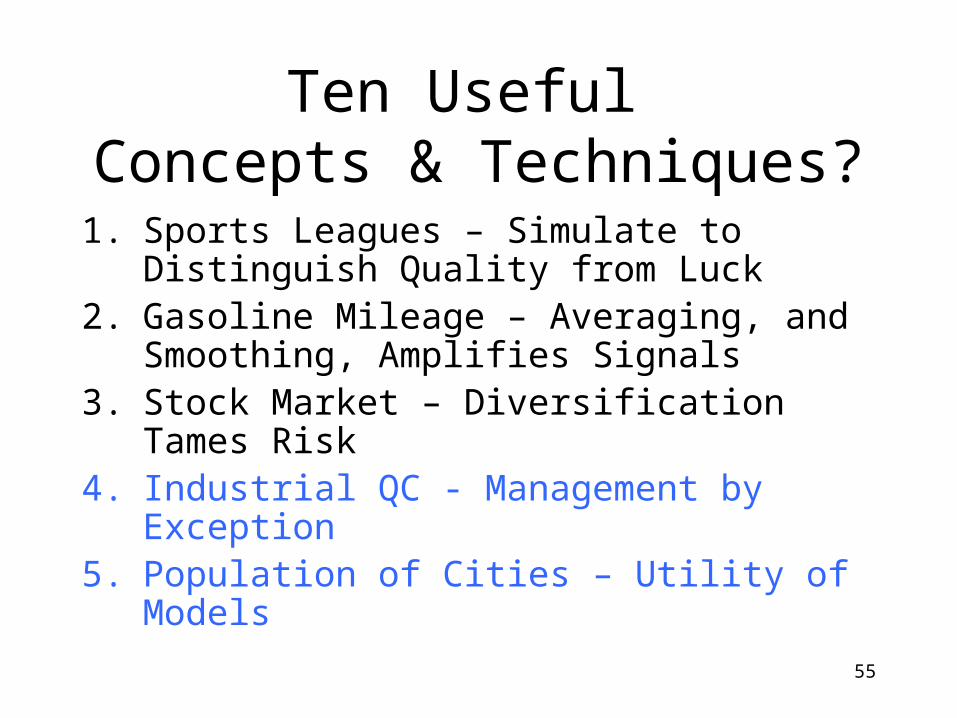
Ten Useful Concepts & Techniques?
1. Sports Leagues – Simulate to Distinguish Quality from Luck
2. Gasoline Mileage – Averaging, and Smoothing, Amplifies Signals
3. Stock Market – Diversification Tames Risk4. Industrial QC - Management by Exception5. Population of Cities – Utility of Models
55
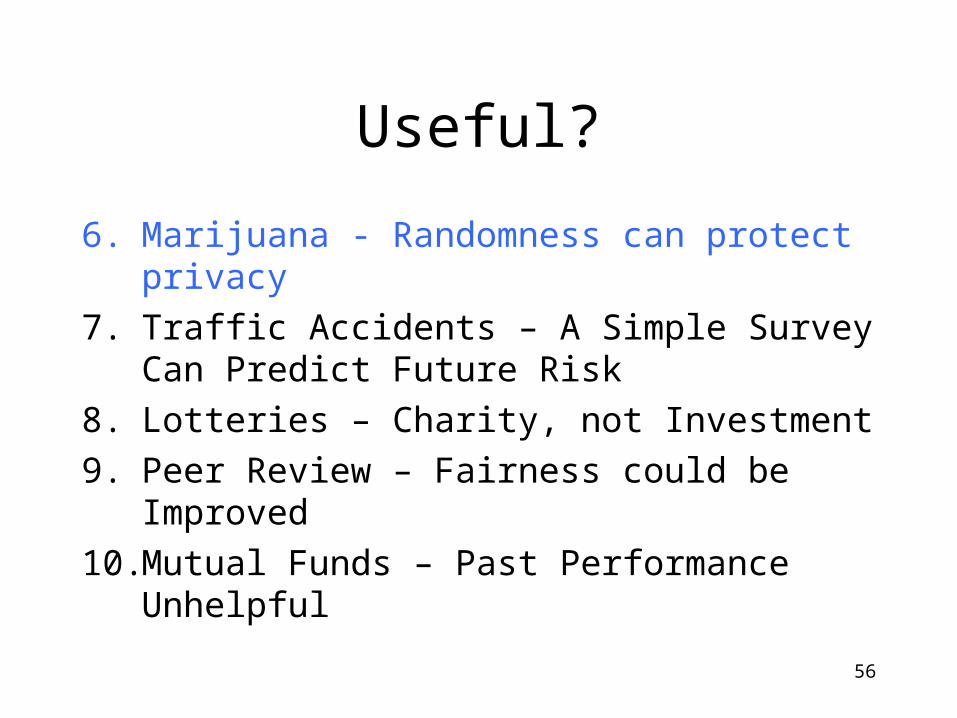
Useful?
6. Marijuana - Randomness can protect privacy
7. Traffic Accidents – A Simple Survey Can Predict Future Risk
8. Lotteries – Charity, not Investment
9. Peer Review – Fairness could be Improved
10. Mutual Funds – Past Performance Unhelpful
56
Questions
Will SFU graduates be “fooled by randomness”?
How can stats education be improved?
57
For More Background …
• Taleb, Nassim Nicholas (2007) Fooled by Randomness: The Hidden Role of Chance in Life and in the Markets, Second Edition, Random House, New York.
• Taleb, Nassim Nicholas (2007). The Black Swan: The Impact of the Highly ImprobableRandom House, New York.
• www.stat.sfu.ca/~weldon
58
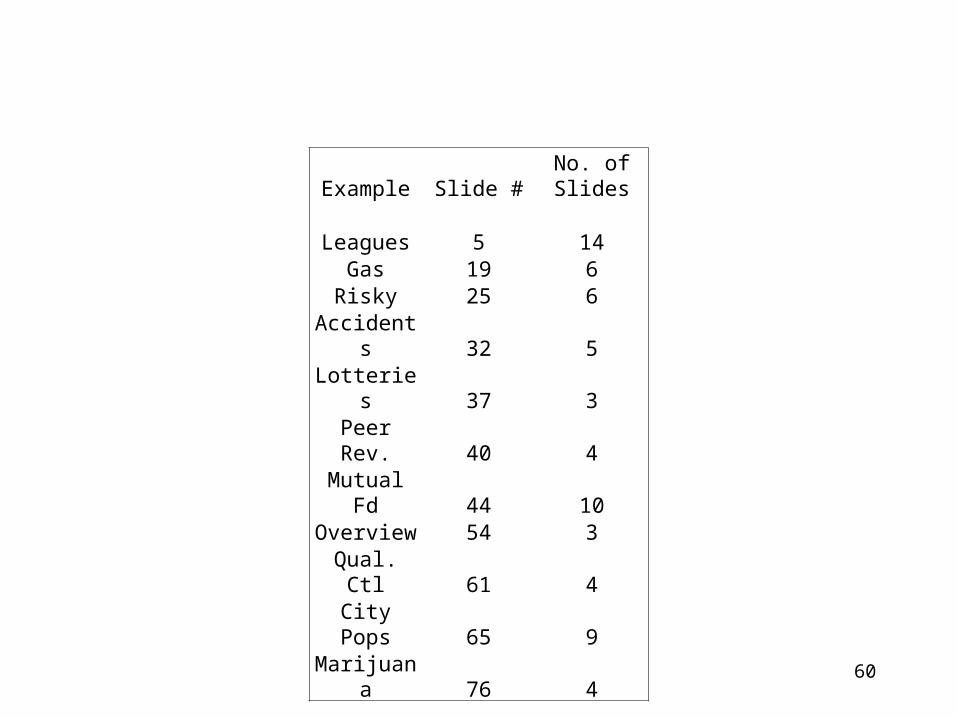
Example Slide #No. of Slides
Leagues 5 14Gas 19 6
Risky 25 6Accidents 32 5Lotteries 37 3Peer Rev. 40 4Mutual Fd 44 10Overview 54 3Qual. Ctl 61 4City Pops 65 9Marijuana 76 4
60
Example 4 - Industrial Quality Control
• Filling Cereal Boxes, Oil Containers, Jam Jars
• Labeled amount should be minimum
• Save money if also maximum
• variability reduction contributes to profit
• Method: Management by exception …>
61
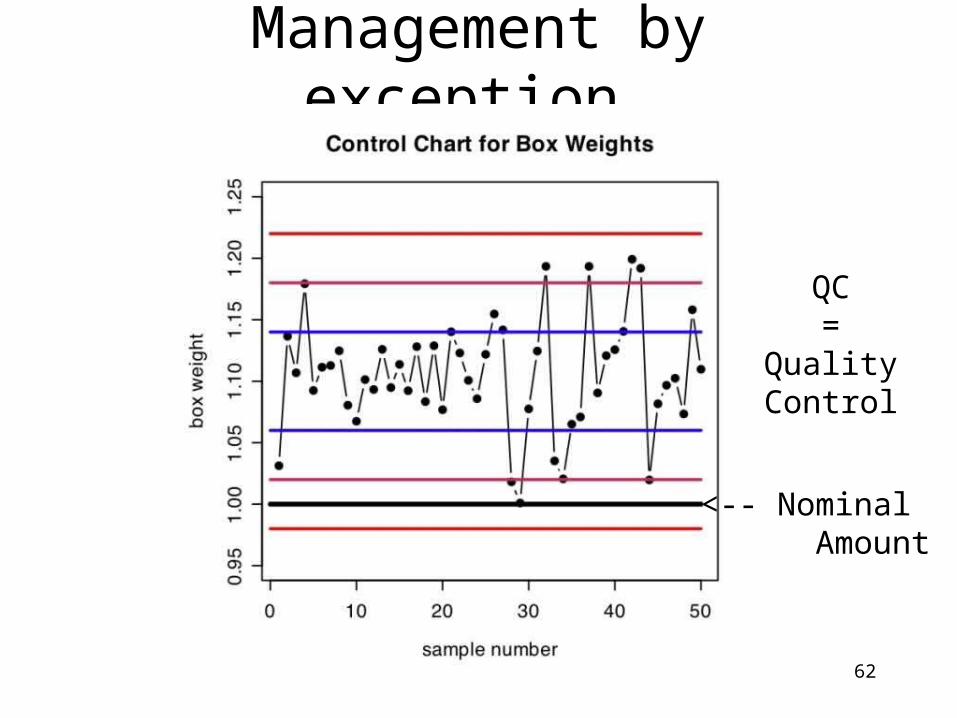
Management by exception
QC=
QualityControl
<-- Nominal Amount
62
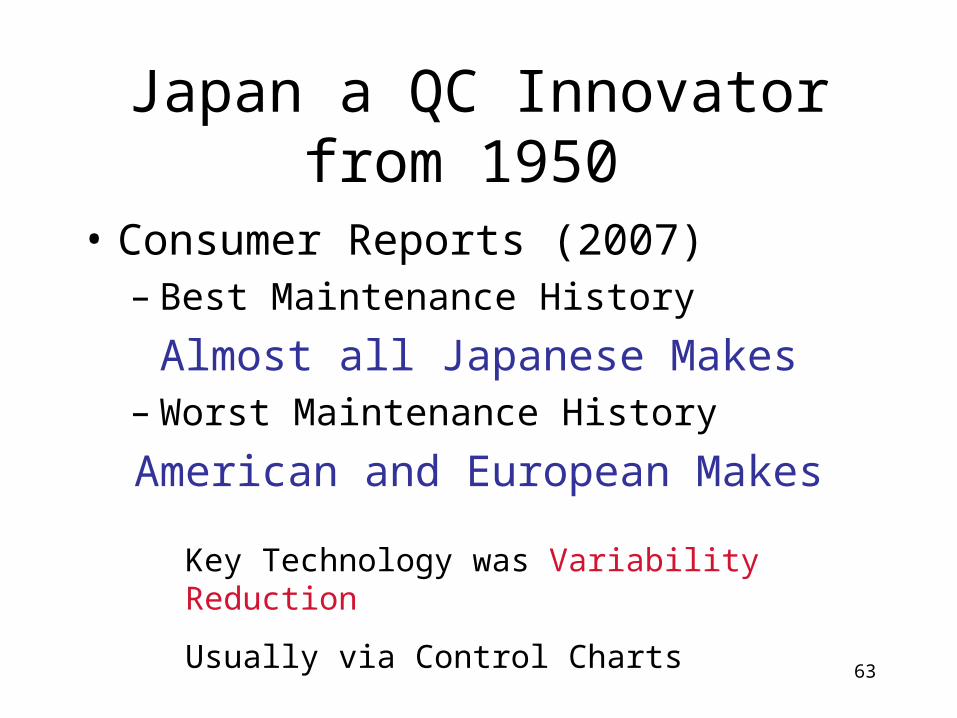
Japan a QC Innovator from 1950
• Consumer Reports (2007) – Best Maintenance History
Almost all Japanese Makes– Worst Maintenance History
American and European Makes
Key Technology was Variability Reduction
Usually via Control Charts
63
Summary Example 4
• Surprising that Simple Control Chart could have such influence
• Control Chart is just an implementation of the idea of Management by Exception
64
Example 5 - A Simple Law of Life
• Sometimes we see the same pattern in data from many different sources.
• Recognition of patterns aids description, and also helps to identify anomalies
65
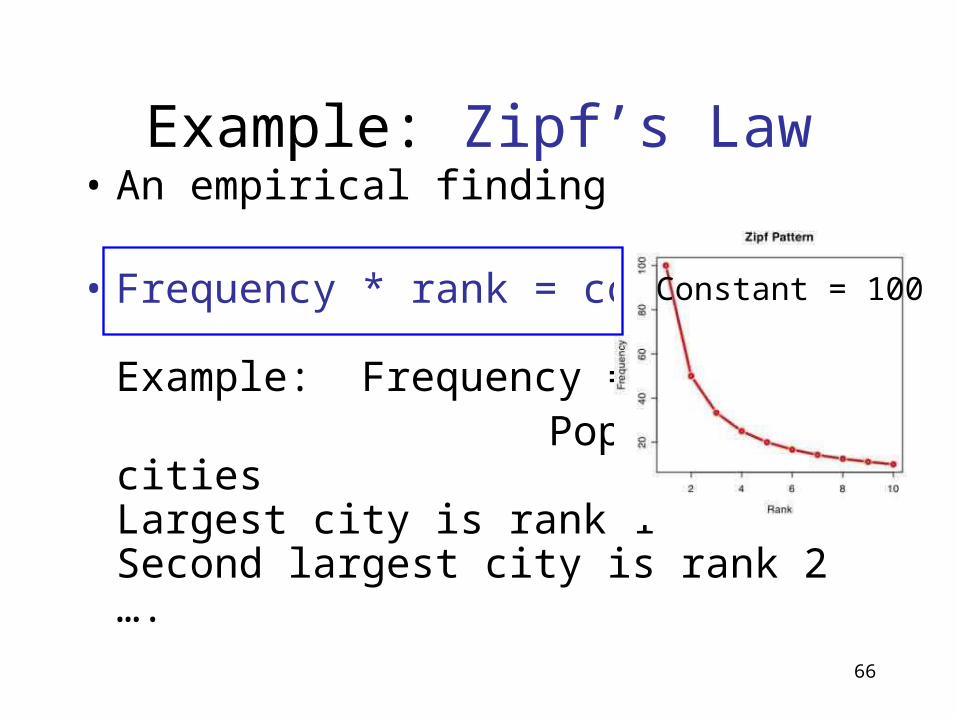
Example: Zipf’s Law• An empirical finding
• Frequency * rank = constant
Example: Frequency = Population of cities
Largest city is rank 1Second largest city is rank 2 ….
Constant = 100
66
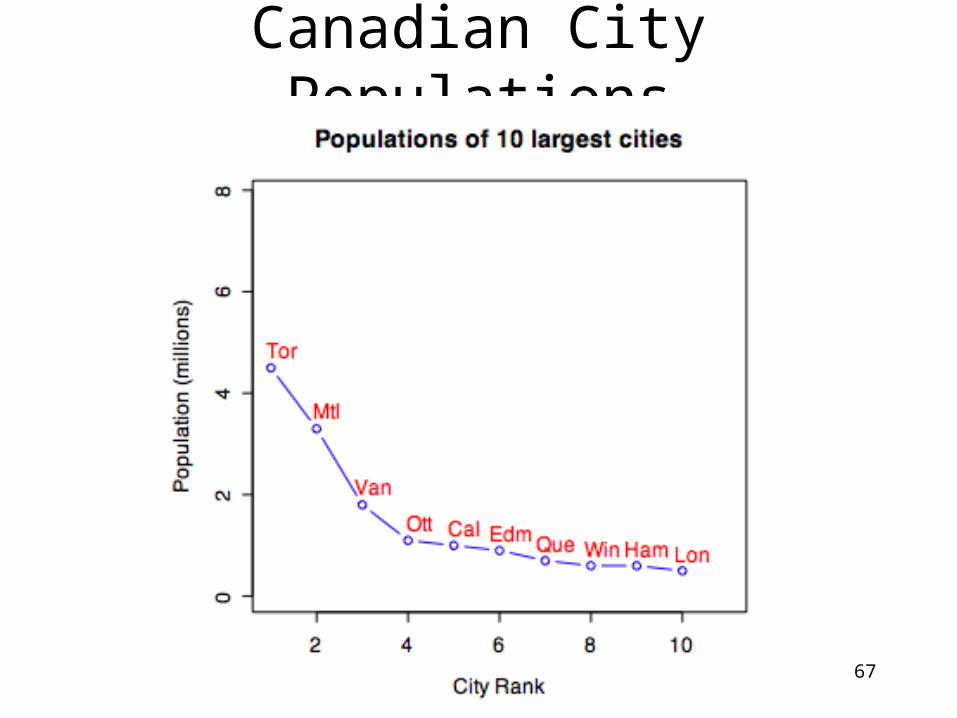
Canadian City Populations
67
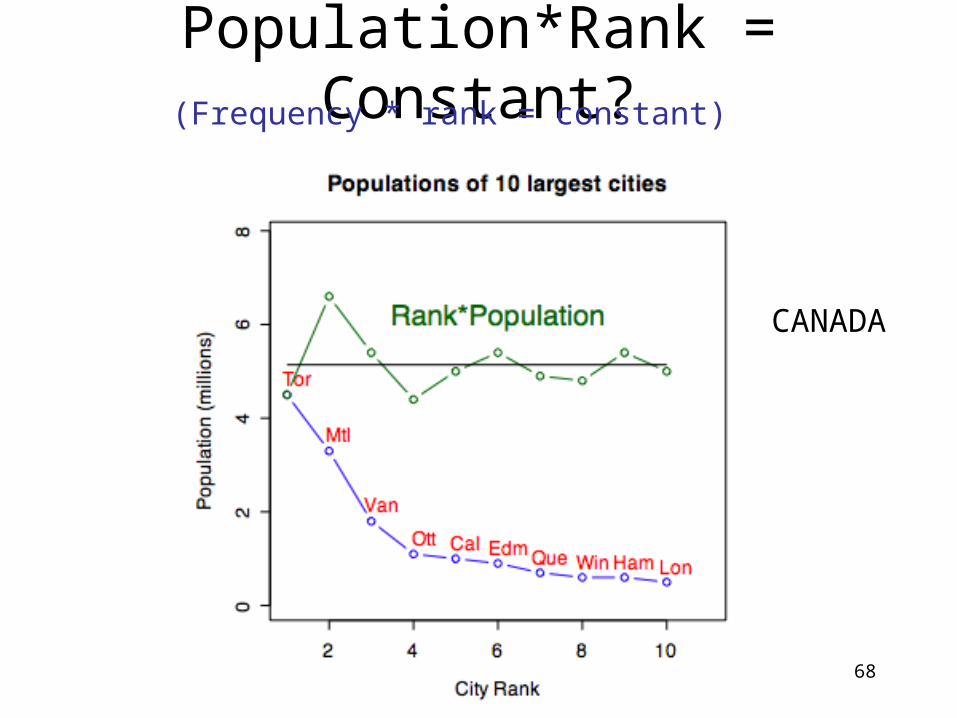
Population*Rank = Constant?(Frequency * rank = constant)
CANADA
68
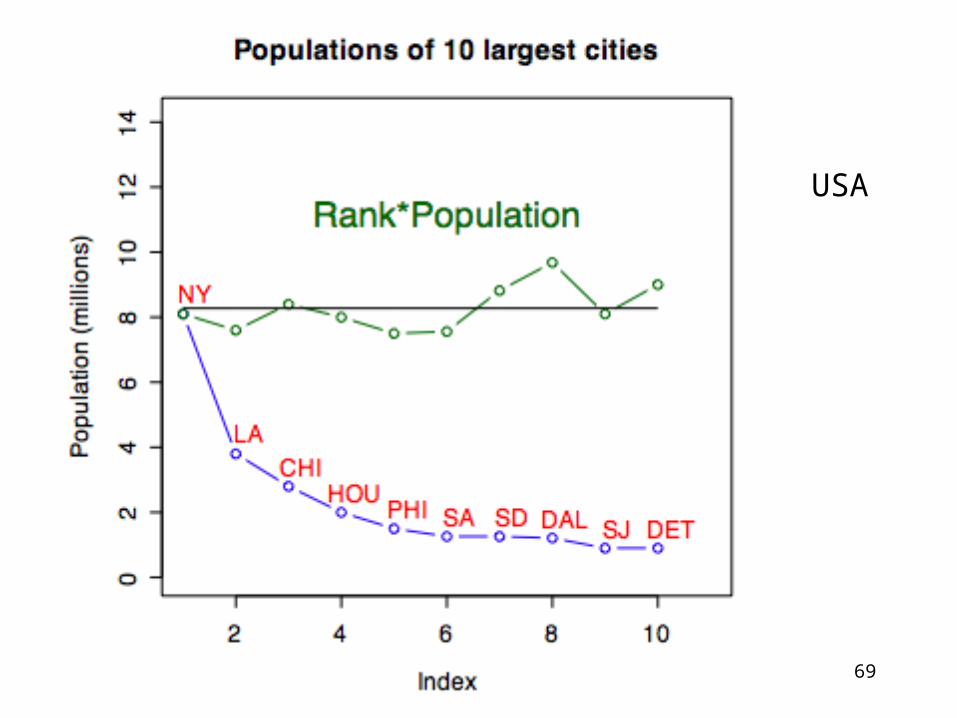
USA
69
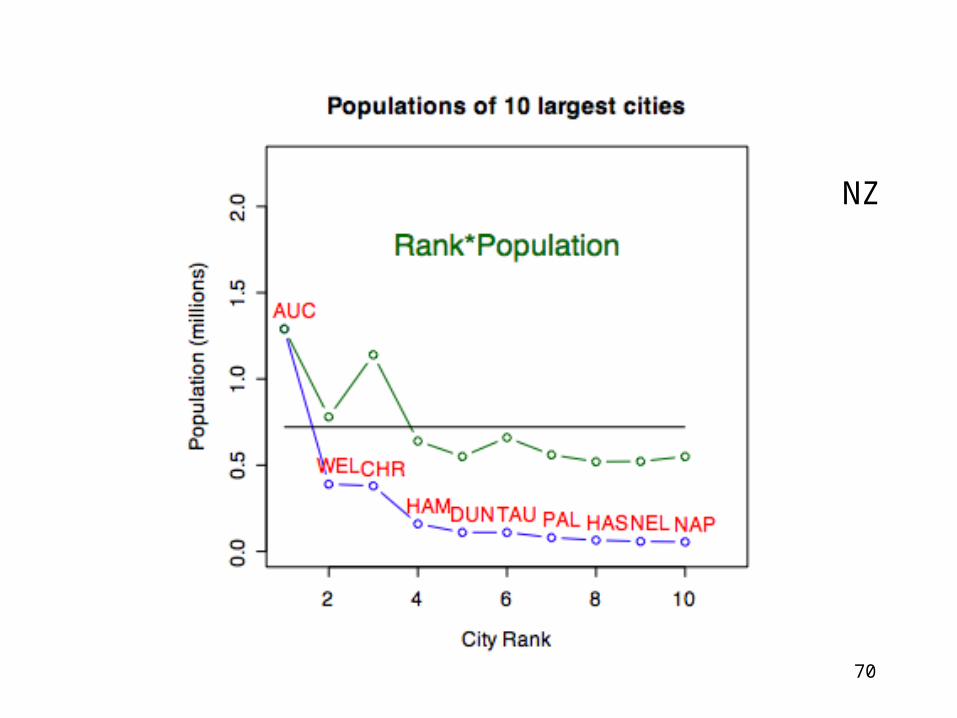
NZ
70
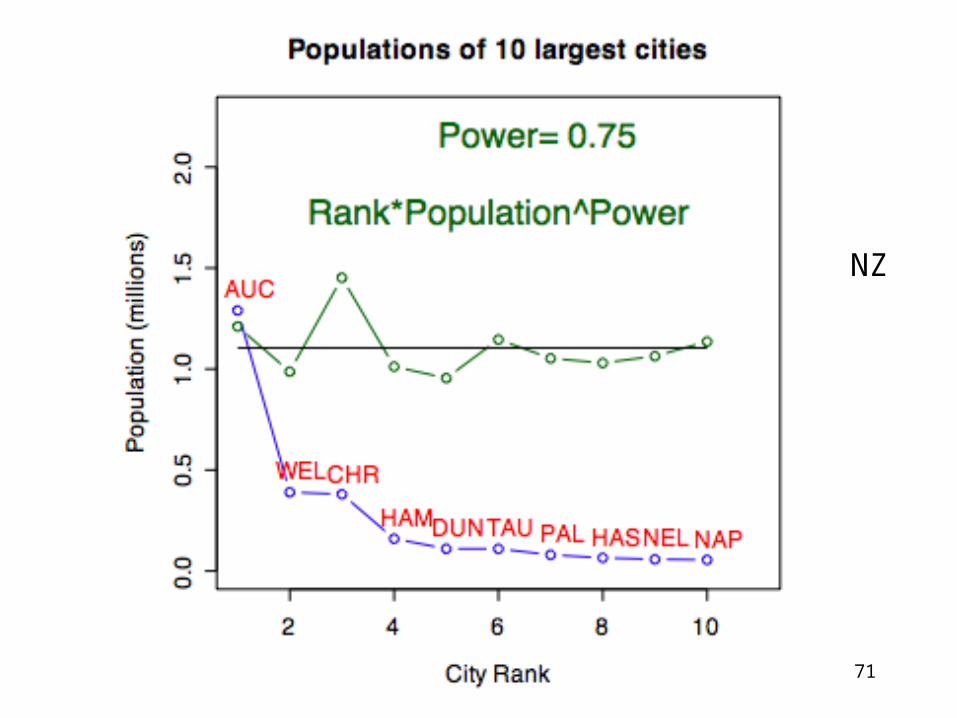
NZ
71
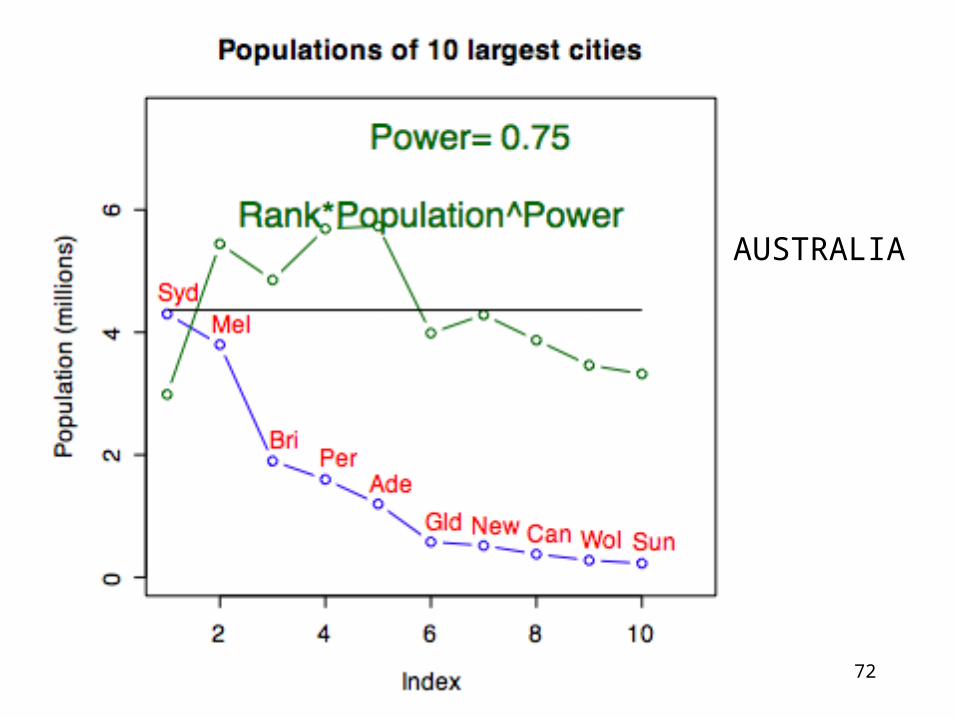
AUSTRALIA
72
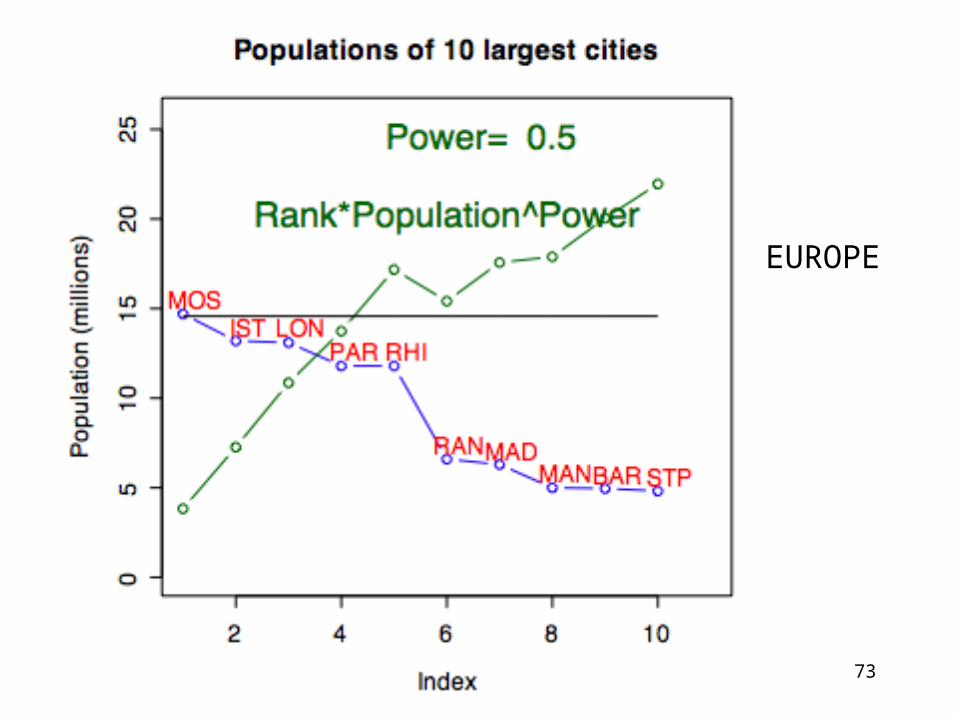
EUROPE
73
Other Applications of Zipf
•Word Frequency in Natural or Programming Language•Volume of messages at Internet Sites•Number of Employees of Companies•Academic Publishing Productivity•Enrolment of Universities•……
•Google “Zipf’s Law” for more in-depth discussion
74
Summary for Zipf’s Law
• Surprising that processes involving many accidents of history and social chaos, should result in a predictable relationship
• Models help to describe complex systems, and to focus attention when they fail.
75
Example 6 - Obtaining Confidential Information
• How can you ask an individual for data on• Incomes• Illegal Drug use• Sex modes• …..Etc in a way that will get an honest response?
There is a need to protect confidentiality of answers.76
Example: Marijuana Usage
• Randomized Response Technique
Pose two Yes-No questions and have coin toss determine which is answered
Head 1. Do you use Marijuana regularly?Tail 2. Is your coin toss outcome a tail?
77
Randomized Response Technique
• Suppose 60 of 100 answer Yes. Then about 50 are saying they have a tail. So 10 of the other 50 are users. 20%.
• It is a way of using randomization to protect Privacy. Public Data banks have used this.
78
Summary of Example 6
• Surprising that people can be induced to provide sensitive information in public
• The key technique is to make use of the predictability of certain empirical probabilities.
79