valuation of environmental goods in profit and non-profit housing
TRANSCRIPT

© Swiss Journal of Economics and Statistics 2008, Vol. 144 (4) 631–653
a Swiss Federal Institute of Technology, Centre for Energy Policy and Economics (CEPE)b Swiss Federal Institute of Technology, Centre for Energy Policy and Economics (CEPE) and
Università della Svizzera italiana, Istituto di microeconomia e economia Pubblica Acknowledgements: The project on which this paper is based was supported by the Swiss Fed-
eral Office for the Environment (FOEN). The authors wish to thank to Mehdi Farsi, Martin Jakob and the editors for their thoughtful and useful comments. The views expressed in this paper are those of the authors. Any remaining errors and omissions are the responsibility of the authors.
1 Despite significant improvements in the air quality since the coming into force of the Clean Air Legislation in the mid-1980’s, air pollution remains one of the most important environ-mental issues in Switzerland.
2 Electromagnetic pollution or non-ionizing radiation includes electromagnetic fields in the frequency range of 0 to 300 gigahertz (GHz). In this study we are interested only in high-frequency radiation (100 kHz–300 GHz) emitted by base stations of the mobile phone antennas.
Valuation of Environmental Goods in Profit and Non-Profit Housing Sectors: Evidence from the Rental Market in the City of Zurich
Silvia Banfia, Massimo Filippinib and Andrea Horehájováa
JEL-Classification: C21, Q2, R31Keywords: hedonic pricing, electrosmog, noise, air pollution, market segmentation
1. Introduction
Most of the population and economic activities are concentrated in urban centers. The urbanization process during the last 30 years in most Swiss cities has also cre-ated serious environmental problems. Two of the best known and most stressed issues are air pollution1 and traffic noise. In recent years, with an increasing need for fast and reliable communication and the resulting numerous mobile phone antennas in the urban centers, adds to these two issues a frequently discussed topic; namely electromagnetic pollution, also known as electrosmog.2 These envi-ronmental loads create negative externalities for the society. These externalities are expected to have a negative impact on the price of dwellings located in pol-luted and noisy areas and in the vicinity of sources of electromagnetic pollution.

632 Banfi / Filippini / Horehájová
3 In the last ten years, the annual threshold level for particulate matter set by law was constantly exceeded.
4 Yearly averaged daily traffic noise; the average is calculated over 16 hours (6:00 to 22:00).5 In this study we do not consider electrosmog emitted inside a dwelling or house, since this
kind of pollution cannot be considered as an externality for the household.6 Rental prices in the city of Zurich, Statistical office of the city of Zurich, 2008.
The focus of this paper is to estimate, using a hedonic price model, the marginal willingness to pay for a reduction of these externalities in the city of Zurich, Switzerland.
The urban agglomeration of Zurich is the most important urban region of Switzerland in demographic and economic terms (Rossi, 2007). As such, it has also high levels of air pollution and noise. Reaching critical pollution levels in the city, especially particulate matter,3 during the winter months of 2005/6, has again triggered an intense discussion on further measures required for reducing harmful emissions mainly caused by passenger and freight transport.
Traffic noise is the most irritating source of the noise stated by the inhabitants in a survey conducted in 2007 by Banfi, Filippini, Horehájová and Pióro (2007, p. 88). One third of the Zurich’s residents live in flats with a noise level exceeding 50 dB(A),4 a level at which noise begins to become a strain. Around 6% of the population live in flats with a very high noise level (above 70 dB(A), Banfi, Filippini, Horehájová and Pióro, 2007).
In addition to air pollution and traffic noise, this paper considers the elec-trosmog caused by mobile phone antennas. 5 The main motivation for consid-ering electromagnetic pollution in the study was the growing concern of the population in Swiss cities about possible negative health effects caused mainly by mobile phone antennas, high voltage transmission lines, TV and radio trans-mitters (Siegrist, Earle and Gutscher, 2003; Siegrist, Earle, Gutscher and Keller, 2005).
A special characteristic of the housing market in the city of Zurich is the presence of a high number of multifamily structures with a high share of rental apartments, covering 93 percent of the overall stock of apartments. This per-centage is larger than the overall average in Switzerland, where the rental market covers around 60 percent. Moreover, the rental sector in Zurich is characterized by the presence of non-profit as well as for-profit suppliers and a very low level of vacancy (0.15% in 2006). The non-profit suppliers include the public sector (7%) together with the housing cooperatives (18%), whereas the group of profit suppliers consists of private owners (48%), insurance companies and pension funds (27%).6 The non-profit providers aim at offering an affordable housing
Valuation of Environmental Goods in Profit and Non-Profit Housing Sectors 633
7 For instance, Schmid (2005) found that there are significant differences at the educational level, in income, household size and age between households occupying apartments owned by housing cooperatives and households occupying other apartments. Since housing cooperatives account for a large share of the non-profit sector, these findings could be actually general-ized for the non-profit sector. The analysis is based on the Census data of 2000 and the Swiss Labour Force Survey of 2002. Both data sets are from the Swiss Federal Statistical Office.
space for families and disadvantaged households. In this paper we examine the possible segmentation of the rental sector in Zurich in two submarkets, e.g. the for-profit and the non-profit submarkets. Watkins (2001) states that a submar-ket is deemed to exist if: (1) all dwellings within a submarket are relatively close substitutes; and (2) for a standardized dwelling the price on the submarkets is different. In this situation there are good reasons to believe that the suppliers and consumers operate in separate submarkets. The for-profit and non-profit rental sectors in Zurich are characterized by different suppliers and, at least partially, characterized by different consumers.7 For example, the housing cooperatives have occupancy standards which limit the size of an apartment according to the size of the household.
One interesting research question in the presence of two submarkets is to ana-lyze if the marginal willingness to pay for an improvement of the aforementioned environmental loads differs between the two market segments outlined in this study. Thus, the objective of the paper is twofold. First, we intend to empirically estimate the marginal willingness to pay for a reduction of negative externalities caused by noise, air pollution and electrosmog. Second, we try to identify possible differences of the impact of these negative externalities on the prices of dwellings in the two market segments. The results of this analysis can be useful for policy decisions. Namely, more precise estimates of hedonic price functions can help the policy makers to perform more accurate cost-benefits analyses.
The rest of the paper is organized as follows: the next section provides a litera-ture review on the valuation of electrosmog and discusses the market segmenta-tion issues; the third section presents the model specification; a description of the data is given in section four; section five presents the empirical results and finally, section six concludes with a brief summary and discussion of the results.

634 Banfi / Filippini / Horehájová
8 For a review of these studies see Ahlbom, Cardis, Green, Linet, Savitz and Swerdlow (2001) and Breckenkamp, Berg and Blettner (2003).
2. Literature Review
This section discusses two types of studies applying the hedonic pricing method that can be relevant to the purposes of this study. The first group deals with the impact of the electromagnetic pollution on the value of houses. Since this is a new issue it is interesting to have an overview about the general attitudes and perceptions of the Swiss citizens, and Zurich’s inhabitants especially, regarding the electrosmog caused by mobile phone antennas. The second group of studies examines in more detail the concept of market segmentation. Later on are men-tioned also some results on the impacts of environmental variables on the rent in different submarkets.
Although laboratory studies have shown that electrosmog can affect living cells, it remains unclear whether these effects are harmful. Some epidemiological studies have reported of a possible link between electrosmog exposure and risk of cancer, however, without any conclusive assessment.8 Current research is expected to pro-vide more answers about potential health effects within the next few years.
The empirical literature on the economic impacts of the sources of electro-magnetic fields on the dwellings’ prices is poor. There are only a few empirical studies that have examined the impact of the presence of high voltage transmis-sion lines (HVTL) on the dwellings’ prices in the US and Canada (Hamilton and Schwann, 1995; Des Rosiers, 2002). Despite the growing importance of the topic, we are not aware of any empirical studies on this issue performed for European countries.
The paper of Hamilton and Schwann (1995) focuses on high voltage trans-mission lines and considers the sales of single detached houses over the period of 1985–1991 (Vancouver area, Canada). By splitting the database in sub-samples according to the distance to a transmission line it was possible to show the impact of transmission lines on the dwellings’ prices. The price effect is around −6.3% for properties adjacent to a line.
Des Rosiers (2002) also investigated the impact of high-voltage transmission lines on surrounding property values in a Canadian city. His data contain infor-mation about 507 single family houses sold over the period of 1991–1996. He concludes that the vicinity to the facilities will not necessarily cause a house to depreciate but a direct view on a pylon does exert a significantly negative impact on property prices, which is roughly 10% of the mean house value.

Valuation of Environmental Goods in Profit and Non-Profit Housing Sectors 635
9 Usually a principal component analysis (PCA) combined with factor and a cluster analysis is employed to derive the most important variables for explaining the variance in the data and using them to form the submarkets.
10 The Chow test is used to test whether significant differences between the submarket specific prices exist. It is based on a F-statistics, for more details see Greene (2008). Another test introduced by Schnare and Struyk (1976) involves the reduction of squared errors. The
There is no such a study for Switzerland. In the last few years, two surveys were conducted to study the attitude and perceptions of the Swiss population towards electrosmog. In the first study by Röösli, Huss and Schreier (2005) a representative sample of Swiss population was surveyed about their health wor-ries as well as health problems with respect to electromagnetic fields and further compared with other environmental influences. Respondents were most con-cerned about air pollution. Mobile phone antennas were ranked as seventh out of twelve different environmental influences. One of the interesting outcomes of that study was that 5 per cent of the Swiss population consider themselves as electromagnetic-sensitive (i.e. they have health problems caused by electrosmog). As a part of recent study by Banfi, Filippini, Horehájová and Pióro (2007), a survey about the environmental quality and housing was conducted in two cities, Zurich and Lugano. Questions about electrosmog formed a minor part of this survey. The results show that the inhabitants are interested in and familiar with the topic of electrosmog caused by mobile phone antennas (more than 50% of respondents showed concern about the issue of electrosmog). Besides, more than half of the respondents perceived the presence of an antenna in the vicinity of the apartment as negative, while only 5 per cent perceived its presence as posi-tive and about 24 per cent of the respondents were indifferent.
On the other hand, there exist a relatively large number of studies consider-ing market segmentation. However, the classification of submarkets differs for each study. Some researchers use a priori classification of submarkets (see Palm, 1978; Adair, Berry and McGreal.1996; Bourassa, Hamelink, Hoesli and MacGregor, 1999), usually defined as pre-existing small geographical areas and political boundaries, or as delineated by the real estate agents. Others let the data determine the structure of the submarkets (see Dale-Johnson, 1982; Bourassa, Hoesli and Peng, 2003) using various statistical methods9 or use a combination of these two approaches. Besides, what works for one market does not have to work for others. As was pointed out in the study by Watkins (2001) there is no single, coherent definition of a housing submarket and the researchers should empirically compare alternative approaches. To test for existence of the submarkets the Chow test and weighted standard errors are used.10

636 Banfi / Filippini / Horehájová
main point is to compare the sum of squared errors from the market-wide estimation with the weighted standard errors (WSE ) computed as follows:
1 11
11,
1 1j j
jj j j j
n kn kWSE SE SE
n k n k
− −− −= +…+
− − − −
where SEi is the sum of squared errors, ni is the number of observations form the submarket i and ki is the number of explanatory variables in the i-th submarket equation.
11 For a detailed noise studies review see also Baranzini and Ramirez (2005) and Nelson (2008).
Very few of these segmentation studies focused on the differences in hedonic prices of various environmental variables. An exception is Michaels and Smith (1990) that estimated the impact of the presence of landfills containing hazard-ous wastes on the price of houses in Boston with respect to different market seg-ments based on realtors’ definition. Their analysis is based on a sample of sales prices for 2 182 houses over a 5-year period. The results show substantial differ-ences in valuation of avoiding proximity to landfills using full sample versus the submarkets. Moreover, the estimated marginal values for removing a landfill are also sensitive to the definition used for the market.
There is only one paper on submarkets in Switzerland and their effect on the implicit prices of noise, by Baranzini and Ramirez (2005). In this paper, the rental market for the canton of Geneva and its submarkets with respect to the type of apartment (private sector and controlled sector) were analyzed. The authors concluded that the coefficients differ with respect to the submarket. Moreover, they showed that for traffic noise, an increase in the mean noise level by 1 dB(A) reduces private sector rents by 0.18% and controlled rents by 0.65% and this dif-ference is statistically significant. In addition, peak noise reduces rents by 0.63% in the private sector and is insignificant in the controlled rent sector.11
We can state that there is empirical evidence suggesting the existence of sub-markets. However, the formalization of the housing submarkets is missing (Wat-kins, 2001) and the approaches to the definition and identification of market seg-ments differ for each study. Therefore, the researchers should take into account the nature of the studied area i.e. specific housing conditions, study area, study period, collected data and also the purpose of their study.
In summary, the hedonic literature shows some evidence for a negative impact of the sources of electromagnetic pollution on the price of housing. Moreover, the empirical studies show that the impacts of environmental externalities vary in different submarkets.

Valuation of Environmental Goods in Profit and Non-Profit Housing Sectors 637
3. Model Specification
The Hedonic Price Method (HPM), first mentioned in the works of Court (1939) and Griliches (1961), belongs to the group of revealed preference approaches which can be used for the valuation of a change in environmental quality, e.g. air quality can be valued by analysing the impact of different pol-lution levels on rental or house prices. The same logic applies to noise and elec-tromagnetic fields. The basic idea behind this method is that renting a housing unit is a transaction in which a consumer obtains a bundle of characteristics for a specified price. These characteristics are the size, quality, location, environmental quality and other features of the housing unit. In this case the tenant pays rent in exchange for the right to those services for a predefined period. On the other hand a supplier of housing constructs and leases a housing unit with a variety of features. HPM is therefore an indirect method, where the fundamental idea is that a dwelling’s rent reflects the value of its attributes to the tenant and the cost to the supplier. In the general form it can be represented as:
( )i iP f= X (1)
where P is the price of the observation i, in our case rental price of an apartment i and X is a vector of attributes (both continuous and discrete) of the housing units. Part of these attributes are structural characteristics (i.e. number of rooms, age of the building, etc.), part of them are characteristics of the neighbourhood or accessibility (i.e. proximity to schools, public transports, etc.) and partly they are environmental characteristics (i.e. parks or water bodies nearby, air qual-ity, noise level, etc.). The characteristics or attributes of a dwelling are assumed to be capitalized into the value of the house and land and, consequently, in the rents. Then, the HPM allows splitting the value of the dwelling into its various attributes for the purpose of assigning values to particular attributes such as air quality (see for example Chattopadhyay 1999; Zabel and Kiel, 2000).
The derivative of the price with respect to the environmental quality variable is the implicit price, e.g. the marginal willingness to pay (MWTP):
( )i i
ik ik
P f∂ ∂=
∂ ∂X
X X (2)
MWTP represents the amount consumer is willing to pay for the marginal change in the environmental quality variable.

638 Banfi / Filippini / Horehájová
12 For a discussion on this issue see Champ, Boyle and Brown (2004), Forrest (1991) and Navrud (2002).
13 The semi-log specification was chosen because it allows for non-linear price-quality relations and variable semi-elasticities (as opposed to a log-log form).
14 Mietpreis-Strukturerhebung, BFS, 2003. Data have been collected for more than 230 000 Swiss households.
Of course, the best would be to include into the hedonic function all relevant dwelling’s characteristics. However, two problems arise:
1. the possibility of multicollinearity, which increases with an increased number of independent variables,
2. the data availability.
Estimation of the hedonic function (1) requires the specification of a functional form. The theory gives little guidance with respect to the appropriate functional form.12 The general functional form used in the hedonic pricing estimation is the Box-Cox, which has following form:
( ) ( )0
1 1
JI
i i j ji j
P V Dθ λ
= =
= α + β + β +ε∑ ∑ (3)
Where ( θ ) and ( λ) indicate the Box-Cox transformation; P (θ) = (P (θ) − 1) / θ and V (λ) = (V (λ) − 1) / λ, P is the price of the apartment, V is the set of explanatory vari-ables that are transformed, and D is the set of variables that are not transformed. With varying θ and λ parameters different functional forms emerge.
In the hedonic regression literature the most commonly used functional forms are the log-log, and the semi-log. In this paper we are using the semi-log13 func-tional form specification for the whole city of Zurich and the two submarkets. However, we have tested also aforementioned alternative functional forms. The results show that the semi-log specification provides the best fit in describing the relationship between the rent and the apartment characteristics.
4. Data
The main data source used in this paper is the structural survey of rental prices in Switzerland14 conducted by the Swiss Federal Statistical Office in the year 2003. The survey collects rich information about quality and quantity characteristics of the apartments commonly used in the hedonic analysis.15

Valuation of Environmental Goods in Profit and Non-Profit Housing Sectors 639
15 However, the data set does not contain any socio-economic characteristics of the tenants. Therefore, it was not possible to identify differences in preferences between the consumers in these two submarkets.
16 Additional justifications for the cut-off point of 50 dB(A) can be find in the paper by Baran-zini, Schaerer, ramirez and thalmann (2006). By setting the cut-off point at 50 dB(A) we assume no impact on the rents from the traffic noise below this level.
For this paper we only selected the data for tenants in the city of Zurich, this accounts for more than 8 000 observations (unbalanced data). This number is further reduced by omitting a number of invalid or inappropriate observations including, for instance, those where square footage and gross rent were missing. After removing such observations and depending on variables taken into the esti-mation, the final dataset was reduced to 6 204 apartments.
To carry out the final analysis we combined this data set with the data on noise, air pollution and electrosmog and also created a new accessibility variable measuring the distance to the city centre.
The different dwellings’ characteristics used in our analysis are summarized and described in Table 1.
Information regarding the traffic noise and electrosmog (the location of all mobile phone antennas) was obtained from the city of Zurich. The noise level during the day and night data are available only for those buildings located facing the street or street sections where the noise limit values have been or are likely to be exceeded. After the matching of the data, one third of our observations had some indications on the noise level. Using only these observations would not only reduce the sample size but also induce selection bias in our estimation results for omitting the dwellings not exposed to noise. In order to create a continuous variable for noise exposure, following Navrud (2002) and Bjørner, Kronbak and Lundhede (2003), we assigned a zero value to the observations without the noise level, and to the other observations the difference between their measured noise level and cut-off point of 50 dB(A).16 Moreover, because of the high corre-lation of 0.94 between the noise level during the day and the noise level during the night it is not possible to use both variables in the estimation. We decided to use the variable measuring the noise level during the night on account of prob-able higher sensitivity of the tenants to the noise levels at night than to noise levels during the day.
A variable measuring the distance to the closest antenna in meters was used as a proxy for the electromagnetic pollution. This distance was derived using Geo-graphic Information Systems (GIS) techniques. The average distance to the near-est antenna was approx. 230 meters and the median 210 meters. We have tested

640 Banfi / Filippini / Horehájová
17 When the distance area, where the presence of an antenna has an impact on the rent, is defined as a 150 meter, 150–200 meter and 200–250 meter radius ring, the coefficient estimates of the first two variables are negative and statistically significant. However, the third coefficient estimate for the 200–250 meter radius ring becomes insignificant.
18 The Ordinance on Air Pollution Control specifies for PM10 a limit value of 20 μg/m3 for the annual average. PM10 does not meet these quality standards on average. The PM10 concen-trations are highest in the winter months, with daily maximum levels often exceeding 50 μg/m3 (stipulated daily average level, which may only be exceeded once per year).
19 The railway main station was used as a proxy for the city center.20 Although Kemeny, kersloot and thalmann (2005) stated that “[…] belonging to a typi-
cally non-profit category does not guarantee non-profit behavior. Nor can it be ruled out that landlords in typical profit categories mimic non-profit behavior by choosing not to take advantage of all opportunities to raise rents.”, the significant differences between the average rents give some evidence that there are two submarkets.
different specification of this variable, using the continuous distance variable and also dummy variables indicating if the antenna is within different distance rings from the dwelling. The distance of 200 meters was suggested by the preliminary results as the boundary of the effect of the mobile phone antennas on the rents of the apartments.17 Finally, the dummy variable indicating the presence of an antenna within 200 (Antenna < 200m) meters from the dwellings was used for the estimation. Moreover, an antenna is present within a 200 meter radius for half of the dwellings with an average distance of 119 meters but only 5% of the dwellings have the antenna within a 50 meter radius.
From the Federal Office for the Environment, we obtained annually averaged fine particles (PM10) concentration maps for the whole Switzerland, at a spa-tial resolution of 200 meters. We decided to use the PM10 indicator because the threshold values18 for this pollutant are often exceeded which could have serious effects on the residents’ health.
One of the frequently used variables in hedonic analysis is the distance to the city centre. This variable was computed using the GIS technique. The average distance to the city centre19 is 3 kilometers.
One of the explanatory variables in the aggregate model is the dummy variable indicating if the apartment’s owner belongs to the profit or non-profit segment.20 In our sample three quarters of the apartments are from the profit rental sector (75%), the rest is from the non-profit rental sector. A further division of these sectors, with respect to the housing providers, is shown in Table 2. The largest part of the non-profit rental sector, 18%, comprises apartments owned by hous-ing associations. Just a small part of 7% is owned by the public sector.
Valuation of Environmental Goods in Profit and Non-Profit Housing Sectors 641
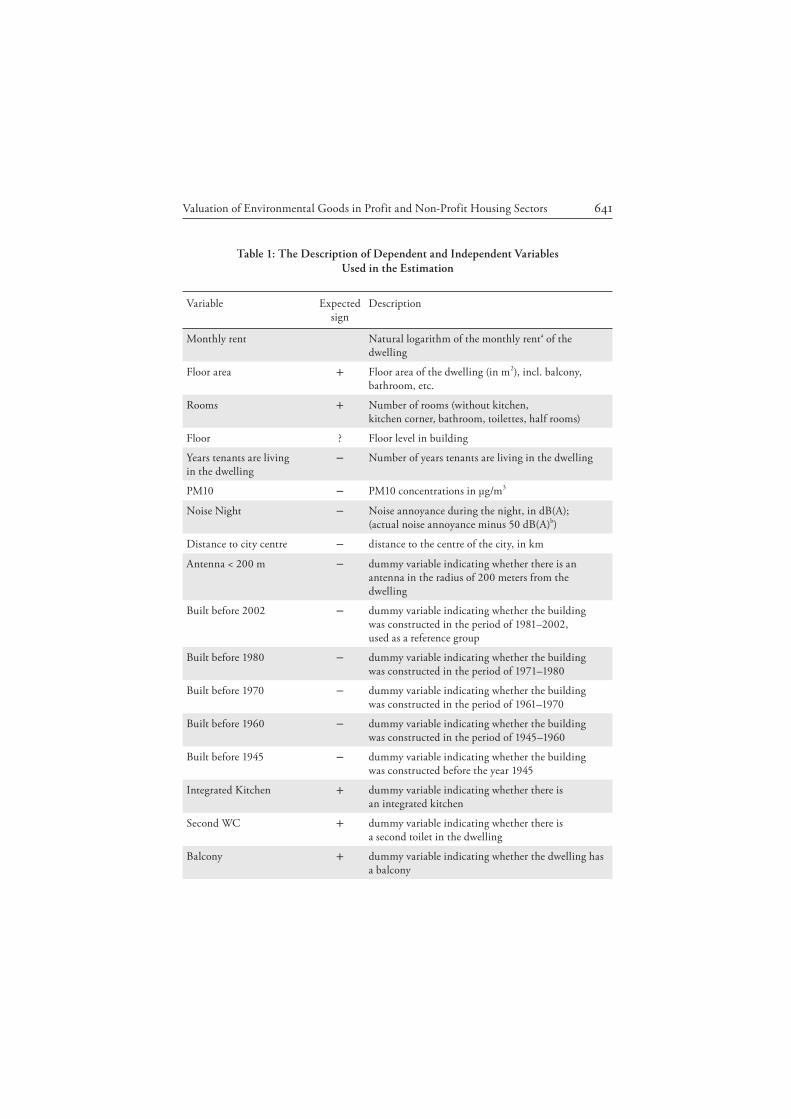
Table 1: The Description of Dependent and Independent Variables Used in the Estimation
Variable Expected sign
Description
Monthly rent Natural logarithm of the monthly renta of the dwelling
Floor area + Floor area of the dwelling (in m2), incl. balcony, bathroom, etc.
Rooms + Number of rooms (without kitchen, kitchen corner, bathroom, toilettes, half rooms)
Floor ? Floor level in building
Years tenants are living in the dwelling
− Number of years tenants are living in the dwelling
PM10 − PM10 concentrations in μg/m3
Noise Night − Noise annoyance during the night, in dB(A); (actual noise annoyance minus 50 dB(A)b)
Distance to city centre − distance to the centre of the city, in km
Antenna < 200 m − dummy variable indicating whether there is an antenna in the radius of 200 meters from the dwelling
Built before 2002 − dummy variable indicating whether the building was constructed in the period of 1981–2002, used as a reference group
Built before 1980 − dummy variable indicating whether the building was constructed in the period of 1971–1980
Built before 1970 − dummy variable indicating whether the building was constructed in the period of 1961–1970
Built before 1960 − dummy variable indicating whether the building was constructed in the period of 1945–1960
Built before 1945 − dummy variable indicating whether the building was constructed before the year 1945
Integrated Kitchen + dummy variable indicating whether there is an integrated kitchen
Second WC + dummy variable indicating whether there is a second toilet in the dwelling
Balcony + dummy variable indicating whether the dwelling has a balcony

642 Banfi / Filippini / Horehájová
21 From the first glance at the data we inferred that the aggregate sample follows the same descrip-tive statistics as the profit oriented rental group.
Variable Expected sign
Description
Garden + dummy variable indicating whether there is a garden/ terrace
Elevator + dummy variable indicating whether the building has a lift
Renovation + dummy variable indicating whether the dwelling was (partly or completely) renovatedc
Profit rental sector + dummy variable indicating whether the owner of the dwelling is a private person, insurance or pension company
Non-profit rental sector − dummy variable indicating whether the owner of the dwelling is a housing association or city, canton or federal government
a The monthly rent is the sum of net rent plus additional expenses (heating, water consump-tion, etc.) i.e. amount that the tenant pays each month to the landlord.
b The monthly rent is the sum of net rent plus additional expenses (heating, water consump-tion, etc.) i.e. amount that the tenant pays each month to the landlord.
c We do not have precise information on the exact type of the renovation carried out. This variable could indicate that the apartment was only newly painted or that the windows were changed or that the whole apartment was completely renovated. Therefore this variable was used to identify apartments which were not at all renovated.
Other variables and their sample means and variances for the whole city and the submarkets are listed in Table 3.21 In the aggregate sample, the average dwelling was approximately 78 square meters large with 3 rooms, a monthly rent of 1 438 CHF (Swiss Francs) and built before the year 1945. As we expected the monthly rent and floor area in the profit oriented rental submarket is higher (8% higher than the aggregate sample average). Hence, the non-profit rental submarket has a lower mean monthly rent combined with a smaller floor area (23% less than the aggregate sample average). Comparing the price per square meter, the cheap-est apartments with an average price of 15CHF/m2 are again the apartments in the non-profit submarket. For the profit submarket, the average price is around 20CHF/m2. Most buildings in the two groups were built before the year 1945.

Valuation of Environmental Goods in Profit and Non-Profit Housing Sectors 643
Table 2: Categories of Housing Suppliers in the City of Zurich
Non-profit N In percent Average rent in CHF
Housing cooperatives 1 102 18 1 080
Public sector (city, canton or central government) 457 7 1 160
Profit
Private persons 2 965 48 1 608
Insurance companies and pension funds 1 680 27 1 450
This distribution of housing suppliers corresponds to the official statistics of the city of Zurich, see Statistical Yearbook of the city of Zurich, 2004
Table 3: Variables Mean and Standard Deviation for the Overall Sample and the Two Rental Sectors
Variables
Overall market, N = 6 204
Profit submarket, N = 4 645
Non-profit submarket, N = 1 559
Mean St. dev. Mean St. dev. Mean St. dev.
Monthly gross rent, CHF 1 437.7 645.5 1 550.7 670.1 1 100.9 411.0
Floor area, m2 78.46 29.49 79.56 30.80 75.18 24.93
Rooms 3.10 1.06 3.09 1.09 3.14 0.97
Floor 1.90 2.01 1.88 1.73 1.97 2.66
Years tenants are living in the dwelling
14.01 12.81 13.55 12.58 15.39 13.38
PM10, μg/m3 26.55 2.66 26.45 2.62 26.85 2.77
Noise Night, dB(A) 2.14 4.09 2.20 4.15 1.98 3.91
Distance to city centre, km 3.15 1.43 3.03 1.40 3.49 1.45
Antenna < 200 m 0.48 0.50 0.49 0.50 0.44 0.50
Built before 1980 0.09 0.29 0.09 0.28 0.12 0.33
Built before 1970 0.12 0.32 0.12 0.33 0.12 0.32
Built before 1960 0.23 0.42 0.21 0.41 0.29 0.45
Built before 1945 0.43 0.50 0.45 0.50 0.39 0.49
Integrated Kitchen 0.85 0.35 0.84 0.37 0.90 0.29
Second WC 0.16 0.37 0.18 0.38 0.11 0.31
Balcony 0.71 0.45 0.73 0.45 0.67 0.47
Garden 0.19 0.39 0.18 0.38 0.21 0.41
Lift 0.27 0.44 0.28 0.45 0.22 0.41
Renovation 0.65 0.48 0.63 0.48 0.72 0.45

644 Banfi / Filippini / Horehájová
22 This was further validated by the estimation results for the two submarkets.23 See for a presentation and discussion of this test Anselin and Bera (1998) and for an appli-
cation Kim, phipps and anselin (2003).24 We have estimated a spatial-lag model (using Spatial Two-Stage Least-Square estimation and
Maximum Likelihood approach), which implicitly assumes that spatially weighted average of
Only 8% of the apartments in the non-profit group were built during the last 20 years.
Concerning the environmental variables, there are no noticeable differences. The apartments are distributed equally in the two submarkets with regard to air pollution, noise levels and the distance to antenna. For both the aggregate model and the two submarkets, the average noise level during the night is 2 dB(A) above the allowed limits and yearly average PM10 concentrations are between 26–27 μg/m3 (which exceeds the annual air quality standards set at 20 μg/m3).
5. Estimations Results
In this paper, semi-log hedonic price equations are estimated for the whole city of Zurich and the two submarkets. The results are reported in Table 4. The columns three and four present the results for the submarkets.22 To test for the differences in the prices for the two submarkets we employed F-tests. The results show evidence of market segmentation. Moreover, the weighted standard error test revealed 37% reduction in standard error from the two submarkets in comparison to overall market. This reduction is over 10% cut off suggested by Schnare and Struyk (1976) as evidence of significant overall variability in apartment prices.
From the econometric point of view, the choice of the method to use for the estimation of equation (3) should consider the possible presence of heteroskedas-ticity and of spatial autocorrelation. To test for the presence of heteroskedasticity we used the White test. Based on the results we can reject the null hypothesis of homoskedastic error. Therefore, the t-values presented in Table 4 are then cal-culated using (White’s) heteroskedastic-consistent variance-covariance matrix. Another problem that could arise estimating the hedonic price function is spa-tial correlation. For this reason, we tested the presence of spatial correlation using Moran’s I test.23 Based on the results of this test we have to reject the null hypothesis (no spatial autocorrelation). Therefore, the results presented in Table 4 incorporate also the spatial effects. This model was obtained using a spatial two-stage least-square (S-2SLS) estimation procedure.24 The spatial autoregressive
Valuation of Environmental Goods in Profit and Non-Profit Housing Sectors 645
housing prices in a neighborhood affects the price of each house in addition to the standard explanatory variables of housing and neighborhood characteristics. For a more detailed expla-nation see Anselin and Bera (1998). We have experimented with different spatial weight matrices based on the Euclidean distance between dwellings. We selected a spatial weight matrix with the cutoff value at 1000 m, based on a comparison of the different models in terms of fit (R2).
25 See Gerheuser 1999 and Thalmann 1987, 1993, 2003.
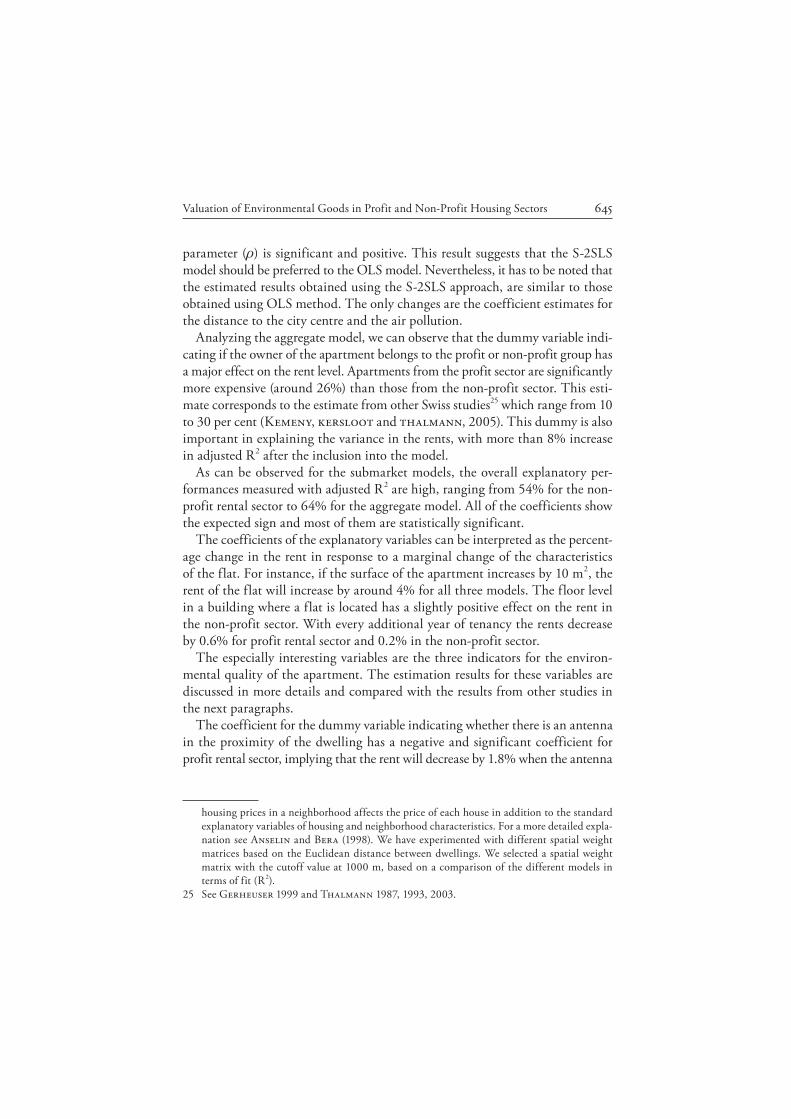
parameter (ρ) is significant and positive. This result suggests that the S-2SLS model should be preferred to the OLS model. Nevertheless, it has to be noted that the estimated results obtained using the S-2SLS approach, are similar to those obtained using OLS method. The only changes are the coefficient estimates for the distance to the city centre and the air pollution.
Analyzing the aggregate model, we can observe that the dummy variable indi-cating if the owner of the apartment belongs to the profit or non-profit group has a major effect on the rent level. Apartments from the profit sector are significantly more expensive (around 26%) than those from the non-profit sector. This esti-mate corresponds to the estimate from other Swiss studies25 which range from 10 to 30 per cent (Kemeny, kersloot and thalmann, 2005). This dummy is also important in explaining the variance in the rents, with more than 8% increase in adjusted R2 after the inclusion into the model.
As can be observed for the submarket models, the overall explanatory per-formances measured with adjusted R2 are high, ranging from 54% for the non-profit rental sector to 64% for the aggregate model. All of the coefficients show the expected sign and most of them are statistically significant.
The coefficients of the explanatory variables can be interpreted as the percent-age change in the rent in response to a marginal change of the characteristics of the flat. For instance, if the surface of the apartment increases by 10 m2, the rent of the flat will increase by around 4% for all three models. The floor level in a building where a flat is located has a slightly positive effect on the rent in the non-profit sector. With every additional year of tenancy the rents decrease by 0.6% for profit rental sector and 0.2% in the non-profit sector.
The especially interesting variables are the three indicators for the environ-mental quality of the apartment. The estimation results for these variables are discussed in more details and compared with the results from other studies in the next paragraphs.
The coefficient for the dummy variable indicating whether there is an antenna in the proximity of the dwelling has a negative and significant coefficient for profit rental sector, implying that the rent will decrease by 1.8% when the antenna

646 Banfi / Filippini / Horehájová
is present. This coefficient is not significant for the non-profit sector, indicating that this variable is not considered in the rent of these apartments. The results of the estimation show some evidence that the presence of antenna may have a sig-nificant impact on the rent level and therefore on the value of properties. Never-theless, this impact differs with respect to the structure of the market. It would be interesting to confirm this result by considering other cities characterized by the presence of these two submarkets.
The coefficient for air pollution indicates that the increase of the particulate matter level by 1 μg/m3 reduces the rent by 0.5% in the profit rental sector. This coefficient is insignificant for the non-profit rental sector, similar to the coeffi-cient for the presence of an antenna.
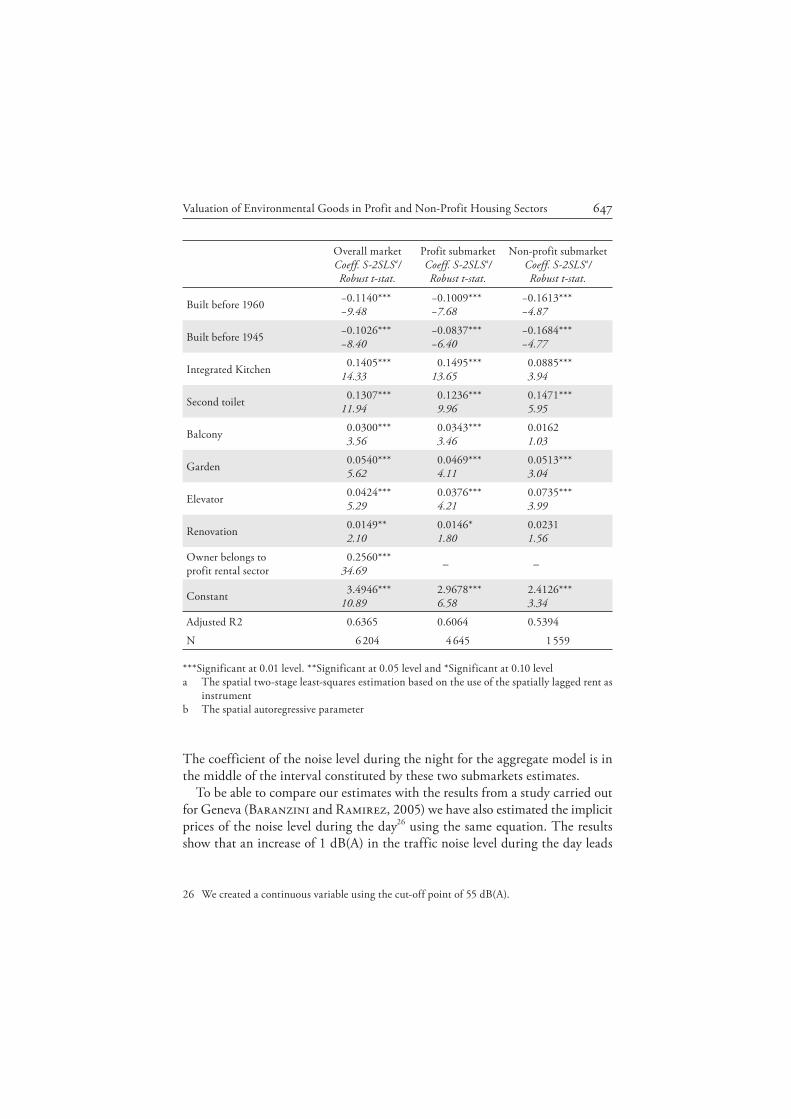
Table 4: The Estimation Results for the Semi-Log Model Specification
Overall marketCoeff. S-2SLSa/Robust t-stat.
Profit submarketCoeff. S-2SLSa/Robust t-stat.
Non-profit submarketCoeff. S-2SLSa/ Robust t-stat.
ρb 0.4208***10.61
0.5266***9.49
0.5876***5.986
Floor area of the dwelling 0.0038***13.20
0.0038***11.01
0.0036***7.51
Number of rooms 0.1054***15.32
0.1049***12.67
0.1102***9.94
Floor 0.0077***4.71
0.00311.35
0.0113***5.18
Years tenants are living in the dwelling
−0.0050***−19.29
−0.0062***−19.01
−0.0018***−4.61
PM10−0.0048***−2.67
−0.0048**−2.17
−0.0028−1.05
Noise Night−0.0029***−3.84
−0.0024***−2.71
−0.0036**−2.34
Antenna < 200 m−0.0114*−1.72
−0.0179**−2.30
0.00880.71
Distance to city centre −0.0167***−4.90
−0.0189***−4.60
−0.0221***−3.20
Built before 1980 −0.0903***−6.75
−0.0791***−5.09
−0.1535***−4.96
Built before 1970 −0.0911***−7.03
−0.0882***−6.17
−0.1149***−3.55
Valuation of Environmental Goods in Profit and Non-Profit Housing Sectors 647
26 We created a continuous variable using the cut-off point of 55 dB(A).
Overall marketCoeff. S-2SLSa/Robust t-stat.
Profit submarketCoeff. S-2SLSa/Robust t-stat.
Non-profit submarketCoeff. S-2SLSa/ Robust t-stat.
Built before 1960 −0.1140***−9.48
−0.1009***−7.68
−0.1613***−4.87
Built before 1945 −0.1026***−8.40
−0.0837***−6.40
−0.1684***−4.77
Integrated Kitchen 0.1405***14.33
0.1495***13.65
0.0885***3.94
Second toilet 0.1307***11.94
0.1236***9.96
0.1471***5.95
Balcony 0.0300***3.56
0.0343***3.46
0.01621.03
Garden 0.0540***5.62
0.0469***4.11
0.0513***3.04
Elevator 0.0424***5.29
0.0376***4.21
0.0735***3.99
Renovation 0.0149**2.10
0.0146*1.80
0.02311.56
Owner belongs to profit rental sector
0.2560***34.69 – –
Constant 3.4946***10.89
2.9678***6.58
2.4126***3.34
Adjusted R2 0.6365 0.6064 0.5394
N 6 204 4 645 1 559
***Significant at 0.01 level. **Significant at 0.05 level and *Significant at 0.10 levela The spatial two-stage least-squares estimation based on the use of the spatially lagged rent as
instrumentb The spatial autoregressive parameter
The coefficient of the noise level during the night for the aggregate model is in the middle of the interval constituted by these two submarkets estimates.
To be able to compare our estimates with the results from a study carried out for Geneva (Baranzini and Ramirez, 2005) we have also estimated the implicit prices of the noise level during the day26 using the same equation. The results show that an increase of 1 dB(A) in the traffic noise level during the day leads
648 Banfi / Filippini / Horehájová
to 0.2% decrease in the rents in the aggregate Zurich market. The coefficient is highly statistically significant. If we compare our results with those of Baranzini and Ramirez (2005) for the whole canton of Geneva, where the impact of all sources of noise during the day is 0.28% for an additional decibel, we can observe for this latter study a higher impact on rents. Additionally, the authors also found that the estimates differ for the submarkets and that the coefficient in the con-trolled sector is higher than the coefficient in the private sector. The impact of traffic noise on the rent level in the city of Zurich and the greater Geneva area have been analyzed also by Schaerer, Baranzini, Ramirez and thalmann (2008). The authors found that the impact of 1 dB(A) increase in daytime noise level in Zurich will lead to 0.37% decrease in the rent. This result is comparable to our traffic noise estimate in the non-profit market.
As an indicator for air quality in the aforementioned study the exposure to NO2 was used. The effect on rent was of about 0.8% per μg/m3. Taking the exposure to PM10 in Zurich we obtain a rent decrease of 0.5% per an increase of 1 μg/m3. Although the comparability of the results is limited because of the different pollutants considered in the analysis, the estimates are of similar magnitudes. Additional analysis, using the same air pollutant, could give in this regard more accurate results.
These results indicate that all three environmental variables are taken into account when deciding to rent an apartment from the profit sector while in the non-profit sector the only important environmental variable is the traffic noise level. These results confirm that there are differences in the implicit prices in these two submarkets. Further, we cannot exclude that market imperfections are more important in the non-profit housing sector. This could have an impact on the significance of the coefficients for the environmental variables considered in this paper.
The differences between mean marginal willingness to pay (WTP) for the overall market and the two rental sectors and between the two rental sectors cal-culated in monetary values are in Table 5.
One of the location variables is the distance from city centre, which also affects the rent level. We can observe that an increase of 1 km from the city centre reduces rents by around 2% in both rental sectors.
Further, we integrated in the regression several variables indicating the inte-rior finishing of the flat, like the presence of a modern kitchen with all appli-ances like dish washer, fridge, oven etc. integrated, the presence of a second toilet, of a balcony, garden and lift. All these variables are significant and posi-tive for the aggregated market, while some of them are not significant on the submarket level.

Valuation of Environmental Goods in Profit and Non-Profit Housing Sectors 649
Table 5: Monthly Marginal Willingness to Paya in CHF for the Whole Sample and the Two Submarkets
Zurich, overall market
Profit submarket
Non-profit submarket
PM10 (per 1 μg/m3) 6.9 7.5 –*
Noise Night (per 1 dB(A)) 4.2 3.7 3.9
Presence of an antenna within 200 m from the apartment
16.4 27.8 –*
* estimated parameter not significanta For the computation of the marginal willingness to pay we used the mean values from
Table 3.
Finally, we have analyzed the sensitivity of the marginal willingness to pay (WTP) with regard to changes of the functional form specification. The estimates of the mean marginal WTP computed for the aggregate model for four different func-tional forms, namely linear, semi-log, log-log and Box-Cox are presented in Table 6. The results indicate the marginal WTP is quite robust with respect to the functional form. The differences between the estimates are not large. These estimates could be used to construct intervals for the true marginal WTP.
Table 6: Monthly Marginal WTP in CHF for the Environmental Variables for Different Functional Form Specifications
Functional formMean marginal WTP
PM10 Noise Electrosmog
Lin-lin θ = λ = 1 30.7 3.9 27.5
Semi-log θ = 0 λ = 1 25.4 4.4 16.1
Log-log θ = 0 λ = 0 28.2 3.8 17.0
Flexible θ = 0 λ = 0.292 27.5 4.0 17.2

650 Banfi / Filippini / Horehájová
6. Conclusion and Summary
This paper analyses the impact of electromagnetic pollution, noise and air pollu-tion on the rent level for the aggregated and disaggregated market in the city of Zurich, Switzerland. Air pollution and noise are two crucial sources of external effects in urban areas. Besides these two well known types of external effects, the paper focuses particularly on electrosmog caused by mobile phone antennas. There is no conclusive assessment about the health impacts of electromagnetic radiation caused by antennas yet, nonetheless people are concerned about possible long term risks associated with the exposure. This risk perception may affect the price of dwellings located close to antenna. The paper tries to find some empiri-cal evidence for such an impact.
The rental sector in Zurich is characterized by the presence of non-profit sup-pliers (housing cooperatives, public owners) as well as for-profit suppliers (private owners, institutional owners such as insurance companies and pension funds). The non-profit providers aim at offering an affordable housing space for families and disadvantaged households. Therefore, we decided to split the rental housing market into a non-profit and a for-profit sector and estimate the marginal will-ingness to pay for an improvement of the environmental loads for both market segments.
The hedonic price regressions for the whole city and for two submarkets have been carried out for a sample of 6 204 dwellings. The explanatory variables con-sidered in the regression are several dwelling characteristics such as size, number of rooms, year of construction, etc. In addition, the regression considers differ-ent environmental variables such as noise level during the night (above the limit values set by law), air pollution measured through the PM10 level and the pres-ence of a mobile phone antenna within a radius of 200 meters.
The regression results show that the environmental variables considered have the expected sign and are highly significant, with exception of the presence of an antenna and the air pollution for the non-profit submarket. However, the greatest part of the variation is explained, as expected, by the structural variables. Further-more, our results confirm that the hedonic prices vary across submarkets defined with respect to the type of owner of the apartment (for-profit or non-profit).
When calculated in monetary values, the differences between these two sub-markets are even more obvious.
The negative impact of a mobile phone antenna on flats belonging to the profit segment can be explained by the fear of electromagnetic radiation or by the loss of esthetics owing to the presence of an antenna near the building. Some more research is necessary in order to ascertain these two effects.

Valuation of Environmental Goods in Profit and Non-Profit Housing Sectors 651
Further, it would be interesting to extend the research to other cities in order to detect whether the results can be generalized.
References
Adair, A. S., J. N. Berry and W. S. McGreal, (1996), “Hedonic Modelling, Housing Submarkets and Residential Valuation”, Journal of Property Research, vol. 13(1), pp. 67–83.
Ahlbom, Anders, Elisabeth Cardis, Adele Green, Martha Linet, David Savitz and Anthony Swerdlow (2001), “Review of the Epidemiologic Lit-erature on EMF and health”, Environmental Health Perspectives, 109 (Sup-plement 6), pp. 911–933.
Anselin, Luc, and Anil K. Bera (1998), “Spatial Dependence in Linear Regres-sion Models with an Introduction to Spatial Econometrics”, in Ullah, A. and Giles (eds) Handbook of Applied Economic Statistics, pp. 237–289.
Banfi, Silvia, Massimo Filippini, Andrea Horehájová and Daniela Pióro (2007), „Zahlungsbereitschaft für eine verbesserte Umweltqualität am Wohn-ort – Schätzungen für die Städte Zürich und Lugano für die Bereiche Luft-verschmutzung, Lärmbelastung und Elektrosmog von Mobilfunkantenne“, Zürich.
Baranzini, Andrea, and José V. Ramirez (2005), “Paying for Quietness: The Impact of Noise on Geneva Rents”, Urban Studies, vol. 42(4), pp. 633–646.
Baranzini, Andrea, Caroline Schaerer, José V. Ramirez and Philippe Thalmann (2006), “Feel It or Measure It – Perceived vs. Measured Noise in Hedonic Models”, Haute école de gestion de Genéve, Available at SSRN: http://ssrn.com/abstract=937259.
Bjørner, Thomas B., Jacob Kronbak and Thomas Lundhede (2003), “Val-uation of Noise Reduction – Comparing Results from Hedonic Pricing and Contingent Valuation”, AKF, Institute of Local Government Studies, Denmark.
Bourassa, Steven. C., Foort Hamelink, Martin Hoesli and Bryan D. MacGregor (1999), “Defining Housing Submarkets”, Journal of Housing Economics, vol. 8(2), pp. 160–183.
Bourassa, Steven C., Martin Hoesli and Vincent S. Peng (2003), “Do Housing Submarkets Really Matter?”, Journal of Housing Economic, vol. 12(1), pp. 12–28.
Breckenkamp, Jürgen, Gabriele Berg and Maria Blettner (2003), “Biolog-ical Effects on Human Health Due to Radiofrequency/Microwave Exposure:

652 Banfi / Filippini / Horehájová
A Synopsis of Cohort Studies”, Radiation and Environmental Biophysics, 42, pp. 141–154.
Champ, Patricia A., Kevin J. Boyle and Thomas C. Brown (eds) (2004), “A Primer on Nonmarket Valuation”, The Economics of Non-Market Goods and Resources, 3, Netherlands.
Chattopadhyay, Supid (1999), “Estimating the Demand for Air Quality: New Evidence Based on the Chicago Housing Market”, Land Economics, 75, pp. 22–38.
Court, Andrew T. (1939), “Hedonic Price Indexes with Automobile Examples”, in The Dynamics of Automobile Demand, New York, pp. 99–117.
Dale-Johnson, David (1982), “An Alternative Approach to Housing Market Segmentation Using Hedonic Price Data”, Journal of Urban Economics, 11(3), pp. 311–332.
Des Rosiers, Francois (2002), “Power Lines, Visual Encumbrance and House Values: A Microspatial Approach to Impact Measurement”, Journal of Real Estate Research, 23 (3), pp. 275–301.
Forrest, David (1991), “An Analysis of House Price Differentials between Eng-lish Regions”, Regional Studies, 25 (3), pp. 231–238.
Gerheuser, F. W. (1999), Mietpreis-Strukturerhebung 1996, Swiss Federal Sta-tistical Office, Bulletin 271-9600, Neuchatel.
Green, William H. (2008), “Econometric Analysis”, 6th ed., New Jersey.Griliches, Zvi (1961), “Price Indexes and Quality Change”, Studies in New
Methods of Measurement, for the Price Statistics Committee, Federal Reserve Board, Cambridge, Massachusetts.
Hamilton, Stanley W., and Gregory M. Schwann (1995), “Do High Volt-age Electric Transmission Lines Affect Property Value?”, Land Economics, 71 (4), pp. 436–44.
Kemeny, Jim, Jan Kersloot and Philippe Thalmann (2005), “Non-Profit Housing Influencing, Leading and Dominating the Unitary Rental Market: Three Case Studies”, Housing Studies, 20(6), pp. 855–872.
Kim, Chong Won, Tim T. Phipps and Luc Anselin (2003), “Measuring the Benefits of Air Quality Improvement: A Spatial Hedonic Approach”, Journal of Environmental Economics and Management, 45, pp. 24–39.
Michaels, Gregory R., and Kerry V. Smith (1990), “Market Segmentation and Valuing Amenities with Hedonic Models: The Case of Hazardous Waste Sites”, Journal of Urban Economics, 28, pp. 223–242.
Navrud, Stale (2002), “The State-of-the-Art on Economic Valuation of Noise”, Final Report to European Commission DG Environment, Department of Economics and Social Sciences, Agricultural University of Norway.

Valuation of Environmental Goods in Profit and Non-Profit Housing Sectors 653
Nelson, Jon P. (2008), “Hedonic Property Value Studies of Transportation Noise: Aircraft and Road Traffic”, in Baranzini, A., J. Ramirez, C. Schaerer and P. Thalmann (Eds), Hedonic Methods in Housing Markets. Pricing Envi-ronmental Amenities and Segregation, New York.
Palm, Risa (1978), “Spatial Segmentation of the Urban Housing Market”, Eco-nomic Geography, 54(3), pp. 210–221.
Rossi, Angelo A. (2007), “The Housing Market in Zurich’s Urban Agglomera-tion”, in European Metropolitan Housing Markets, pp. 145–164, Berlin.
Röösli, Martin, Anke Huss and Nadja Schreier (2005), „Repräsentative Befragung zu Sorgen und gesundheitlichen Beschwerden im Zusammenhang mit elektromagnetischen Feldern in der Schweiz“, Universität Bern.
Schaerer, Caroline, Andrea Baranzini, José V. Ramirez and Philippe Thalmann (2008), “Using the Hedonic Approach to Value Natural Land Uses in an Urban Area: An Application to Geneva and Zurich”, Economie Publique/ Public Economics, 20(2007/1), pp. 147–167.
Schmid, Peter (2005), „Die Wohnbaugenossenschaften der Schweiz“, unveröf-fentlichte Masterarbeit am VMI der Universität Freiburg.
Schnare, Ann B. and Raymond J. Struyk (1976), “Segmentation in Urban Housing Markets”, Journal of Urban Economics, 3, pp. 146–166.
Siegrist, Michael, Timothy C. Earle and Heinz Gutscher (2003), “Test of a Trust and Confidence Model in the Applied Context of Electromagnetic Field (EMF) Risks”, Risk Analysis, 23, pp. 705–716.
Siegrist, Michael, Timothy C. Earle, Heinz Gutscher and Carmen Keller (2005), “Perception of Mobile Phone and Base Station Risks”, Risk Analysis, 25(5), pp. 1253–1264.
Thalmann, Philippe (1987), «Explication empirique des loyers lausannois», Swiss Journal of Economics and Statistics, 129, pp. 123, 47–70.
Thalmann, Philippe (1993), “How Expensive is Appropriate Housing?”, Swiss Journal of Economics and Statistics, 129, pp. 23–38.
Thalmann, Philippe (2003), “ ‘House Poor’ or Simply ‘Poor’?”, Journal of Hous-ing Economics, 12, pp. 291–317.
Watkins, Craig A. (2001), “The Definition and Identification of Housing Sub-markets”, Environmental and Planning A, 33, pp. 2235–2253.
Zabel, Jeffrey E., and Katherine A. Kiel (2000), “Estimating the Demand for Air Quality in Four U.S. Cities”, Land Economics, 76 (2), pp. 174–194.