valuation and operating performance gains
DESCRIPTION
aTRANSCRIPT

Eurasian Business Review, 3(2), 2013, 137-163 DOI: 10.14208/ebr.2013.03.02.002
* Department of International Business, National Taiwan University, Taipei, Taiwan. Email: [email protected].
ARE THERE VALUATION AND OPERATING PERFORMANCE GAINS
FROM INTERNATIONAL CROSS LISTING? EVIDENCE FROM
TAIWAN’S DEPOSITARY RECEIPT ISSUERS
Jyh-Dean Hwang* Abstract: This article investigates if there are valuation and operating performance gains from international cross listing, using a sample of 55 Taiwanese firms that instituted deposit receipt (DR) programs in the US, the UK and Luxemburg from 1992 to 2009. We find that Tobin’s q, stock returns and operating performance of DR issuers deteriorate and under-perform their benchmarks substantially after issue. Taiwan has been an emerging market not very accessible for foreign investors for the best part of our sample period and DR issuers from Taiwan should be in a better position to reap valuation gains and other benefits by listing their shares in more prestigious markets. Our findings suggest that the potential benefits of international cross listing might not be as significant as previously thought. These results are of practical relevance and contribute to the ongoing debate on
the costs and benefits of international cross listing. Keywords: International Cross Listing, DR Issue, Valuation Effects, Operating Performance Effects
1. Introduction It is widely documented in the literature that international cross listing has positive valuation effects on the listed company’s shares. In general, such effects are attributed to a reduction of the risk premium associated with the cross-border barriers to investments and disadvantaged characteristics of the particular home equity market (Sarkissian and Schill, 2012). In particular, extant literature proposes several sources of international cross listing benefits, including reduction of cross-border barriers to investment (Errunza and Losq, 1985; Alexander et al. 1987, 1988; Foerster and
Karolyi, 2000; Flavin and O’Connor, 2010), expansion of shareholder base (Foerster and Karolyi, 1999), increase in information flow (Merton, 1987; Foerster and Karolyi, 1999), increase in liquidity (Werner and Kleidon, 1996; Domowitz et al. 1998; Foerster and Karolyi, 1998), increase in visibility and prestige (Fanto and Karmel, 1997; Karolyi, 1998; Bancel and Mittoo, 2001; Baker et al. 2002), access to more developed capital markets and lower-cost external financing (Errunza and Miller, 2000; Lins et al. 2005; Khurana et al. 2008), listing serving as a signal of high value firms
(Fuerst, 1998; Moel, 1999), better monitoring and disclosure requirements (Fuerst, 1998; Huddart et al. 1999), and better minority shareholder
protection (Coffee, 2002; Reese and Weisbach, 2002; Lee, 2003; Benos and Weisbach, 2004; Doidge et al. 2004).
On the other hand, capital structure models in the spirit of Myers and Majluf (1984) suggest that firms have incentives to issue common

J.D. Hwang / Eurasian Business Review, 3(2), 2013, 137-163
138
stock when they are overvalued. The literature has demonstrated that the market will react negatively to the announcement of public equity offering. However, the market may under-react. As a consequence, those firms may have post-issue underperformance. Prediction based on these models is consistent with market timing hypothesis, which predicts firms time their stock issues during periods of strong operating performance. Such firms will experience lower post-issue performance.
The existing literature documents substantial abnormal stock returns and operating performance during periods surrounding new securities issue. Dharan and Ikenberry (1995), Loughran and Ritter (1995; 1997), McLaughlin et al. (1998), Bae et al. (2002), and Khurshed et al. (2003),
among others, observe post-issue underperformance for firm issuing stock and equity-like securities1. As many of the DR issuers raise equity capital from DR issue, by analog, the issuance of DRs may be associated with valuation effects and operating effects similar to those observed among firms that issue equity.
This article investigates if there are valuation and operating performance gains from international cross listing, using a sample of 55 Taiwanese firms that issued deposit receipts for the first time in the US, the UK and Luxemburg from 1992 to 2009.
We find strong evidence of negative valuation effects. DR issuance is associated with a substantial decline in Tobin’s q and stock returns after issue. Our findings are consistent with those reported by Gozzi et al.
(2008); King and Segal (2009); and Sarkissian and Schill (2009). We also find that the operating performance of DR issuers deteriorate and under-perform their benchmarks substantially after issue. Our findings suggest that apart from seeking the aforementioned benefits of international cross listing, firms might time their issue of depositary receipts strategically during period of strong stock price and operating performance.
Taiwan has been an emerging market not very accessible for foreign investors for the best part of our sample period. Cetorelli and Peristiani (2010) use network analysis to derive prestige index for forty-five stock markets. They find that the US and the UK stock markets are far more prestigious than the Taiwan market. Based on the market segmentation hypothesis, the disadvantaged market hypothesis and Merton’s (1987) recognition hypothesis of international cross listing, DR issuers from Taiwan should be in a better position to have valuation gains and other benefits by listing their shares in these markets2. Contrary to the predictions of these hypotheses, we find that the valuation of Taiwan’s DR issuers deteriorate and under-perform their benchmarks substantially after issue.
1 A notable exception in the literature is Eckbo et al. (2000) who find no significant evidence
of underperformance post-SEO. I thank the reviewer for bringing this to my attention. 2 I thank the reviewer for bringing to my attention that the argument is also consistent with
Merton’s recognition hypothesis.

J.D. Hwang / Eurasian Business Review, 3(2), 2013, 137-163
139
Our findings suggest that the potential benefits of international cross listing might not be as significant as previously thought. Our results are of practical relevance and importance and contribute to the current debate on the costs and benefits of international cross listing (see Fernandes and Ferreira, 2008; Charitou and Louca, 2009; Barzuza, 2009; Goto et al. 2009; Cetorelli and Peristiani, 2010; Dodd and Louca, 2011; Sarkissian and Schill, 2012; Bris et al. 2012).
The rest of this article is organized as follows. Section 2 describes data used in this study and our research methodology. Section 3 presents evidence on valuation effects of DR issue. Section 4 presents evidence on operating performance effects. Section 5 sums up our findings and concludes this article. 2. Data and Methodology 2.1. Data
Our sample includes 55 Taiwanese firms that issued deposit receipts for the first time in the US, the UK and Luxemburg from 1992 to 2009. All data used in this study are taken from database of Taiwan Stock Exchange, Taiwan Economic Journal and Securities and Futures Bureau, Taiwan. The first depositary receipt program from Taiwan was established in 1992 and a total of 73 Taiwanese firms had issued deposit receipts in the US, the UK and Luxemburg from 1992 to 2009. In constructing our sample, we eliminate financial firms, firms that were delisted from Taiwan Stock Exchange after their DR issue, and firms without sufficient financial data to construct performance measures for empirical analysis.
In Table 1, we present the frequency of DR issues in our sample by the year of DR listing, the listing market and capital raising activity. Of the 55 DR listings in our sample, there are 37 listings on the Luxemburg market, 8 listings on the US market and 10 listings on the UK market. 33 listings raised equity capital and 22 listing did not. Data of the listing frequency are from Taiwan Stock Exchange and Securities and Futures Bureau, Taiwan.
Apart from using the whole sample to investigate the effects of DR listing, we split our sample into a Luxemburg listing subsample and a Non-Luxemburg listing subsample to examine if the effects of DR listing depend on the listing markets. It is interesting to investigate the effects of DR listing for each of the three listing markets. However, as there are only 8 listings on the US market and only 10 listings on the UK market, we group these 18 listings together as the Non-Luxemburg listing subsample.
Based on the market segmentation hypothesis, the disadvantaged market hypothesis and the recognition hypothesis of international cross listing, DR issuers from Taiwan should be in a solid position to garner valuation gains and other benefits by listing their shares in these markets. It is worthwhile and interesting to use DR issuers from Taiwan as sample to investigate if there are valuation and operating performance gains from

J.D. Hwang / Eurasian Business Review, 3(2), 2013, 137-163
140
international cross listing, as findings of the contrary would cast stronger doubt on the potential benefits of international cross listing documented in the existing literature.
Table 1. Frequency of DR issues by year, market and capital raising
Year of issue
Number. of issue
Luxemburg listed
US listed
UK listed
Capital raised
No capital raised
1992 3 2 0 1 0 3 1993 1 1 0 0 1 0 1994 4 4 0 0 2 2 1995 4 2 2 0 1 3 1996 4 0 1 3 4 0 1997 6 2 2 2 3 3 1998 1 1 0 0 1 0 1999 7 6 0 1 1 6 2000 2 1 1 0 1 1 2001 1 0 0 1 1 0 2002 5 3 1 1 5 0 2003 10 8 1 1 8 2 2004 1 1 0 0 1 0 2005 2 2 0 0 1 1 2006 1 1 0 0 1 0 2007 1 1 0 0 1 0 2008 0 0 0 0 0 0 2009 2 2 0 0 1 1
Sum 55 37 8 10 33 22 Note: Data are compiled from Taiwan Stock Exchange and Securities and Futures Bureau, Taiwan.
2.2. Measuring Valuation Effect of DR Issue
We use three valuation measures to examine the valuation effects of DR issue, namely Tobin’s q, holding period returns, and cumulative abnormal returns (CAR).
2.2.1. Measuring Valuation Effects by Tobin’s q Tobin’s q is computed as follows: (book value of debt + market value of equity)/book value of total asset. We examine the effects of DR issuance on Tobin’s q over a seven-year period around the issue year, including the
issue year (designated year 0), the three-year period before the issue year (years -3, -2 and -1), and the three-year period after the issue year (years +1, +2 and +3).
We use two benchmarks to measure abnormal Tobin’s q of DR issuers. One is Tobin’s q of the other firms in the issuer’s industry. We calculate an issuer’s industry-adjusted Tobin’s q by subtracting Tobin’s q of the other firms as a whole in the issuer’s industry from Tobin’s q of the
issuer over the same period.

J.D. Hwang / Eurasian Business Review, 3(2), 2013, 137-163
141
The other benchmark is Tobin’s q of the matched firm. The matched
firm is defined as a firm that is in the same or similar industry of the DR issuer, has a seasoned equity offering in the year when the DR issuer offers its DR for the first time, and has a book value most comparable to the DR issuer. We calculate an issuer’s matched-firm-adjusted Tobin’s q by subtracting Tobin’s q of the matched-firm from Tobin’s q of the issuer over
the same period. This methodology controls for the possible changes in industry-wide
as well as economy-wide business conditions. Our data have two dimensions: cross-sectional observations (DR
issuer) and time series observations (year relative to DR issue). Empirical estimates should take both cross-section and time series variation in the data into account. We estimate the changes in Tobin’s q after DR issue using panel analysis in a way similar to Pagano et al. (1998) and Khurshed et al. (2003). We use the following specification to estimate effects of DR issue on Tobin’s q:
(1)
The variable yit is Tobin’s q for firm i in the year t. Subscript t is the year relative to DR issue, t =-3, -2, -1, +1, +2, +3 . The variable drj is the dummy variable equal to 1 if the year is the event year j after the DR issue year, and equal to 0 otherwise. Subscript j is the event year between +1
and +3 relative to the DR issue year. The variable αi is an issuer-specific
dummy. The error term eit has two dimensions, one for the issuer (i) and one for the time period (t). When the estimated coefficient for the event year j is negative, it means Tobin’s q decreases compared to its average
over the three years before the year of issue. In other words, we use an issuer-specific fixed-effects panel regression model to estimate the effects of DR issue on the issuer’s Tobin’s q. The redundant fixed-effects test is employed to check for the legitimacy of the fixed-effects specification. The test takes as the null that the issuer-specific fixed-effects are redundant. In performing this test, the panel regression model with firm-specific fixed effects is estimated first and the null that the issuer-specific fixed-effects are redundant is tested. When the null is rejected, there are issuer-specific fixed-effects and the panel regression model should be estimated accordingly. When the null is accepted, there are no fixed effects.
We do not include a dummy variable for each year because our sample is aligned in event time, i.e. year relative to the year of DR issue, rather than calendar time. It may be of interest to include a dummy variable for each year of DR listing and a dummy variable for each DR issuer’s industry in Equation (1) to control for the respective effect. However, as our sample is not large enough and not well spread across the calendar years and industries, doing so will cause perfect collinearity problem and render regression analysis infeasible. Take the years of 1993, 1998, 2001, 2004, 2006 and 2007 for example, there is only 1 DR listing in each of these

J.D. Hwang / Eurasian Business Review, 3(2), 2013, 137-163
142
years. Including a dummy variable for one of these years and a dummy for the DR issuer in that year will lead to perfect collinearity problem.
2.2.2. Measuring Valuation Effects by Holding Period Returns
We calculate two holding period returns in the period around the DR issue and use them to test for the valuation effects. The first holding period, designated [-252,-60], starts one year, defined as 252 trading days, before the issue and ends 60 trading days before the issue. The second holding period, designated [+1, +3*252], begins on the day after the issue and ends
three years later. We use three benchmarks to measure abnormal returns of DR issuer. One is the returns of the market index. The second one is the stock returns of the other firms in the issuer’s industry. The third benchmark is the stock returns of the matched firm. An issuer’s market-adjusted stock returns, industry-adjusted stock returns and matched-firm-adjusted stock returns are calculated in the same manners as its industry-adjusted Tobin’s q and matched-firm-adjusted Tobin’s q. We test for the effects of DR issue on the holding period abnormal returns using t-test and Wilcoxon signed-
rank test. 2.2.3. Measuring Valuation Effects by Cumulative Abnormal Returns
For every DR issuer, the following time series regression is estimated:
(2) for t = −250 to t = −101 days relative to the date of DR issue. Rit is the stock returns of issuer i on day t and Rmt is the returns of Taiwan’s stock market index on day t. We calculate the cumulative abnormal returns (CAR) from the residuals for four event periods (E) around the date of DR issue,
namely [-100,-1], [ 0, + 30], [ 0, +100] , and [ 0, + 250]:
(3)
We then test for the significance of CAR using standard event study
methodology and infer from the test results if there are valuation gains for the issuers after the issuance of DR.
2.3. Measuring Operating Performance Effects of DR Issue
We examine the operating effects of DR issue over a seven-year period around the issue year, including the issue year (designated year 0), the three-year period before the issue (years -3, -2 and -1), and the three-year period after the issue year (years +1, +2 and +3).
Our measurement of operating performance includes returns on asset (ROA, calculated as net income/total asset), returns on equity (ROE,

J.D. Hwang / Eurasian Business Review, 3(2), 2013, 137-163
143
calculated as net income/equity), cash flow returns on asset (CFROA, calculated as operating cash flow/total asset), returns on sales (ROS, calculated as net income/sales), ratio of earnings before interest, tax, depreciation and amortization to total asset (EBITDA/TA), and asset turnover (AT, calculated as Sales/TA).
We use two benchmarks to measure abnormal operating performance of DR issuers. One is the performance of the other firms in the issuer’s industry. The other benchmark is the performance of the matched firm. An issuer’s industry-adjusted operating performance and matched-firm-adjusted operating performance are calculated in the same manners as its industry-adjusted Tobin’s q and matched-firm-adjusted Tobin’s q.
This methodology controls for the possible changes in industry-wide as well as economy-wide business conditions and also control for possible mean reversion in operating performance reported in previous studies (confer Fama and French, 1995).
As is the case of Tobin’s q, our data have cross-sectional
observations (DR issuer) and time series observations (year relative to DR issue). In a way similar to that in estimating the effects of DR issue on Tobin’s q, we use an issuer-specific fixed-effects panel regression model to estimate the effects of DR issue on operating performance (confer Equation 1). 3. Evidence on Valuation Effects 3.1. Valuation Effects Measured by Tobin’s q
Descriptive statistics of the unadjusted, industry-adjusted and matched-firm-adjusted Tobin’s q for the whole sample, the Luxemburg subsample
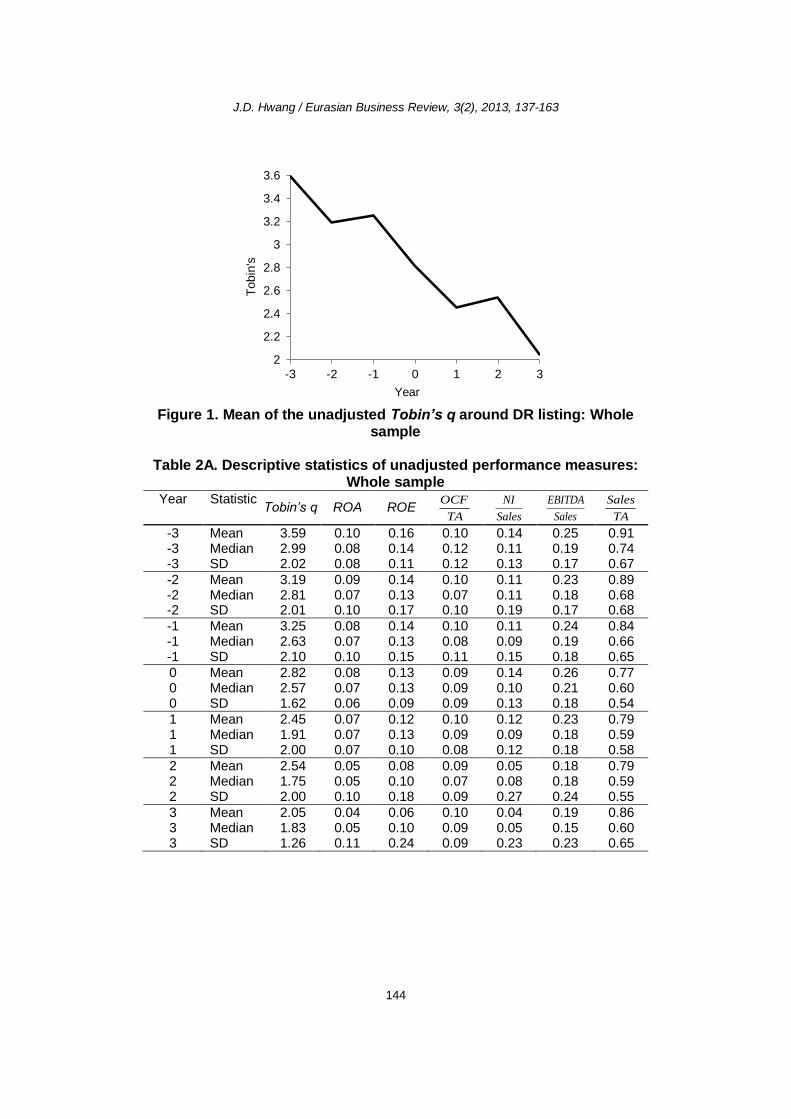
and the Non-Luxemburg subsample are presented in Tables 2A-2C, 3A-3C and 4A-4C respectively. As is shown in these tables, most measures of Tobin’s q deteriorate after the issuance of DR. Take Tobin’s q of the whole sample as example. The mean of the unadjusted Tobin’s q declines from 3.59 in the year of (-3) to 2.05 in the year of (+3) (confer Figure 1 and Table 2A). The mean of the matched-firm-adjusted Tobin’s q declines from 2.08 in
the year of (-3) to 0.33 in the year of (+3) (confer Table 4A). Descriptive statistics of Tobin’s q augur the following panel regression results.
J.D. Hwang / Eurasian Business Review, 3(2), 2013, 137-163
144
Figure 1. Mean of the unadjusted Tobin’s q around DR listing: Whole
sample Table 2A. Descriptive statistics of unadjusted performance measures:
Whole sample Year Statistic
Tobin’s q ROA ROE OCF
TA
NI
Sales
EBITDA
Sales
Sales
TA
-3 Mean 3.59 0.10 0.16 0.10 0.14 0.25 0.91 -3 Median 2.99 0.08 0.14 0.12 0.11 0.19 0.74 -3 SD 2.02 0.08 0.11 0.12 0.13 0.17 0.67
-2 Mean 3.19 0.09 0.14 0.10 0.11 0.23 0.89 -2 Median 2.81 0.07 0.13 0.07 0.11 0.18 0.68 -2 SD 2.01 0.10 0.17 0.10 0.19 0.17 0.68
-1 Mean 3.25 0.08 0.14 0.10 0.11 0.24 0.84 -1 Median 2.63 0.07 0.13 0.08 0.09 0.19 0.66 -1 SD 2.10 0.10 0.15 0.11 0.15 0.18 0.65
0 Mean 2.82 0.08 0.13 0.09 0.14 0.26 0.77 0 Median 2.57 0.07 0.13 0.09 0.10 0.21 0.60 0 SD 1.62 0.06 0.09 0.09 0.13 0.18 0.54
1 Mean 2.45 0.07 0.12 0.10 0.12 0.23 0.79 1 Median 1.91 0.07 0.13 0.09 0.09 0.18 0.59 1 SD 2.00 0.07 0.10 0.08 0.12 0.18 0.58
2 Mean 2.54 0.05 0.08 0.09 0.05 0.18 0.79 2 Median 1.75 0.05 0.10 0.07 0.08 0.18 0.59 2 SD 2.00 0.10 0.18 0.09 0.27 0.24 0.55
3 Mean 2.05 0.04 0.06 0.10 0.04 0.19 0.86 3 Median 1.83 0.05 0.10 0.09 0.05 0.15 0.60 3 SD 1.26 0.11 0.24 0.09 0.23 0.23 0.65
2
2.2
2.4
2.6
2.8
3
3.2
3.4
3.6
-3 -2 -1 0 1 2 3
Year
Tobin
's

J.D. Hwang / Eurasian Business Review, 3(2), 2013, 137-163
145
Table 2B. Descriptive statistics of unadjusted performance measures: Luxemburg sample
Year Statistic Tobin’s
q ROA ROE
OCF
TA
NI
Sales
EBITDA
Sales
Sales
TA
-3 Mean 3.05 0.09 0.15 0.09 0.12 0.23 0.93
-3 Median 2.29 0.08 0.14 0.10 0.11 0.17 0.77
-3 SD 1.90 0.06 0.10 0.11 0.09 0.17 0.67
-2 Mean 2.89 0.08 0.12 0.08 0.08 0.20 0.87
-2 Median 2.51 0.07 0.12 0.06 0.10 0.16 0.62
-2 SD 1.86 0.09 0.16 0.09 0.21 0.17 0.70
-1 Mean 3.05 0.09 0.15 0.09 0.12 0.23 0.93
-1 Median 2.29 0.08 0.14 0.10 0.11 0.17 0.77
-1 SD 1.90 0.06 0.10 0.11 0.09 0.17 0.67
0 Mean 2.62 0.07 0.11 0.08 0.11 0.23 0.79
0 Median 2.57 0.06 0.10 0.07 0.09 0.15 0.62
0 SD 1.28 0.06 0.10 0.09 0.12 0.17 0.60
1 Mean 1.91 0.06 0.11 0.09 0.10 0.22 0.84
1 Median 1.75 0.07 0.12 0.08 0.07 0.16 0.61
1 SD 0.97 0.06 0.10 0.08 0.13 0.20 0.67
2 Mean 2.17 0.04 0.06 0.07 0.00 0.13 0.83
2 Median 1.71 0.04 0.09 0.04 0.05 0.15 0.64
2 SD 1.78 0.11 0.21 0.10 0.31 0.25 0.60
3 Mean 1.78 0.03 0.03 0.09 0.00 0.15 0.92
3 Median 1.60 0.04 0.09 0.08 0.04 0.13 0.64
3 SD 1.11 0.12 0.28 0.09 0.27 0.24 0.71
The effects of DR issue on Tobin’s q are estimated using issuer-
specific fixed-effects panel regression. The fixed-effects specification is justified by the test results of redundant fixed-effects test. The null hypothesis that the fixed-effects are redundant is rejected, indicating that the panel regression model should be estimated using fixed-effects specification.
Panel regression results of the unadjusted, industry-adjusted and matched-firm-adjusted Tobin’s q for the whole sample, Luxemburg
subsample and Non-Luxemburg subsample are reported in Tables 5A-5C. From its pre-issue average of 3.37, the unadjusted Tobin’s q for the
whole sample declines by the amount of 0.96, 0.93, and 1.37 in the first year, the first two years, and the first three years after the year of issue. In percentage terms, these are decreases of 28.49%, 27.60% and 40.65% (confer Panel A of Table 5A). For the industry-adjusted Tobin’s q, from its
pre-issue average of -0.18, it increases by 0.01 in the first year after the year of issue, and decreases by 0.06 and 0.14 in the first two years and the first three years after the year of issue. Nevertheless, all these changes are not significant at the conventional significance level (confer Panel B of Table 5A). For the matched-firm-adjusted Tobin’s q, from its pre-issue average of 0.04, it declines by 0.03, 0.03 and 0.04 in the first year, the first

J.D. Hwang / Eurasian Business Review, 3(2), 2013, 137-163
146
two years, and the first three years after the year of issue. In percentage terms, these are decreases of 75%, 75% and 100% (confer Panel C of Table 5A).
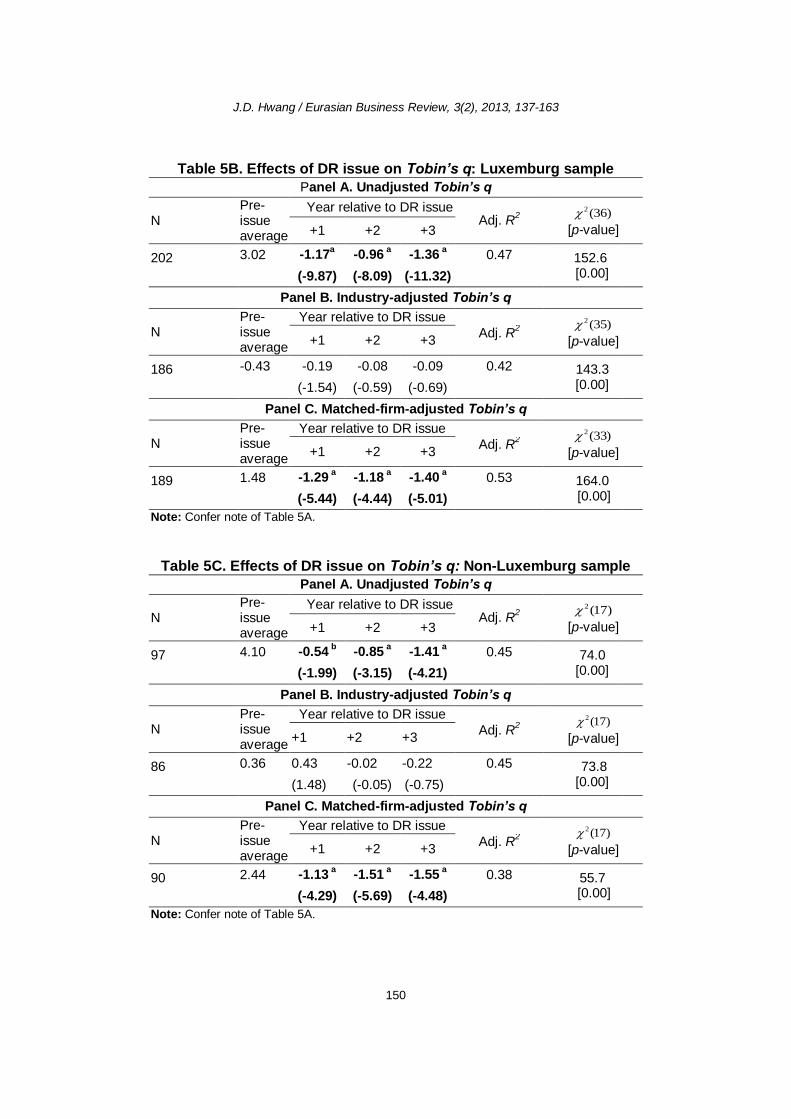
Results for the Luxemburg subsample and the Non-Luxemburg subsample are similar to the results using the whole sample (confer Tables 5B and 5C respectively). We also include sales growth and firm size, proxied by log of market capitalization, of the DR issuers as control variables and re-estimate the effect of DR issue on Tobin’s q using the whole sample, the Luxemburg subsample and the Non-Luxemburg subsample. Regression results (not reported) are similar to those without controlling for sales growth and firm size.3 Taken together, panel regression results indicate that the valuation effect of DR issuance, measured by Tobin’s q, is negative.
Table 2C. Descriptive statistics of unadjusted performance measures:
Non-Luxemburg sample
Year Statistic Tobin’s
q ROA ROE
OCF
TA
NI
Sales
EBITDA
Sales
Sales
TA
-3 Mean 4.80 0.12 0.19 0.14 0.19 0.29 0.89 -3 Median 4.71 0.08 0.15 0.13 0.15 0.25 0.68 -3 SD 1.81 0.10 0.14 0.14 0.16 0.19 0.67
-2 Mean 3.92 0.12 0.18 0.13 0.15 0.29 0.91 -2 Median 3.23 0.08 0.16 0.11 0.14 0.26 0.70 -2 SD 2.21 0.12 0.17 0.12 0.15 0.17 0.65
-1 Mean 4.80 0.12 0.19 0.14 0.19 0.29 0.89 -1 Median 4.71 0.08 0.15 0.13 0.15 0.25 0.68 -1 SD 1.81 0.10 0.14 0.14 0.16 0.19 0.67
0 Mean 3.24 0.11 0.16 0.12 0.20 0.31 0.71 0 Median 2.52 0.11 0.17 0.12 0.14 0.25 0.59 0 SD 2.15 0.06 0.07 0.08 0.13 0.18 0.38
1 Mean 3.56 0.09 0.14 0.13 0.15 0.26 0.68 1 Median 2.82 0.09 0.16 0.12 0.13 0.25 0.59 1 SD 2.97 0.08 0.09 0.09 0.11 0.14 0.32
2 Mean 3.24 0.08 0.12 0.11 0.13 0.27 0.72 2 Median 1.82 0.09 0.12 0.09 0.09 0.22 0.59 2 SD 2.26 0.08 0.12 0.07 0.14 0.18 0.45
3 Mean 2.57 0.07 0.11 0.12 0.12 0.27 0.76 3 Median 2.19 0.05 0.10 0.11 0.07 0.23 0.48 3 SD 1.39 0.06 0.08 0.08 0.11 0.18 0.52
3 Estimation results controlling for sales growth and firm size are available from the author
upon request.
J.D. Hwang / Eurasian Business Review, 3(2), 2013, 137-163
147
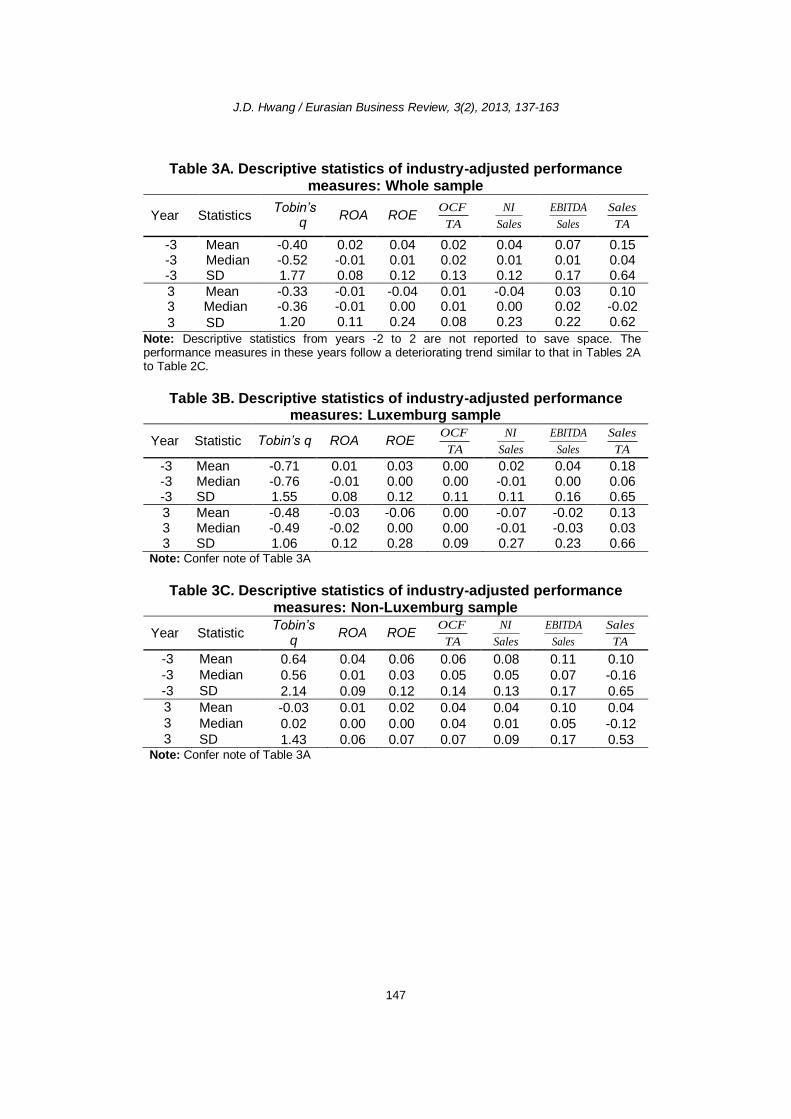
Table 3A. Descriptive statistics of industry-adjusted performance measures: Whole sample
Year Statistics Tobin’s
q ROA ROE
OCF
TA
NI
Sales
EBITDA
Sales
Sales
TA
-3 Mean -0.40 0.02 0.04 0.02 0.04 0.07 0.15 -3 Median -0.52 -0.01 0.01 0.02 0.01 0.01 0.04 -3 SD 1.77 0.08 0.12 0.13 0.12 0.17 0.64
3 Mean -0.33 -0.01 -0.04 0.01 -0.04 0.03 0.10 3 Median -0.36 -0.01 0.00 0.01 0.00 0.02 -0.02
3 SD 1.20 0.11 0.24 0.08 0.23 0.22 0.62
Note: Descriptive statistics from years -2 to 2 are not reported to save space. The performance measures in these years follow a deteriorating trend similar to that in Tables 2A to Table 2C.
Table 3B. Descriptive statistics of industry-adjusted performance
measures: Luxemburg sample
Year Statistic Tobin’s q ROA ROE OCF
TA
NI
Sales
EBITDA
Sales
Sales
TA
-3 Mean -0.71 0.01 0.03 0.00 0.02 0.04 0.18 -3 Median -0.76 -0.01 0.00 0.00 -0.01 0.00 0.06 -3 SD 1.55 0.08 0.12 0.11 0.11 0.16 0.65
3 Mean -0.48 -0.03 -0.06 0.00 -0.07 -0.02 0.13 3 Median -0.49 -0.02 0.00 0.00 -0.01 -0.03 0.03 3 SD 1.06 0.12 0.28 0.09 0.27 0.23 0.66
Note: Confer note of Table 3A
Table 3C. Descriptive statistics of industry-adjusted performance
measures: Non-Luxemburg sample
Year Statistic Tobin’s
q ROA ROE
OCF
TA
NI
Sales
EBITDA
Sales
Sales
TA
-3 Mean 0.64 0.04 0.06 0.06 0.08 0.11 0.10 -3 Median 0.56 0.01 0.03 0.05 0.05 0.07 -0.16 -3 SD 2.14 0.09 0.12 0.14 0.13 0.17 0.65
3 Mean -0.03 0.01 0.02 0.04 0.04 0.10 0.04 3 Median 0.02 0.00 0.00 0.04 0.01 0.05 -0.12 3 SD 1.43 0.06 0.07 0.07 0.09 0.17 0.53
Note: Confer note of Table 3A

J.D. Hwang / Eurasian Business Review, 3(2), 2013, 137-163
148
Table 4A. Descriptive statistics of matched-firm-adjusted performance measures: Whole sample
Year Statistics Tobin’s q ROA ROE OCF
TA
NI
Sales
EBITDA
Sales
Sales
TA
-3 Mean 2.08 0.04 0.13 0.05 0.27 0.12 -0.06 -3 Median 2.15 0.03 0.05 0.05 0.02 0.05 -0.05 -3 SD 2.64 0.15 0.51 0.15 0.94 0.54 0.72
3 Mean 0.33 -0.01 -0.02 0.01 -0.03 -0.01 -0.04 3 Median 0.33 0.01 0.01 0.03 0.01 0.06 -0.07 3 SD 1.78 0.12 0.23 0.09 0.24 0.23 0.54
Note: Confer note of Table 3A
Table 4B. Descriptive statistics of matched firm-adjusted performance
measures: Luxemburg sample
Year Statistic Tobin’s
q ROA ROE
OCF
TA
NI
Sales
EBITDA
Sales
Sales
TA
-3 Mean 1.76 0.02 0.05 0.03 0.30 0.11 0.03 -3 Median 1.93 0.00 0.01 0.01 0.01 0.03 0.03 -3 SD 2.32 0.16 0.28 0.14 1.14 0.65 0.74
3 Mean 0.07 -0.02 -0.03 0.00 -0.05 -0.04 0.02 3 Median 0.15 0.01 0.01 0.02 0.01 0.04 -0.07 3 SD 1.76 0.14 0.27 0.10 0.28 0.26 0.59
Note: Confer note of Table 3A
Table 4C. Descriptive statistics of matched firm-adjusted performance
measures: Non-Luxemburg sample
Year Statistic Tobin’s
q ROA ROE
OCF
TA
NI
Sales
EBITDA
Sales
Sales
TA
-3 Mean 2.89 0.08 0.26 0.10 0.20 0.13 -0.22 -3 Median 3.44 0.07 0.06 0.07 0.12 0.12 -0.46 -3 SD 3.32 0.14 0.75 0.15 0.34 0.24 0.67
3 Mean 0.83 0.01 0.01 0.02 0.02 0.05 -0.14 3 Median 0.42 0.01 0.03 0.03 0.02 0.08 -0.09 3 SD 1.77 0.08 0.11 0.07 0.14 0.15 0.44
Note: Confer note of Table 3A

J.D. Hwang / Eurasian Business Review, 3(2), 2013, 137-163
149
Table 5A. Effects of DR issue on Tobin’s q: Whole sample
Panel A. Unadjusted Tobin’s q
N Pre-issue average
Year relative to DR issue Adj. R
2 2(54)
[p-value] +1 +2 +3
299 3.37 -0.96
a -0.93
a -1.37
a 0.50 224.0
[0.00]
(-6.18) (-5.98) (-7.90)
Panel B. Industry-adjusted Tobin’s q
N Pre-issue average
Year relative to DR issue 2(54)
[p-value] +1 +2 +3 Adj. R
2
272
-0.18 0.01 -0.06 -0.14 0.46 230.0 [0.00]
(0.07) (-0.45) (-1.03)
Panel C. Matched-firm-adjusted Tobin’s q
N Pre-issue average
Year relative to DR issue 2(54)
[p-value] +1 +2 +3 Adj. R
2
291
0.04 -0.03 a -0.03
a -0.04
a 0.48 243.7
[0.00]
(-4.67) (-3.22) (-4.79)
Note: Effect on Tobin’s q is estimated by the following equation: . The variable yit is Tobin’s q for firm i in the year t. Subscript t is the year relative to DR issue, t = -3, -2, -1, +1, +2, +3. The variable drj is the dummy variable equal to 1 if the year is the event year j after the year of DR issue, and equal to 0 otherwise. A negative coefficient for the event year j implies that Tobin’s q decreases compared to its average over the three years before the year of issue. Subscript j is the event year between +1 and +3 relative to the year of DR issue. Pre-issue average is average over the three years before the year of issue. Figures in parentheses are heteroskedasticity and autocorrelation consistent t-statistics. Superscripts a, b and c denote significant at the 1%, 5%, and 10% levels. Significant coefficients are in bold. The last
column reports 2 statistics and its associated p-value (in bracket) of the null hypothesis
that the issuer-specific fixed-effects are redundant. When the null is rejected, there are issuer-specific fixed-effects and the panel regression model is estimated accordingly.
Numbers in parentheses beside 2 are degrees of freedom.
J.D. Hwang / Eurasian Business Review, 3(2), 2013, 137-163
150
Table 5B. Effects of DR issue on Tobin’s q: Luxemburg sample
Panel A. Unadjusted Tobin’s q
N Pre-issue average
Year relative to DR issue Adj. R
2 2(36)
[p-value] +1 +2 +3
202
3.02 -1.17a -0.96
a -1.36
a 0.47 152.6
[0.00]
(-9.87) (-8.09) (-11.32)
Panel B. Industry-adjusted Tobin’s q
N Pre-issue average
Year relative to DR issue 2(35)
[p-value] +1 +2 +3 Adj. R
2
186
-0.43 -0.19 -0.08 -0.09 0.42 143.3 [0.00]
(-1.54) (-0.59) (-0.69)
Panel C. Matched-firm-adjusted Tobin’s q
N Pre-issue average
Year relative to DR issue 2(33)
[p-value] +1 +2 +3 Adj. R
2
189
1.48 -1.29 a -1.18
a -1.40
a 0.53 164.0
[0.00]
(-5.44) (-4.44) (-5.01)
Note: Confer note of Table 5A.
Table 5C. Effects of DR issue on Tobin’s q: Non-Luxemburg sample
Panel A. Unadjusted Tobin’s q
N Pre-issue average
Year relative to DR issue Adj. R
2 2(17)
[p-value] +1 +2 +3
97
4.10 -0.54 b
-0.85 a -1.41
a 0.45 74.0
[0.00]
(-1.99) (-3.15) (-4.21)
Panel B. Industry-adjusted Tobin’s q
N Pre-issue average
Year relative to DR issue 2(17)
[p-value] +1 +2 +3 Adj. R
2
86
0.36 0.43 -0.02 -0.22 0.45 73.8 [0.00]
(1.48) (-0.05) (-0.75)
Panel C. Matched-firm-adjusted Tobin’s q
N Pre-issue average
Year relative to DR issue 2(17)
[p-value] +1 +2 +3 Adj. R
2
90
2.44 -1.13 a -1.51
a -1.55
a 0.38 55.7
[0.00]
(-4.29) (-5.69) (-4.48)
Note: Confer note of Table 5A.

J.D. Hwang / Eurasian Business Review, 3(2), 2013, 137-163
151
3.2. Valuation Effects Measured by Holding Period Returns
In Table 6A-6C, we present the pre-issue and post-issue holding period returns of DR issuers for the whole sample, the Luxemburg subsample and the Non-Luxemburg subsample. On the whole, stock returns of the DR issuers under-perform their benchmarks in the post-issue period regardless of the DR listing markets. For the whole sample (confer Table 6A), in the pre-issue period of [-252, -60], the mean and median of the market-adjusted returns, the industry-adjusted returns and matched-firm-adjusted returns for DR issuers are not significantly different from zero. In the three-year holding period after the issue, [+1, +3*252], the mean and median of
the market-adjusted returns are -48% and -45%, both of which are significant at the 1% level. The industry-adjusted returns for DR issuers in the three-year holding period after the issue are -52% and -52%, both of which are significant at the 1% level. The mean of the matched-firm-adjusted returns for DR issuers in the three-year holding period after the issue is -17%, though it is not significant in the statistical sense.
Table 6A. Effects of DR issue on holding period returns: Whole sample
holding period [-252,-60] [+1, +3*252]
Panel A. Market-adjusted returns
Mean 0.07
(1.30)
-0.48a
(-6.63)
Median 0.05
[0.91]
-0.45a
[-5.15]
Panel B. Industry-adjusted returns
Mean 0.00
(0.01)
-0.52a
(-6.98)
Median 0.00
[0.37]
-0.52a
[-5.25]
Panel C. Matched-firm-adjusted returns
Mean 0.06
(1.04)
-0.17 (-1.15)
Median 0.00
[1.01]
-0.00 [-0.69]
Note: Holding period [-252,-60] starts one year, defined as 252 trading days, before issue and ends 60 trading days before issue, and [+1, +3*252] begins on the day after issue and ends three years later. The t-statistics are in parentheses. Figures in squared brackets are the z-statistics of Wilcoxon signed-rank test. Superscripts a, b and c denote significant at the 1%, 5%, and 10% levels. Significant statistics are in bold.
Results for the Luxemburg listing subsample and Non-Luxemburg listing subsample are in line with the results using the whole sample (confer Table 6B and Table 6C). In sum, these results indicate the three-year holding period returns after DR issue are negative and the long-term valuation effect of DR issuance is negative.

J.D. Hwang / Eurasian Business Review, 3(2), 2013, 137-163
152
Table 6B. Effects of DR issue on holding period returns: Luxemburg sample
holding period [-252,-60] [+1, +3*252]
Panel A. Market-adjusted returns
Mean 0.05
(0.81)
-0.53a
(-5.52)
Median 0.05
[0.68]
-0.46a
[-4.35]
Panel B. Industry-adjusted returns
Mean -0.01
(-0.20)
-0.56a
(-5.92)
Median 0.00
[0.33]
-0.55a
[-4.39]
Panel C. Matched-firm-adjusted returns
Mean 0.01
(0.13)
-0.30 (-1.50)
Median 0.00
[0.18]
-0.10 [-1.24]
Note: Confer note of Table 6A.
Table 6C. Effects of DR issue on holding period returns: Non-
Luxemburg sample holding period [-252,-60] [+1, +3*252]
Panel A. Market-adjusted returns
Mean 0.09
(1.09)
-0.39a
(-3.68)
Median 0.06
[0.43
-0.33a
[-2.79]
Panel B. Industry-adjusted returns
Mean 0.02
(0.32)
-0.45a
(-3.65)
Median -0.04
[-0.10]
-0.46a
[-2.89]
Panel C. Matched-firm-adjusted returns
Mean 0.16
c
(1.83)
0.09 (0.48)
Median 0.01
c
[1.82]
0.13 [0.60]
Note: Confer note of Table 6A.
3.3. Valuation Effects Measured by Cumulative Abnormal Returns
Table 7 presents test results of the cumulative abnormal returns (CAR) for four event periods around the date of DR issue using the whole sample, the Luxemburg subsample and Non-Luxemburg subsample. In the pre-issue period of [-100, -1] for the whole sample, the mean of the cumulative abnormal returns for all DR issuers is 1.3%, but it is not significantly different from zero. During the post-issue periods of [0, +30], [0, +100], and [0, +250] for the whole sample, the means of the cumulative abnormal

J.D. Hwang / Eurasian Business Review, 3(2), 2013, 137-163
153
returns for all DR issuers are -4%, -14%, and -32% respectively, all of which are significant at the 1% level. Results using the Luxemburg subsample and the Non-Luxemburg subsample are similar to those for the whole sample (confer Table 7). These results indicate the valuation effect of DR issuance, measured by the cumulative abnormal returns, is negative.
Table 7. Effects of DR issue on cumulative abnormal returns (CAR)
Event period CAR (whole sample)
CAR (Luxemburg )
CAR (Non-Luxemburg)
[-100, -1] 0.01 0.031 -0.03 (0.26) (0.62) (-0.28) [0, +30] -0.04
a -0.03
c -0.07
b
(-2.70) (-1.76) (-2.08) [0, +100] -0.14
a -0.13
a -0.16
c
(-3.43) (-3.15) (-1.74) [0, +250] -0.32
a -0.24
b -0.29
b
(-3.12) (-2.45) (-2.03) Note: Figures in parentheses are t-statistics. Superscripts a, b and c denote significant at the 1%, 5%, and 10% levels. Significant statistics are in bold.
4. Evidence on Operating Performance Effects
Descriptive statistics of the unadjusted, industry-adjusted and matched-firm-adjusted operating performance measures for the whole sample, the Luxemburg subsample and Non-Luxemburg subsample are reported in Tables 2A-2C, 3A-3C and 4A-4C respectively. As is shown in these three tables, almost all of the measures of operating performance deteriorate after the issuance of DR. Take returns on asset (ROA) of the whole sample as example. The mean of the unadjusted ROA declines from 0.10 in the
year of (-3) to 0.04 in the year of (+3) (confer Table 2A and Figure 2). The mean of the industry-adjusted ROA declines from 0.02 in the year of (-3) to
-0.01 in the year of (+3) (confer Table 3A). Mean of the matched-firm-adjusted ROA declines from 0.04 in the year of (-3) to -0.01 in the year of (+3) (confer Table 4A). Most of the other measures of operating performance show similar trends. Descriptive statistics of the operating performance measures foretell the following panel regression results.
We use an issuer-specific fixed-effects panel regression model to estimate the effects of DR issue on operating performance in a way similar to that in estimating the effects of DR issue on Tobin’s q. Panel regression
results for the unadjusted, industry-adjusted and matched-firm-adjusted operating performance measures using the whole sample, Luxemburg subsample and Non-Luxemburg subsample are reported in Tables 8A-8C, 9A-9C and 10A-10C. As is evidenced in these tables, the majority of the operating performance measures deteriorate substantially after DR issuance.

J.D. Hwang / Eurasian Business Review, 3(2), 2013, 137-163
154
Figure 2. Mean of the unadjusted ROA and ROE around DR listing:
Whole sample
Take returns on asset (ROA) of the whole sample for example.
From its pre-issue average of 9%, the unadjusted ROA declines by 2
percentage points, 4 percentage points, and 5 percentage points in the first year, the first two years, and the first three years after the year of issue. In percentage terms, these are decreases of 22.22%, 44.44% and 55.55% (confer Table 8A). For the industry-adjusted ROA, from its pre-issue
average of 3%, it declines by 2 percentage points, 3 percentage points, and 4 percentage points in the first year, the first two years, and the first three years after the year of issue, which are decreases of 66.67%, 100% and 133.33% (confer Table 9A). For the matched-firm-adjusted ROA, from its
pre-issue average of 4%, it declines by 3 percentage points, 3 percentage points, and 4 percentage points in the first year, the first two years, and the first three years after the year of issue, which are declines of 75%, 75% and 100% (confer Table 10A). The patterns are similar for all the other measures of the whole sample with the exception of the unadjusted OCF/TA. The unadjusted OCF/TA increases by 1 percentage points in the
first year after issue and decreases by about the same magnitude in the second year after issue (confer Table 8A).
Results using the Luxemburg subsample and Non-Luxemburg subsample are similar to the results using the whole sample (confer Tables 8B, 9B, 10B for results using the Luxemburg subsample and 8C, 9C, 10C for the Non-Luxemburg subsample). We also include sales growth and firm size, proxied by log of market capitalization, of the DR issuers as control variables and re-estimate the effects of DR listing on all the operating
0.02
0.04
0.06
0.08
0.1
0.12
0.14
0.16
0.18
-3 -2 -1 0 1 2 3
ROA ROE
Year

J.D. Hwang / Eurasian Business Review, 3(2), 2013, 137-163
155
performance measures using the whole sample, the Luxemburg subsample and the Non-Luxemburg subsample. Regression results (not reported) are similar to those without controlling for sales growth and firm size4. By and large, panel regression results show that the effect of DR listing on operating performance is negative regardless of the listing markets.
Our findings suggest that the potential benefits of international cross listing might not be as significant as previously thought. Nevertheless, the present study has its limitation. As stated earlier in section 2.2.1, it may be of interest to include a dummy variable for each year of DR listing and a dummy variable for each DR issuer’s industry in the panel regression model to control for the respective effect. However, we are unable to control for such effects in this study as our sample is not large enough and not well spread across the calendar years and industries.
Table 8A. Effects on unadjusted operating performance: Whole
sample
N
Pre-issue average
Year relative to DR issue Adj. R
2
2(54)
[p-value] +1 +2 +3
ROA 317 0.09 -0.02
a -0.04
a -0.05
a 0.60 337.4
(-4.19) (-9.35) (-9.57) [0.00]
ROE 317 0.15 -0.03
a -0.07
a -0.09
a 0.49 260.4
(-3.13) (-8.01) (-9.76) [0.00]
OCF/TA 316 0.10 0.01
b -0.01
a 0.01 0.52 290.7
(1.85) (-4.17) (0.50) [0.00]
NI/Sales 317 0.12 -0.01 -0.08
a -0.08
a 0.36 191.5
(-0.37) (-5.24) (-5.55) [0.00]
EBITDA/Sales 314 0.24 -0.01 -0.06
a -0.01
a 0.60 344.7
(-1.22) (-10.46) (-8.88) [0.00]
Sales/TA 317 0.88 -0.08
a -0.10
a -0.03 0.84 643.7
(-4.26) (-5.11) (-1.36) [0.00]
Note: Confer note of Table 5A.
4 Estimation results controlling for sales growth and firm size are available from the author
upon request.

J.D. Hwang / Eurasian Business Review, 3(2), 2013, 137-163
156
Table 8B. Effects on unadjusted operating performance: Luxemburg sample
N
Pre-issue average
Year relative to DR issue Adj. R
2
2(36)
[p-value] +1 +2 +3
ROA 210 0.08 -0.01
c -0.04
a -0.05
a 0.49 175.3
(-1.89) (-6.11) (-7.09) [0.00]
ROE 210 0.13 -0.02 -0.07
a -0.10
a 0.44 156.0
(-1.26) (-5.43) (-7.52) [0.00]
OCF/TA 210 0.08 0.01 -0.01
b 0.01
a 0.42 155.2
(2.41) (-2.10) (2.04) [0.00]
NI/Sales 210 0.10 0.01 -0.10
a -0.10
a 0.27 99.5
(0.37) (-6.13) (-6.16) [0.00]
EBITDA/Sales 210 0.21 0.01 -0.07
a -0.06
a 0.49 179.9
(0.51) (-6.57) (-5.59) [0.00]
Sales/TA 210 0.88 -0.02 -0.07
a 0.02 0.88 492.0
(-1.02) (-3.38) (0.89) [0.00]
Note: Confer note of Table 5A
Table 8C. Effects on unadjusted operating performance: Non-
Luxemburg sample
N
Pre-issue average
Year relative to DR issue Adj.R
2
2(17)
[p-value] +1 +2 +3
ROA 107 0.12 -0.03
a -0.04
a -0.05
a 0.73 157.6
(-27.73) (-39.54) (-19.96) [0.00]
ROE 107 0.19 -0.05
a -0.07
a -0.07
a 0.58 107.9
(-13.84) (-19.66) (-19.92) [0.00]
OCF/TA 106 0.13 -0.01 -0.02
a -0.01
a 0.62 122.9
(-0.23) (-7.24) (-3.16) [0.00]
NI/Sales 107 0.17 -0.03
c -0.04
a -0.05
a 0.58 111.6
(-1.90) (-2.74) (-3.53) [0.00]
EBITDA/Sales 104 0.29 -0.03
a -0.03
a -0.02
b 0.80 191.3
(-3.08) (-2.75) (-2.18) [0.00]
Sales/TA 107 0.87 -0.19
a -0.15
a -0.12
a 0.71 153.7
(-4.71) (-3.64) (-2.63) [0.00]
Note: Confer note of Table 5A

J.D. Hwang / Eurasian Business Review, 3(2), 2013, 137-163
157
Table 9A. Effects on industry-adjusted operating performance: Whole sample
N
Pre-issue average
Year relative to DR issue Adj. R
2
2(54)
[p-value] +1 +2 +3
ROA 317 0.03 -0.02
a -0.03
a -0.04
a 0.57 319.7
(-8.61) (-12.77) (14.86) [0.00]
ROE 317 0.04 -0.03
a -0.06
a -0.08
a 0.45 243.2
(-7.01) (-12.10) (-16.38) [0.00]
OCF/TA 316 0.02 -0.01 -0.02
a -0.01
c 0.52 294.3
(-1.13) (-6.64) (-1.65) [0.00]
NI/Sales 317 0.03 -0.01 -0.06
a -0.07
a 0.35 192.6
(-0.83) (-7.75) (-8.63) [0.00]
EBITDA/Sales 314 0.07 -0.01
c -0.05
a -0.04
a 0.58 327.9
(-1.71) (-9.84) (-7.77) [0.00]
Sales/TA 317 0.13 -0.08
a -0.10
a -0.04
a 0.86 676.2
(-6.33) (-9.11) (-3.85) [0.00]
Note: Confer note of Table 5A
Table 9B. Effects on industry-adjusted operating performance:
Luxemburg sample
N
Pre-issue average
Year relative to DR issue Adj. R
2
2(36)
[p-value] +1 +2 +3
ROA 210 0.02 -0.02
a -0.04
a -0.05
a 0.45 161.1
(-8.43) (-14.18) (-16.12) [0.00]
ROE 210 0.03 -0.03
a -0.07
a -0.10
a 0.41 143.1
(-8.68) (-17.27) (-24.22) . [0.00]
OCF/TA 210 -0.01 -0.01 -0.02
a 0.01 0.39 145.6
(-0.49) (-6.43) (0.24) [0.00]
NI/Sales 210 0.02 -0.01 -0.09
a -0.09
a 0.29 105.4
(-0.47) (-13.01) (-12.91) [0.00]
EBITDA/Sales 210 0.04 0.01 -0.069
a -0.056
a 0.46 166.4
(0.21) (-16.19) (-13.22) [0.00]
Sales/TA 210 0.15 -0.07
a -0.12
a -0.03
a 0.89 496.5
(-7.45) (-16.04) (-4.77) [0.00]
Note: Confer note of Table 5A

J.D. Hwang / Eurasian Business Review, 3(2), 2013, 137-163
158
Table 9C. Effects on industry-adjusted operating performance: Non-Luxemburg sample
N
Pre-issue average
Year relative to DR issue Adj. R
2
2(17)
[p-value] +1 +2 +3
ROA 107 0.05 -0.02
a -0.02
a -0.03
a 0.78 183.9
(-5.59) (-7.17) (-7.56) [0.00]
ROE 107 0.06 -0.02
a -0.03 -0.04
a 0.63 127.1
(-3.34) (-4.54) (-5.04) [0.00]
OCF/TA 106 0.05 -0.01 -0.02
a -0.02
a 0.64 130.3
(-1.04) (-3.16) (-3.24) [0.00]
NI/Sales 107 0.07 -0.01 -0.01 -0.03
b 0.60 118,6
(-1.17) (-1.20) (-2.43) [0.00]
EBITDA/Sales 104 0.12 -0.02
b -0.01 -0.01 0.82 201.0
(-2.28) (-1.01) (-0.65) [0.00]
Sales/TA 107 0.09 -0.10
a -0.06
b -0.06
c 0.76 174.8
(-3.32) (-2.12) (-1.96) [0.00]
Note: Confer note of Table 5A
Table 10A. Effects on matched-firm-adjusted operating performance:
Whole sample
N
Pre-issue average
Year relative to DR issue Adj. R
2
2(50)
[p-value] +1 +2 +3
ROA 291
0.04 -0.03a -0.03
a -0.04
a 0.48 238.7
(-4.67) (-3.22) (-4.79) [0.00]
ROE 291 0.09 -0.08
a -0.07
a -0.10
a 0.24 128.5
(-4.02) (-4.91) (-5.50) [0.00]
OCF/TA 290 0.04 -0.03
a -0.03
a -0.02
b 0.38 190.0
(-3.05) (-3.46) (-1.97) [0.00]
NI/Sales 290 0.17 -0.12
b -0.13
a -0.19
a 0.10 79.0
(-2.06) (-2.66) (-3.55) [0.02]
EBITDA/Sales 275 0.09 -0.05
a -0.08
a -0.09
a 0.20 112.5
(-3.06) (-4.21) (-4.59) [0.00]
Sales/TA 296 -0.06 -0.06
a -0.07
a 0.01 0.68 394.8
(-9.91) (-8.30) (1.11) [0.00]
Note: Confer note of Table 5A

J.D. Hwang / Eurasian Business Review, 3(2), 2013, 137-163
159
Table 10B. Effects on match-firm-adjusted operating performance: Luxemburg sample
N
Pre-issue average
Year relative to DR issue Adj. R
2
2(36)
[p-value] +1 +2 +3
ROA 190 0.02 -0.03
a -0.01 -0.02
b 0.38 126.5
(-3.66) (-1.14) (-2.07) [0.00]
ROE 190 0.05 -0.06
a -0.04
a -0.06 0.34 114.9
(-5.53) (-2.69) (-3.71) [0.00]
OCF/TA 190 0.01 -0.03
b -0.02 -0.01 0.30 102.5
(-2.57) (-1.63) (-0.14) [0.00]
NI/Sales 190 0.16 -0.17
b -0.18
a -0.22
a 0.02 39.7
(-2.25) (-2.60) (-3.00) [0.20]
EBITDA/Sales 179 0.07 -0.09
a -0.08
a -0.09
a 0.11 54.9
(-3.31) (-2.88) (-3.20) [0.01]
Sales/TA 195 0.03 -0.07
a -0.09
a -0.02 0.78 334.8
(-2.98) (-3.31) (-0.77) [0.00]
Note: Confer note of Table 5A. The effect of DR issue on NI/Sales is estimated by panel regression model with no effects as the null hypothesis that the issuer-specific fixed-effects are redundant cannot be rejected.
Table 10C. Effects on match-firm-adjusted operating performance:
Non-Luxemburg sample
N
Pre-issue average
Year relative to DR issue Adj.R
2
2(16)
[p-value] +1 +2 +3
ROA 101 0.09 -0.03
c -0.05
a -0.08
a 0.61 110.0
(-1.98) (-4.03) (-7.89) [0.00]
ROE 101 0.18 -0.10
c -0.13
b -0.17
a 0.12 30.3
(-1.69) (-2.21) (-2.74) [0.02]
OCF/TA 100 0.08 -0.04
a -0.06
a -0.06
a 0.48 81.8
(-3.41) (-5.95) (-4.14) [0.00]
NI/Sales 100 0.21 -0.03 -0.08
a -0.18
a 0.45 75.7
(-1.39) (-3.36) (-9.10) [0.00]
EBITDA/Sales 96 0.14 0.01 -0.07
b -0.08
a 0.56 54.0
(0.21) (-2.22) (-2.81) [0.00]
Sales/TA 101 -0.22 -0.04 -0.04 0.06 0.43 78.4
(-0.99) (-1.01) (1.07) [0.00]
Note: Confer note of Table 5A

J.D. Hwang / Eurasian Business Review, 3(2), 2013, 137-163
160
5. Conclusion We investigate if there are valuation and operating performance gains from international cross listing, using a sample of 55 Taiwanese firms that issued deposit receipts for the first time in the US, the UK and Luxemburg from 1992 to 2009. We find strong evidence of negative valuation effects. DR issuance is associated with a substantial decline in Tobin’s q and stock
returns during the three years after issue. We also find that operating performance of DR issuers deteriorate and under-perform their benchmarks substantially after issue. Our findings suggest that firms might time their issue of depositary receipts strategically during period of strong stock price and operating performance. The issuance of DR might be a useful signal of the issuers’ value and operating performance thereafter. Further research in this area is warranted.
Taiwan has been an emerging market not very accessible for foreign investors for the best part of our sample period. Cetorelli and Peristiani (2010) find that the US and the UK stock markets are far more prestigious than the Taiwan market. Based on the market segmentation hypothesis, the disadvantaged market hypothesis and the recognition hypothesis of international cross listing, DR issuers from Taiwan should be in a better position to reap valuation gains and other benefits by listing their shares in these markets. Contrary to the predictions of these hypotheses, we find that both the valuation and operating performance of Taiwan’s DR issuers deteriorate and under-perform their benchmarks substantially after issue.
Our findings suggest that the potential benefits of international cross listing might not be as significant as previously thought. Our results are of practical relevance and importance and contribute to the current debate on the costs and benefits of international cross listing.
This article examines the effects of international cross listing during the three years after listing. It is of interest to investigate the effects in the period longer than 3 years after DR listing. As many corporate events might happen in such a long period, the effects of these events have to be separated from that of DR listing and we leave this investigation for future research. References
Alexander, G., Eun, C., and Janakiramanan, S., 1987. Asset pricing and
dual listing on foreign capital markets: A note. Journal of Finance,
42(1), pp.151-158. Alexander, G., Eun, C., and Janakiramanan, S., 1988. International listings
and stock returns: Some empirical evidence. Journal of Financial and Quantitative Analysis, 23(2), pp.135-151.

J.D. Hwang / Eurasian Business Review, 3(2), 2013, 137-163
161
Bae, G., Jeong, J., Sun, H., and Tang, A.P., 2002. Stock returns and operating performance of securities issuers. Journal of Financial Research, 25(3), pp. 337-352.
Baker, H.K., Nofsinger, J.R., and Weaver, D.G., 2002. International cross-listing and visibility. Journal of Financial and Quantitative Analysis, 37(3), pp.495–521.
Bancel, F. and Mittoo, U., 2001. European managerial perceptions of the net benefits of foreign stock listings. European Financial Management Journal, 7(2), pp.213-236.
Barzuza, M., 2009. Lemon signaling in cross-listings. University of Virginia School of Law Working, The John M. Olin Program in Law and Economics Working Paper, 40.
Benos, E. and Weisbach, M.S., 2004. Private benefits and cross-listings in the United States. Emerging Markets Review, 5(2), pp.217–240.
Bris, A., Cantale, S., Hrnjic, E., and Nishiotis, G., 2012. The value of information in cross-listing. Journal of Corporate Finance, 18(2),
pp.207-220. Cetorelli, N. and Peristiani, S., 2010. Firm value and cross-listings: The
impact of stock market prestige. Federal Reserve Bank of New York Staff Reports, 474.
Charitou, A. and Louca, C., 2009. Cross-listing and operating performance: Evidence from exchange-listed American Depositary Receipts. Journal of Business Finance and Accounting, 36(1-2), pp.99-129.
Coffee, J., 2002. Racing over the top? The impact of cross-listing and stock market competition on international corporate governance. Columbia Law Review, 102(7), pp.1757-1831.
Dharan, B. and Ikenberry, D., 1995. The long-run negative drift of post-listing stock returns. Journal of Finance, 50(5), pp.1547-1574.
Dodd, O. and Louca, C., 2011. Shareholders’ wealth effects of international cross-listings. Auckland University of Technology Working Paper.
Doidge, C., Karolyi, G.A., and Stulz, R., 2004. Why are foreign firms that are listed in the U.S. worth more? Journal of Financial Economics, 71(2), pp. 205-238.
Domowitz, I., Glen, J., and Madhavan, A., 1998. International cross-listing and order flow migration: Evidence from an emerging market. Journal of Finance, 53(6), pp.2001–2027.
Eckbo, E, Masulis R.W., and Norli, O., 2000. Seasoned public offerings: Resolution of the ‘new issues puzzle’. Journal of Financial Economics,
56(2), pp.251-291. Errunza, V. and Losq, E., 1985. International asset pricing under mild
segmentation: Theory and test. Journal of Finance, 40(1), pp.105-124.
Errunza, V. and Miller, D., 2000. Market segmentation and the cost of capital in international equity markets. Journal of Financial and Quantitative Analysis, 35(4), pp.577–600.
Fama, E. and French, K., 1995. Size and book-to-market factors in earning and returns. Journal of Finance, 50(1), pp.131-155.

J.D. Hwang / Eurasian Business Review, 3(2), 2013, 137-163
162
Fanto, J. and Karmel, R., 1997. A report on the attitudes of foreign companies regarding a U.S. listing. Stanford Journal of Law, Business and Finance, 51(3), pp.143-162.
Fernandes, N. and Ferreira, M.A., 2008. Does international cross-listing improve the information environment? Journal of Financial Economics, 88(2), pp.216-244.
Flavin, T.J. and O’Connor, T.G., 2010. The sequencing of stock market liberalization events and corporate financing decisions. Emerging Markets Review, 11(3), pp.183-204.
Foerster, S. and Karolyi, G.A., 1998. Multi-market trading and liquidity: A transaction data analysis of Canada–U.S. inter listings. Journal of International Financial Markets, Institutions, and Money, 8(2), pp.393-412.
Foerster, S. and Karolyi, G.A., 1999. The effects of market segmentation and investor recognition on asset prices: Evidence from foreign stocks listing in the United States. Journal of Finance, 54(3), pp.981-1013.
Foerster, S. and Karolyi, G.A., 2000. The long-run performance of global equity offerings. Journal of Financial and Quantitative Analysis, 35(4),
pp.499-528. Fuerst, O., 1998. A theoretical analysis of the investor protection
regulations argument for global listing of stocks. [online] Available at: <http://papers.ssrn.com/sol3/papers.cfm?abstract_id=139599> [Accessed 01 September 2013].
Goto, S., Watanabe, M., and Xu, Y., 2009. Strategic disclosure and stock returns: Theory and evidence from U.S. cross-listing. Review of Financial Studies, 22(4), pp.1585-1620.
Gozzi, J.C., Levine, R., and Schmuckler, S., 2008. Internationalization and the evolution of corporate valuation. Journal of Financial Economics,
88(3), pp.607-632. Huddart, S., Hughes, J., and Brunnermeier, M., 1999. Disclosure
requirements and stock exchange listing choice in an international context. Journal of Accounting, and Economics, 26(1-3), pp.237-269.
Karolyi, G.A., 1998. Why do companies list shares abroad? A survey of the evidence and its managerial implications. Financial Markets, Institutions and Instruments, 7(1), pp.1-60.
Khurana, I.K., Martin, X., and Periera, R., 2008. Cross-listing and firm growth. Review of Finance, 12(2), pp.293-322.
Khurshed, A., Paleari, S., and Vismara, S., 2003. The operating performance of initial public offerings: The UK experience. University of Manchester Working Paper.
King, M.R. and Segal, D., 2009. The long-term effects of cross-listing, investor recognition, and ownership structure on valuation. Review of Financial Studies, 22(6), pp.2393−2421.
Lee, D., 2003. Why does shareholder wealth increase when non-U.S. firms announce their listing in the U.S.? University of Kentucky Working Paper.
J.D. Hwang / Eurasian Business Review, 3(2), 2013, 137-163
163
Lins, K., Strickland, D., and Zenner, M., 2005. Do non-U.S. firms issue equity on U.S. exchanges to relax capital constraints? Journal of Financial and Quantitative Analysis, 40(1), pp.109-133.
Loughran, T. and Ritter, J., 1995. The new issues puzzle. Journal of Finance, 50(1), pp.23-51.
Loughran, T. and Ritter, J., 1997. The operating performance of firms conducting seasoned equity offerings. Journal of Finance, 52(5),
pp.1823–1850. McLaughlin, R., Safieddine, A., and Vasudevan, G., 1998. The information
content of corporate offerings of seasoned securities: An empirical analysis. Financial Management, 27(2), pp.31-45.
Merton, R., 1987. Presidential address: A simple model of capital market equilibrium with incomplete information. Journal of Finance, 42(3), pp.
483–510. Moel, A., 1999. The role of information disclosure on stock market listing
decisions: The case of foreign firms listing in the U.S. Harvard Business School Working Paper.
Myers, S. and Majluf, N., 1984. Corporate financing and investment decisions when firms have information that investors do not have. Journal of Financial Economics, 13(2), pp.187-221.
Pagano, M., Panetta, A., and Zingales, L., 1998. Why do companies go public? An empirical analysis. Journal of Finance, 53(1), pp.27-64.
Reese, W. and Weisbach, M., 2002. Protection of minority shareholder interests, cross-listings in the United States, and subsequent equity offerings. Journal of Financial Economics, 66(1), pp.65-104.
Sarkissian, S. and Schill, M.H., 2009. Are there permanent valuation gains to overseas listing? Review of Financial Studies, 22(1), pp.371-412.
Sarkissian, S. and Schill, M.H., 2012. The nature of the foreign listing premium: A cross-country examination. Journal of Banking & Finance, 36(9), pp.2494-2511.
Werner, I. and Kleidon, A., 1996. U.S. and U.K. trading of British cross-listed stocks: An intraday analysis of market integration. Review of Financial Studies, 9(2), pp.619-64.

Reproduced with permission of the copyright owner. Further reproduction prohibited withoutpermission.