validation of the time-space corner and crosswalk analysis...
TRANSCRIPT

TRANSPORTATION RESEARCH RECORD 1168 39
Validation of the Time-Space Corner and Crosswalk Analysis Method
JOHN J. FRUIN, BRIANT. KETCHAM, AND PETER HECHT
Time-space analysis is a new method for evaluating pedestrian activity spaces. This technique has been used In the Highway Capacity Manual to determine pedestrian levels of service in corners and crosswalks. Although the new method follows established pedestrian traffic relationships, it had not been validated as a measure of actual street conditions. Evaluation of the pedestrian traffic impacts through the use of the Highway Capacity Manual is a part of New York City's environmental review process for new developments, motivating the City Planning Commission, with U.S. Department of Transportation support, to sponsor a time-lapse photography study to validate the Highway Capacity Manual pedestrian analysis method. Based on the analysis of time-lapse photography of pedestrian traffic activity at four Manhattan central business district intersections, the Highway Capacity Manual time-space analysis model was found to be a valid procedure for determining pedestrian levels of service in corners and crosswalks. However, the photographic observations of pedestrian activity, combined with a computer sensitivity analysis of Highway Capacity Manual model input parameters, indicated the following changes would improve the accuracy of the method: (a) standing area in corners for those waiting to cross increased from the Highway Capacity Manual value of S sq ft/person to 7 sq ft/person; (b) occupancy time in corners for those moving through the corner changed from a uniform 4 sec to a value determined by a linear regression equation based on sidewalk width; (c) start-up time or delay of 3 sec for pedestrians to begin crossing in the Highway Capacity Manual model eliminated to simplify the analysis model; and (d) walking speeds of pedestrians in crosswalks reduced from 4.5 ft/sec to 3.3 ft/sec as more representative of observed crosswalk platoon flow. An additional observation of the study was that although pedestrian levels of service show relatively little degradation because of turning vehicles, heavy pedestrian traffic noticeably reduced intersection capacity, potentially warranting turn restrictions where there are high crossing-volumes to increase intersection capacity, with secondary benefits of improved pedestrian safety and convenience.
A new method for analyzing pedestrian activity spaces (timespace corner and crosswalk analysis method) was introduced at the annual Transportation Research Board Meeting in January of 1984 (J). After technical review the analysis procedure was incorporated in the Highway Capacity Manual (HCM) (2). Although the new method followed established pedestrian traffic relationships, it had not been validated as a measure of actual street conditions.
J. J. Fruin, 7 Anchor Drive, Massapequa, N. Y. 11758. B. T. Ketcham, Konheim & Ketcham, Inc., 175 Pacific Street, Brooklyn, N. Y. 11201. P. Hecht, Project for Public Sapces, 153 Waverly Place, New York, N.Y. 10014.
New York City's environmental impact analysis process requires the evaluation of both the pedestrian and vehicle impacts of new developments that are based on HCM procedures. Because of the need to ensure the validity of the new HCM method for the formal impact analysis process, the Planning Commission of the City of New York, with the financial support of the Urban Mass Transportation Administration, U.S. Department of Transportation, sponsored the study described in this paper (3).
Corners and crosswalks are important because pedestrian activity is concentrated at these locations, and they provide the only valid measure of pedestrian network convenience. Experience has repeatedly shown that although two intersecting sidewalks may be operating at high rnidblock levels of service (LOS), the corners and crosswalks may be saturated and inadequate. Additionally, in crosswalks pedestrians must compete with turning vehicles for the available green signal cycle time.
STUDY OBJECTIVES AND METHODOLOGY
The purpose of the study was to test, evaluate, validate, and modify if indicated, the 1985 HCM procedure for measuring and analyzing pedestrian movement and LOS in comers and crosswalks for New York City conditions. The primary study method used was time-lapse photography of actual pedestrian traffic activity on street corners and crosswalks for four busy Manhattan intersections and the comparison of these measurements with the HCM procedure for determining LOS for the same pedestrian traffic volumes, intersection configurations, and signal timing.
Major elements of the study included
• Computer sensitivity analysis of HCM procedure input parameters to establish their relative significance in determining corner and crosswalk LOS;
• Surveys to identify sites that would provide a range of pedestrian activity and suitable photographic conditions;
• Time-lapse photography and traffic counting of the four intersections;
• Data takeoff from the time-lapse films and data summary and analysis; and
• Comparison of results with HCM method and recommendations for changes to improve accuracy.
In addition, interview surveys were conducted at two sites to determine if pedestrian perceptions of crowding and convenience were consistent with LOS measures.
40
CORNER AND CROSSWALK ANALYSIS PROBLEM
Street corners are difficult to analyze because of
• The convergence of intersecting flows from adjoining sidewalks and crosswalks;
• Multiple changes in pedestrian movement directions within the corner;
• Pulsating volumes of pedestrians moving through the corner in sequence with changing signals;
• Buildup of queues of waiting pedestrians on opposite sides of the corner frontage alternating with the signal cycle; and
• Unusable space in the comer because of signal posts or other permanent or transient obstructions.
Because of these factors, corners bear little resemblance to the typical corridor where ftow is relatively uniform, primarily bidirectional, and controlled by abutting walls. Thus, LOS traffic-flow analysis techniques developed for corridors cannot be directly applied to corners. However, the freedom of movement of pedestrians is related to the average available space per person, and therefore the personal area criteria used in LOS standards remain as a valid measure of levels of pedestrian convenience.
The crosswalk more closely resembles a corridor in terms of the uniformity and directionality of pedestrian movement. However, unlike a corridor, there are no walls to contain pedestrians, and they may move outside of the marked crosswalk if it is perceived to be too crowded. Additionally, pedestrians in crosswalks must compete with turning vehicles, and conventional corridor analysis cannot account for vehicle effects on pedestrian movement.
Two stages of movement occur in crosswalks during the normal green cycle. The first is the initial surge or maximum occupancy of the crosswalk that occurs in the period shortly after the green signal releases the "red platoons" (2), or
SIDEWALK@
SIDEWALK@ ·~-- w~
h~//. - - -V I a,b I
w
••• • • • • • • • • • • • • • • • • I
.J
MINOR STREET ~o 'ti CROSSWALK
©
TRANSPORTATION RESEARCH RECORD 1168
pedestrians accumulated during the red interval, and the second, the average flow during the total green interval time. The surge condition determines the ability of the crosswalk to contain crosswalk volumes within the striped area, the average flow during the cycle, and the ability of the crosswalk to also accommodate turning vehicles.
HCM METHOD
The time-space (TS) method for analyzing corners and crosswalks compares the supply of space available to pedestrians during an analysis interval (the total signal time) with the demand for space by pedestrians using the comer or crosswalk during the interval. For corners the supply of available TS is the product of the usable area of the corner in square feet and the total length of the signal cycle in seconds. For crosswalks, the supply of available TS is the product of the area of the orosswolk in squorc foot ond the length of the green intcrvol available for pedestrians to cross the street.
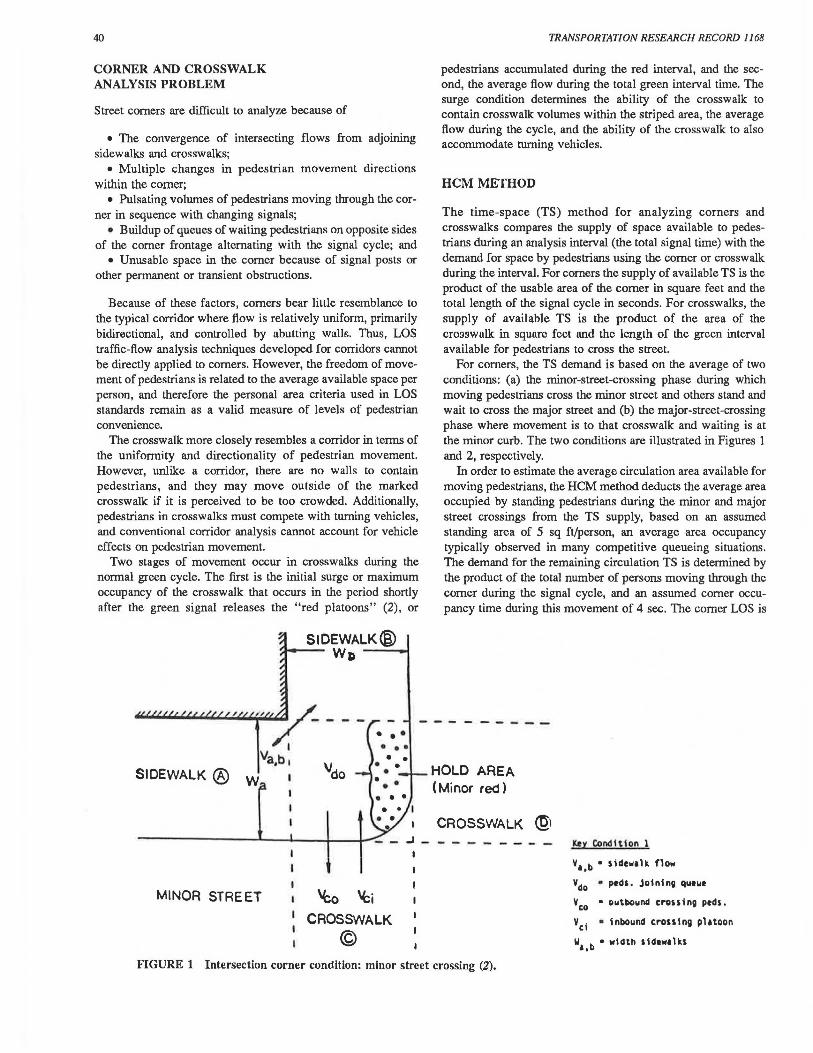
For corners, the TS demand is based on the average of two conditions: (a) the minor-street-crossing phase during which moving pedestrians cross the minor street and others stand and wait to cross the major street and (b) the major-street-crossing phase where movement is to that crosswalk and waiting is at the minor curb. The two conditions are illustrated in Figures 1 and 2, respectively.
In order to estimate the average circulation area available for moving pedestrians, the HCM method deducts the average area occupied by standing pedestrians during the minor and major street crossings from the TS supply, based on an assumed standing area of 5 sq ft/person, an average area occupancy typically observed in many competitive queueing situations. The demand for the remaining circulation TS is determined by the product of the total number of persons moving through the corner during the signal cycle, and an assumed corner occupancy time during this movement of 4 sec. The comer LOS is
---------HOLD AREA (Minor red)
CROSSWALK ~)
-------- Key Condition l
v.,b • sidew1lk flow
vdo • peds. Jo1n1ng queue
Vco • outbound crossing peds.
v,i • inbound crossing pl1toon
W1,b • width sidew1lks
FIGURE 1 Intersection corner condition: minor street crossing (2).

Fruin et al.
SIDEWALK@
~SIDEWALK A
w
(Major Red)
MINOR STREET CROSSWALK
©
MAJOR STREET
CROSSING PLATOON
CROSSWALK@
Ux Condit Ion 2
V1 ,b • i1d...,•lk flow
Vco • ped1. Joining queue
Vdo • outbound crou Ing ptds.
v111 • lnbovnd crouing phtoon
W1 ,b • •ldth ildt•AlkS
41
FIGURE 2 Intersection comer condition: major street crossing (2).
determined by dividing the circulation demand in pedestrian seconds into the remaining circulation TS in square feet seconds to obtain the average area occupancy in square feet per pedestrian during the cycle. This average pedestrian area is compared with LOS area standards to determine the comer LOS.
Both the assumption of a standing area of 5 sq ft/person, and a moving occupancy time of 4 sec were considered to be reasonable estimates of these parameters but had not been validated by observations of actual comers. The 4-sec occupancy time was considered to be conservative because many pedestrians short cut corner edges, occupying the corner for only a few seconds.
For crosswalks, the HCM method examines two conditions: the initial surge when pedestrians waiting during the red interval cross as a platoon, a:nd the average flow during the green interval. For the surge, a "start-up" delay of 3 sec is assumed during which others arrive at the crosswalk, and a crossing speed of 4.5 ft/sec is assumed for the leader of each of the red platoons to reach the opposite curb. The maximum occupancy of the crosswalk is the total number of persons waiting during the red interval time plus the start-up time, plus those entering the crosswalk during the time taken for the red platoon leaders to reach the opposite curbs. The maximum number of pedestrians occupying the crosswalk in the surge is divided into the area of the crosswalk to determine the average area per pedestrian and the surge LOS.
The average square feet of circulation area per pedestrian and LOS during the green interval is determined by dividing the product of the total crossing volume during the interval and average pedestrian crossing time (based on 4.5 ft/sec walking speed) into the crosswalk TS supply in area seconds.
Because turning vehicles can be expressed in time-space units, the HCM method provides a means of estimating the effect of turning vehicles on crosswalk pedestrian LOS, and of potentially greater importance, the possible limits on turning
movements where there are heavy pedestrian crossing volumes. At such crossings, "spill-back" due to vehicle tum delays can reduce intersection capacity and throughput.
HCM ASSUMPTIONS TO BE VALIDATED
In addition to the primary task of determining if the HCM TS method provides a valid model for predicting comer and crosswalk pedestrian densities and LOS, the following parameters assumed in the HCM analysis procedure were measured for comparison purposes:
• Average standing area for waiting pedestrians; • Average occupancy time of pedestrians moving through
the comer; • Pedestrian speeds in crossing platoons; • Platoon start-up times; and • Turning vehicle time related to pedestrian crossing vol
umes, for a limited sample.
COMPUTER SENSITIVITY ANALYSIS
A computer program was developed, based on the LOTUS 1-2-3 spreadsheet for the IBM-PC, of the HCM comer and crosswalk analysis procedure for processing data collected in the study and comparing it with HCM assumptions. The program provided a means of determining the relative sensitivity of changes in each of the HCM model input parameters used to estimate pedestrian LOS. By varying the input parameters over an expected range of values, the sensitivity analysis indicated the following:
• Waiting area per pedestrian: Limited sensitivity for low and moderate volumes, but would affect predicted comer LOS for high volumes;
• Average corner circulation time: Significant nonlinear impact for changes from the HCM value of 4 sec, important factor in predicting accurate comer LOS;

42
• Platoon start-up time: Relatively insensitive to change and predicting crosswalk LOS;
• Crossing speed: Significant impact in predicting crosswalk LOS based on variations from the HCM asswnption of 4.5 ft/sec; and
• Vehicle turning time: Turning time and vehicle volwne shown as relatively insensitive in affecting the predicted crosswalk LOS for average crosswalk conditions (did not consider possible vehicle delay or high pedestrian volwnes).
STUDY SITES AND PROCEDURES
Four Manhattan intersections were selected for study: (a) 5th Avenue and 34th Street, (b) 5th Avenue and 49th Street, (c) Broadway and Maiden Lane, and (d) 8th Avenue and 40th Street. Each of the sites was selected on the basis of providing a full range of pedestrian activity, as well as having differing intersection and corner geometry. A significant study constraint was the finding of cooperative building owners who would allow the positioning of time-lapse cameras at the approximate six-story height required for the camera field of view of the intersection. Some owners required extensive liability coverage that precluded use of their buildings.
Three time-lapse cameras set at a frame interval of 1/z sec were used to obtain a full view of the corner and intersecting crosswalks. At the initial pilot study site the New York City Traffic Department installed a special light on top of the signal head to indicate signal changes in the camera field of view, but at subsequent sites it was necessary to accomplish this with hand signals that would appear on the film. The geometrics of each corner and crosswalk were measured and signal splits timed.
Complete pedestrian counts on a cycle-by-cycle basis were made of all pedestrians moving through the corner via the two crosswalks and adjoining sidewalks. Spot speed studies of persons moving through the corner and crossing the street were also made for later comparison with film data take-off values. A limited sample of vehicle turning times was also collected.
Data takeoff from time-lapse films was accomplished by using an analyst projector with a single-frame stop action capability and frame-counting feature, which helped to locate specific signal cycle sequences on the film roll. The selection of signal cycles for analysis was based on reference to the field count volumes for that cycle and previewing of the film to ensure that no unusual conditions occurred, for example, the temporary blocking of the crossing by a parked truck.
Standing areas for pedestrians waiting to cross at corners were determined by drawing an "envelope" around standing groups, measuring the area within the envelope using a grid designed to correct for parallax, and dividing the area by the nwnber of standees. Circulation times for persons moving through corners to join queues, cross the street, or reach the intersecting sidewalk were determined by sampling typical pathways and counting the nwnber of photo frames at 1/z sec each to move between corner boundaries. Street crossing times and speeds and platoon start-up times were also obtained by similar frame-counting procedures.
STUDY RESULTS
The results of the film data takeoff for the HCM model input parameters indicated the following:
TRANSPORTATION RESEARCH RECORD 1168
• Standing area for pedestrians waiting to cross was found to vary from 5.1 to 12.3 sq ft/person, with a median of 7.6, as compared with the HCM assumption of 5 sq ft;
• Corner occupancy time, or the time moving through the corner, was found to be dependent on corner dimensions and was not equal to the HCM constant of 4 sec except for corners with narrower intersecting sidewalks;
• Platoon start-up times were found to vary from 0 to 8.5 se.c, with a me.dian of 2.5 Sl'.C, r.omparr.cl with thr. HC.M constant. of 3 sec;
• Crossing speeds were found to vary from 2.1 to 5.5 ft/sec, with a mean of 3.4 and a median of 3.3 ft/sec, as compared with the HCM speed of 4.5 ft/sec;
• Vehicle turning times for a limited sample varied from 2 to 30 sec compared with the HCM value of 5 sec, indicative that heavy pedestrian volwnes could limit the number of turns in a signal cycle, and reduce intersection capacity.
TYPICAL PATTERNS OF CORNER AND CROSSWALK USE
Typical patterns of corner activity are shown in Figure 3. Red queues alternately build up during the signal cycle and are subsequently released at the green, as others enter the corner crossing from the other side of the street. The total traffic volume passing through this 189-sq-ft corner during the cycle shown was 196 persons. Five distinct peaks of 24 to 27 persons using the corner at various points during the cycle are shown, as well as a minimum occupancy of only 5 persons. This indicates that although corner conditions were generally LOS E, they were as high as LOS C for one brief interval. Predicted LOS for the corner based on the HCM method was LOSE.
From Figure 4, illustrating crosswalk activity patterns, it can be seen that the crosswalk only experiences one peak, compared with the multiple peaks for the corner, occurring as the two platoons released from opposite curbs merge. A total of 131 pedestrians crossed during the cycle illustrated, and the maximum observed occupancy of the 996.8-sq-ft crosswalk was 75 persons at 13.3 sq ft/person, LOS E. The surge predicted by the HCM model was 62 persons occupancy at 17.6 sq ft/person, LOS D. Average observed crosswalk occupancy during the cycle was 37 .6 pedestrians or 25.6 sq ft/person, LOS C, and as predicted by the HCM model 38.4 sq ft, also LOS C.
RECOMMENDED CHANGES TO HCM METHOD
Based on study results the following changes were recommended to the HCM method to more accurately predict corner and crosswalk LOS for observed New York City traffic conditions:
• Standing area: Constant of 7 sq ft/person, based on observations combined with computer sensitivity results indicating a value more critical for high volwnes when pedestrians would tend to stand closer together (this is the borderline between queueing LOS C and D );
• Corner circulation time: From a constant of 4 sec to the following formula based on corner dimensions:
To = 0.12 (Wa + Wb) + 1.4

30
28
26
24 It: w
22 z It: 0 20 u :J
18 It: :r ._
16 Cl z > 14 0 ~ 12 VI z 10 0 VI It: 8 w 0..
6
4
2
0
0 10 20
MINOR RED
TOT AL CORNER USE
,,.. ACTUAL CO NER OCCUPANC MOVING &
\OFF-CURB WAITING
70 80
MAJOR RED MINOR GREEN
FIGURE 3 Pedestrian corner dynamics.
70 '.ll: .J <I: ~
60 VI
~TOTAL OCCUPANCY
VI 0 It: u It: 50 0 z :J
~ 40
Cl z > 30 0 :J
VI z 0 20 VI It: w Cl. I 0.. ::>
10 ... I
~ I ... I
0 (/) I
3 15 27 39 I 14:------- MAJOR GREEN INTERVAL (SEC) --------~~
FIGURE 4 Pedestrian crosswalk dynamics.
90
51
44
where To is circulation time (sec) and Wa and Wb are intersecting sidewalk (widths in ft).
• Platoon start-up time: Eliminated because of minimal effect noted from sensitivity analysis and to simplify equations;
• Crossing speeds: Changed to 3.3 ft/sec from 4.5 ft/sec to agree with observed platoon flow, rather than free-flow pedestrian walk speeds; and
• Vehicle turning times: No recommendation, pending further studies relating turning times to pedestrian crossing volumes and intersection throughput.
EVALUATION OF CHANGES
Comparisons were made with the pedestrian traffic conditions observed in time-lapse film and the HCM method modified by the changes recommended in this study. In order to ensure compatibility of the observed data with the HCM method, it was necessary to adjust observed comer and crosswalk values for nonconforming pedestrian behavior, lhose persons waiting off the curb, bypassing the corner by moving through adjoining crosswalks, and those walking outside marked crosswalk lines.
Criteria for a good predictive model are that the average pedestrian LOS be equal to, or slightly lower than, that observed in photographs because an LOS lower than the average will be experienced one or more times during the typical signal cycle and the standard for design and evaluation should be one that tends to provide more convenience for pedestrians, rather than less. LOS area standards are originally based on corridor flow, but the movement in corners and crosswalks is more complex.
The modified HCM model, using the changes recommended in this study, predicted the same comer LOS (or per person area) as observed in photographs for 11 out of 24 cycles examined, a lower LOS in 7 cycles, and a higher one in 4 cycles. The modified crosswalk analysis model for 22 cycles predicted the observed average LOS for 11 cases and a lower LOS for 11 cases, and for the surge, the observed LOS for 22 out of 31 cycles, a lower LOS for 8, and higher for 1. In general the modified HCM model was shown to be a good predictor of observed average comer and crosswalk conditions, based on the street-crossing count data typically collected in traffic engineering studies, and more accurate than the HCM model for observed New York City conditions.
TRANSPORTATION RESEARCH RECORD 1168
BEHAVIORAL STUDIES
The interview surveys conducted at two sites, although not providing conclusive data on the possible readjustment of LOS convenience criteria for corners and crosswalks, did show significant differences in male and female perceptions of crowding and a measurable difference in the perceptions of two different intersections established as operating at different LOS. The study results indicated that more controlled studies could potentially establish a more definitive behavioral base for LOS standards.
RECOMMENDATIONS FOR FURTHER RESEARCH
As a result of this study the following areas are recommended for further research:
• Replication of the study in smaller and medium-sized cities for comparison with New York City's high-density traffic conditions;
• Possible reevaluation of pedestrian density LOS standards, originally developed for pedestrian flow in corridors, for applicability to corners and crosswalks; and
• Study of the effects of pedestrian crossing flow on vehicle turning movements and intersection capacity, for the purpose of determining pedestrian and turning volume thresholds that would warrant turning restrictions to increase intersection capacity and additionally improve pedestrian convenience and safety.
REFERENCES
1. J. Fruin and G. Benz. Pedestrian Time-Space Concept for Analyzing Comers and Crosswalks. In Transportation Research Record 959, 1RB, National Research Council, Washington, D.C., 1984, pp. 18-24.
2. Special Report 209: Highway Capacity Manual. 1RB, National Research Council, Washington, D.C., 1985.
3. Improving How a Street Works for All Users-Pedestrian Movement Analysis. New York City Department of Planning, Dec. 1986.
Publication of this paper sponsored by Committee on Pedestrians.