validation of procedures for welding inspection using ... of procedures for welding inspection using...
TRANSCRIPT

Validation of Procedures for Welding Inspection Using Computed
Radiography
Davi F. OLIVEIRA1,2
, Joseilson R. NASCIMENTO2, Alessandra S. MACHADO
2, Carla A.
MARINHO3, Marcos AIUB
4, João M. HOHEMBERGER
4, Eduardo IGUCHI
4, Ricardo T.
LOPES2
1Physics Institute, State University of Rio de Janeiro. E-mail: [email protected]
2 Nuclear Instrumentation Laboratory, Federal University of Rio de Janeiro. E-mail: [email protected],
[email protected], [email protected] 3Leopoldo A. Miguez de Melo Research Center, CENPES/PETROBRAS
4SEQUI/PETROBRAS
Abstract
The introduction of digital radiography replacing conventional film radiography is becoming a reality in the
inspection of materials and equipment. For this to happen in the oil and natural gas industry with quality, it is
necessary to qualify and validate "Radiographic Inspection Procedures", in particular for welding. This work is
part of a project that aims at producing a comparative study between the techniques of film and computed
radiography (CR) applied to weld inspection. For this purpose, images using five CR systems available on the
market were obtained with their respective phosphor plates. Radiographic tests were performed with film and
computed radiography for SWSI, DWSI and DWDI techniques. Test samples that consist of plates and steel
pipes of different diameters and thickness were used. Radiographs were taken with X-ray and γ rays sources. The
evaluation criteria for approval of the images were, namely, detectability (in comparison with film radiography)
and the compliance with specific image quality parameters (contrast, basic spatial resolution and signal to noise
ratio normalized). As a result of this study, the equipments that were able to reach positive results for specific
ranges of thickness had their procedures duly validated, and are therefore apt to carry out reliable inspections for
defect detection.
Keywords: Computed Radiography, Inspection Procedure Validation, Weld Inspection.
1. Introduction
In past few years, the use of digital radiography in replacing conventional film
radiography is becoming a reality in the inspection of materials and equipment. Computed
Radiography (CR) is proving itself to be an efficient technique and has been gaining
relevance as a method of inspection which has several advantages over film radiography,
especially for applications in the Oil & Gas industry. However, the test procedures are based
in experimentations of trial and error due to the lack of an established methodology for
choosing the parameters, as is the case with film radiography. Due to such lack of
methodology, it is impossible to ensure that the CR technique is indeed able to detect the
same types of defects as film radiography. In order for that to happen, it is necessary to
validate inspection procedures, especially for welds, so as to establish an equivalence of
detectability when compared to the conventional technique [1].
Computed Radiography equipment are currently being manufactured by several
companies who aim at working with NDTs. Each manufacturer produces its own phosphor
plates, also known as "imaging plates" and "IPs", according to their own specifications.
All systems follow the same working principle, even though certain features may vary
depending on the manufacturer, and that is the reason why it is of utmost importance to assess
all responses with regard to the sensitivity of detection of discontinuities, such as the ones
which are often found on welded joints [2,3].
11th European Conference on Non-Destructive Testing (ECNDT 2014), October 6-10, 2014, Prague, Czech RepublicM
ore
Info
at O
pen
Acc
ess
Dat
abas
e w
ww
.ndt
.net
/?id
=16
711
Thus, the main purpose of this study was to develop and validate procedures using CR
on welding inspections in real field situations by using three radiography techniques and
comparing them with the same techniques applied in film radiography.
2. Materials and methodology
2.1 Radiographic Testing
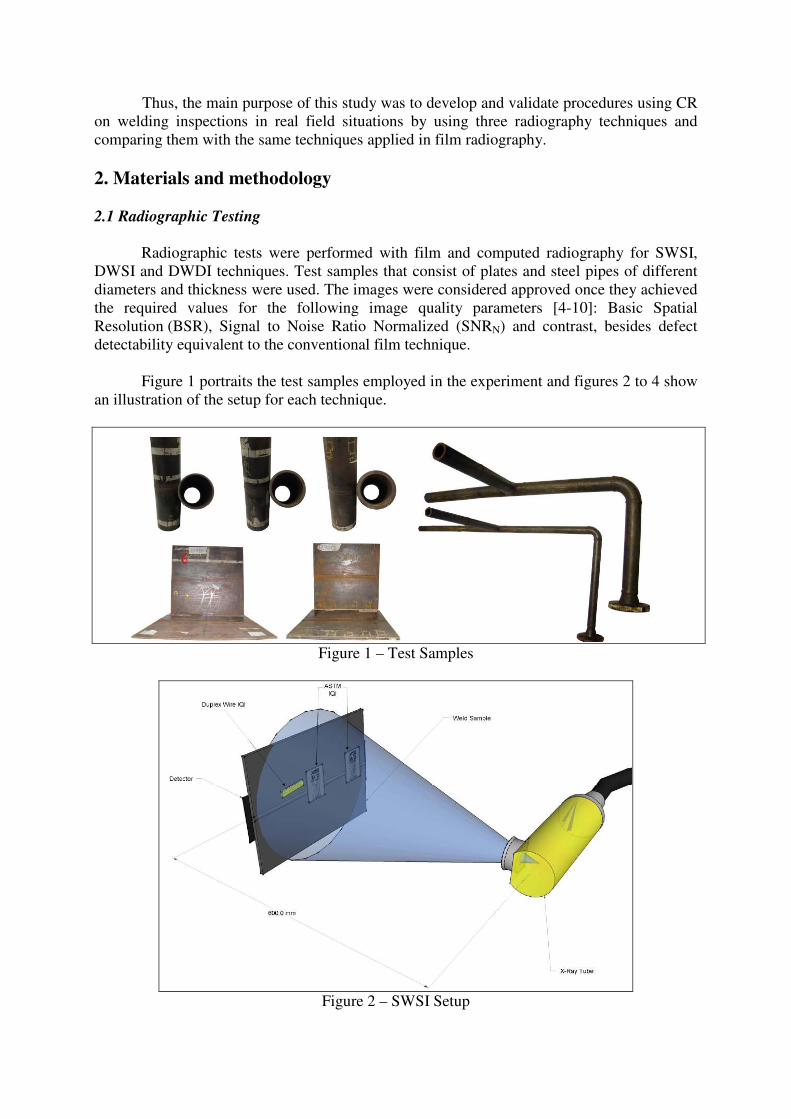
Radiographic tests were performed with film and computed radiography for SWSI,
DWSI and DWDI techniques. Test samples that consist of plates and steel pipes of different
diameters and thickness were used. The images were considered approved once they achieved
the required values for the following image quality parameters [4-10]: Basic Spatial
Resolution (BSR), Signal to Noise Ratio Normalized (SNRN) and contrast, besides defect
detectability equivalent to the conventional film technique.
Figure 1 portraits the test samples employed in the experiment and figures 2 to 4 show
an illustration of the setup for each technique.
Figure 1 – Test Samples
Figure 2 – SWSI Setup

Figure 3 – DWSI Setup
Figure 4 – DWDI Setup
Tables 1 to 3 show the test samples specifications, the exposure values and the image
quality requirements for the three radiographic techniques.
Table 1 – Samples Specifications (SWSI).
X-Rays γγγγ-Rays
Group
Nominal
Thickness
(mm)
Total
Thickness
(mm) High Voltage
(kV) Isotope
Wire IQI
(ISO 19232-1) BSR (µµµµm)
(N 2821-B)
SNRN
(N 2821-B)
I 5.33 6.93 140 12
II 6.35 7.95 150 12
III 7.11 10.31 150 11
IV 9.53 12.73 160 10
V 12.70 15.90 190
Se-75
10
VI 18.26 22.26 225 9
VII 25.40 29.40 270 8
VIII 35.71 40.51 320
Ir-192
7
100
(X-Rays)
160
(γ-Rays)
100
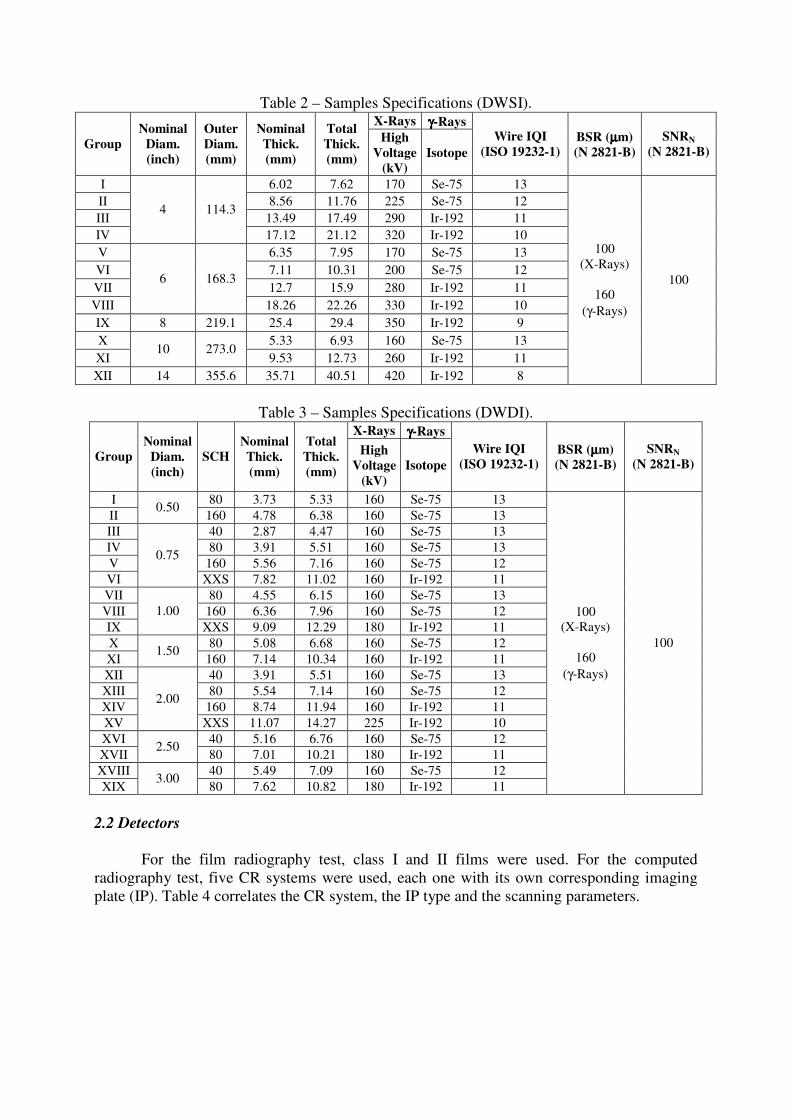
Table 2 – Samples Specifications (DWSI). X-Rays γγγγ-Rays
Group
Nominal
Diam.
(inch)
Outer
Diam.
(mm)
Nominal
Thick.
(mm)
Total
Thick.
(mm)
High
Voltage
(kV)
Isotope
Wire IQI
(ISO 19232-1) BSR (µµµµm)
(N 2821-B)
SNRN
(N 2821-B)
I 6.02 7.62 170 Se-75 13
II 8.56 11.76 225 Se-75 12
III 13.49 17.49 290 Ir-192 11
IV
4 114.3
17.12 21.12 320 Ir-192 10
V 6.35 7.95 170 Se-75 13
VI 7.11 10.31 200 Se-75 12
VII 12.7 15.9 280 Ir-192 11
VIII
6 168.3
18.26 22.26 330 Ir-192 10
IX 8 219.1 25.4 29.4 350 Ir-192 9
X 5.33 6.93 160 Se-75 13
XI 10 273.0
9.53 12.73 260 Ir-192 11
XII 14 355.6 35.71 40.51 420 Ir-192 8
100
(X-Rays)
160
(γ-Rays)
100
Table 3 – Samples Specifications (DWDI). X-Rays γγγγ-Rays
Group
Nominal
Diam.
(inch)
SCH
Nominal
Thick.
(mm)
Total
Thick.
(mm)
High
Voltage
(kV)
Isotope
Wire IQI
(ISO 19232-1) BSR (µµµµm)
(N 2821-B)
SNRN
(N 2821-B)
I 80 3.73 5.33 160 Se-75 13
II 0.50
160 4.78 6.38 160 Se-75 13
III 40 2.87 4.47 160 Se-75 13
IV 80 3.91 5.51 160 Se-75 13
V 160 5.56 7.16 160 Se-75 12
VI
0.75
XXS 7.82 11.02 160 Ir-192 11
VII 80 4.55 6.15 160 Se-75 13
VIII 160 6.36 7.96 160 Se-75 12
IX
1.00
XXS 9.09 12.29 180 Ir-192 11
X 80 5.08 6.68 160 Se-75 12
XI 1.50
160 7.14 10.34 160 Ir-192 11
XII 40 3.91 5.51 160 Se-75 13
XIII 80 5.54 7.14 160 Se-75 12
XIV 160 8.74 11.94 160 Ir-192 11
XV
2.00
XXS 11.07 14.27 225 Ir-192 10
XVI 40 5.16 6.76 160 Se-75 12
XVII 2.50
80 7.01 10.21 180 Ir-192 11
XVIII 40 5.49 7.09 160 Se-75 12
XIX 3.00
80 7.62 10.82 180 Ir-192 11
100
(X-Rays)
160
(γ-Rays)
100
2.2 Detectors
For the film radiography test, class I and II films were used. For the computed
radiography test, five CR systems were used, each one with its own corresponding imaging
plate (IP). Table 4 correlates the CR system, the IP type and the scanning parameters.

Table 4 – CR systems and scanning parameters.
CR System IP Type Laser Spot
Size (µµµµm)
Pixel Size
(µµµµm)
S1 87 70
S2 IPA
50 50
S3 50 50
S4 IPB
30 50
S5 IPC 50 50
2.3 Radiation Sources
For the radiographic testing, X-ray and gamma ray sources were used, as shown in
tables 5 and 6.
Table 5 - X-ray specifications. Maximum High
Voltage (kV)
Maximum Current
(mA)
Focal Spot Size
(mm) Equipment model
200 10.0 1.0 GE IT (Eresco 200 MF4-R)
225 2.8/8.0 1.0/5.5 Yxlon (XMB 225)
450 2.0/10.0 2.5/5.5 GE IT (Isovolt Titan 450)
Table 6 - Gamma ray sources.
Isotope Maximum
Activity (Ci) Focal Spot Size (mm) Irradiator model
Iridium-192 80 3.0 x 2.0 Sentinel (880 SIGMA)
Selenium-75 80 3.0 x 3.0 Sentinel (880 DELTA)
3. Results
3.1 SWSI Technique
Table 7 shows the results of the images acquired with film radiography for mapping
the defects on the test samples. Those images were used as reference for evaluating the
detectability of the computed radiography systems.
Table 7 - Film radiography results. X-rays γγγγ-Rays
Group Exp.
(mA.s)
Wire IQI
(ISO 19232-1)
Exp.
(x103Ci.s)
Wire IQI
(ISO 19232-1)
Film
Class
I 440 13 8.70 13 II
II 440 13 9.37 12 II III 480 14 10.57 12 II IV 600 12 12.82 12 II V 495 12 15.21 12 II VI 336 11 10.35 12 II VII 270 11 14.58 11 II VIII 280 11 20.11 11 II
Tables 8 to 12 show the results of the images acquired through computed radiography.
Besides the parameters employed for exposure and the extracted image quantity values,
detectability results are also presented and classified as "Approved" (AP) or "Failed" (F).

Table 8 – S1 results using the SWSI technique.
X-Rays γγγγ-Rays
Group Exp.
(mA.s)
Wire IQI
(ISO
19232-1)
BSR
(µµµµm) SNRN Detec.
Exp.
(x103Ci.s)
Wire IQI
(ISO
19232-1)
BSR
(µµµµm) SNRN Detec.
I 40 14 100 150 AP 17.4 13 100 160 AP
II 44 13 100 165 AP 17.2 12 100 145 AP
III 56 13 100 150 AP 15.7 12 100 150 AP
IV 120 13 100 170 AP 16.2 12 100 140 AP
V 63 13 100 150 AP 21.2 11 100 160 AP
VI 126 12 100 185 AP 19.4 9 160 90 F
VII 144 11 100 180 AP 26.3 10 160 105 F
VIII 168 9 130 130 F 39.6 8 160 104 F
Table 9 – S2 results using the SWSI technique.
X-Rays γγγγ-Rays
Group Exp.
(mA.s)
Wire IQI
(ISO
19232-1)
BSR
(µµµµm) SNRN Detec.
Exp.
(x103Ci.s)
Wire IQI
(ISO
19232-1)
BSR
(µµµµm) SNRN Detec.
I 360 14 80 170 AP 25.5 13 100 160 AP
II 120 14 80 110 AP 26.6 12 100 150 AP
III 320 14 80 150 AP 28.3 13 100 160 AP
IV 880 13 80 175 AP 20.6 12 100 160 AP
V 495 12 100 120 AP 22.3 12 100 150 AP
VI 728 12 100 135 AP 40.6 10 160 120 F
VII 2340 11 100 175 AP 92.1 10 160 117 AP
VIII 2772 9 130 135 F 61.2 9 130 128 F
Table 10 – S3 results using the SWSI technique.
X-Rays γγγγ-Rays
Group Exp.
(mA.s)
Wire IQI
(ISO
19232-1)
BSR
(µµµµm) SNRN Detec.
Exp.
(x103Ci.s)
Wire IQI
(ISO
19232-1)
BSR
(µµµµm) SNRN Detec.
I 120 14 50 210 AP 62.5 13 50 210 AP
II 120 13 50 195 AP 62.5 13 63 165 AP
III 140 14 50 190 AP 63.4 12 63 160 AP
IV 280 13 50 195 AP 91.2 12 80 180 AP
V 172 13 50 200 AP 89.2 11 80 115 AP
VI 232 12 63 155 AP 181.0 11 130 101 F
VII 450 11 80 140 AP 173.0 9 160 76 F
VIII 330 9 130 135 F 344.0 8 160 79 F
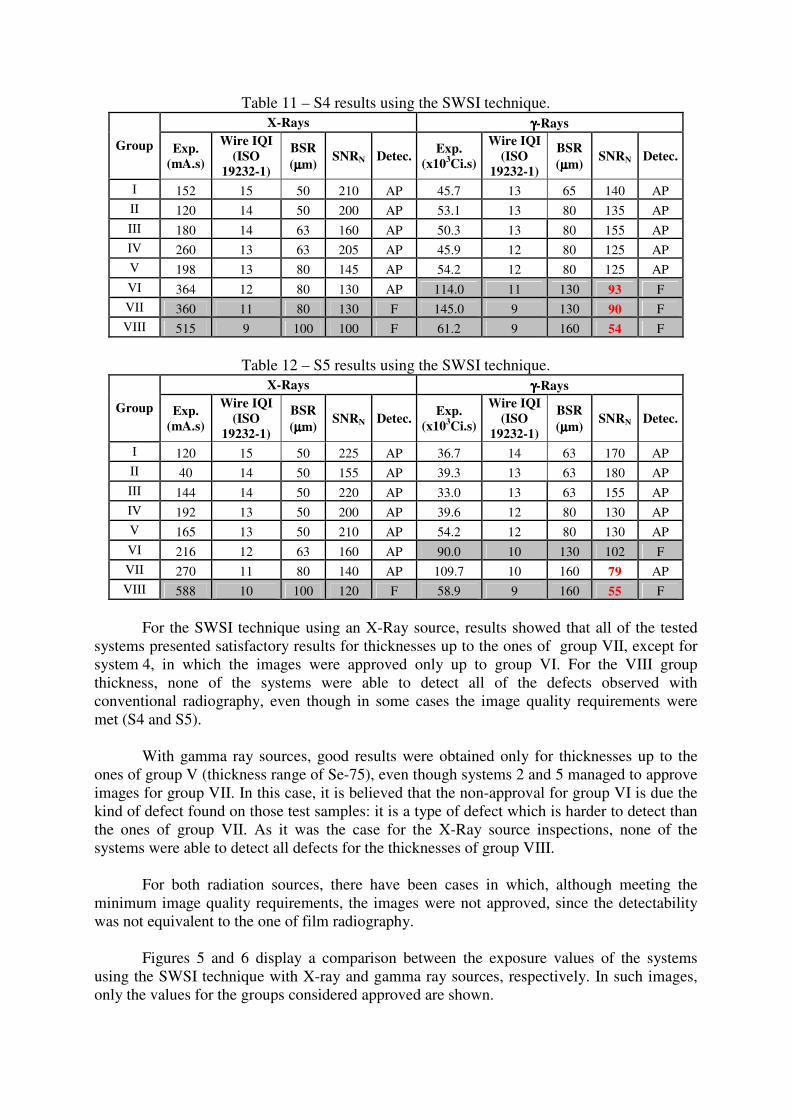
Table 11 – S4 results using the SWSI technique.
X-Rays γγγγ-Rays
Group Exp.
(mA.s)
Wire IQI
(ISO
19232-1)
BSR
(µµµµm) SNRN Detec.
Exp.
(x103Ci.s)
Wire IQI
(ISO
19232-1)
BSR
(µµµµm) SNRN Detec.
I 152 15 50 210 AP 45.7 13 65 140 AP
II 120 14 50 200 AP 53.1 13 80 135 AP
III 180 14 63 160 AP 50.3 13 80 155 AP
IV 260 13 63 205 AP 45.9 12 80 125 AP
V 198 13 80 145 AP 54.2 12 80 125 AP
VI 364 12 80 130 AP 114.0 11 130 93 F
VII 360 11 80 130 F 145.0 9 130 90 F
VIII 515 9 100 100 F 61.2 9 160 54 F
Table 12 – S5 results using the SWSI technique.
X-Rays γγγγ-Rays
Group Exp.
(mA.s)
Wire IQI
(ISO
19232-1)
BSR
(µµµµm) SNRN Detec.
Exp.
(x103Ci.s)
Wire IQI
(ISO
19232-1)
BSR
(µµµµm) SNRN Detec.
I 120 15 50 225 AP 36.7 14 63 170 AP
II 40 14 50 155 AP 39.3 13 63 180 AP
III 144 14 50 220 AP 33.0 13 63 155 AP
IV 192 13 50 200 AP 39.6 12 80 130 AP
V 165 13 50 210 AP 54.2 12 80 130 AP
VI 216 12 63 160 AP 90.0 10 130 102 F
VII 270 11 80 140 AP 109.7 10 160 79 AP
VIII 588 10 100 120 F 58.9 9 160 55 F
For the SWSI technique using an X-Ray source, results showed that all of the tested
systems presented satisfactory results for thicknesses up to the ones of group VII, except for
system 4, in which the images were approved only up to group VI. For the VIII group
thickness, none of the systems were able to detect all of the defects observed with
conventional radiography, even though in some cases the image quality requirements were
met (S4 and S5).
With gamma ray sources, good results were obtained only for thicknesses up to the
ones of group V (thickness range of Se-75), even though systems 2 and 5 managed to approve
images for group VII. In this case, it is believed that the non-approval for group VI is due the
kind of defect found on those test samples: it is a type of defect which is harder to detect than
the ones of group VII. As it was the case for the X-Ray source inspections, none of the
systems were able to detect all defects for the thicknesses of group VIII.
For both radiation sources, there have been cases in which, although meeting the
minimum image quality requirements, the images were not approved, since the detectability
was not equivalent to the one of film radiography.
Figures 5 and 6 display a comparison between the exposure values of the systems
using the SWSI technique with X-ray and gamma ray sources, respectively. In such images,
only the values for the groups considered approved are shown.

1
10
100
1000
10000
Exp
osu
re (
mA
.s)
I II III IV V VI VII
Group
SWSI - X-Rays
Film S1 S2 S3 S4 S5
Figure 5 – Exposure values for X-ray sources (SWSI).
1
10
100
1000
Ex
po
su
re (
x1
03 C
i.s
)
I II III IV V VII
Group
SWSI - γγγγ-Rays
Film S1 S2 S3 S4 S5
Figure 6 – Exposure values for gamma ray sources (SWSI).
Analyzing the results obtained with an X-Ray source through the images shown
above, a trend of exposure reduction can be observed if compared to conventional
radiography, except for system 2, which displayed higher exposure values for thicknesses
higher than the ones of group IV. However, with gamma-ray sources, the exposure was higher
than the one used for conventional radiography for all of the systems.
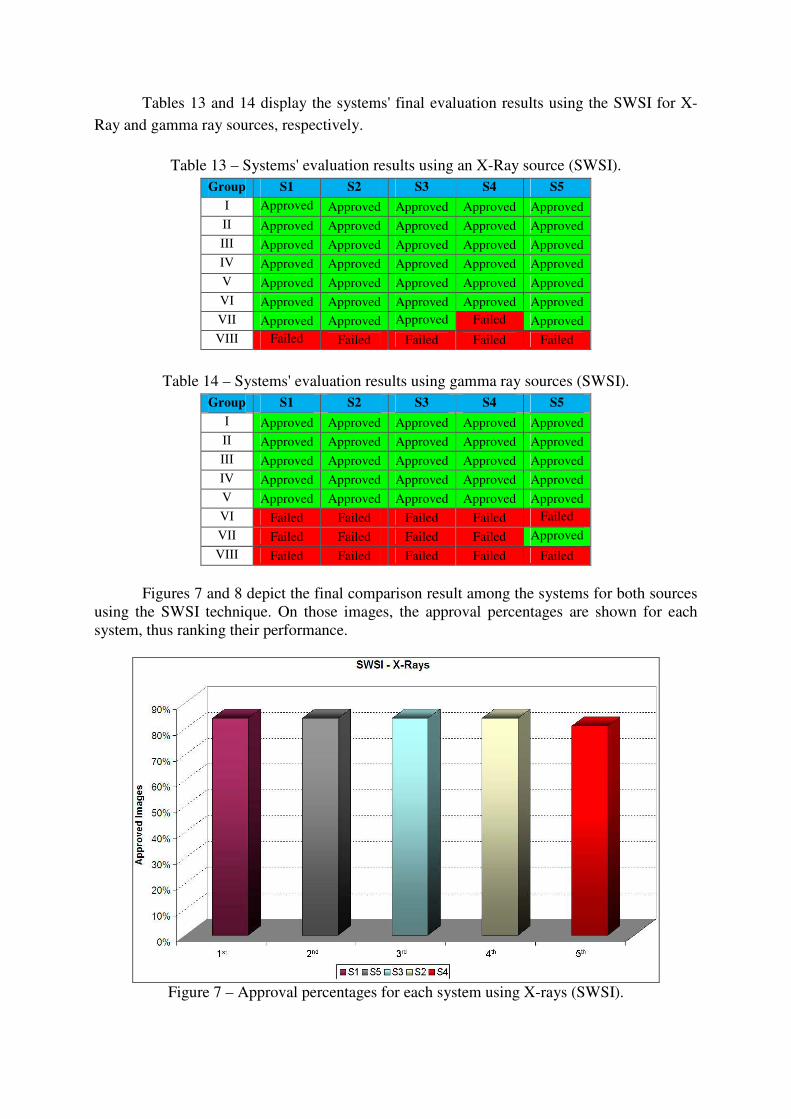
Tables 13 and 14 display the systems' final evaluation results using the SWSI for X-
Ray and gamma ray sources, respectively.
Table 13 – Systems' evaluation results using an X-Ray source (SWSI).
Group S1 S2 S3 S4 S5
I Approved Approved Approved Approved Approved II Approved Approved Approved Approved Approved III Approved Approved Approved Approved Approved IV Approved Approved Approved Approved Approved V Approved Approved Approved Approved Approved VI Approved Approved Approved Approved Approved VII Approved Approved Approved Failed Approved VIII Failed Failed Failed Failed Failed
Table 14 – Systems' evaluation results using gamma ray sources (SWSI).
Group S1 S2 S3 S4 S5
I Approved Approved Approved Approved Approved II Approved Approved Approved Approved Approved III Approved Approved Approved Approved Approved IV Approved Approved Approved Approved Approved V Approved Approved Approved Approved Approved VI Failed Failed Failed Failed Failed
VII Failed Failed Failed Failed Approved
VIII Failed Failed Failed Failed Failed
Figures 7 and 8 depict the final comparison result among the systems for both sources
using the SWSI technique. On those images, the approval percentages are shown for each
system, thus ranking their performance.
Figure 7 – Approval percentages for each system using X-rays (SWSI).

Figure 8 – Approval percentages for each system using gamma ray (SWSI).
3.2 DWSI Technique
Table 15 shows the results of the images acquired with film radiography for mapping
the defects on the test samples using the DWSI technique. Those images were used as
reference for evaluating the detectability of the computed radiography systems.
Table 15 – Film radiography results.
X-Rays γγγγ-Rays Group Exp.
(mA.s)
Wire IQI
(ISO 19232-1)
Exp.
(x103Ci.s)
Wire IQI
(ISO 19232-1)
Film
Class
I 105.0 15 10.7 13 I
II 22.4 13 3.2 12 II
III 37.2 12 3.6 11 II
IV 46.4 11 5.5 10 II
V 168.8 14 8.5 13 I
VI 19.2 13 4.2 13 II
VII 44.8 12 4.5 11 II
VIII 67.5 11 7.3 10 II
IX 300.0 10 20.2 10 II
X 340.0 14 15.1 13 I
XI 30.6 12 5.8 12 II
XII 1134.0 10 102.8 9 II
The DWSI technique could not be used with system 1, since there were a number of
technical complications which could not be handled in a timely manner for that purpose.
Tables 16 to 19 show the results of the images acquired with computed radiography. Besides
the parameters used for exposure and the image quality values obtained, detectability results
are also presented and classified as "Approved" (AP) or "Failed" (F).

Table 16 – S2 results using the DWSI technique.
X-Rays γγγγ-Rays
Group Exp.
(mA.s)
Wire IQI
(ISO
19232-1)
BSR
(µµµµm) SNRN Detec.
Exp.
(x103Ci.s)
Wire IQI
(ISO
19232-1)
BSR
(µµµµm) SNRN Detec.
I 2625.0 13 80 197 AP 24.9 13 100 208 AP
II 2240.0 12 80 196 AP 54.5 12 100 224 AP
III 620.0 12 80 167 F 59.0 0 200 217 F
IV 1676.2 12 100 164 F 24.7 11 200 201 F
V 2250.0 13 80 179 AP 20.3 13 100 183 F
VI 2240.0 13 80 190 AP 19.5 12 100 171 F
VII 3196.8 11 100 185 AP 26.7 11 160 204 AP
VIII 2697.3 11 130 110 F 24.9 9 200 185 F
IX 2497.5 10 160 102 F - - - - -
X 4800.0 13 80 184 AP 15.0 13 100 120 F
XI 3396.6 12 100 180 AP 56.3 11 160 187 F
XII 1470.0 10 160 45 F - - - - -
Table 17 – S3 results using the DWSI technique.
X-Rays γγγγ-Rays
Group Exp.
(mA.s)
Wire IQI
(ISO
19232-1)
BSR
(µµµµm) SNRN Detec.
Exp.
(x103Ci.s)
Wire IQI
(ISO
19232-1)
BSR
(µµµµm) SNRN Detec.
I 67.5 13 50 145 AP 19.9 12 65 141 F
II 53.2 13 50 140 F 18.9 11 80 142 F
III 124.0 11 80 144 F 44.6 11 200 130 F
IV 203.0 10 100 144 F 75.9 9 200 122 F
V 82.5 13 50 135 AP 25.1 12 80 139 F
VI 76.8 13 50 136 AP 40.3 11 65 130 F
VII 92.8 12 80 120 F 38.9 10 200 128 F
VIII 229.5 9 100 100 F - - - - -
IX 675.0 8 130 75 F - - - - -
X 176.0 13 50 135 AP 10.3 12 80 134 F
XI 176.8 13 50 215 F 67.5 10 130 128 F
XII 1907.5 8 130 80 F - - - - -
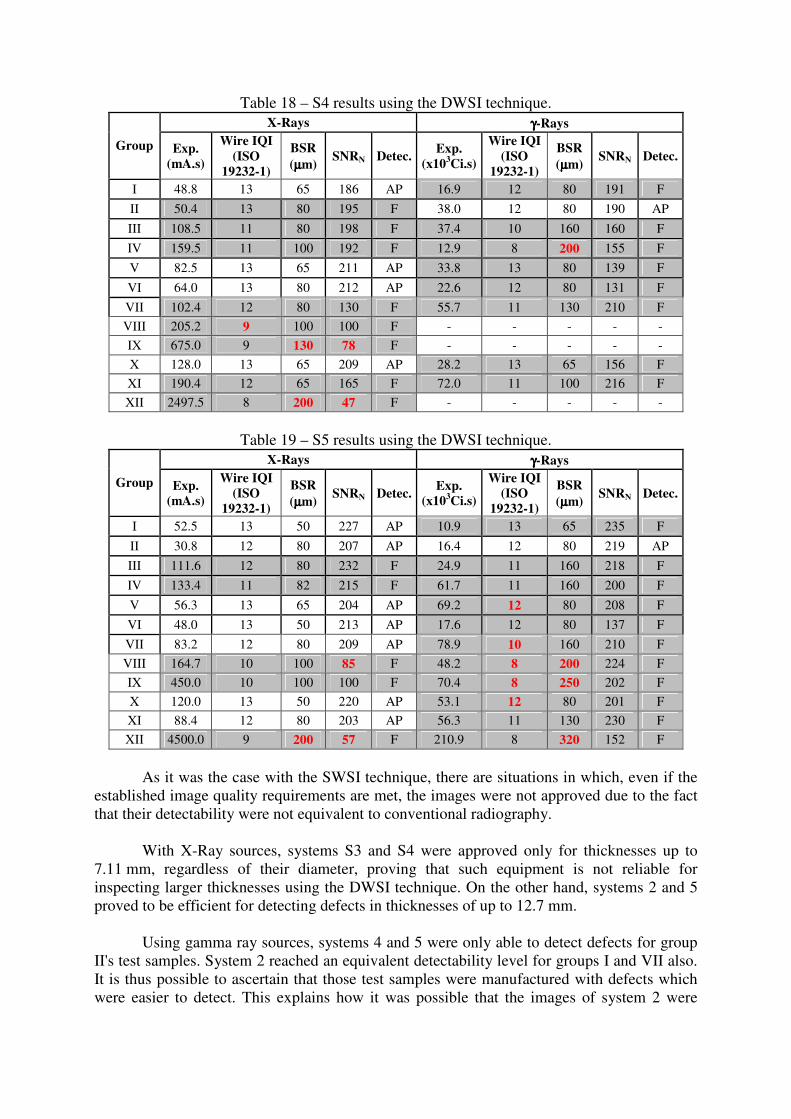
Table 18 – S4 results using the DWSI technique.
X-Rays γγγγ-Rays
Group Exp.
(mA.s)
Wire IQI
(ISO
19232-1)
BSR
(µµµµm) SNRN Detec.
Exp.
(x103Ci.s)
Wire IQI
(ISO
19232-1)
BSR
(µµµµm) SNRN Detec.
I 48.8 13 65 186 AP 16.9 12 80 191 F
II 50.4 13 80 195 F 38.0 12 80 190 AP
III 108.5 11 80 198 F 37.4 10 160 160 F
IV 159.5 11 100 192 F 12.9 8 200 155 F
V 82.5 13 65 211 AP 33.8 13 80 139 F
VI 64.0 13 80 212 AP 22.6 12 80 131 F
VII 102.4 12 80 130 F 55.7 11 130 210 F
VIII 205.2 9 100 100 F - - - - -
IX 675.0 9 130 78 F - - - - -
X 128.0 13 65 209 AP 28.2 13 65 156 F
XI 190.4 12 65 165 F 72.0 11 100 216 F
XII 2497.5 8 200 47 F - - - - -
Table 19 – S5 results using the DWSI technique.
X-Rays γγγγ-Rays
Group Exp.
(mA.s)
Wire IQI
(ISO
19232-1)
BSR
(µµµµm) SNRN Detec.
Exp.
(x103Ci.s)
Wire IQI
(ISO
19232-1)
BSR
(µµµµm) SNRN Detec.
I 52.5 13 50 227 AP 10.9 13 65 235 F
II 30.8 12 80 207 AP 16.4 12 80 219 AP
III 111.6 12 80 232 F 24.9 11 160 218 F
IV 133.4 11 82 215 F 61.7 11 160 200 F
V 56.3 13 65 204 AP 69.2 12 80 208 F
VI 48.0 13 50 213 AP 17.6 12 80 137 F
VII 83.2 12 80 209 AP 78.9 10 160 210 F
VIII 164.7 10 100 85 F 48.2 8 200 224 F
IX 450.0 10 100 100 F 70.4 8 250 202 F
X 120.0 13 50 220 AP 53.1 12 80 201 F
XI 88.4 12 80 203 AP 56.3 11 130 230 F
XII 4500.0 9 200 57 F 210.9 8 320 152 F
As it was the case with the SWSI technique, there are situations in which, even if the
established image quality requirements are met, the images were not approved due to the fact
that their detectability were not equivalent to conventional radiography.
With X-Ray sources, systems S3 and S4 were approved only for thicknesses up to
7.11 mm, regardless of their diameter, proving that such equipment is not reliable for
inspecting larger thicknesses using the DWSI technique. On the other hand, systems 2 and 5
proved to be efficient for detecting defects in thicknesses of up to 12.7 mm.
Using gamma ray sources, systems 4 and 5 were only able to detect defects for group
II's test samples. System 2 reached an equivalent detectability level for groups I and VII also.
It is thus possible to ascertain that those test samples were manufactured with defects which
were easier to detect. This explains how it was possible that the images of system 2 were

approved for the thickness of 12.7 mm, even though it was impossible to visualize such
defects in smaller thicknesses.
Figures 9 and 10 display a comparison between the exposure values among the
systems using the DWSI technique with X and gamma ray sources, respectively. Those
figures show only the values for the groups considered approved.
1
10
100
1000
10000
Ex
po
su
re (
mA
.s)
I II V VI VII X XI
Group
DWSI - X-Rays
Film S2 S3 S4 S5
Figure 9 – Exposure values for X-ray sources (DWSI).
1
10
100
Exp
osu
re (
x10
3 C
i.s)
I II VII
Group
DWSI - γγγγ-Rays
Film S2 S4 S5
Figure 10 – Exposure values for gamma ray sources (DWSI).

By analyzing the results obtained with an X-Ray source, a reduction on the exposure
values could be observed for systems 3, 4 and 5 only for thicknesses of up to 6.35 mm. This is
due to the fact that, for those thicknesses, class 1 films were used for conventional
radiography tests. It was also possible to observe that the exposure values for system 2 were
much higher than the ones of conventional radiography for all of the approved thicknesses,
reaching a factor of 115 times that value in the most extreme case. This large accrual is due to
a limitation in this equipment when it comes to working with low laser power, generating
images with less noise but with low signal intensity, which has to be compensated with the
exposure time.
For gamma-ray sources, higher exposure values were necessary when compared to
conventional radiography so that the images could be approved, repeating therefore the
behavior observed with the DWSI technique.
Tables 20 and 21 show the systems' final evaluation result using the DWSI technique
with X and gamma ray sources, respectively.
Table 20 – Systems' evaluation results using an X-Ray source (DWSI).
Group S2 S3 S4 S5
I Approved Approved Approved Approved II Approved Failed Failed Approved III Failed Failed Failed Failed IV Failed Failed Failed Failed V Approved Approved Approved Approved VI Approved Approved Approved Approved VII Approved Failed Failed Approved VIII Failed Failed Failed Failed IX Failed Failed Failed Failed X Approved Approved Approved Approved XI Approved Failed Failed Approved
XII Failed Failed Failed Failed
Table 21 – Systems' evaluation results using gamma ray sources (DWSI).
Group S2 S3 S4 S5
I Approved Failed Failed Failed II Approved Failed Approved Approved III Failed Failed Failed Failed IV Failed Failed Failed Failed V Failed Failed Failed Failed VI Failed Failed Failed Failed VII Approved Failed Failed Failed VIII Failed - - Failed IX - - - Failed X Failed Failed Approved Failed XI Failed Failed Failed Failed XII - - - Failed

Figures 11 and 12 display the final result of the comparison among the systems for
both kinds of sources using the DWSI technique. On those images, the approval percentages
are shown for each system, thus ranking their performance.
Figure 11 – Approval percentages for each system using X-rays (DWSI).
Figure 12 – Approval percentages for each system using gamma rays (DWSI).
3.3 DWDI Technique
The DWDI technique could not be used with system 1, since there were a number of
technical complications which could not be handled in a timely manner for that purpose.
Tables 22 to 25 list the results of the images acquired with computed radiography. Besides the
parameters used for exposure and the image quality values obtained, the tables also show
detectability results which were classified as "Approved" (AP) or "Failed" (F);

Table 22 – S2 results using the DWDI technique.
X-Rays γγγγ-Rays
Group Exp.
(x 102
mA.s)
Wire IQI
(ISO
19232-1)
BSR
(µµµµm) SNRN Detec.
Exp.
(x103Ci.s)
Wire IQI
(ISO
19232-1)
BSR
(µµµµm) SNRN Detec.
I 77.7 13 80 120 AP 115.7 13 100 92 F
II 85.1 13 80 147 AP - - - - -
III 13.7 13 80 113 AP 74.6 12 160 101 F
IV 77.7 13 80 166 AP
V 99.9 12 80 170 AP 120.4 11 130 91 F
VI 12.0 0 100 147 F - - - - -
VII 111.0 13 80 113 AP 106.8 11 160 163 F
VIII 111.0 12 100 189 AP - - - - -
IX 75.0 11 100 177 F - - - - -
X 122.1 13 80 160 AP 105.2 12 160 105 F
XI - - - - - 87.0 12 200 140 F
XII - - - - - 106.8 12 160 106 F
XIII - - - - - 128.3 11 200 88 F
XIV - - - - - - - - - -
XV 192.0 12 130 163 F - - - - -
XVI - - - - - 106.8 11 160 103 F
XVII - - - - -
XVIII - - - - - 123.2 11 250 72 F
XIX - - - - - - - - - -
Table 23 – S3 results using the DWDI technique.
X-Rays γγγγ-Rays
Group Exp.
(x 102
mA.s)
Wire IQI
(ISO
19232-1)
BSR
(µµµµm) SNRN Detec.
Exp.
(x103Ci.s)
Wire IQI
(ISO
19232-1)
BSR
(µµµµm) SNRN Detec.
I 55.0 13 50 135 AP 107.5 0 100 111 F
II 67.0 13 50 136 F 105.6 0 80 125 F
III 40.0 13 50 108 AP 81.9 12 100 101 F
IV 54.0 13 80 120 F 99.1 12 130 97 F
V 64.0 12 50 214 F 136.9 11 130 85 F
VI 120.0 0 200 111 F - - - - -
VII 61.0 13 65 113 F 99.2 10 130 82 F
VIII 155.0 12 65 146 F - - - - -
IX 40.0 11 100 134 F - - - - -
X 100.0 12 50 103 F 104.9 13 160 104 F
XI 340.0 12 80 149 F 87.9 10 250 107 F
XII 120.0 13 50 140 AP 142.5 10 200 55 F
XIII 100.0 12 65 151 F - - - - -
XIV 195.0 11 65 119 F - - - - -
XV 75.0 11 100 140 F - - - - -
XVI 100.0 12 65 148 F 141.6 10 200 50 F
XVII 160.0 11 65 102 F 87.0 10 200 103 F
XVIII 157.0 12 65 147 F 144.4 11 250 47 F
XIX 240.0 11 65 129 F - - - - -
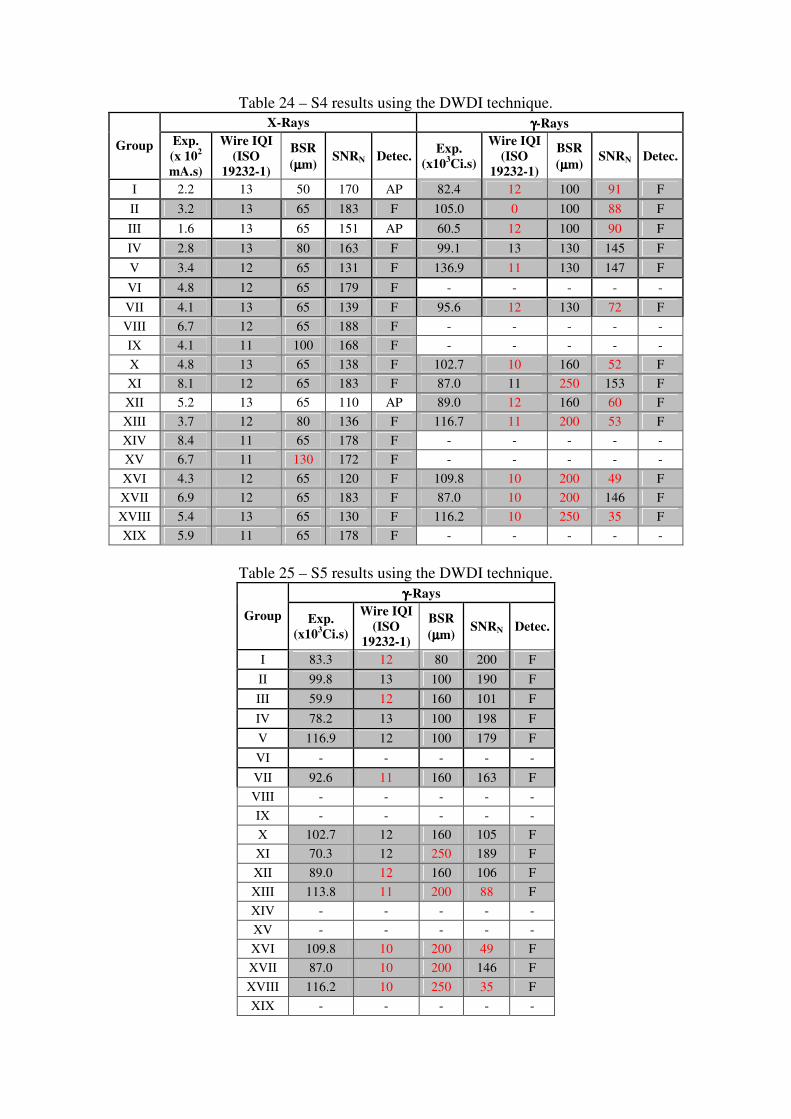
Table 24 – S4 results using the DWDI technique.
X-Rays γγγγ-Rays
Group Exp.
(x 102
mA.s)
Wire IQI
(ISO
19232-1)
BSR
(µµµµm) SNRN Detec.
Exp.
(x103Ci.s)
Wire IQI
(ISO
19232-1)
BSR
(µµµµm) SNRN Detec.
I 2.2 13 50 170 AP 82.4 12 100 91 F
II 3.2 13 65 183 F 105.0 0 100 88 F
III 1.6 13 65 151 AP 60.5 12 100 90 F
IV 2.8 13 80 163 F 99.1 13 130 145 F
V 3.4 12 65 131 F 136.9 11 130 147 F
VI 4.8 12 65 179 F - - - - -
VII 4.1 13 65 139 F 95.6 12 130 72 F
VIII 6.7 12 65 188 F - - - - -
IX 4.1 11 100 168 F - - - - -
X 4.8 13 65 138 F 102.7 10 160 52 F
XI 8.1 12 65 183 F 87.0 11 250 153 F
XII 5.2 13 65 110 AP 89.0 12 160 60 F
XIII 3.7 12 80 136 F 116.7 11 200 53 F
XIV 8.4 11 65 178 F - - - - -
XV 6.7 11 130 172 F - - - - -
XVI 4.3 12 65 120 F 109.8 10 200 49 F
XVII 6.9 12 65 183 F 87.0 10 200 146 F
XVIII 5.4 13 65 130 F 116.2 10 250 35 F
XIX 5.9 11 65 178 F - - - - -
Table 25 – S5 results using the DWDI technique.
γγγγ-Rays
Group Exp.
(x103Ci.s)
Wire IQI
(ISO
19232-1)
BSR
(µµµµm) SNRN Detec.
I 83.3 12 80 200 F
II 99.8 13 100 190 F
III 59.9 12 160 101 F
IV 78.2 13 100 198 F
V 116.9 12 100 179 F
VI - - - - -
VII 92.6 11 160 163 F
VIII - - - - -
IX - - - - -
X 102.7 12 160 105 F
XI 70.3 12 250 189 F
XII 89.0 12 160 106 F
XIII 113.8 11 200 88 F
XIV - - - - -
XV - - - - -
XVI 109.8 10 200 49 F
XVII 87.0 10 200 146 F
XVIII 116.2 10 250 35 F
XIX - - - - -
Generally speaking, the performance of the tested systems was not good for both
radiation sources. With X-Ray sources, system 5 was not tested, since the detectability results
had already been obtained previously. Systems 3 and 4 (same manufacturer) presented good
results only for thicknesses up to 3.91 mm. System 1 was able to detect discontinuities in
thicknesses up to 6.36 mm. The groups with larger diameters could not be inspected with this
system, since it presented technical issues. However, observing the results with smaller
diameters, it is believed that it would have a good performance, if it had been tested.�
For gamma ray sources, none of the systems were able to detect the defects present on
the test samples. Since the DWDI technique requires the magnification of the weld located on
the source side, the large focal size of the gamma sources creates a very intense unsharpness,
which is a determining factor for loss of detectability.�
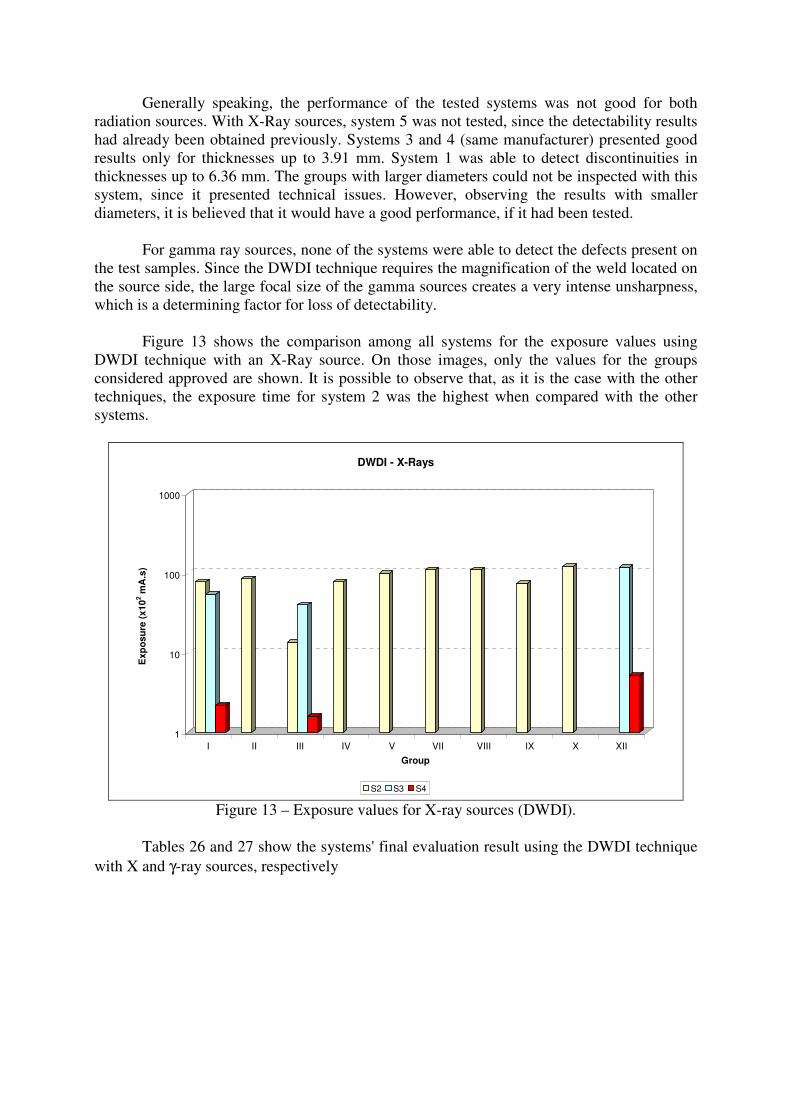
Figure 13 shows the comparison among all systems for the exposure values using
DWDI technique with an X-Ray source. On those images, only the values for the groups
considered approved are shown. It is possible to observe that, as it is the case with the other
techniques, the exposure time for system 2 was the highest when compared with the other
systems.�
1
10
100
1000
Ex
po
su
re (
x1
02 m
A.s
)
I II III IV V VII VIII IX X XII
Group
DWDI - X-Rays
S2 S3 S4
Figure 13 – Exposure values for X-ray sources (DWDI).
Tables 26 and 27 show the systems' final evaluation result using the DWDI technique
with X and γ-ray sources, respectively

Table 26 – Systems' evaluation results using an X-Ray source (DWDI).
Group S2 S3 S4
I Approved Approved Approved
II Approved Failed Failed
III Approved Approved Approved
IV Approved Failed Failed
V Approved Failed Failed
VI Failed Failed Failed
VII Approved Failed Failed
VIII Approved Failed Failed
IX Failed Failed Failed
X Approved Failed Failed
XI - Failed Failed
XII - Approved Approved
XIII - Failed Failed
XIV - Failed Failed
XV Failed Failed Failed
XVI - Failed Failed
XVII - Failed Failed
XVIII - Failed Failed
XIX - Failed Failed
Table 27 – Systems' evaluation results using gamma ray sources (DWDI).
Group S2 S3 S4 S5
I Failed Failed Failed Failed II - Failed Failed Failed III Failed Failed Failed Failed IV - Failed Failed Failed V Failed Failed Failed Failed VI - - - - VII Failed Failed Failed Failed VIII - - - - IX - - - - X Failed Failed Failed Failed XI Failed Failed Failed Failed XII Failed Failed Failed Failed XIII Failed - Failed Failed XIV - - - - XV - - - - XVI Failed Failed Failed Failed XVII - Failed Failed Failed XVIII Failed Failed Failed Failed XIX - - - -
Figure 14 depicts the final comparison result among the systems for the X-Ray source
using the DWDI technique. On those images, the approval percentages are shown for each
system, thus ranking their performance.
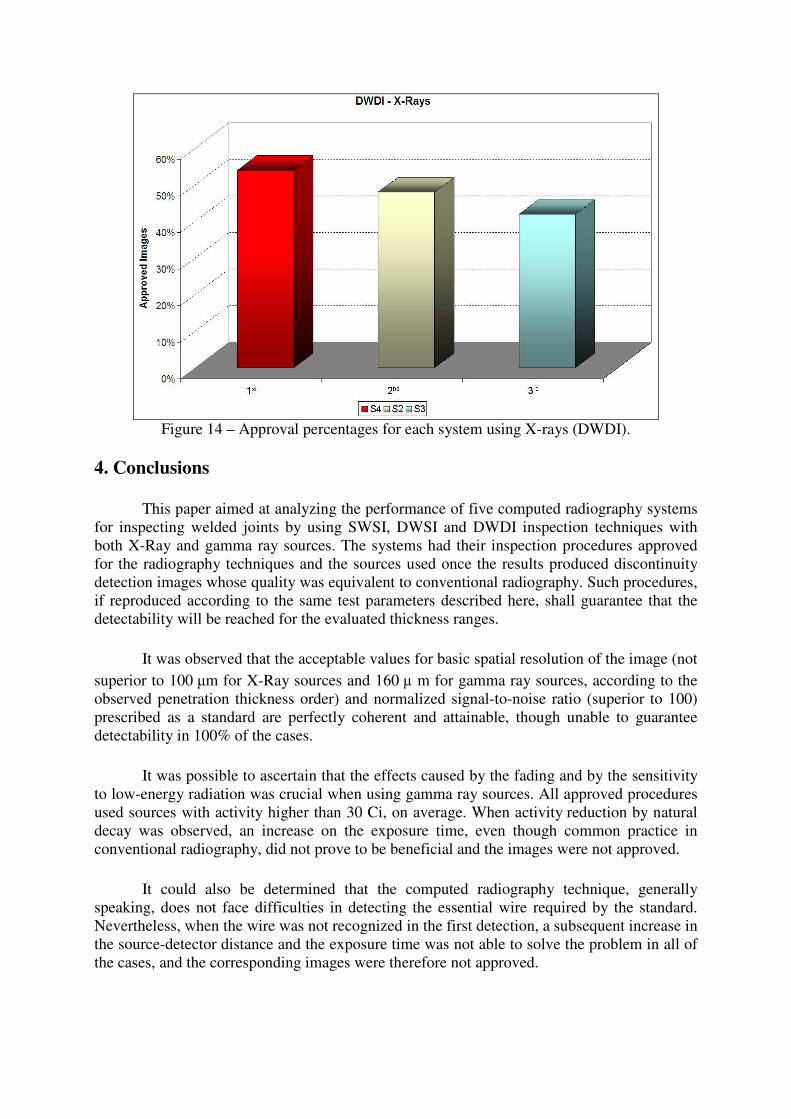
Figure 14 – Approval percentages for each system using X-rays (DWDI).
4. Conclusions
This paper aimed at analyzing the performance of five computed radiography systems
for inspecting welded joints by using SWSI, DWSI and DWDI inspection techniques with
both X-Ray and gamma ray sources. The systems had their inspection procedures approved
for the radiography techniques and the sources used once the results produced discontinuity
detection images whose quality was equivalent to conventional radiography. Such procedures,
if reproduced according to the same test parameters described here, shall guarantee that the
detectability will be reached for the evaluated thickness ranges.�
�
It was observed that the acceptable values for basic spatial resolution of the image (not
superior to 100 �m for X-Ray sources and 160 ��m for gamma ray sources, according to the
observed penetration thickness order) and normalized signal-to-noise ratio (superior to 100)
prescribed as a standard are perfectly coherent and attainable, though unable to guarantee
detectability in 100% of the cases.�
�
It was possible to ascertain that the effects caused by the fading and by the sensitivity
to low-energy radiation was crucial when using gamma ray sources. All approved procedures
used sources with activity higher than 30 Ci, on average. When activity reduction by natural
decay was observed, an increase on the exposure time, even though common practice in
conventional radiography, did not prove to be beneficial and the images were not approved.�
�
It could also be determined that the computed radiography technique, generally
speaking, does not face difficulties in detecting the essential wire required by the standard.
Nevertheless, when the wire was not recognized in the first detection, a subsequent increase in
the source-detector distance and the exposure time was not able to solve the problem in all of
the cases, and the corresponding images were therefore not approved.�
�

For tests with X-Ray sources whose high voltages were above 270 kV for the SWSI
technique and 200 kV for the DWSI technique, it was noticed that the exposure values were
higher when compared to film radiography. System 1 was the exception here, since the
exposure was lower for all applied voltages. For gamma ray sources, the exposure values
were higher than the ones used for conventional radiography in all cases. This increase in
exposure was due to the low efficiency of the phosphor plates for higher energies compared
with a traditional radiographic film.�
�
System 2 proved to be a rather slow piece of equipment, especially due to the
limitation of having to work with low laser power for X-Ray images. This limitation is caused
by the large blooming quantity found on the X-Ray images when the plates were scanned
with high laser power, which hindered the evaluation of the discontinuities present on the test
samples.�
�
The results drawn from this research prove that there are indeed advantages in using
computed radiography for evaluating welded joints, especially with X-Ray sources. Gamma
ray sources, however, are not recommended for DWSI and DWDI inspections, since there is
no way to ensure that the existing defects shall be properly identified.�
Acknowledgements
This work was partially supported by Petrobras, Conselho Nacional de Desenvolvimento
Científico e Tecnológico (CNPq), Fundação de Amparo à Pesquisa do Estado do Rio de
Janeiro (FAPERJ) and Comissão de Aperfeiçoamento de Pessoal de Nível Superior (CAPES).
References
1. C. A. Marinho et al., “Qualification Process and Inspection Validation of Computed
Radiography Technique for DWDI Weld Inspection”, 18th
WCNDT Proceedings, Durban,
South Africa, April 2012.
2. D. F. Oliveira et al., “An Evaluation of Imaging Plate Characteristics that Determine Image
Quality in Computed Radiography”, Materials Evaluation, Vol 72, No 3, pp 392-397, March
2014.
3. C. A. MARINHO, R. T. Lopes, J. M. A. Rebello, "Film Replacement at Digital Techniques
in Weld Inspection", Materials Evaluation, Vol 67, No5, pp 529-539, July 2009.
4. ASME B31.3 – Process Piping, ASME Boiler and Pressure Vessel Code, Section V, 2012.
5. BS EN 14784-1 - Non-Destructive Testing – Industrial Computed Radiography with
Storage Phosphor Imaging Plates – Part 1: Classifications of Systems, 2005.
6. ASTM E-2445 - Standard Practice for Qualification and Long - Term Stability of
Computed Radiology Systems, 2010.
7. ASTM E-2446 - Standard Practice for Classification of Computed Radiology Systems,
2010.
8. ASTM E 1815 - Classification of film systems for industrial Radiography, 2013.
9. ISO 19232-1 Non-destructive testing - Image quality of radiographs - Part 1: Image quality
indicators (wire type) - Determination of image quality value, 2013.
10. Petrobras N-2821B - Non-Destructive Testing – Computed Radiography of Welded
Joints, 2011.