validation of growth and inactivation kinetics of listeria
TRANSCRIPT
Validation of growth and inactivation
kinetics of Listeria monocytogenes in
food products
MSc Food Safety Thesis
Daokun Lin
880615-518-120
Supervisors
Diah Chandra Aryani
Heidy den Besten
June 2015
Laboratory of Food Microbiology, Wageningen University
1
ABSTRACT Predictive modelling in food microbiology provides quantitative estimation of growth
of micro-organisms. In the present study, the predicted growth kinetics of Listeria
monocytogenes was validated in milk and ham incubated at 7°C. The prediction was
in agreement with the growth study in BHI broth and ham, while it had a higher μmax
than the observed kinetics in milk of all three strains. Different size of inoculum of L6
and temperature of pre-culturing of FBR15 affected λ but not μmax. Three Listeria
monocytogenes strains were more heat resistant when they were inactivated in ham
than in BHI broth and milk as heating media at 65°C and when they were grown in
food product.
Keywords: Validation; Listeria monocytogenes; Food
2
TABLE OF CONTENTS ABSTRACT .......................................................................................................................................... 1
TABLE OF CONTENTS ......................................................................................................................... 2
1. INTRODUCTION ............................................................................................................................. 4
2. MATERIALS AND METHODS........................................................................................................... 6
2.1 Listeria monocytogenes strains ........................................................................................... 6
2.2 Food samples preparation................................................................................................... 6
2.3 Growth experiments ........................................................................................................... 6
2.3.1 Culture preparation .................................................................................................. 6
2.3.2 Inoculation and storage ............................................................................................ 6
2.3.3 Sampling and enumeration ...................................................................................... 7
2.3.4 Maximum growth rate and lag time ......................................................................... 8
2.3.5 Effect of inoculum size and pre-culturing temperature on μmax and λ ..................... 8
2.3.6 Comparison of observed growth kinetics with the predictive model ...................... 8
2.4 Inactivation experiments ................................................................................................... 10
2.4.1 Sample preparation and inactivation procedures .................................................. 10
2.4.2 Adjustment of heating up time .............................................................................. 11
2.4.3 D-value estimation ................................................................................................. 12
2.4.4 Effect of heating media and growth media on inactivation kinetics ...................... 12
2.5 VBA based tool to predict growth kinetics of Listeria monocytogenes ............................. 12
3. RESULTS ....................................................................................................................................... 13
3.1 Growth experiments ......................................................................................................... 13
3.1.1 Determination of μmax and λ .................................................................................. 13
3.1.2 Effect of inoculum size and pre-culturing temperature on μmax and λ ................... 14
3.1.3 Validation of growth kinetics and effect of food matrix ......................................... 15
3.2 Inactivation experiments ................................................................................................... 18
3.2.1 Effect of heating media on inactivation kinetics .................................................... 18
3.2.2 Effect of growth media on inactivation kinetics ..................................................... 19
3.3 VBA based tool to predict growth kinetics of Listeria monocytogenes ............................. 22
4. DISSCUSSION ............................................................................................................................... 23
4.1 Effect of inoculum size and pre-culturing temperature on μmax and λ .............................. 23
4.2 Validation of growth kinetics and effect of food matrix .................................................... 23
4.3 Effect of heating media and growth media on inactivation kinetics ................................. 24
5. CONCLUSION ............................................................................................................................... 25
6. RECOMMENDATION .................................................................................................................... 26
7. APPENDIX .................................................................................................................................... 27
7.1 Figures of fitting Gompertz model to growth curves using Excel Solver Add-in ............... 27
7.1.1 L6 growth curves at 7°C.......................................................................................... 27
7.1.2 FBR17 growth curves at 7°C ................................................................................... 28
7.1.3 FBR15 growth curves at 7°C ................................................................................... 29
7.1.4 FBR15 growth curves at 7°C with 7°C pre-culturing for 10 days ............................ 30
7.2 Tables of μmax and λ derived from growth curves fitted by ............................................... 32
Gompertz model using TableCurve 2D .................................................................................... 32

3
7.2.1 L6 growth parameters at 7°C with larger inoculum size ........................................ 32
7.2.2 L6 growth parameters at 7°C .................................................................................. 32
7.2.3 FBR17 growth parameters at 7°C ........................................................................... 34
7.2.4 FBR15 growth parameters at 7°C ........................................................................... 35
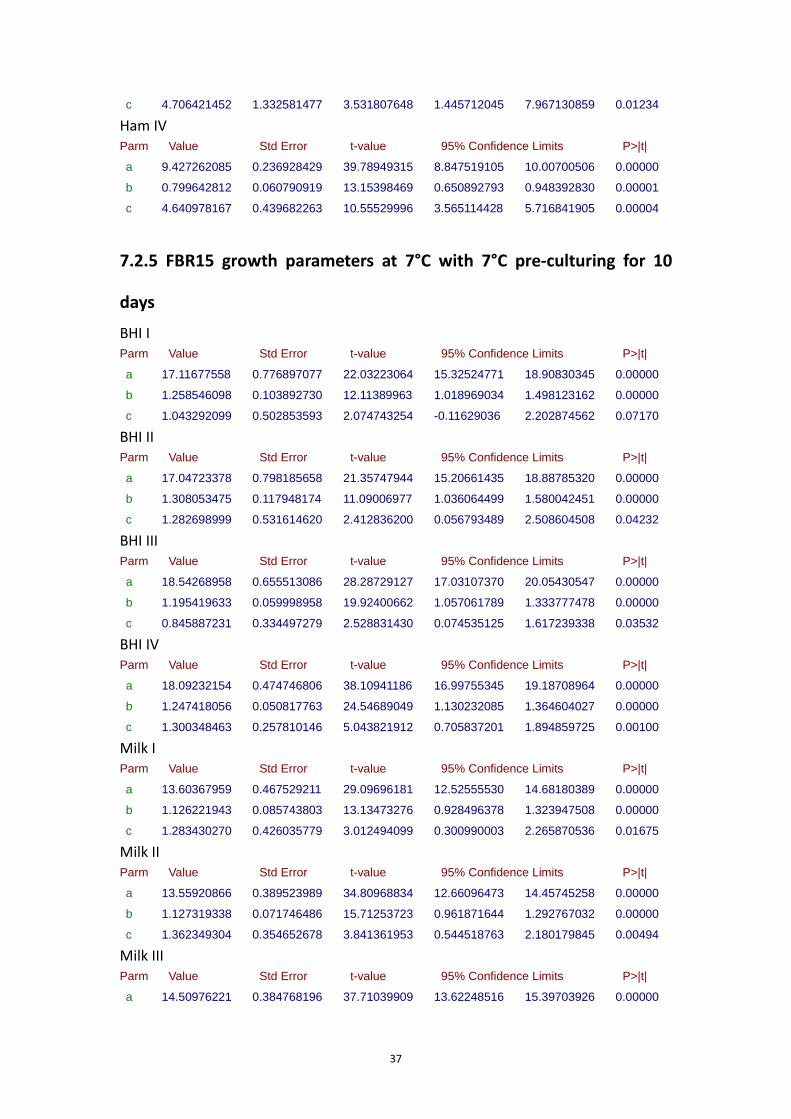
7.2.5 FBR15 growth parameters at 7°C with 7°C pre-culturing for 10 days .................... 37
7.3 Tables of two independent samples t-test using SPSS ...................................................... 38
7.3.1 Effect of inoculum size ........................................................................................... 38
7.3.2 Effect of low temperature pre-culturing ................................................................ 39
7.4 Tables of one sample t-test using SPSS ............................................................................. 40
7.4.1 Grown in BHI broth ................................................................................................ 40
7.4.2 Grown in milk ......................................................................................................... 40
7.4.3 Grown in ham ......................................................................................................... 41
7.5 Figures of fitting modified Weibull model to inactivation curves using Excel Solver Add-in
................................................................................................................................................ 42
7.5.1 L6 inactivation curves at 65°C ................................................................................ 42
7.5.2 FBR17 inactivation curves at 65°C .......................................................................... 44
7.5.3 FBR15 inactivation curves at 65°C .......................................................................... 46
7.6 Determination of D-value .................................................................................................. 48
7.7 Tables of ANOVA using SPSS .............................................................................................. 49
7.7.1 Effect of heating media on inactivation kinetics .................................................... 49
7.7.2 Effect of growth media on inactivation kinetics ..................................................... 50
REFERENCES .................................................................................................................................... 52

4
1. INTRODUCTION Predictive microbiology using different mathematical models is widely used to
quantitatively estimate microbial growth in foods under different physical or
chemical conditions such as temperature, pH and water activity. It enables the
prediction of microbial food safety and quality, surveillance of critical points within a
food chain, optimization of safety controls from production to consumption and
quantitative investigation of mechanisms and correlations between kinetic
differences (Ross et al., 2000; Zwietering et al., 1990; Zwietering & den Besten, 2011).
Also, it provides much faster results than microbiological challenge testing, storage
testing and surveillance testing (Zwietering et al., 1996).
Predictive growth models have been developed and applied to a wide range of
pathogens, for example Salmonella (Gibson et al., 1988; Silva et al., 2009), Bacillus
cereus (Bae et al., 2012; Zwietering et al., 1996), Escherichia coli O157:H7 (Ding et al.,
2012; Sutherland et al., 1995), Clostridium perfringens (Juneja et al., 2013; Smith &
Schaffner, 2004), Staphylococcus aureus (Stewart et al., 2002; Sutherland et al., 1994)
and Yersinia enterocolitica (Pin et al., 2000; Sutherland & Bayliss, 1994). Among them,
to estimate the specific growth rate of different micro-organisms, the Gamma
concept is regarded as one of the best models since various variables as hurdle
effects can be quantified. Besides, it enables the closest prediction of the growth
data among other models including Pathogen Modeling Program (PMP, version5.0),
Food MicroModel (FMM, version 2.5), GVdl Arrhenius equation, Patterson
polynomial model, Duffy quadratic equation, Farber quadratic equation and Murphy
polynomial model due to the smallest mean square error (MSE) (Te Giffel &
Zwietering, 1999).
Listeria monocytogenes is a pathogen which has been found not only in environment,
but also in many food products including milk and ham (Farber & Peterkin, 1991;
Tompkin, 2002). It leads to a high mortality rate and is a serious threat to pregnant
women, their unborn children, elderly people and immunocomprimised people
(Allerberger & Wagner, 2010). According to the EFSA report in 2015, a total of 13
Listeria outbreaks with 1763 confirmed human listeriosis cases in Europe were
reported in 2013. When combined with the data from previous years, it showed a
statistically significant increasing trend from 2009 to 2013 (EFSA, 2015).
For L. monocytogenes, similar to other aforementioned pathogens, differences often
occur between the prediction and the actual growth kinetics which are caused by
several factors such as strain variability, biological variability, experimental variability
and food product composition. Based on a previous study, strain variability is defined
as the variability between strains from the same species; biological variability is
defined as the variability between biologically independent reproductions of the
same strain performed on different experimental days; and experimental variability is
defined as the variability between parallel experimental replicates at the same time
on the same experimental day (Aryani et al., 2015a). By quantifying these variabilities,
a more realistic prediction of growth kinetics could be achieved.
To check the accuracy of the predictive growth model proposed by Aryani et al.
5
(2015a), a validation study by microbial challenge testing in milk and ham was
performed. Due to the wider acceptance of various bacterial growth experiments
compared to other sigmoidal functions (Logistic, Richards, Schnute and Stannard)
reported by Zwietering et al. (1990), Gompertz equation was regarded as a
preferable model to be fitted to the growth data to obtain the real specific growth
rate.
Furthermore, to investigate the other factors influencing thermal resistance (D-value),
the thermal inactivation study was also conducted using milk and ham. The
D-value,which was defined as the time required at a certain temperature to kill 90%
of the micro-organisms, is frequently used to describe the thermal resistance of
bacterial cells. In order to reduce the correlation between parameters β and δ to an
acceptance level, a modified Weibull model was used to estimate D-values instead of
Weibull model in previous studies (Aryani et al., 2015b; Metselaar et al., 2013).
The aim of this study was to validate the growth kinetics of Listeria monocytogenes in
food products and study the effect of food product composition on the growth and
inactivation of Listeria monocytogenes. During the course of this work, an effect of
inoculum size and low temperature pre-culturing in growth kinetics was also
quantified.
6
2. MATERIALS AND METHODS
2.1 Listeria monocytogenes strains
Three strains of Listeria monocytogenes were used in this study: L6 (origin: milk),
which was the most heat resistant strain; FBR15 (origin: ice cream packaging
machine), which had the slowest growth rate; and FBR17 (origin: frozen fried rice),
which had lower pHmin, lower aw min and higher LAmax (LA, undissociated lactic acid
concentration) (Aryani et al., 2015b). The stock cultures containing 3:7 (v/v) of 0.3 ml
glycerol (Sigma-Aldrich, Germany) and 0.7 ml overnight culture in Brain Heart
Infusion (BHI) broth (Becton Dickinson, France) were kept frozen at -20°C in 1 ml
cryovial tubes (Thermo Fisher Scientific Inc., Waltham, USA).
2.2 Food samples preparation
Skim milk (UHT, 0% fat) and ham purchased from Albert Heijn in Wageningen with
the same batch number were used in this study.
Each slice of cooked shoulder ham (about 11.5 g) was put into the bottom of a
stomacher bag or a vacuum bag separately. To remove the possible impacts from the
competitive flora (Buchanan & Bagi, 1999), all the bags were gamma-irradiated with
a dose of 10 kilo Gray (Synergy Health Ede B.V., Ede, The Netherlands) and then
stored at 4°C until inoculation.
2.3 Growth experiments
2.3.1 Culture preparation
A loop of content from the stock culture was streaked onto a BHI agar plate (BHI
broth with 1.5% (w/w) of bacteriological agar, Oxoid, UK) and incubated for 24h at
30°C (IKS, Technisch Bureau, Leerdam, The Netherlands). A single colony from BHI
agar plate was transferred into a test tube pre-filled with 10 ml of BHI broth. The test
tube was incubated for 17h at 30°C, 200 rpm (Forma Orbital Shakers, Thermo
Electron Corporation, USA) until the stationary phase.
To consider the real situation in food cold chain and explore the impact of low
temperature pre-culturing on growth kinetics, an additional experiment was required.
Only FBR15, which had slowest growth rate among the three strains, was selected. A
single colony of FBR15 from BHI agar plate was inoculated in a 100 ml Erlenmeyer
flask pre-filled with 20 ml of BHI broth and incubated until reaching stationary phase
for 10 days at 7°C.
2.3.2 Inoculation and storage
To validate the growth kinetics of three strains, three different growth media were
selected: BHI broth, milk and ham.

7
For BHI broth, 50 microliters (μl) of the overnight culture from the test tube was
inoculated in a 100 ml Erlenmeyer flask pre-filled with 50 ml of BHI broth and
incubated until the stationary phase at 7°C.
For milk, a similar approach was followed. 50 μl of the overnight culture from the
test tube was inoculated in a 100 ml Erlenmeyer flask pre-filled with 50 ml of UHT
milk and incubated until the stationary phase at 7°C.
For ham, to obtain the same initial concentration as in BHI broth and in milk, a 100
times dilution in BHI broth was done. 0.5 ml of 100 times diluted overnight culture
from the test tubes was inoculated on one side of ham in each stomacher bag. Then
another 0.5 ml of diluted overnight culture was inoculated on the other side. After
the inoculum was spread on most part of the surface of ham, the bags were enclosed
with tapes and incubated until the stationary phase at 7°C.
According to a previous study (Gorski et al., 2006), the concentration of overnight
culture can be estimated as 9.6 logarithm colony forming units per milliliter (log
CFU/ml). The initial cell concentration will therefore be approximately 6.6 log CFU/ml
in BHI broth and milk, and 6.6 log CFU/g in ham. L6 was the only strain selected in
this experiment which was conducted in duplicate on the same day considering the
experimental variability.
To follow a longer growth history until the stationary phase and consider the worst
case scenario, a smaller inoculum size was required in another experiment. To
achieve it, 10,000 times further dilution of the overnight culture should be made
before inoculation into growth media. For ham particularly, 1,000,000 times dilution
in total was made before spreading it on the surface of the ham. Under this
circumstance, the initial cell concentration of all three strains will therefore be
around 2.6 log CFU/ml in BHI broth and milk, and 2.6 log CFU/g in ham. This
inoculum size was also used in aforementioned FBR15 including the phase of low
temperature pre-culturing in Section 2.3.1. These experiments were conducted in
duplicate on the same day and reproduced one time on the other day considering
the experimental and the biological variability.
2.3.3 Sampling and enumeration
The samples with an initial inoculum size of around 6.6 log CFU/ml were sampled
daily. The samples with an initial inoculum size of around 2.6 log CFU/ml were
sampled every 2 days, considering the probable increase of lag time from a previous
study (Robinson et al., 2001). For samples containing FBR15 in ham both with and
without low temperature pre-culturing were taken every 4 days, considering slower
growth rate and solid growth media as an inhibiting factor (Koutsoumanis et al.,
2004).
For BHI broth and milk samples, 1 ml of each sample was diluted in 9 ml of peptone
physiological salt (PPS, Tritium Microbiologie). Then, further decimal dilutions were
made and the appropriate dilutions were plated in duplicate on BHI agar plates using
a spiral plater (Eddy Jet, IUL Instruments). For the initial time points where low
concentrations of viable cells was expected, no dilution was made. In this case, 50 μl
8
of the sample was plated in duplicate on BHI agar plate using spiral plater, giving the
detection limit of 1.3 log CFU/ml. All the plates were incubated for 24h at 30 °C, and
the colonies were counted and reported in log CFU/ml.
Ham was diluted in 1:9 in PPS (a solution with two components, 0.85% (w/w) of
sodium chloride (AnalaR NORMAPUR, VWR International, Belgium) and 0.1% (w/w)
of neutralized bacteriological peptone (Oxoid, UK)). The mixture was then
homogenized using a stomacher machine (400 Circulator, Seward, UK) for 1 min at
260 rpm. After homogenization, further dilutions were made and the appropriate
dilutions were plated in duplicate using spiral plater. For the initial time points where
low concentrations of viable cells was expected, one ml of the homogenized sample
was evenly divided into two parts and spread plated onto two BHI agar plates. A
detection limit of 1 log CFU/g was obtained using this method. All the plates were
incubated for 24h at 30 °C, and the colonies were counted and reported in log CFU/g.
2.3.4 Maximum growth rate and lag time
The logarithms of colony counts were plotted against the time to obtain the growth
curve of each growth experiment. The Gompertz model (Zwietering et al., 1990) was
used to fit each growth curve and to estimate the maximum growth rate (μmax) and
lag time (λ).
ln (𝑁𝑡
𝑁0) = 𝐴 ∙ 𝑒𝑥𝑝 {−𝑒𝑥𝑝 [
μ𝑚𝑎𝑥∙𝑒
𝐴(𝜆− 𝑡) + 1]} ⑴
where Nt is the bacterial concentration (CFU/ml) at time t (day); N0 is the initial
bacterial concentration (CFU/ml); A is the maximal value reached in the growth curve
(A = ln (N∞ / N0)); μmax is the maximum specific growth rate (per day); λ is the lag time
(day); t is the time (day).
Before the fitting procedure, the equation (Eq.⑴) was transformed from ln scale into
log scale. Then it was done using Microsoft Excel Solver Add-in and confirmed using
TableCurve 2D v5.1.
2.3.5 Effect of inoculum size and pre-culturing temperature on μmax and
λ
The μmax and λ of strain L6 with 2 different initial inoculum size ( 6.6 log CFU/ml(g)
and 2.6 log CFU/ml(g)) in 3 different growth media (BHI broth, milk and ham) were
compared using two independent samples t-tests.
The μmax and λ of strain FBR15 in 3 different growth media (BHI broth, milk and ham)
with 7°C and 30°C pre-culturing were compared using two independent samples
t-tests.
2.3.6 Comparison of the prediction and the observed growth kinetics
The growth kinetics of L. monocytogenes in BHI, milk and ham were predicted using
9
the logistic equation (Augustin et al., 2000).
𝑁𝑡 = {
𝑁0, t ≤ 𝜆𝑁0∙𝑒𝑥𝑝[μ𝑚𝑎𝑥∙(𝑡−𝜆)]
1+𝑁0
𝑁𝑚𝑎𝑥∙{𝑒𝑥𝑝[μ𝑚𝑎𝑥∙(𝑡−𝜆)]−1}
, t > 𝜆 ⑵
where Nt is the bacterial concentration (CFU/ml) at time t (day); N0 is the initial
bacterial concentration (CFU/ml); Nmax is the maximum bacterial concentration
(CFU/ml); μmax is the maximum specific growth rate (per day); λ is the lag time (day);
t is the time (day).
The specific values of N0, Nmax and λ of each strain in each medium were derived
from the average values of observations in this study. The specific values of μmax of
each strain in BHI broth or milk were calculated using Gamma approach (Zwietering
et al., 1996) (Eqs.⑶−⑹), while the ones in ham were calculated using Eqs.⑷−⑻
because of the presence of undissociated lactic acid.
μ𝑚𝑎𝑥 = μ𝑟𝑒𝑓 ∙ γ(𝑇) ∙ γ(𝑝𝐻) ∙ γ(𝑎𝑤) ⑶
γ(𝑇) =(𝑇−𝑇𝑚𝑖𝑛)
2
(𝑇𝑟𝑒𝑓−𝑇𝑚𝑖𝑛)2 ⑷
γ(𝑝𝐻) =1−2
(𝑝𝐻−𝑝𝐻𝑚𝑖𝑛)
𝑝𝐻𝑚𝑖𝑛−𝑝𝐻1/2
1−2
(𝑝𝐻𝑟𝑒𝑓−𝑝𝐻𝑚𝑖𝑛)
𝑝𝐻𝑚𝑖𝑛−𝑝𝐻1/2
⑸
γ(𝑎𝑤) =1−(
1−𝑎𝑤
1−𝑎𝑤𝑚𝑖𝑛)𝑎
1−(1−𝑎𝑤𝑟𝑒𝑓
1−𝑎𝑤𝑚𝑖𝑛)𝑎 ⑹
γ(𝐿𝐴) = 1 − ([𝐿𝐴]
[𝐿𝐴𝑚𝑎𝑥])𝑎
⑺
μ𝑚𝑎𝑥 = μ𝑟𝑒𝑓 ∙ γ(𝑇) ∙ γ(𝑝𝐻) ∙ γ(𝑎𝑤) ∙ γ(𝐿𝐴) ⑻
The average values of Tmin, pHmin, pH1/2, aw min, aaw, LAmax and a[LA] of each strain as
well as Tref (30 °C), pHref (7.3) and awref (0.997) were derived from the study of Aryani
et al. (2015). The only incubation temperature (T) for growth in this study was 7 °C.
The pH was measured using a pH-meter (Microprocessor pH meter, WTW, Germany),
while the aw was measured using an aw-meter (LabMaster Aw, Novasina, Switzerland).
Two pH buffer solutions (pH=4 and pH=7) (Merck KGaA, Darmstadt, Germany) were
used to calibrate the pH-meter before every measurement. For BHI broth, the
average pH was 7.43 and the average aw was 0.995. For UHT milk, the average pH
was 6.66 and the average aw was 0.994. For ham, the average pH was 6.70 and the
average aw was 0.970. The lactic acid concentration in ham sample was not measured
in this study. Therefore, 1.58 mM undissociated lactic acid was used in calculation for
assumption.
In addition to the predicted curve of each strain in each growth medium, the 95%
predicted confidence interval (CI) of each parameter were included to obtain the
range within which the mean value would be most possibly located.
For further statistical analysis, the μmax from the prediction and the obtained

10
experimental data of each strain in each growth media (BHI broth, milk and ham)
were compared using one sample t-tests.
2.4 Inactivation experiments
2.4.1 Sample preparation and inactivation procedures
After cells entering the stationary phase, the thermal inactivation experiments were
immediately started. Five different conditions, , namely BHI broth to BHI broth
(grown in BHI broth and inactivated in BHI broth), BHI broth to milk, BHI broth to
ham, milk to milk and ham to ham, were tested. All the experiments were done using
a water bath (Julabo SW20, Julabo Labortechnik GmbH, Germany) set at 65 °C and
200 rpm.
For the inactivation experiments using liquid heating media (BHI broth and milk),
three 250 ml Erlenmeyer flasks prefilled with 40 ml of heating media were
pre-heated in the water bath at 65 °C. Two of them were used for inactivation
experiment in duplicate, while the other one was used to measure the temperature
of heating media using a thermocouple (PeakTech 3150, Thermocouple K-type).
When its temperature was stable at 65 ± 0.3 °C, the inactivation was immediately
started by inoculating 400 μl of the stationary phase culture into the pre-heated
media. For the starting time point of t = 0, similar dilution (1:100) was made and
plated in duplicate on BHI agar plates. At the other time points, one ml of the sample
was diluted in 9 ml of PPS. Then, further decimal dilutions were made and plated in
duplicate on BHI agar plates using a spiral plater. For the sampling points where low
concentration of the cells was expected, , one ml of the sample was transferred into
a sterile cup placed in ice bucket for few seconds to stop the inactivation. From this
sample, two different plating methods were used. For a relatively higher bacterial
concentration, 100 μl of the sample was spread plated onto BHI agar plate in
duplicate. A detection limit of 1 log CFU/ml was obtained. For a relatively lower
bacterial concentration, one ml of the sample was evenly divided into three parts,
spread plated onto three BHI agar plates. A detection limit of 0 log CFU/ml was
obtained.
For BHI broth to ham inactivation experiment, each side of sliced ham was inoculated
with 0.5 ml of the stationary phase culture. After the inoculum was spread on most
part of the surface of ham, the bags were vacuumed sealed using a vacuum sealer
(Princess, the Netherlands). To measure the heating up time, a blank sample without
inoculation was also prepared. After the water bath reached the desired temperature
at 65 ± 0.3 °C, the vacuum bag containing the blank sample was immersed in water
with a thermocouple attached to the surface of the sample. When its temperature
reached 65°C, the heating up time was recorded and the inactivation experiment was
immediately started. Since every experiment was conducted using 5 sampling points
including the starting time point of t = 0, four bags of samples were immersed in the
water together at 65°C. At each time point considering the adjusted heating up time
in Section 2.4.2, one bag was taken out of water bath and put into ice water for few
11
seconds to stop the inactivation. The bag was cut open and the ham was diluted
using PPS. The mixture was then homogenized using a stomacher machine for 1 min
at 260 rpm. Further decimal dilutions were then prepared and the appropriate was
plated in duplicate on BHI agar plates using a spiral plater. A detection limit of 1.3 log
CFU/ml was obtained using this method.
For ham to ham inactivation experiment, the samples were directly taken from
growth experiment in Section 2.3.2. All heating procedures followed similar
procedure as previously described.
All the plates were incubated for 4-5 days at 30 °C. The colonies were counted and
reported in log CFU/g. Each experiment was conducted in duplicate on the same day
and reproduced one time on the other day considering the experimental and the
biological variability.
2.4.2 Adjustment of heating up time
During the heating up period, the effect of the increasing temperature from room
temperature to the desired heating temperature of 65°C had the killing power to
Listeria that cannot be totally neglected. To quantify this effect, Eq.⑼ was used to
evaluate the equivalent killing power at other temperatures that was lower than
65°C.
log𝑡
𝐹=
65−𝑇
𝑧⑼
where T is the temperature (°C); t is the thermal death time at temperature T (s); F is
the thermal death time at temperature 65°C (s); z is the temperature for one log10
reduction in the D-value (°C).
By adding these F-values of each temperature point together, the total F was given by
the equation below (Earle & Earle, 2004).
F = 𝑡1 × 10𝑇1−65
𝑧 + 𝑡2 × 10𝑇2−65
𝑧 +⋯ ⑽
By excluding the total F-value from the initially recorded heating up time, a more
accurate adjusted heating up time was applied.
In this study, the heating up time ranged from 30 s to 43 s. To give an example of the
adjustment of L6, 1°C increase in 1 second from room temperature of 25°C to
heating temperature of 65°C with the total heating up process of 40 s was assumed.
Thus t1=t2=…=t40=1s; T1=25°C, T2=26°C, …, T40=64°C; z=5.7°C. The z-value used here
was derived from the study of Aryani et al. (2015). Then the total F was calculated as
2.0 s (Eq.⑽). Therefore by deducting it from the initial 40 s, the adjusted heating up
time was 38.0 s (Mullan, 2007).
However this ideal situation rarely happened in real situation. In most cases of this
study, the higher the surface temperature of ham was, the slower increase of surface
temperature was observed. Therefore if the precise heating up time was required,
observation and record of the variations of temperature during the whole process
was necessary.
12
2.4.3 D-value estimation
The logarithms of colony counts were plotted against the inactivation time to obtain
the inactivation curve of each inactivation experiment. The modified Weibull model
(Metselaar et al., 2013) was fitted to the data of each individual experiment and to
estimate the delta (Δ) decimal reduction time (Δ = 2, 3, 4, 5, 6).
log𝑁𝑡 = log𝑁0 − Δ ∙ (𝑡
Δ𝐷)𝛽
⑾
where Nt is the bacterial concentration (CFU/ml) at time t (s); N0 is the initial
bacterial concentration (CFU/ml); Δ is the number of decimal reductions; ΔD is the
time needed to reduce the initial number of micro-organism with Δ decimals (s); β is
a fitting parameter that defines the shape of a curve; and t is the time (s).
Δ was set at one value of 2, 3, 4, 5 and 6, based on the reduction range of the
experiment. The fitting procedure was done using Microsoft Excel Solver Add-in. The
D-value was then calculated as ΔD / Δ.
2.4.4 Effect of heating media and growth media on inactivation kinetics
The D-values of 3 different strains (L6, FBR15, FBR17) grown in BHI, and then heated
in 3 different media (BHI broth, milk and ham) at 65 °C were compared using ANOVA.
The D-values of 3 different strains (L6, FBR15, FBR17) grown in BHI and food matrix
(milk or ham), and then heated in the same food matrix at 65 °C were compared
using ANOVA and followed with a post hoc Tukey HSD test.
2.5 VBA based tool to predict growth kinetics of Listeria
monocytogenes
In order to give a quick overview of the predicted growth curves of Listeria
monocytogenes for the customers, like food factories who need food safety control, a
preliminary generic tool using VBA based Microsoft Excel program was designed. It
could help the customers to evaluate the safety of production process and find
critical points in the production line without large time investment.
13
3. RESULTS
3.1 Growth experiments
3.1.1 Determination of μmax and λ
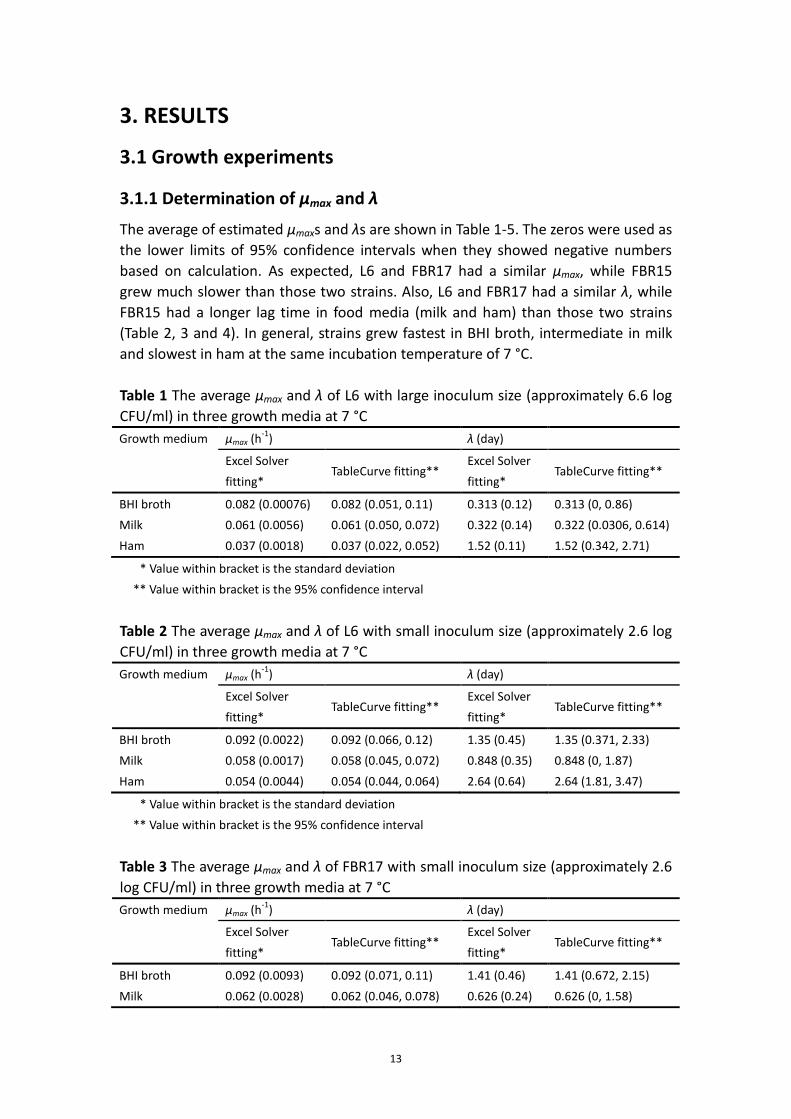
The average of estimated μmaxs and λs are shown in Table 1-5. The zeros were used as
the lower limits of 95% confidence intervals when they showed negative numbers
based on calculation. As expected, L6 and FBR17 had a similar μmax, while FBR15
grew much slower than those two strains. Also, L6 and FBR17 had a similar λ, while
FBR15 had a longer lag time in food media (milk and ham) than those two strains
(Table 2, 3 and 4). In general, strains grew fastest in BHI broth, intermediate in milk
and slowest in ham at the same incubation temperature of 7 °C.
Table 1 The average μmax and λ of L6 with large inoculum size (approximately 6.6 log
CFU/ml) in three growth media at 7 °C
Growth medium μmax (h-1
) λ (day)
Excel Solver
fitting* TableCurve fitting**
Excel Solver
fitting* TableCurve fitting**
BHI broth 0.082 (0.00076) 0.082 (0.051, 0.11) 0.313 (0.12) 0.313 (0, 0.86)
Milk 0.061 (0.0056) 0.061 (0.050, 0.072) 0.322 (0.14) 0.322 (0.0306, 0.614)
Ham 0.037 (0.0018) 0.037 (0.022, 0.052) 1.52 (0.11) 1.52 (0.342, 2.71)
* Value within bracket is the standard deviation
** Value within bracket is the 95% confidence interval
Table 2 The average μmax and λ of L6 with small inoculum size (approximately 2.6 log
CFU/ml) in three growth media at 7 °C
Growth medium μmax (h-1
) λ (day)
Excel Solver
fitting* TableCurve fitting**
Excel Solver
fitting* TableCurve fitting**
BHI broth 0.092 (0.0022) 0.092 (0.066, 0.12) 1.35 (0.45) 1.35 (0.371, 2.33)
Milk 0.058 (0.0017) 0.058 (0.045, 0.072) 0.848 (0.35) 0.848 (0, 1.87)
Ham 0.054 (0.0044) 0.054 (0.044, 0.064) 2.64 (0.64) 2.64 (1.81, 3.47)
* Value within bracket is the standard deviation
** Value within bracket is the 95% confidence interval
Table 3 The average μmax and λ of FBR17 with small inoculum size (approximately 2.6
log CFU/ml) in three growth media at 7 °C
Growth medium μmax (h-1
) λ (day)
Excel Solver
fitting* TableCurve fitting**
Excel Solver
fitting* TableCurve fitting**
BHI broth 0.092 (0.0093) 0.092 (0.071, 0.11) 1.41 (0.46) 1.41 (0.672, 2.15)
Milk 0.062 (0.0028) 0.062 (0.046, 0.078) 0.626 (0.24) 0.626 (0, 1.58)
14
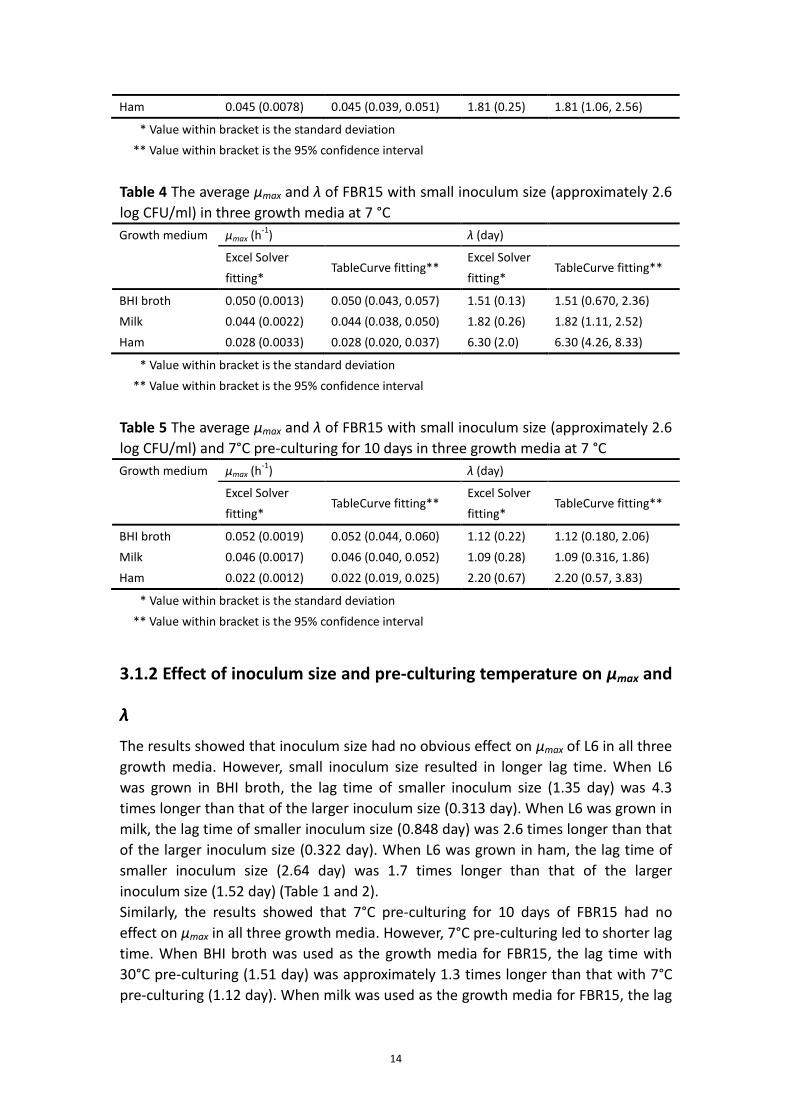
Ham 0.045 (0.0078) 0.045 (0.039, 0.051) 1.81 (0.25) 1.81 (1.06, 2.56)
* Value within bracket is the standard deviation
** Value within bracket is the 95% confidence interval
Table 4 The average μmax and λ of FBR15 with small inoculum size (approximately 2.6
log CFU/ml) in three growth media at 7 °C
Growth medium μmax (h-1
) λ (day)
Excel Solver
fitting* TableCurve fitting**
Excel Solver
fitting* TableCurve fitting**
BHI broth 0.050 (0.0013) 0.050 (0.043, 0.057) 1.51 (0.13) 1.51 (0.670, 2.36)
Milk 0.044 (0.0022) 0.044 (0.038, 0.050) 1.82 (0.26) 1.82 (1.11, 2.52)
Ham 0.028 (0.0033) 0.028 (0.020, 0.037) 6.30 (2.0) 6.30 (4.26, 8.33)
* Value within bracket is the standard deviation
** Value within bracket is the 95% confidence interval
Table 5 The average μmax and λ of FBR15 with small inoculum size (approximately 2.6
log CFU/ml) and 7°C pre-culturing for 10 days in three growth media at 7 °C
Growth medium μmax (h-1
) λ (day)
Excel Solver
fitting* TableCurve fitting**
Excel Solver
fitting* TableCurve fitting**
BHI broth 0.052 (0.0019) 0.052 (0.044, 0.060) 1.12 (0.22) 1.12 (0.180, 2.06)
Milk 0.046 (0.0017) 0.046 (0.040, 0.052) 1.09 (0.28) 1.09 (0.316, 1.86)
Ham 0.022 (0.0012) 0.022 (0.019, 0.025) 2.20 (0.67) 2.20 (0.57, 3.83)
* Value within bracket is the standard deviation
** Value within bracket is the 95% confidence interval
3.1.2 Effect of inoculum size and pre-culturing temperature on μmax and
λ
The results showed that inoculum size had no obvious effect on μmax of L6 in all three
growth media. However, small inoculum size resulted in longer lag time. When L6
was grown in BHI broth, the lag time of smaller inoculum size (1.35 day) was 4.3
times longer than that of the larger inoculum size (0.313 day). When L6 was grown in
milk, the lag time of smaller inoculum size (0.848 day) was 2.6 times longer than that
of the larger inoculum size (0.322 day). When L6 was grown in ham, the lag time of
smaller inoculum size (2.64 day) was 1.7 times longer than that of the larger
inoculum size (1.52 day) (Table 1 and 2).
Similarly, the results showed that 7°C pre-culturing for 10 days of FBR15 had no
effect on μmax in all three growth media. However, 7°C pre-culturing led to shorter lag
time. When BHI broth was used as the growth media for FBR15, the lag time with
30°C pre-culturing (1.51 day) was approximately 1.3 times longer than that with 7°C
pre-culturing (1.12 day). When milk was used as the growth media for FBR15, the lag
15
time with 30°C pre-culturing (1.82 day) was approximately 1.7 times longer than that
with 7°C pre-culturing (1.09 day). When ham was used as the growth media for
FBR15, the lag time with 30°C pre-culturing (6.30 day) was approximately 2.9 times
longer than that with 7°C pre-culturing (2.20 day) (Table 4 and 5).
The result for the two independent samples t-test was provided in Appendix 7.3.
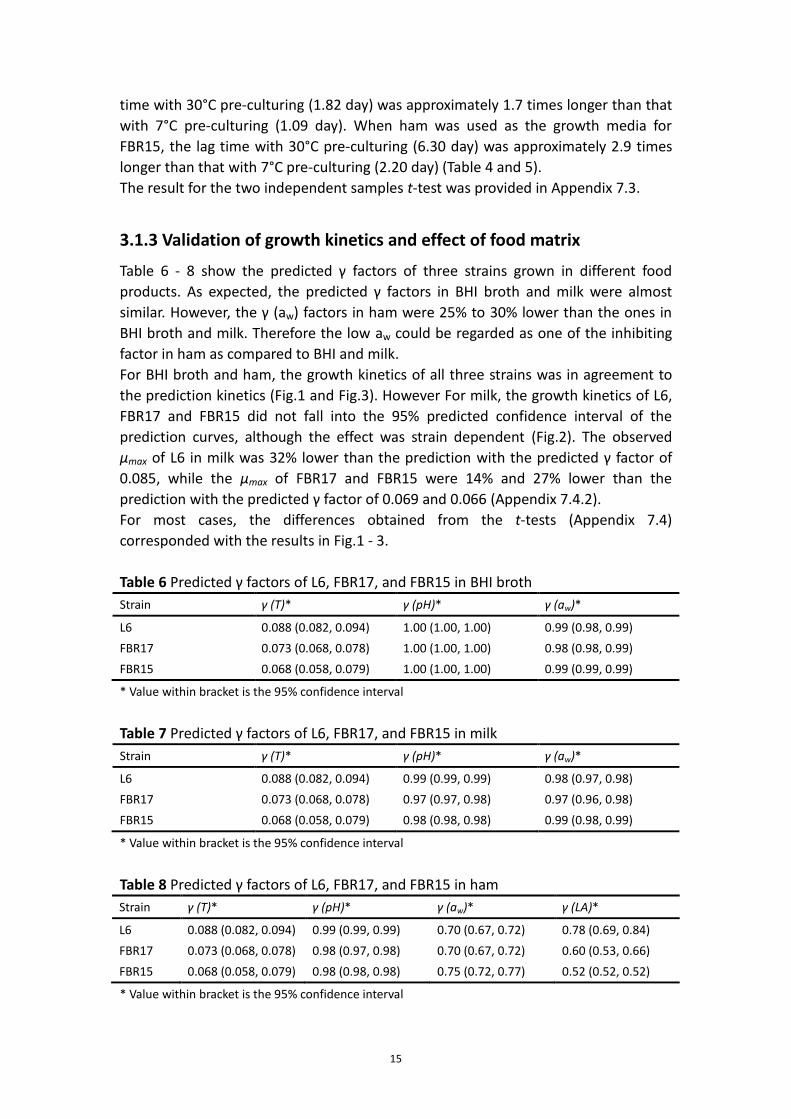
3.1.3 Validation of growth kinetics and effect of food matrix
Table 6 - 8 show the predicted γ factors of three strains grown in different food
products. As expected, the predicted γ factors in BHI broth and milk were almost
similar. However, the γ (aw) factors in ham were 25% to 30% lower than the ones in
BHI broth and milk. Therefore the low aw could be regarded as one of the inhibiting
factor in ham as compared to BHI and milk.
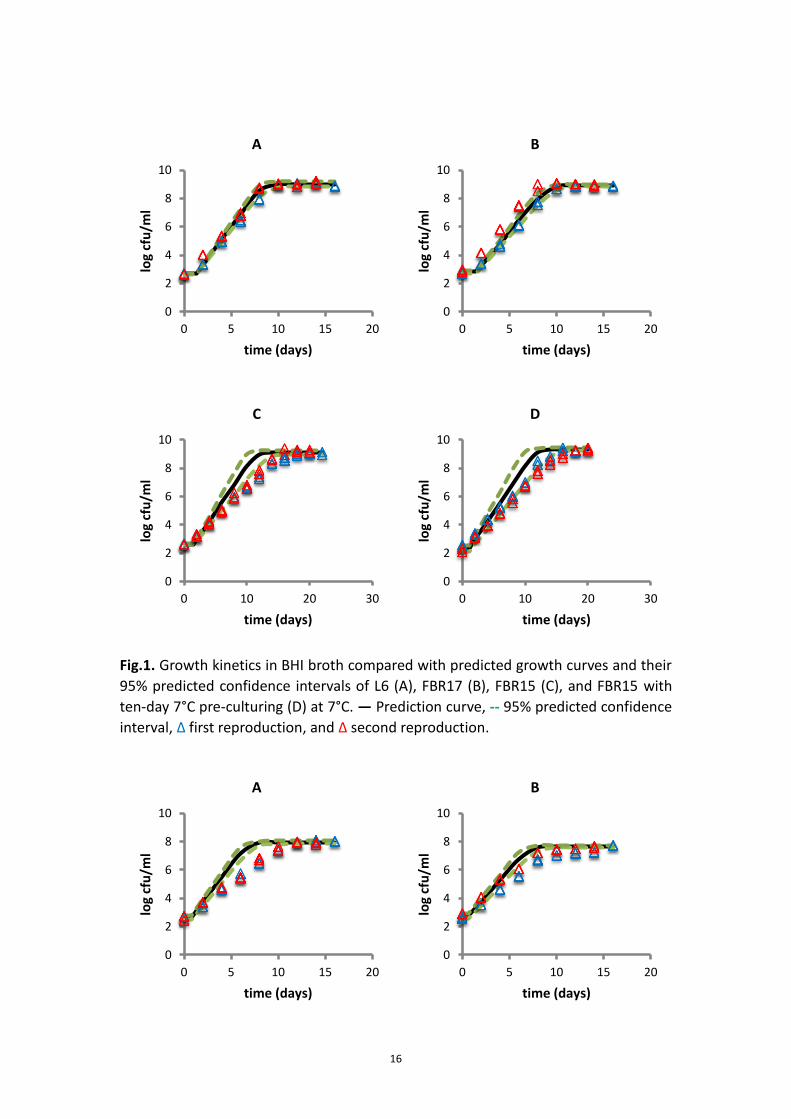
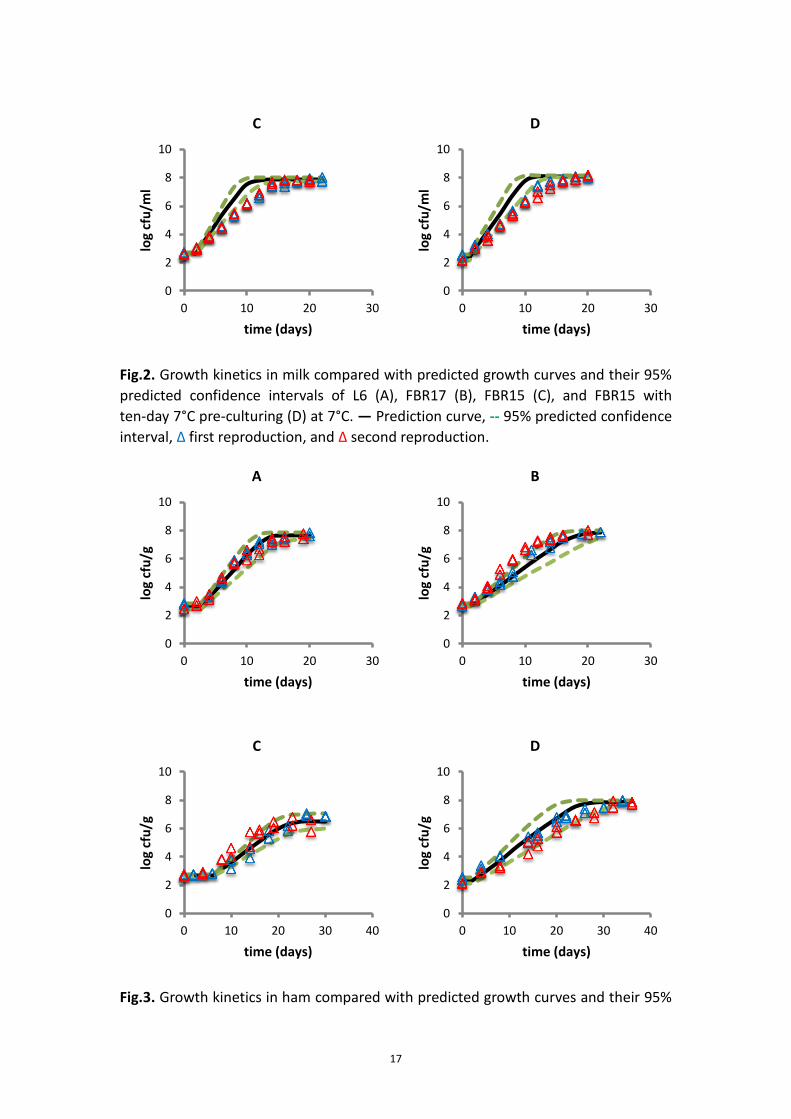
For BHI broth and ham, the growth kinetics of all three strains was in agreement to
the prediction kinetics (Fig.1 and Fig.3). However For milk, the growth kinetics of L6,
FBR17 and FBR15 did not fall into the 95% predicted confidence interval of the
prediction curves, although the effect was strain dependent (Fig.2). The observed
μmax of L6 in milk was 32% lower than the prediction with the predicted γ factor of
0.085, while the μmax of FBR17 and FBR15 were 14% and 27% lower than the
prediction with the predicted γ factor of 0.069 and 0.066 (Appendix 7.4.2).
For most cases, the differences obtained from the t-tests (Appendix 7.4)
corresponded with the results in Fig.1 - 3.
Table 6 Predicted γ factors of L6, FBR17, and FBR15 in BHI broth
Strain γ (T)* γ (pH)* γ (aw)*
L6 0.088 (0.082, 0.094) 1.00 (1.00, 1.00) 0.99 (0.98, 0.99)
FBR17 0.073 (0.068, 0.078) 1.00 (1.00, 1.00) 0.98 (0.98, 0.99)
FBR15 0.068 (0.058, 0.079) 1.00 (1.00, 1.00) 0.99 (0.99, 0.99)
* Value within bracket is the 95% confidence interval
Table 7 Predicted γ factors of L6, FBR17, and FBR15 in milk
Strain γ (T)* γ (pH)* γ (aw)*
L6 0.088 (0.082, 0.094) 0.99 (0.99, 0.99) 0.98 (0.97, 0.98)
FBR17 0.073 (0.068, 0.078) 0.97 (0.97, 0.98) 0.97 (0.96, 0.98)
FBR15 0.068 (0.058, 0.079) 0.98 (0.98, 0.98) 0.99 (0.98, 0.99)
* Value within bracket is the 95% confidence interval
Table 8 Predicted γ factors of L6, FBR17, and FBR15 in ham
Strain γ (T)* γ (pH)* γ (aw)* γ (LA)*
L6 0.088 (0.082, 0.094) 0.99 (0.99, 0.99) 0.70 (0.67, 0.72) 0.78 (0.69, 0.84)
FBR17 0.073 (0.068, 0.078) 0.98 (0.97, 0.98) 0.70 (0.67, 0.72) 0.60 (0.53, 0.66)
FBR15 0.068 (0.058, 0.079) 0.98 (0.98, 0.98) 0.75 (0.72, 0.77) 0.52 (0.52, 0.52)
* Value within bracket is the 95% confidence interval
16
Fig.1. Growth kinetics in BHI broth compared with predicted growth curves and their
95% predicted confidence intervals of L6 (A), FBR17 (B), FBR15 (C), and FBR15 with
ten-day 7°C pre-culturing (D) at 7°C. ― Prediction curve, 95% predicted confidence
interval, Δ first reproduction, and Δ second reproduction.
0
2
4
6
8
10
0 5 10 15 20
log
cfu
/ml
time (days)
A
0
2
4
6
8
10
0 5 10 15 20
log
cfu
/ml
time (days)
B
0
2
4
6
8
10
0 10 20 30
log
cfu
/ml
time (days)
C
0
2
4
6
8
10
0 10 20 30
log
cfu
/ml
time (days)
D
0
2
4
6
8
10
0 5 10 15 20
log
cfu
/ml
time (days)
A
0
2
4
6
8
10
0 5 10 15 20
log
cfu
/ml
time (days)
B
17
Fig.2. Growth kinetics in milk compared with predicted growth curves and their 95%
predicted confidence intervals of L6 (A), FBR17 (B), FBR15 (C), and FBR15 with
ten-day 7°C pre-culturing (D) at 7°C. ― Prediction curve, 95% predicted confidence
interval, Δ first reproduction, and Δ second reproduction.
Fig.3. Growth kinetics in ham compared with predicted growth curves and their 95%
0
2
4
6
8
10
0 10 20 30
log
cfu
/ml
time (days)
C
0
2
4
6
8
10
0 10 20 30
log
cfu
/ml
time (days)
D
0
2
4
6
8
10
0 10 20 30
log
cfu
/g
time (days)
A
0
2
4
6
8
10
0 10 20 30
log
cfu
/g
time (days)
B
0
2
4
6
8
10
0 10 20 30 40
log
cfu
/g
time (days)
C
0
2
4
6
8
10
0 10 20 30 40
log
cfu
/g
time (days)
D
18
predicted confidence intervals of L6 (A), FBR17 (B), FBR15 (C), and FBR15 with
ten-day 7°C pre-culturing (D) at 7°C. ― Prediction curve, 95% predicted confidence
interval, Δ first reproduction, and Δ second reproduction.
3.2 Inactivation experiments
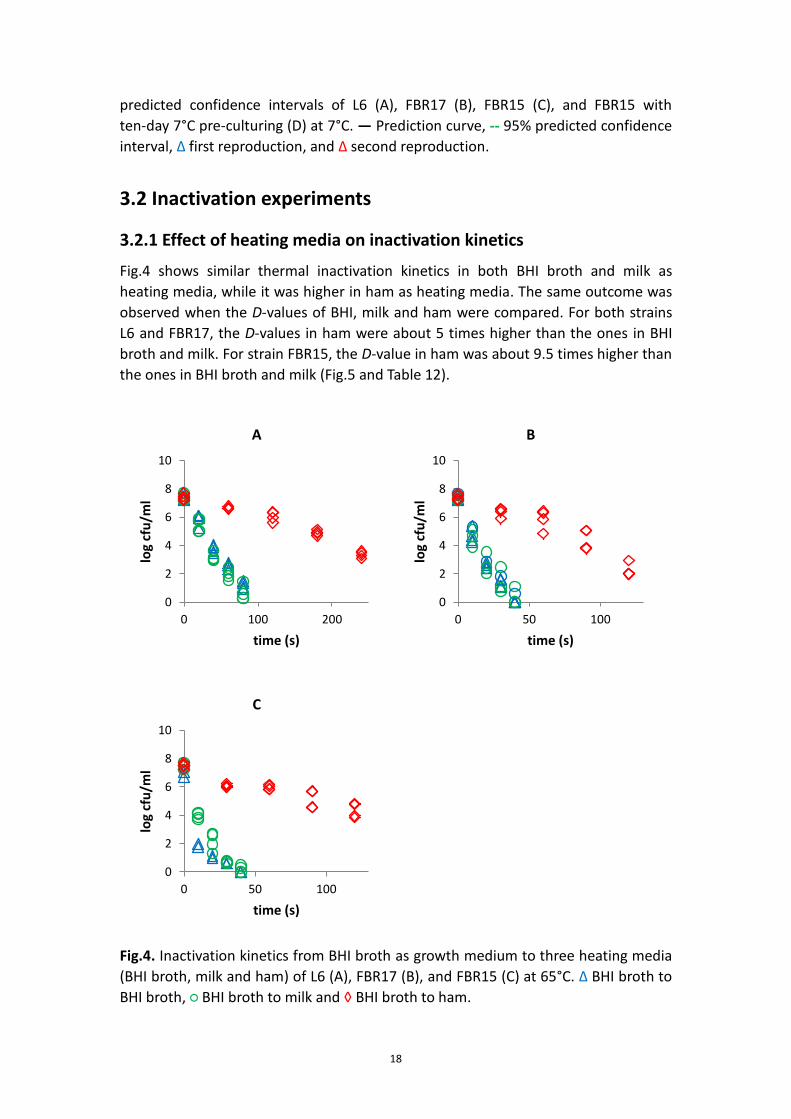
3.2.1 Effect of heating media on inactivation kinetics
Fig.4 shows similar thermal inactivation kinetics in both BHI broth and milk as
heating media, while it was higher in ham as heating media. The same outcome was
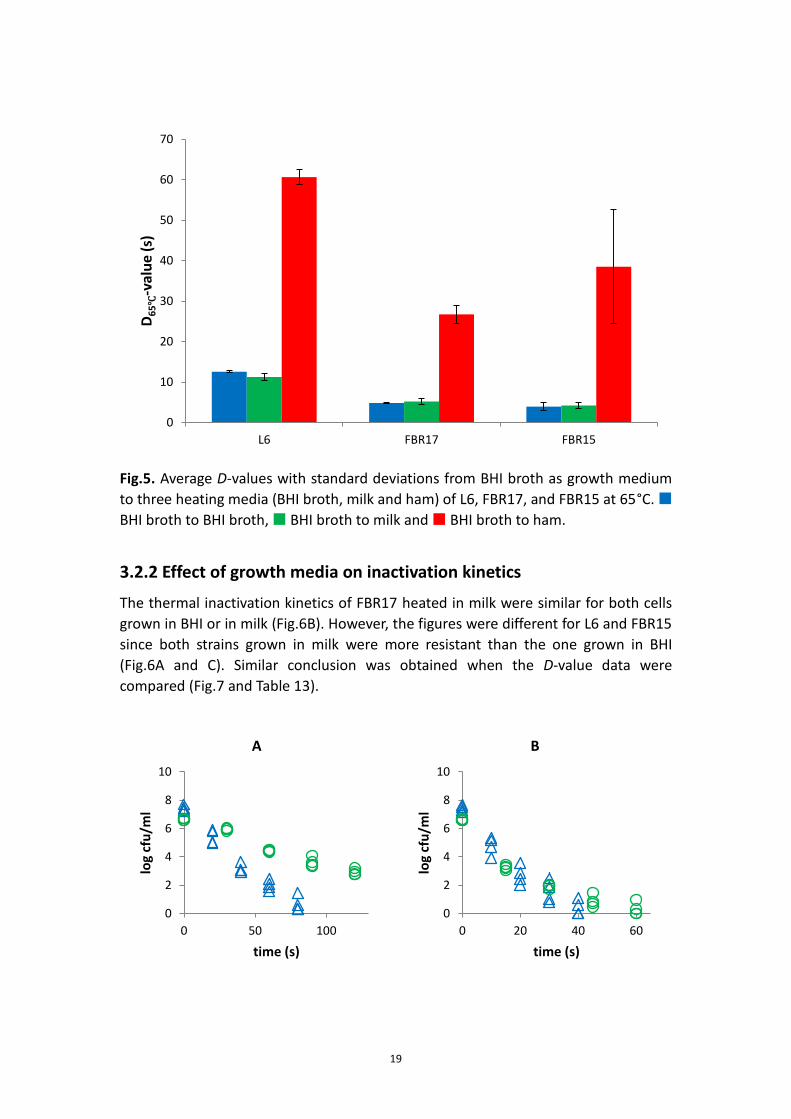
observed when the D-values of BHI, milk and ham were compared. For both strains
L6 and FBR17, the D-values in ham were about 5 times higher than the ones in BHI
broth and milk. For strain FBR15, the D-value in ham was about 9.5 times higher than
the ones in BHI broth and milk (Fig.5 and Table 12).
Fig.4. Inactivation kinetics from BHI broth as growth medium to three heating media
(BHI broth, milk and ham) of L6 (A), FBR17 (B), and FBR15 (C) at 65°C. Δ BHI broth to
BHI broth, ○ BHI broth to milk and ◊ BHI broth to ham.
0
2
4
6
8
10
0 100 200
log
cfu
/ml
time (s)
A
0
2
4
6
8
10
0 50 100
log
cfu
/ml
time (s)
B
0
2
4
6
8
10
0 50 100
log
cfu
/ml
time (s)
C
19
Fig.5. Average D-values with standard deviations from BHI broth as growth medium
to three heating media (BHI broth, milk and ham) of L6, FBR17, and FBR15 at 65°C.
BHI broth to BHI broth, BHI broth to milk and BHI broth to ham.
3.2.2 Effect of growth media on inactivation kinetics
The thermal inactivation kinetics of FBR17 heated in milk were similar for both cells
grown in BHI or in milk (Fig.6B). However, the figures were different for L6 and FBR15
since both strains grown in milk were more resistant than the one grown in BHI
(Fig.6A and C). Similar conclusion was obtained when the D-value data were
compared (Fig.7 and Table 13).
0
10
20
30
40
50
60
70
L6 FBR17 FBR15
D6
5℃
-val
ue
(s)
0
2
4
6
8
10
0 50 100
log
cfu
/ml
time (s)
A
0
2
4
6
8
10
0 20 40 60
log
cfu
/ml
time (s)
B

20
Fig.6. Inactivation kinetics from two growth media (BHI broth and milk) to milk as
heating medium of L6 (A), FBR17 (B), and FBR15 (C) at 65°C. Δ BHI broth to milk and
○ milk to milk.
Fig.7. Average D-values with standard deviations from two growth media (BHI broth
and milk) to milk as heating medium of L6, FBR17, and FBR15 at 65°C. BHI broth to
milk and milk to milk.
For ham, the inactivation kinetics of FBR17 and FBR15 grown in BHI and ham was
also similar (Fig.8B and C). However strain L6 grown in ham was more resistant than
that of grown in BHI (Fig.8A). Similar outcome was obtained when the D-value data
were compared (Fig.9 and Table 14).
0
2
4
6
8
10
0 20 40 60
log
cfu
/ml
time (s)
C
0
5
10
15
20
25
30
35
L6 FBR17 FBR15
D6
5℃
-val
ue
(s)
21
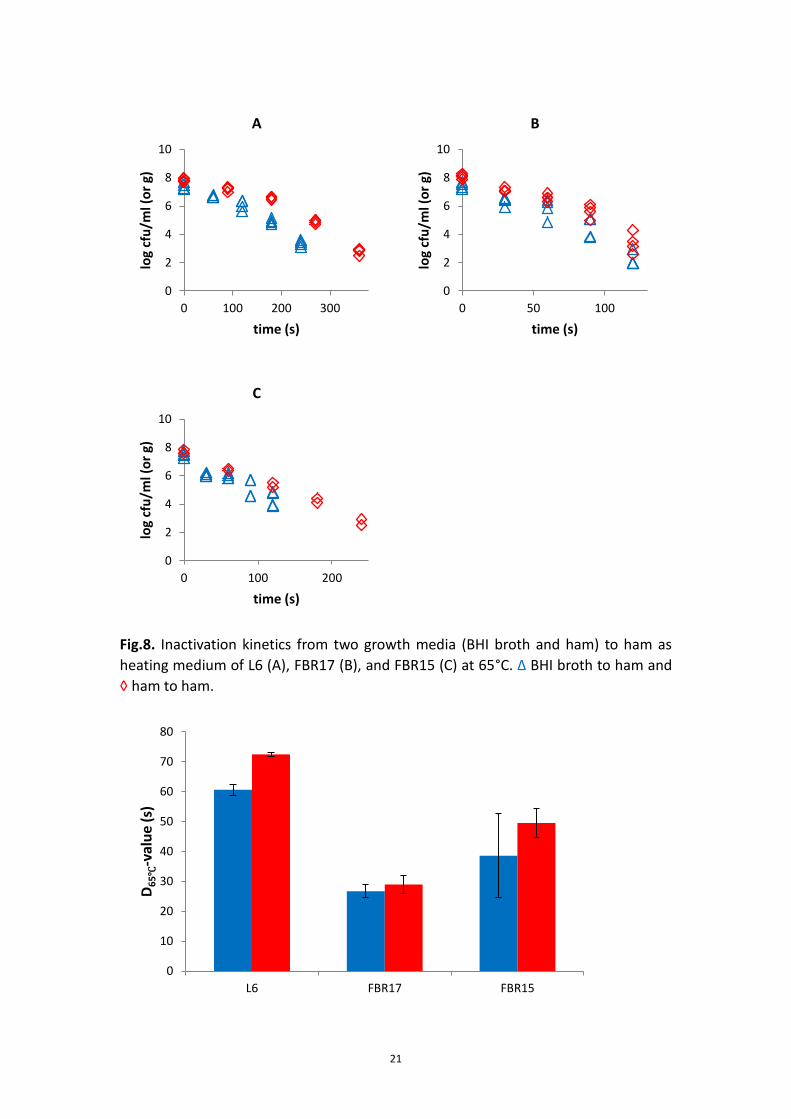
Fig.8. Inactivation kinetics from two growth media (BHI broth and ham) to ham as
heating medium of L6 (A), FBR17 (B), and FBR15 (C) at 65°C. Δ BHI broth to ham and
◊ ham to ham.
0
2
4
6
8
10
0 100 200 300
log
cfu
/ml (
or
g)
time (s)
A
0
2
4
6
8
10
0 50 100
log
cfu
/ml (
or
g)
time (s)
B
0
2
4
6
8
10
0 100 200
log
cfu
/ml (
or
g)
time (s)
C
0
10
20
30
40
50
60
70
80
L6 FBR17 FBR15
D6
5℃
-val
ue
(s)
22
Fig.9. Average D-values with standard deviations from two growth media (BHI broth
and ham) to ham as heating medium of L6, FBR17, and FBR15 at 65°C. BHI broth
to ham and ham to ham.
3.3 VBA based tool to predict growth kinetics of Listeria
monocytogenes
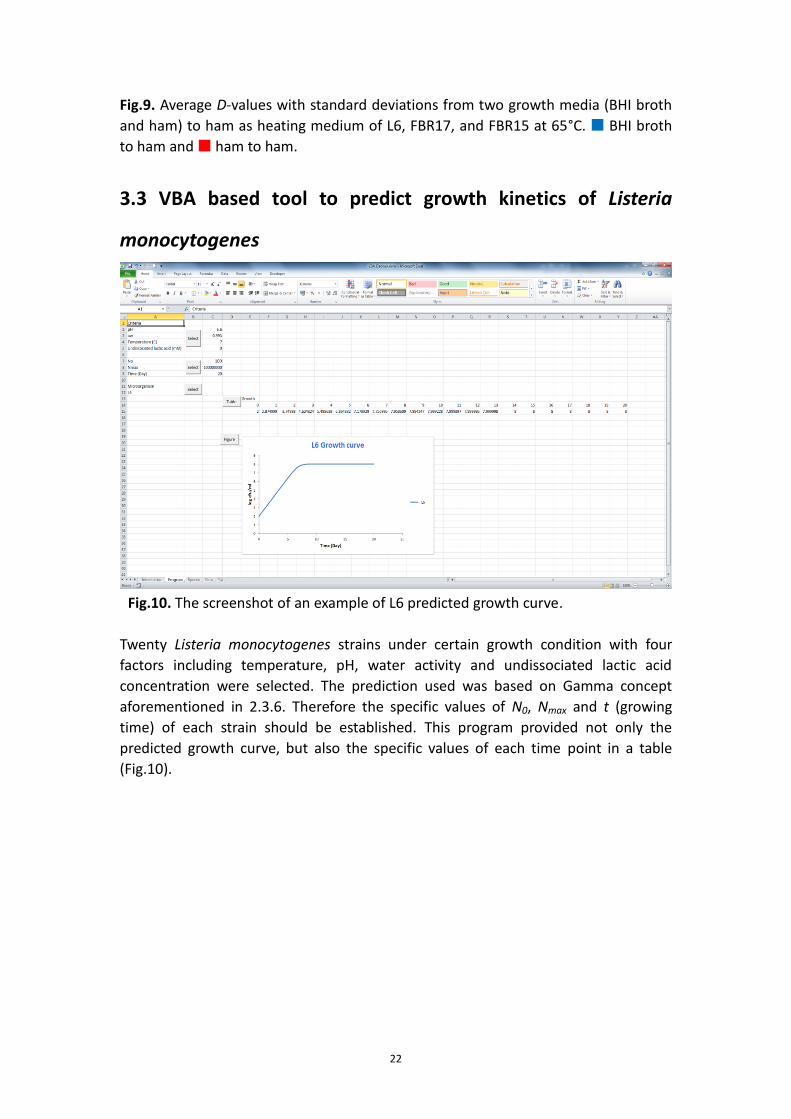
Fig.10. The screenshot of an example of L6 predicted growth curve.
Twenty Listeria monocytogenes strains under certain growth condition with four
factors including temperature, pH, water activity and undissociated lactic acid
concentration were selected. The prediction used was based on Gamma concept
aforementioned in 2.3.6. Therefore the specific values of N0, Nmax and t (growing
time) of each strain should be established. This program provided not only the
predicted growth curve, but also the specific values of each time point in a table
(Fig.10).

23
4. DISSCUSSION
4.1 Effect of inoculum size and pre-culturing temperature on
μmax and λ
In the present study, small inoculum size of L6 extended the lag time under
suboptimal growth condition at 7°C. This result was in agreement with the result of a
study using Scott A grown at 7°C (Augustin et al., 2000) and Scott A and V7
pre-cultured at 4°C and grown at 14°C (Gay et al., 1996). Similarly, a study using
tryptone soya broth (TSB) with 1.2 M NaCl as an inhibiting factor also reported an
increased lag time of NCTC 11994 as the inoculum size became smaller. However, it
was also reported that the lag times were little affected by the inoculum size under
optimum growth conditions (Robinson et al., 2001). This was supported by a
previous study using NCTC 11994 grown at 30°C (Duffy et al., 1994). Larger inoculum
size resulting in short lag time might be attributed to the contribution of
subpopulation group with shortest lag time since they began to propagate faster
than the other subpopulations (Baranyi, 1998).
Apart from the inoculum size, low temperature pre-culturing could shorten the lag
time under suboptimal growth condition. Previous study reported that additional
pre-culturing at 4°C could induce a great reduction in the lag time for NCTC 11994
incubated at 30°C (Walker et al., 1990). Similarly, another study using Scott A grown
in UHT milk and canned dog food at 5°C showed significant increase of lag time when
higher pre-culturing temperature was used (Buchanan & Klawitter, 1991). This report
was in agreement with current finding since the lag time of FBR15 grown in BHI, milk
and ham at 7°C reduced when the cells were pre-cultured at the same temperature
prior to inoculation.
In the present study, inoculum size of L6 had no influence on the maximum specific
growth rate (μmax). This result was in agreement with the result of a previous study
using NCTC 11994 grown at 30°C (Duffy et al., 1994). Moreover, low temperature
pre-culturing (7°C) also did not affect maximum growth rate of FBR15 in the current
study as well. Likewise, no obvious difference in μmax was observed for Scott A grown
at 5°C when it was pre-cultured at two different temperatures (30°C and 4°C)
(Buchanan & Klawitter, 1991). However, these results contradicted with some other
studies, which reported that low temperature pre-culturing could result in higher
maximum growth rate (Membré et al., 1999; Walker et al., 1990).
4.2 Validation of growth kinetics and effect of food matrix
From this validation study, it was suggested that the growth rates were similar
between the prediction and actual behavior in BHI broth. The only inhibiting factor
was low incubation temperature (7°C) since BHI broth was the ideal media for
Listeria monocytogenes. Likewise, all the strains had a similar growth kinetics to the
prediction in ham, although it had more inhibiting factors such as nitrate (Junttila et
24
al., 1989). For meat products, a previous literature study reported that the μmax of
Listeria predicted using Gamma concept were smaller than the observed μmax under
unfavorable conditions, like low temperatures (Te Giffel & Zwietering, 1999), which
was not in agreement with the result of our study.
However the observed growth rate was smaller than prediction in milk, because the
essential nutrients for Listeria might not be sufficiently available. For example, the
lactose in milk could not be utilized by Listeria monocytogenes (Pine et al., 1989).
Moreover, the milk used in this study was the skim milk containing no fat according
to the description in the label. Based on a previous study using F 5069 strain, the
growth rate in whole milk was significantly higher than in skim milk and 11% nonfat
milk solids at 10°C and 4°C (Donnelly & Briggs, 1986). Therefore milkfat as a food
product factor that could influence the growth rate was excluded by using skim milk
in this study. Another study using NCTC 5348 reported lower observed μmax than the
prediction in pasteurized milk and UHT milk at low temperatures (Murphy et al.,
1996), which correspond to the finding of current study.
4.3 Effect of heating media and growth media on inactivation
kinetics
The D-values of three strains inactivated in ham were much higher than the ones in
BHI broth and milk from the same growth media (BHI broth). This result was in
agreement with the result of a previous study using L. innocua M1 inactivated at
65°C. The average D-value was 1.71 min in ground chicken breast meat, which was
much higher than the average D-value of 0.252 min in 0.1% peptone-agar solution
(Murphy et al., 2000). The increased thermal tolerance in ham might be induced by
sub-lethal heat shock due to relatively much longer heating procedure compared to
heating in BHI broth and milk (Carlier et al., 1996; Fedio & Jackson, 1989; Pagán et al.,
1997).

25
5. CONCLUSION - The growth study showed that the inoculum size of L6 grown at 7°C had no
obvious effect on maximum growth rate. However, small inoculum size extended
the lag time under suboptimal growth condition at 7°C.
- Ten-day pre-culturing at 7°C of FBR15 grown at 7°C had no significant effect on
maximum growth rate, while it shortened the lag time.
- The validation study of all three strains grown at 7°C indicated that the growth
rates were similar between the prediction and actual behavior in both BHI broth
and ham. However the observed growth rates were 14% to 32% smaller than the
prediction in milk based on different strains.
- The inactivation study revealed that D65°C-values of L6 and FBR17 inactivated in
ham were 5 times higher than the ones inactivated in BHI broth and milk.
D65°C-value of FBR15 inactivated in ham was 9.5 times higher than the ones
inactivated in BHI broth and milk. D65°C-values of all three strains grown in milk
and ham were higher than the one grown in BHI broth.
26
6. RECOMMENDATION In the present study, the maximum growth rate and lag time were estimated by
fitting growth curves with Gompertz model. However a study reported that the
maximum specific growth rates were systematically overestimated by Gompertz
function in certain previous studies (Membré et al., 1999). Therefore the Baranyi
model (Eq.⑿) was suggested to be used (den Besten et al., 2006).
log𝑁𝑡 = log𝑁0 +𝜇
ln10∙ 𝐴𝑡 −
1
ln10∙ ln [1 +
𝑒𝑥𝑝(𝜇∙𝐴𝑡)−1
10(log𝑁𝑓𝑖𝑛𝑎𝑙−log𝑁0)
] ⑿
where Nt is the bacterial concentration (CFU/ml) at time t (min); N0 is the initial
bacterial concentration (CFU/ml); Nfinal is the final bacterial concentration (CFU/ml);
μ is the maximum specific growth rate (per min); t is the time (min); At is defined by
Eq.⒀.
𝐴𝑡 = t +1
𝜇∙ ln[𝑒𝑥𝑝(−𝜇 ∙ 𝑡) + 𝑒𝑥𝑝(−𝜇 ∙ 𝜆) − 𝑒𝑥𝑝(−𝜇 ∙ 𝑡 − 𝜇 ∙ 𝜆)] ⒀
where λ is the duration of the lag period of the growth curve (min).
In addition, it might also be useful to investigate the effect of shaking condition on
growth in BHI broth. In current study, all the strains were incubated statically at 7°C.
Based on a previous study using Scott A and F6861 at pH 4.5 and 20°C, larger growth
rate was observed under the growth condition filled with air than with nitrogen
(George & Lund, 1992). However, another study showed that there was no obvious
difference of the maximum specific growth rate or lag phase of NCTC 11994 between
duration for non-aerated and aerated condition at 30°C (Duffy et al., 1994).

27
7. APPENDIX
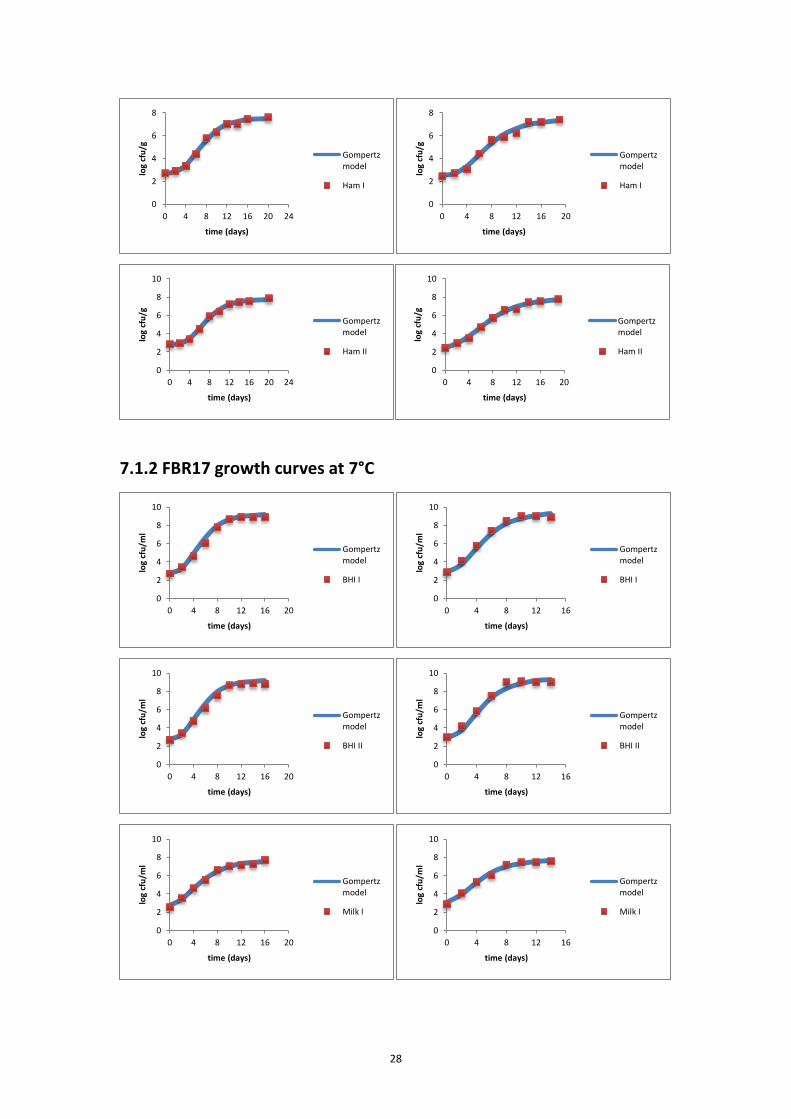
7.1 Figures of fitting Gompertz model to growth curves using
Excel Solver Add-in
7.1.1 L6 growth curves at 7°C
0
2
4
6
8
10
0 4 8 12 16 20
log
cfu
/ml
time (days)
Gompertzmodel
BHI I
0
2
4
6
8
10
0 4 8 12 16
log
cfu
/ml
time (days)
Gompertzmodel
BHI I
0
2
4
6
8
10
0 4 8 12 16 20
log
cfu
/ml
time (days)
Gompertzmodel
BHI II
0
2
4
6
8
10
0 4 8 12 16
log
cfu
/ml
time (days)
Gompertzmodel
BHI II
0
2
4
6
8
10
0 4 8 12 16 20
log
cfu
/ml
time (days)
Gompertzmodel
Milk I
0
2
4
6
8
10
0 4 8 12 16
log
cfu
/ml
time (days)
Gompertzmodel
Milk I
0
2
4
6
8
10
0 4 8 12 16 20
log
cfu
/ml
time (days)
Gompertzmodel
Milk II
0
2
4
6
8
10
0 4 8 12 16
log
cfu
/ml
time (days)
Gompertzmodel
Milk II
28
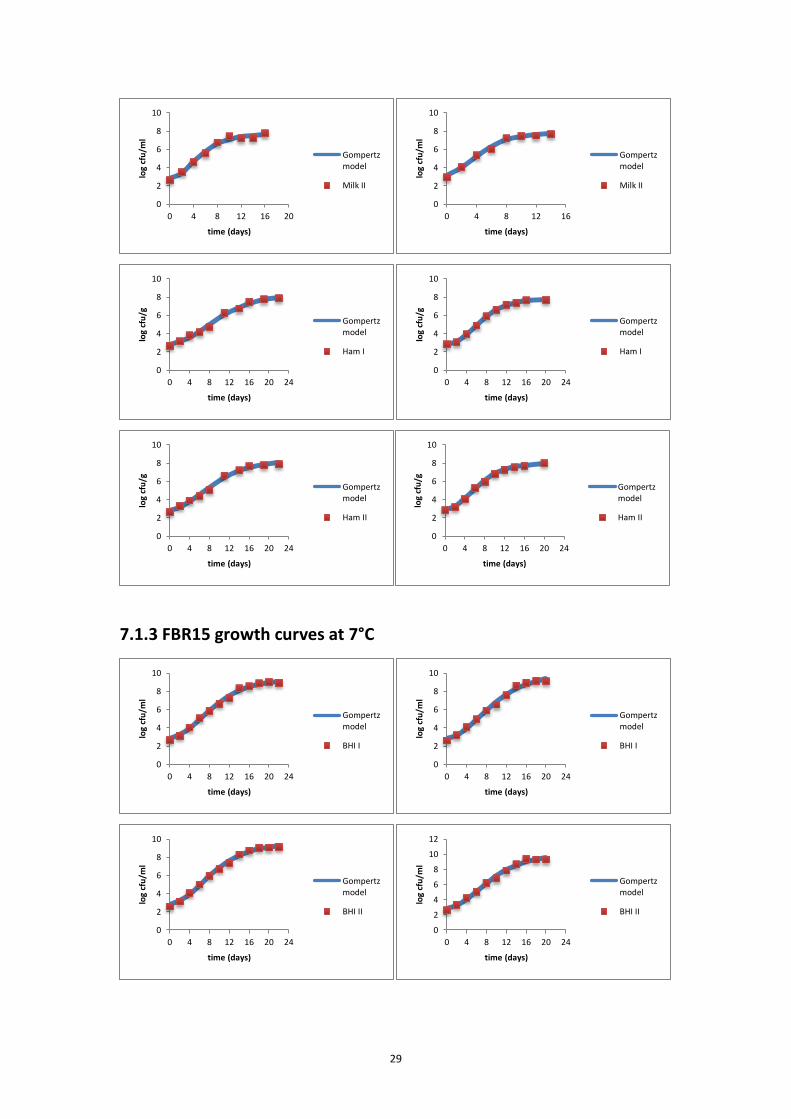
7.1.2 FBR17 growth curves at 7°C
0
2
4
6
8
0 4 8 12 16 20 24
log
cfu
/g
time (days)
Gompertzmodel
Ham I
0
2
4
6
8
0 4 8 12 16 20
log
cfu
/g
time (days)
Gompertzmodel
Ham I
0
2
4
6
8
10
0 4 8 12 16 20 24
log
cfu
/g
time (days)
Gompertzmodel
Ham II
0
2
4
6
8
10
0 4 8 12 16 20
log
cfu
/g
time (days)
Gompertzmodel
Ham II
0
2
4
6
8
10
0 4 8 12 16 20
log
cfu
/ml
time (days)
Gompertzmodel
BHI I
0
2
4
6
8
10
0 4 8 12 16
log
cfu
/ml
time (days)
Gompertzmodel
BHI I
0
2
4
6
8
10
0 4 8 12 16 20
log
cfu
/ml
time (days)
Gompertzmodel
BHI II
0
2
4
6
8
10
0 4 8 12 16
log
cfu
/ml
time (days)
Gompertzmodel
BHI II
0
2
4
6
8
10
0 4 8 12 16 20
log
cfu
/ml
time (days)
Gompertzmodel
Milk I
0
2
4
6
8
10
0 4 8 12 16
log
cfu
/ml
time (days)
Gompertzmodel
Milk I
29
7.1.3 FBR15 growth curves at 7°C
0
2
4
6
8
10
0 4 8 12 16 20
log
cfu
/ml
time (days)
Gompertzmodel
Milk II
0
2
4
6
8
10
0 4 8 12 16
log
cfu
/ml
time (days)
Gompertzmodel
Milk II
0
2
4
6
8
10
0 4 8 12 16 20 24
log
cfu
/g
time (days)
Gompertzmodel
Ham I
0
2
4
6
8
10
0 4 8 12 16 20 24
log
cfu
/g
time (days)
Gompertzmodel
Ham I
0
2
4
6
8
10
0 4 8 12 16 20 24
log
cfu
/g
time (days)
Gompertzmodel
Ham II
0
2
4
6
8
10
0 4 8 12 16 20 24
log
cfu
/g
time (days)
Gompertzmodel
Ham II
0
2
4
6
8
10
0 4 8 12 16 20 24
log
cfu
/ml
time (days)
Gompertzmodel
BHI I
0
2
4
6
8
10
0 4 8 12 16 20 24
log
cfu
/ml
time (days)
Gompertzmodel
BHI I
0
2
4
6
8
10
0 4 8 12 16 20 24
log
cfu
/ml
time (days)
Gompertzmodel
BHI II
0
2
4
6
8
10
12
0 4 8 12 16 20 24
log
cfu
/ml
time (days)
Gompertzmodel
BHI II

30
7.1.4 FBR15 growth curves at 7°C with 7°C pre-culturing for 10 days
0
2
4
6
8
10
0 4 8 12 16 20 24
log
cfu
/ml
time (days)
Gompertzmodel
Milk I
0
2
4
6
8
10
0 4 8 12 16 20 24
log
cfu
/ml
time (days)
Gompertzmodel
Milk I
0
2
4
6
8
10
0 4 8 12 16 20 24
log
cfu
/ml
time (days)
Gompertzmodel
Milk II
0
2
4
6
8
10
0 4 8 12 16 20 24
log
cfu
/ml
time (days)
Gompertzmodel
Milk II
0
2
4
6
8
0 4 8 12 16 20 24 28 32
log
cfu
/g
time (days)
Gompertzmodel
Ham I
0
1
2
3
4
5
6
7
0 4 8 12 16 20 24 28 32
log
cfu
/g
time (days)
Gompertzmodel
Ham I
0
2
4
6
8
0 4 8 12 16 20 24 28 32
log
cfu
/g
time (days)
Gompertzmodel
Ham II
0
2
4
6
8
0 4 8 12 16 20 24 28 32
log
cfu
/g
time (days)
Gompertzmodel
Ham II
0
2
4
6
8
10
0 4 8 12 16 20 24
log
cfu
/ml
time (days)
Gompertzmodel
BHI I
0
2
4
6
8
10
0 4 8 12 16 20 24
log
cfu
/ml
time (days)
Gompertzmodel
BHI I

31
0
2
4
6
8
10
12
0 4 8 12 16 20 24
log
cfu
/ml
time (days)
Gompertzmodel
BHI II
0
2
4
6
8
10
12
0 4 8 12 16 20 24
log
cfu
/ml
time (days)
Gompertzmodel
BHI II
0
2
4
6
8
10
0 4 8 12 16 20 24
log
cfu
/ml
time (days)
Gompertzmodel
Milk I
0
2
4
6
8
10
0 4 8 12 16 20 24
log
cfu
/ml
time (days)
Gompertzmodel
Milk I
0
2
4
6
8
10
0 4 8 12 16 20 24
log
cfu
/ml
time (days)
Gompertzmodel
Milk II
0
2
4
6
8
10
0 4 8 12 16 20 24
log
cfu
/ml
time (days)
Gompertzmodel
Milk II
0
2
4
6
8
10
0 4 8 12 16 20 24 28 32 36
log
cfu
/g
time (days)
Gompertzmodel
Ham I
0
2
4
6
8
10
0 4 8 12 16 20 24 28 32 36 40
log
cfu
/g
time (days)
Gompertzmodel
Ham I
0
2
4
6
8
10
0 4 8 12 16 20 24 28 32 36
log
cfu
/g
time (days)
Gompertzmodel
Ham II
0
2
4
6
8
10
0 4 8 12 16 20 24 28 32 36 40
log
cfu
/g
time (days)
Gompertzmodel
Ham II
32
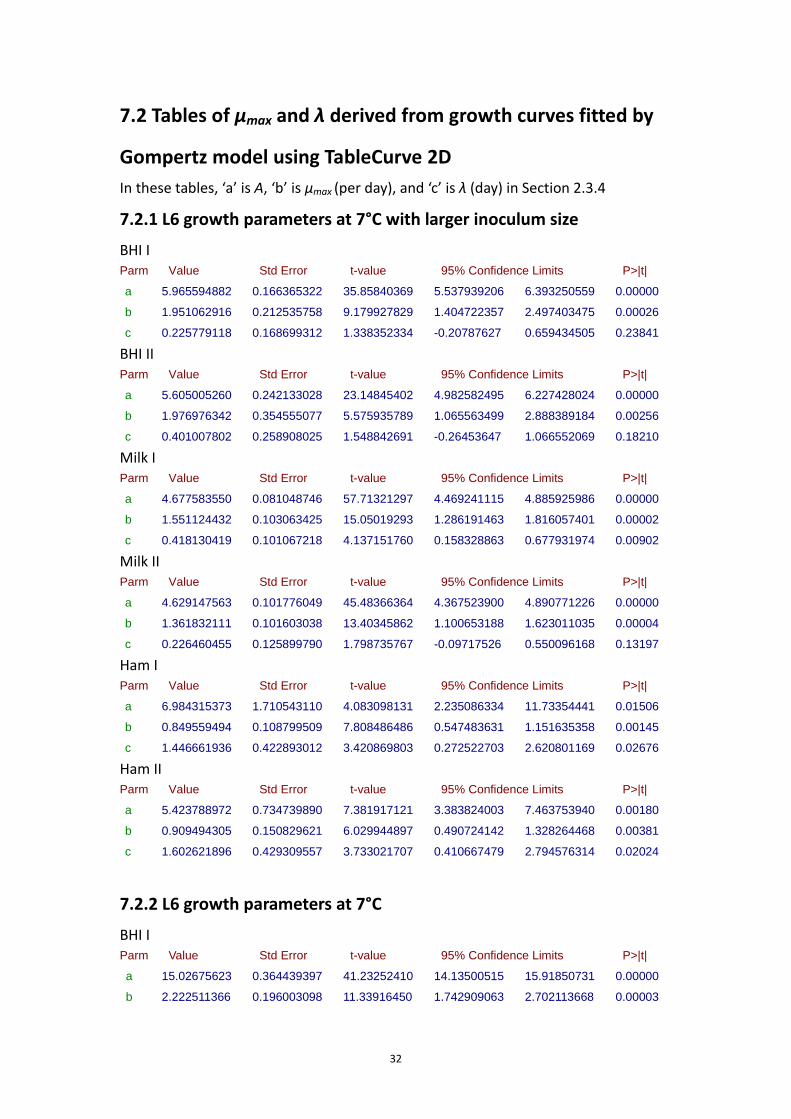
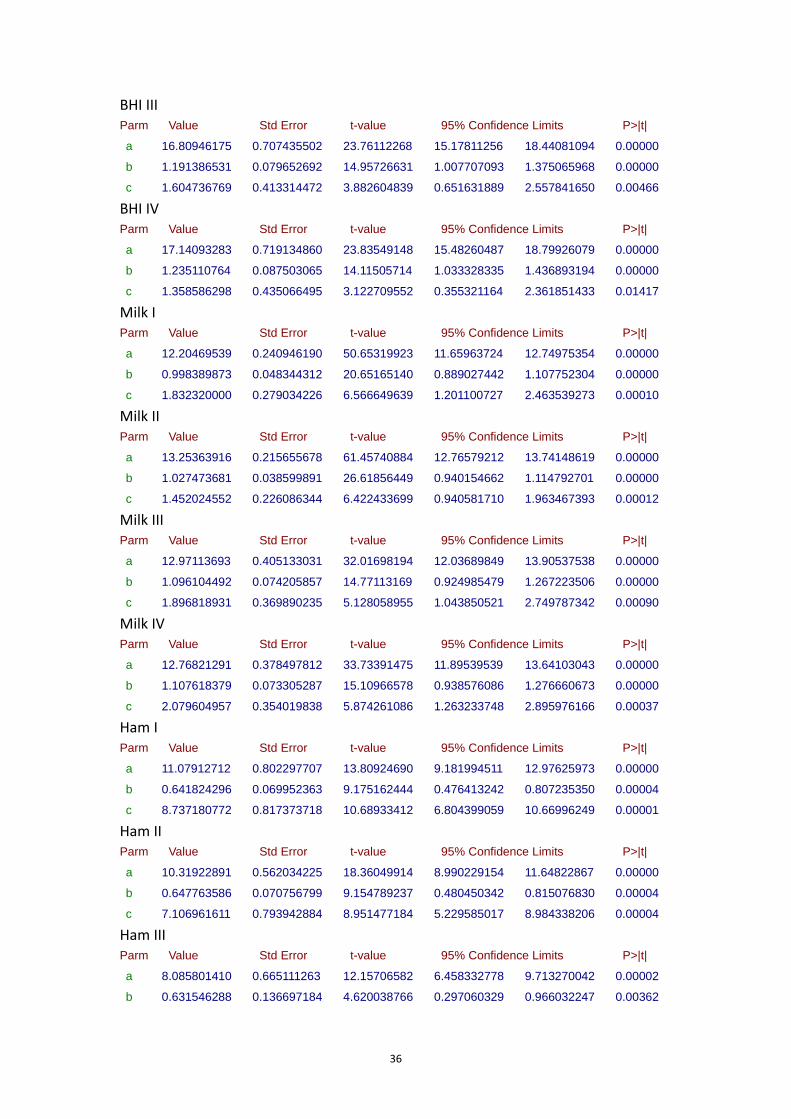
7.2 Tables of μmax and λ derived from growth curves fitted by
Gompertz model using TableCurve 2D
In these tables, ‘a’ is A, ‘b’ is μmax (per day), and ‘c’ is λ (day) in Section 2.3.4
7.2.1 L6 growth parameters at 7°C with larger inoculum size
BHI I Parm Value Std Error t-value 95% Confidence Limits P>|t|
a 5.965594882 0.166365322 35.85840369 5.537939206 6.393250559 0.00000
b 1.951062916 0.212535758 9.179927829 1.404722357 2.497403475 0.00026
c 0.225779118 0.168699312 1.338352334 -0.20787627 0.659434505 0.23841
BHI II Parm Value Std Error t-value 95% Confidence Limits P>|t|
a 5.605005260 0.242133028 23.14845402 4.982582495 6.227428024 0.00000
b 1.976976342 0.354555077 5.575935789 1.065563499 2.888389184 0.00256
c 0.401007802 0.258908025 1.548842691 -0.26453647 1.066552069 0.18210
Milk I Parm Value Std Error t-value 95% Confidence Limits P>|t|
a 4.677583550 0.081048746 57.71321297 4.469241115 4.885925986 0.00000
b 1.551124432 0.103063425 15.05019293 1.286191463 1.816057401 0.00002
c 0.418130419 0.101067218 4.137151760 0.158328863 0.677931974 0.00902
Milk II Parm Value Std Error t-value 95% Confidence Limits P>|t|
a 4.629147563 0.101776049 45.48366364 4.367523900 4.890771226 0.00000
b 1.361832111 0.101603038 13.40345862 1.100653188 1.623011035 0.00004
c 0.226460455 0.125899790 1.798735767 -0.09717526 0.550096168 0.13197
Ham I Parm Value Std Error t-value 95% Confidence Limits P>|t|
a 6.984315373 1.710543110 4.083098131 2.235086334 11.73354441 0.01506
b 0.849559494 0.108799509 7.808486486 0.547483631 1.151635358 0.00145
c 1.446661936 0.422893012 3.420869803 0.272522703 2.620801169 0.02676
Ham II Parm Value Std Error t-value 95% Confidence Limits P>|t|
a 5.423788972 0.734739890 7.381917121 3.383824003 7.463753940 0.00180
b 0.909494305 0.150829621 6.029944897 0.490724142 1.328264468 0.00381
c 1.602621896 0.429309557 3.733021707 0.410667479 2.794576314 0.02024
7.2.2 L6 growth parameters at 7°C
BHI I Parm Value Std Error t-value 95% Confidence Limits P>|t|
a 15.02675623 0.364439397 41.23252410 14.13500515 15.91850731 0.00000
b 2.222511366 0.196003098 11.33916450 1.742909063 2.702113668 0.00003

33
c 1.724176225 0.299343800 5.759852797 0.991708333 2.456644116 0.00119
BHI II Parm Value Std Error t-value 95% Confidence Limits P>|t|
a 15.02445194 0.419091933 35.85001466 13.99897093 16.04993296 0.00000
b 2.237960907 0.228584023 9.790539521 1.678635954 2.797285861 0.00007
c 1.750033681 0.344622485 5.078118105 0.906772838 2.593294523 0.00227
BHI III Parm Value Std Error t-value 95% Confidence Limits P>|t|
a 15.55578996 0.702911018 22.13052516 13.74889966 17.36268026 0.00000
b 2.129753815 0.280163926 7.601813148 1.409569515 2.849938116 0.00063
c 0.923086901 0.465550189 1.982787083 -0.27364796 2.119821763 0.10421
BHI IV Parm Value Std Error t-value 95% Confidence Limits P>|t|
a 15.41324717 0.639572172 24.09930864 13.76917455 17.05731978 0.00000
b 2.245566436 0.295127591 7.608798707 1.486916808 3.004216063 0.00062
c 0.997699800 0.442876322 2.252772954 -0.14075003 2.136149631 0.07402
Milk I Parm Value Std Error t-value 95% Confidence Limits P>|t|
a 12.79346477 0.304023808 42.08047015 12.04954531 13.53738423 0.00000
b 1.454154944 0.090606780 16.04907436 1.232448141 1.675861747 0.00000
c 1.131143114 0.261224969 4.330149299 0.491948643 1.770337585 0.00493
Milk II Parm Value Std Error t-value 95% Confidence Limits P>|t|
a 13.23703892 0.511064848 25.90089884 11.98650829 14.48756955 0.00000
b 1.364768648 0.117247056 11.64011019 1.077875438 1.651661858 0.00002
c 1.108682535 0.386285266 2.870113446 0.163476541 2.053888529 0.02842
Milk III Parm Value Std Error t-value 95% Confidence Limits P>|t|
a 13.29611604 0.798554122 16.65023780 11.24336731 15.34886476 0.00001
b 1.379351738 0.151701714 9.092525743 0.989390067 1.769313408 0.00027
c 0.763666554 0.475343878 1.606555988 -0.45824379 1.985576897 0.16906
Milk IV Parm Value Std Error t-value 95% Confidence Limits P>|t|
a 13.48220949 0.802160537 16.80737068 11.42019018 15.54422880 0.00001
b 1.380486507 0.154725950 8.922139467 0.982750789 1.778222225 0.00029
c 0.390122317 0.492898254 0.791486505 -0.87691299 1.657157620 0.46453
Ham I Parm Value Std Error t-value 95% Confidence Limits P>|t|
a 11.19112454 0.273613423 40.90122630 10.54413161 11.83811748 0.00000
b 1.343459171 0.098024929 13.70528069 1.111667046 1.575251296 0.00000
c 3.002982061 0.298893643 10.04699209 2.296210907 3.709753216 0.00002
Ham II Parm Value Std Error t-value 95% Confidence Limits P>|t|
a 11.39527316 0.206566169 55.16524421 10.90682178 11.88372453 0.00000

34
b 1.434203369 0.080971025 17.71255058 1.242737321 1.625669417 0.00000
c 3.268067036 0.221948389 14.72444582 2.743242493 3.792891579 0.00000
Ham III Parm Value Std Error t-value 95% Confidence Limits P>|t|
a 11.53176928 0.549933292 20.96939656 10.23138369 12.83215488 0.00000
b 1.206309644 0.144618761 8.341308140 0.864340617 1.548278672 0.00007
c 2.436594652 0.545975595 4.462827050 1.145567523 3.727621782 0.00293
Ham IV Parm Value Std Error t-value 95% Confidence Limits P>|t|
a 12.46532510 0.364339618 34.21347690 11.60379880 13.32685139 0.00000
b 1.228184615 0.086612914 14.18015579 1.023377618 1.432991612 0.00000
c 1.838238918 0.338619029 5.428634428 1.037532152 2.638945685 0.00098
7.2.3 FBR17 growth parameters at 7°C
BHI I Parm Value Std Error t-value 95% Confidence Limits P>|t|
a 14.82754268 0.376342270 39.39908924 13.90666632 15.74841904 0.00000
b 2.082576144 0.176512499 11.79846276 1.650665619 2.514486669 0.00002
c 1.913839130 0.299057264 6.399574129 1.182072367 2.645605894 0.00069
BHI II Parm Value Std Error t-value 95% Confidence Limits P>|t|
a 14.73173970 0.366196256 40.22908337 13.83568974 15.62778966 0.00000
b 1.972429890 0.156762218 12.58230408 1.588846562 2.356013218 0.00002
c 1.654755692 0.292121897 5.664606828 0.939959161 2.369552223 0.00130
BHI III Parm Value Std Error t-value 95% Confidence Limits P>|t|
a 14.54172329 0.306759748 47.40427443 13.75317225 15.33027433 0.00000
b 2.299888543 0.173851487 13.22904154 1.852989067 2.746788018 0.00004
c 0.902559411 0.238908850 3.777840004 0.288424659 1.516694163 0.01292
BHI IV Parm Value Std Error t-value 95% Confidence Limits P>|t|
a 14.42867883 0.441384948 32.68955796 13.29406270 15.56329496 0.00000
b 2.472489378 0.291417995 8.484340079 1.723375570 3.221603185 0.00037
c 1.171112527 0.347441571 3.370674737 0.277985532 2.064239522 0.01988
Milk I Parm Value Std Error t-value 95% Confidence Limits P>|t|
a 11.68179910 0.324202798 36.03238213 10.88850343 12.47509477 0.00000
b 1.388850608 0.113929191 12.19047201 1.110075922 1.667625295 0.00002
c 0.637875482 0.335263365 1.902610151 -0.18248442 1.458235382 0.10579
Milk II Parm Value Std Error t-value 95% Confidence Limits P>|t|
a 11.50199045 0.407652183 28.21520633 10.50450149 12.49947941 0.00000
b 1.487616835 0.171082184 8.695334615 1.068993812 1.906239857 0.00013

35
c 0.961824719 0.438446631 2.193709907 -0.11101554 2.034664976 0.07071
Milk III Parm Value Std Error t-value 95% Confidence Limits P>|t|
a 11.08940608 0.374910809 29.57878465 10.12566716 12.05314500 0.00000
b 1.543882849 0.163810430 9.424814095 1.122794733 1.964970966 0.00023
c 0.451194869 0.373831214 1.206948087 -0.50976886 1.412158600 0.28143
Milk IV Parm Value Std Error t-value 95% Confidence Limits P>|t|
a 11.14858390 0.382245122 29.16605932 10.16599153 12.13117627 0.00000
b 1.520872852 0.158800838 9.577234411 1.112662301 1.929083403 0.00021
c 0.452360381 0.373660500 1.210618681 -0.50816451 1.412885277 0.28014
Ham I Parm Value Std Error t-value 95% Confidence Limits P>|t|
a 13.10806581 0.624815894 20.97908509 11.63061100 14.58552063 0.00000
b 0.872949334 0.066240093 13.17856451 0.716316405 1.029582264 0.00000
c 1.857215139 0.475938290 3.902218369 0.731799917 2.982630361 0.00588
Ham II Parm Value Std Error t-value 95% Confidence Limits P>|t|
a 12.87559688 0.503902248 25.55177501 11.68405741 14.06713636 0.00000
b 0.967112672 0.078683805 12.29112745 0.781055040 1.153170305 0.00001
c 1.525330001 0.469336145 3.249973432 0.415526373 2.635133630 0.01406
Ham III Parm Value Std Error t-value 95% Confidence Limits P>|t|
a 11.49937937 0.114886445 100.0934390 11.22771609 11.77104264 0.00000
b 1.249099224 0.034724022 35.97219352 1.166989960 1.331208487 0.00000
c 2.129483218 0.124499965 17.10428766 1.835087582 2.423878855 0.00000
Ham IV Parm Value Std Error t-value 95% Confidence Limits P>|t|
a 11.81430042 0.185819450 63.57946078 11.37490725 12.25369360 0.00000
b 1.225205189 0.051752185 23.67446318 1.102830719 1.347579660 0.00000
c 1.733829775 0.197029045 8.799868926 1.267930116 2.199729433 0.00005
7.2.4 FBR15 growth parameters at 7°C
BHI I Parm Value Std Error t-value 95% Confidence Limits P>|t|
a 15.43735500 0.395562835 39.02630287 14.54252970 16.33218030 0.00000
b 1.161657970 0.064213173 18.09064894 1.016397681 1.306918260 0.00000
c 1.625186996 0.338834438 4.796404423 0.858690246 2.391683746 0.00098
BHI II Parm Value Std Error t-value 95% Confidence Limits P>|t|
a 16.03285236 0.349213740 45.91128735 15.24287599 16.82282872 0.00000
b 1.183925522 0.054549870 21.70354418 1.060525142 1.307325903 0.00000
c 1.461266322 0.286820689 5.094703342 0.812432847 2.110099797 0.00065
36
BHI III Parm Value Std Error t-value 95% Confidence Limits P>|t|
a 16.80946175 0.707435502 23.76112268 15.17811256 18.44081094 0.00000
b 1.191386531 0.079652692 14.95726631 1.007707093 1.375065968 0.00000
c 1.604736769 0.413314472 3.882604839 0.651631889 2.557841650 0.00466
BHI IV Parm Value Std Error t-value 95% Confidence Limits P>|t|
a 17.14093283 0.719134860 23.83549148 15.48260487 18.79926079 0.00000
b 1.235110764 0.087503065 14.11505714 1.033328335 1.436893194 0.00000
c 1.358586298 0.435066495 3.122709552 0.355321164 2.361851433 0.01417
Milk I Parm Value Std Error t-value 95% Confidence Limits P>|t|
a 12.20469539 0.240946190 50.65319923 11.65963724 12.74975354 0.00000
b 0.998389873 0.048344312 20.65165140 0.889027442 1.107752304 0.00000
c 1.832320000 0.279034226 6.566649639 1.201100727 2.463539273 0.00010
Milk II Parm Value Std Error t-value 95% Confidence Limits P>|t|
a 13.25363916 0.215655678 61.45740884 12.76579212 13.74148619 0.00000
b 1.027473681 0.038599891 26.61856449 0.940154662 1.114792701 0.00000
c 1.452024552 0.226086344 6.422433699 0.940581710 1.963467393 0.00012
Milk III Parm Value Std Error t-value 95% Confidence Limits P>|t|
a 12.97113693 0.405133031 32.01698194 12.03689849 13.90537538 0.00000
b 1.096104492 0.074205857 14.77113169 0.924985479 1.267223506 0.00000
c 1.896818931 0.369890235 5.128058955 1.043850521 2.749787342 0.00090
Milk IV Parm Value Std Error t-value 95% Confidence Limits P>|t|
a 12.76821291 0.378497812 33.73391475 11.89539539 13.64103043 0.00000
b 1.107618379 0.073305287 15.10966578 0.938576086 1.276660673 0.00000
c 2.079604957 0.354019838 5.874261086 1.263233748 2.895976166 0.00037
Ham I Parm Value Std Error t-value 95% Confidence Limits P>|t|
a 11.07912712 0.802297707 13.80924690 9.181994511 12.97625973 0.00000
b 0.641824296 0.069952363 9.175162444 0.476413242 0.807235350 0.00004
c 8.737180772 0.817373718 10.68933412 6.804399059 10.66996249 0.00001
Ham II Parm Value Std Error t-value 95% Confidence Limits P>|t|
a 10.31922891 0.562034225 18.36049914 8.990229154 11.64822867 0.00000
b 0.647763586 0.070756799 9.154789237 0.480450342 0.815076830 0.00004
c 7.106961611 0.793942884 8.951477184 5.229585017 8.984338206 0.00004
Ham III Parm Value Std Error t-value 95% Confidence Limits P>|t|
a 8.085801410 0.665111263 12.15706582 6.458332778 9.713270042 0.00002
b 0.631546288 0.136697184 4.620038766 0.297060329 0.966032247 0.00362
37
c 4.706421452 1.332581477 3.531807648 1.445712045 7.967130859 0.01234
Ham IV Parm Value Std Error t-value 95% Confidence Limits P>|t|
a 9.427262085 0.236928429 39.78949315 8.847519105 10.00700506 0.00000
b 0.799642812 0.060790919 13.15398469 0.650892793 0.948392830 0.00001
c 4.640978167 0.439682263 10.55529996 3.565114428 5.716841905 0.00004
7.2.5 FBR15 growth parameters at 7°C with 7°C pre-culturing for 10
days
BHI I Parm Value Std Error t-value 95% Confidence Limits P>|t|
a 17.11677558 0.776897077 22.03223064 15.32524771 18.90830345 0.00000
b 1.258546098 0.103892730 12.11389963 1.018969034 1.498123162 0.00000
c 1.043292099 0.502853593 2.074743254 -0.11629036 2.202874562 0.07170
BHI II Parm Value Std Error t-value 95% Confidence Limits P>|t|
a 17.04723378 0.798185658 21.35747944 15.20661435 18.88785320 0.00000
b 1.308053475 0.117948174 11.09006977 1.036064499 1.580042451 0.00000
c 1.282698999 0.531614620 2.412836200 0.056793489 2.508604508 0.04232
BHI III Parm Value Std Error t-value 95% Confidence Limits P>|t|
a 18.54268958 0.655513086 28.28729127 17.03107370 20.05430547 0.00000
b 1.195419633 0.059998958 19.92400662 1.057061789 1.333777478 0.00000
c 0.845887231 0.334497279 2.528831430 0.074535125 1.617239338 0.03532
BHI IV Parm Value Std Error t-value 95% Confidence Limits P>|t|
a 18.09232154 0.474746806 38.10941186 16.99755345 19.18708964 0.00000
b 1.247418056 0.050817763 24.54689049 1.130232085 1.364604027 0.00000
c 1.300348463 0.257810146 5.043821912 0.705837201 1.894859725 0.00100
Milk I Parm Value Std Error t-value 95% Confidence Limits P>|t|
a 13.60367959 0.467529211 29.09696181 12.52555530 14.68180389 0.00000
b 1.126221943 0.085743803 13.13473276 0.928496378 1.323947508 0.00000
c 1.283430270 0.426035779 3.012494099 0.300990003 2.265870536 0.01675
Milk II Parm Value Std Error t-value 95% Confidence Limits P>|t|
a 13.55920866 0.389523989 34.80968834 12.66096473 14.45745258 0.00000
b 1.127319338 0.071746486 15.71253723 0.961871644 1.292767032 0.00000
c 1.362349304 0.354652678 3.841361953 0.544518763 2.180179845 0.00494
Milk III Parm Value Std Error t-value 95% Confidence Limits P>|t|
a 14.50976221 0.384768196 37.71039909 13.62248516 15.39703926 0.00000
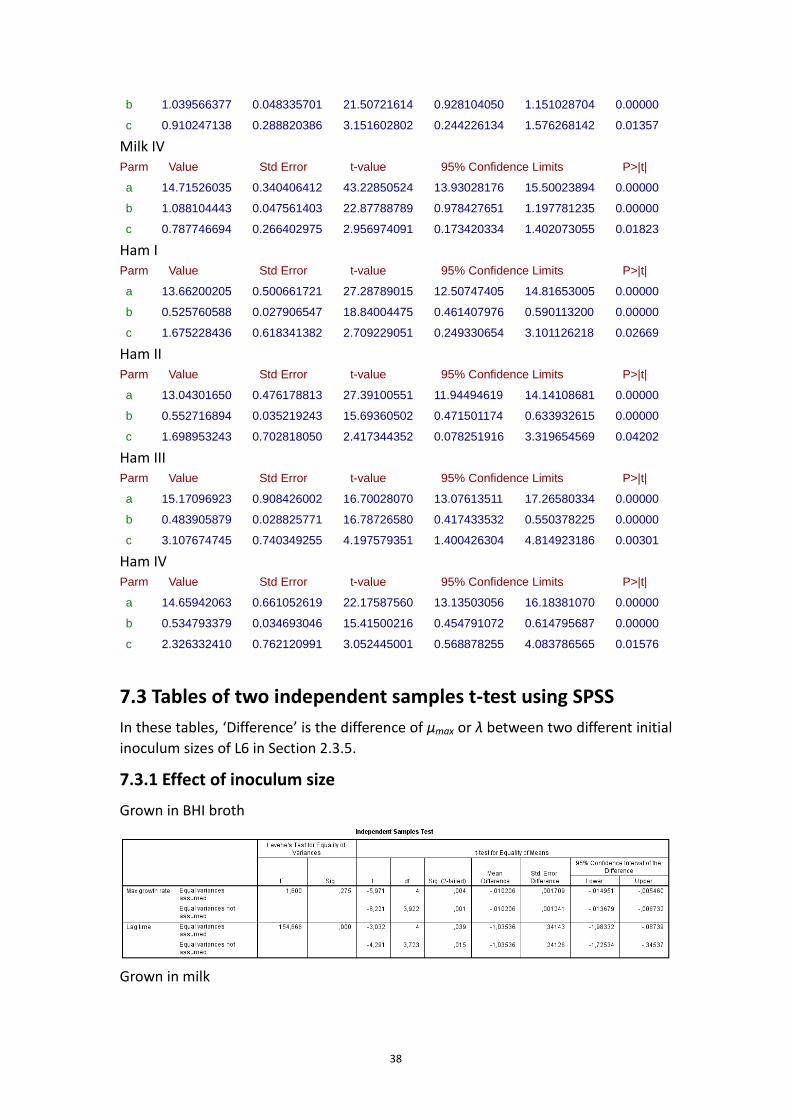
38
b 1.039566377 0.048335701 21.50721614 0.928104050 1.151028704 0.00000
c 0.910247138 0.288820386 3.151602802 0.244226134 1.576268142 0.01357
Milk IV Parm Value Std Error t-value 95% Confidence Limits P>|t|
a 14.71526035 0.340406412 43.22850524 13.93028176 15.50023894 0.00000
b 1.088104443 0.047561403 22.87788789 0.978427651 1.197781235 0.00000
c 0.787746694 0.266402975 2.956974091 0.173420334 1.402073055 0.01823
Ham I Parm Value Std Error t-value 95% Confidence Limits P>|t|
a 13.66200205 0.500661721 27.28789015 12.50747405 14.81653005 0.00000
b 0.525760588 0.027906547 18.84004475 0.461407976 0.590113200 0.00000
c 1.675228436 0.618341382 2.709229051 0.249330654 3.101126218 0.02669
Ham II Parm Value Std Error t-value 95% Confidence Limits P>|t|
a 13.04301650 0.476178813 27.39100551 11.94494619 14.14108681 0.00000
b 0.552716894 0.035219243 15.69360502 0.471501174 0.633932615 0.00000
c 1.698953243 0.702818050 2.417344352 0.078251916 3.319654569 0.04202
Ham III Parm Value Std Error t-value 95% Confidence Limits P>|t|
a 15.17096923 0.908426002 16.70028070 13.07613511 17.26580334 0.00000
b 0.483905879 0.028825771 16.78726580 0.417433532 0.550378225 0.00000
c 3.107674745 0.740349255 4.197579351 1.400426304 4.814923186 0.00301
Ham IV Parm Value Std Error t-value 95% Confidence Limits P>|t|
a 14.65942063 0.661052619 22.17587560 13.13503056 16.18381070 0.00000
b 0.534793379 0.034693046 15.41500216 0.454791072 0.614795687 0.00000
c 2.326332410 0.762120991 3.052445001 0.568878255 4.083786565 0.01576
7.3 Tables of two independent samples t-test using SPSS
In these tables, ‘Difference’ is the difference of μmax or λ between two different initial
inoculum sizes of L6 in Section 2.3.5.
7.3.1 Effect of inoculum size
Grown in BHI broth
Grown in milk
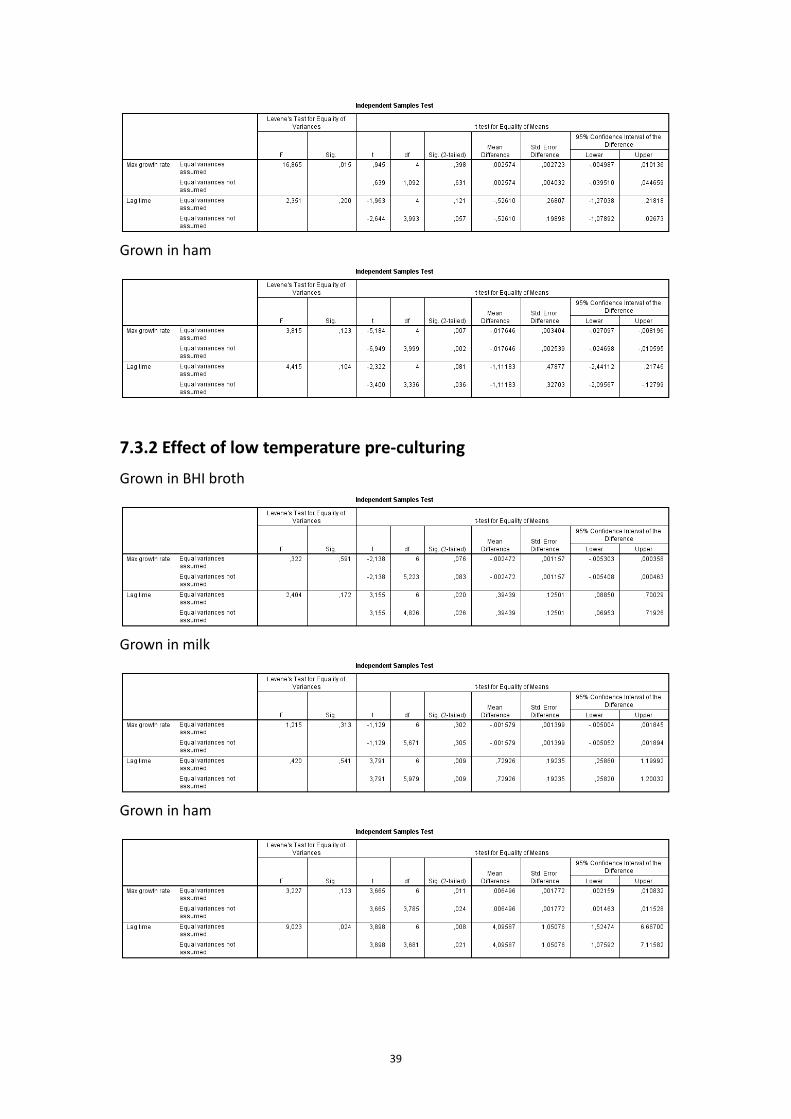
39
Grown in ham
7.3.2 Effect of low temperature pre-culturing
Grown in BHI broth
Grown in milk
Grown in ham

40
7.4 Tables of one sample t-test using SPSS
In these tables, ‘Difference’ is the difference of μmax between experiments and
prediction of L6 (A), FBR17 (B), FBR15 (C), and FBR15 with ten-day 7°C pre-culturing
(D) at 7°C in Section 2.3.6.
7.4.1 Grown in BHI broth
A
B
C
D
7.4.2 Grown in milk
A

41
B
C
D
7.4.3 Grown in ham
A
B
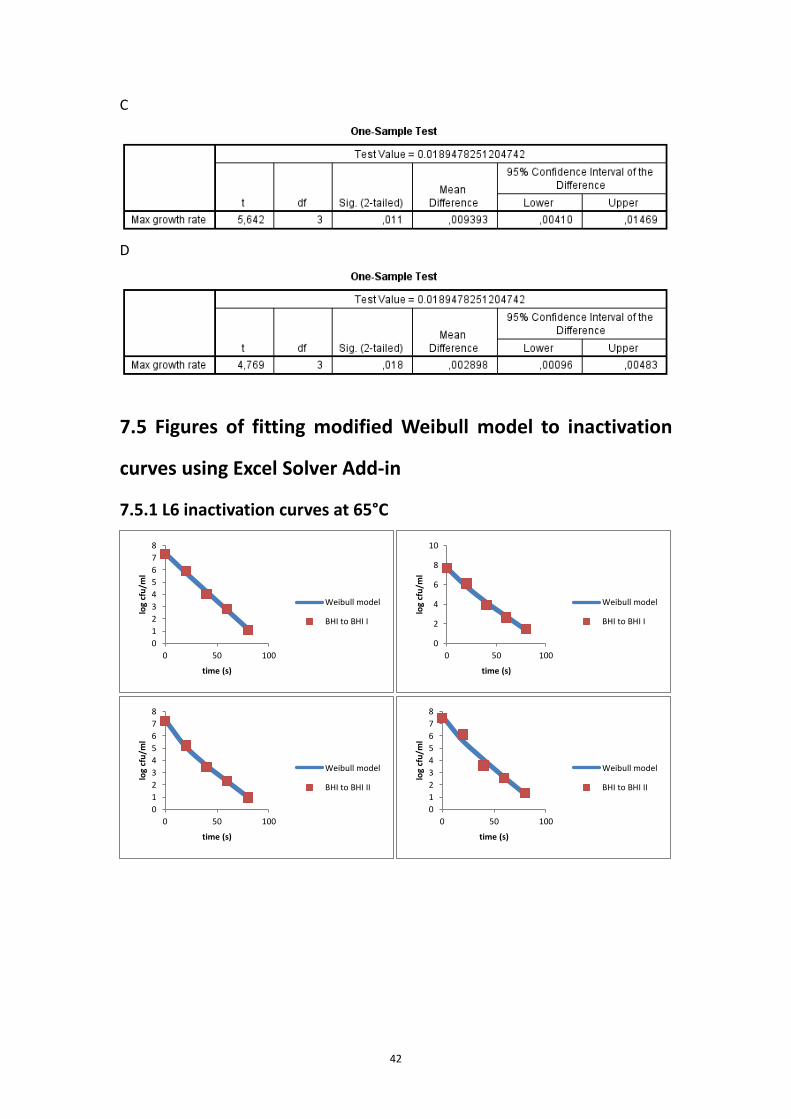
42
C
D
7.5 Figures of fitting modified Weibull model to inactivation
curves using Excel Solver Add-in
7.5.1 L6 inactivation curves at 65°C
0
1
2
3
4
5
6
7
8
0 50 100
log
cfu
/ml
time (s)
Weibull model
BHI to BHI I
0
2
4
6
8
10
0 50 100
log
cfu
/ml
time (s)
Weibull model
BHI to BHI I
0
1
2
3
4
5
6
7
8
0 50 100
log
cfu
/ml
time (s)
Weibull model
BHI to BHI II
0
1
2
3
4
5
6
7
8
0 50 100
log
cfu
/ml
time (s)
Weibull model
BHI to BHI II
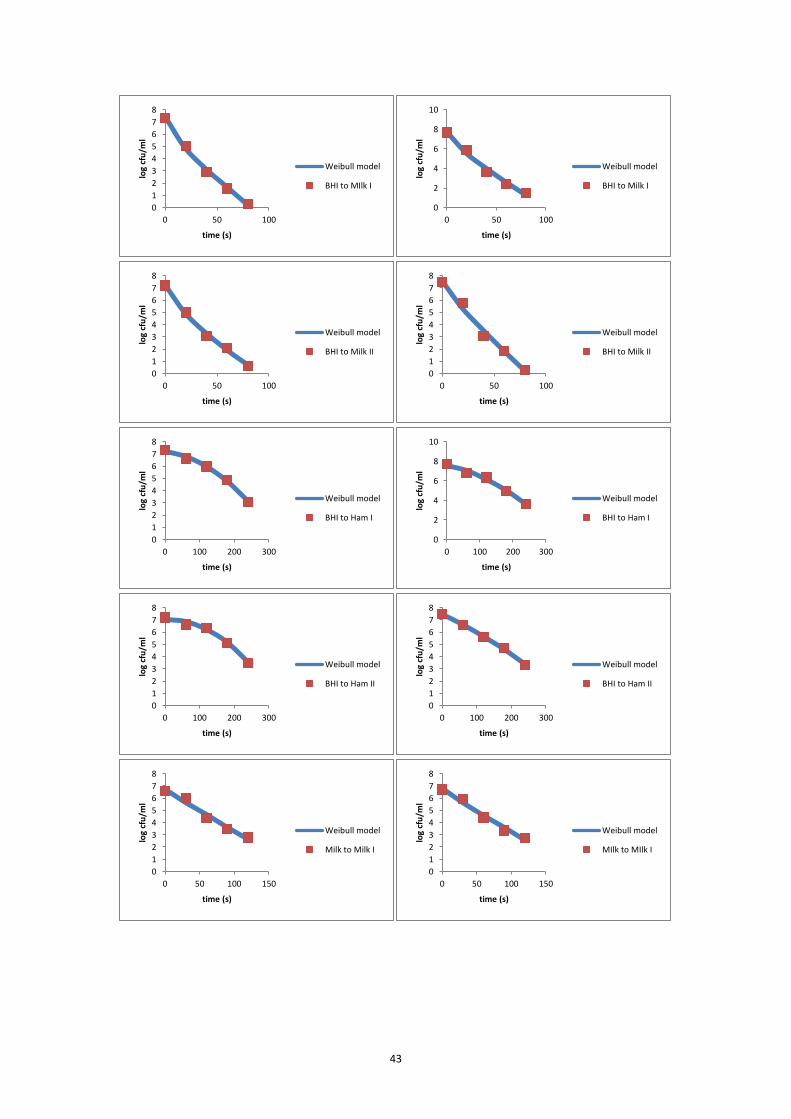
43
0
1
2
3
4
5
6
7
8
0 50 100
log
cfu
/ml
time (s)
Weibull model
BHI to MIlk I
0
2
4
6
8
10
0 50 100
log
cfu
/ml
time (s)
Weibull model
BHI to Milk I
0
1
2
3
4
5
6
7
8
0 50 100
log
cfu
/ml
time (s)
Weibull model
BHI to Milk II
0
1
2
3
4
5
6
7
8
0 50 100
log
cfu
/ml
time (s)
Weibull model
BHI to Milk II
0
1
2
3
4
5
6
7
8
0 100 200 300
log
cfu
/ml
time (s)
Weibull model
BHI to Ham I
0
2
4
6
8
10
0 100 200 300
log
cfu
/ml
time (s)
Weibull model
BHI to Ham I
0
1
2
3
4
5
6
7
8
0 100 200 300
log
cfu
/ml
time (s)
Weibull model
BHI to Ham II
0
1
2
3
4
5
6
7
8
0 100 200 300
log
cfu
/ml
time (s)
Weibull model
BHI to Ham II
0
1
2
3
4
5
6
7
8
0 50 100 150
log
cfu
/ml
time (s)
Weibull model
Milk to Milk I
0
1
2
3
4
5
6
7
8
0 50 100 150
log
cfu
/ml
time (s)
Weibull model
MIlk to MIlk I
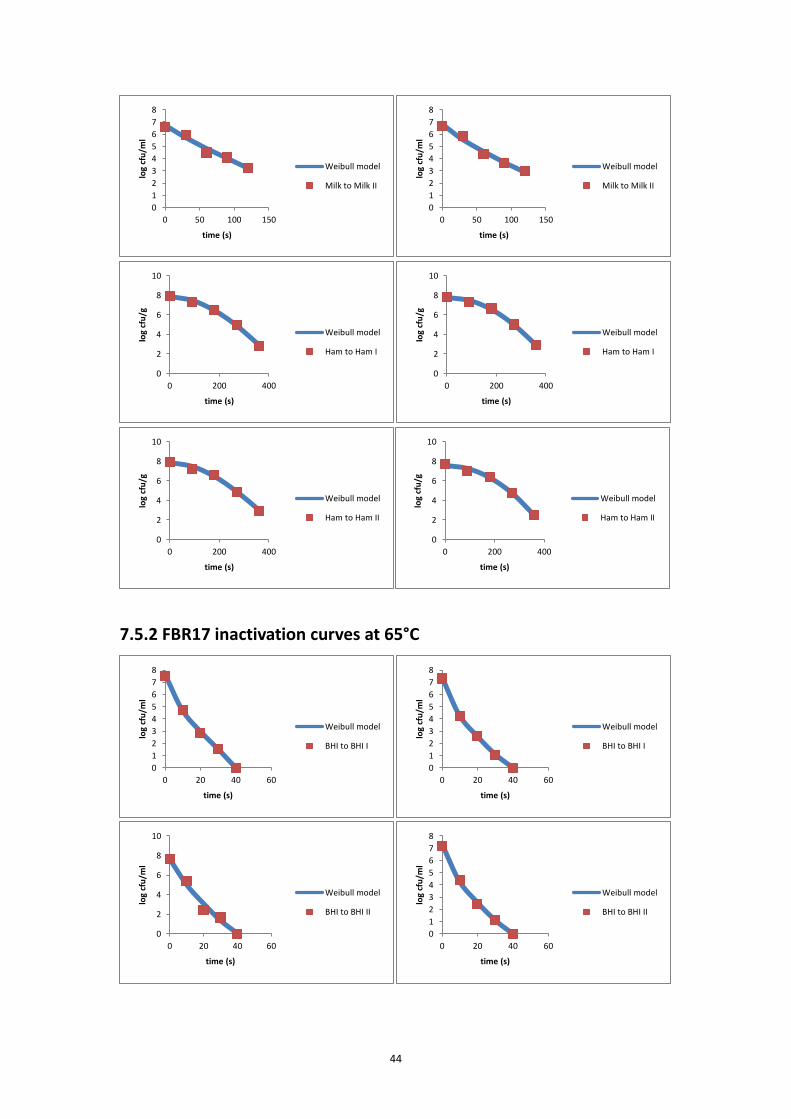
44
7.5.2 FBR17 inactivation curves at 65°C
0
1
2
3
4
5
6
7
8
0 50 100 150
log
cfu
/ml
time (s)
Weibull model
Milk to Milk II
0
1
2
3
4
5
6
7
8
0 50 100 150
log
cfu
/ml
time (s)
Weibull model
Milk to Milk II
0
2
4
6
8
10
0 200 400
log
cfu
/g
time (s)
Weibull model
Ham to Ham I
0
2
4
6
8
10
0 200 400
log
cfu
/g
time (s)
Weibull model
Ham to Ham I
0
2
4
6
8
10
0 200 400
log
cfu
/g
time (s)
Weibull model
Ham to Ham II
0
2
4
6
8
10
0 200 400
log
cfu
/g
time (s)
Weibull model
Ham to Ham II
0
1
2
3
4
5
6
7
8
0 20 40 60
log
cfu
/ml
time (s)
Weibull model
BHI to BHI I
0
1
2
3
4
5
6
7
8
0 20 40 60
log
cfu
/ml
time (s)
Weibull model
BHI to BHI I
0
2
4
6
8
10
0 20 40 60
log
cfu
/ml
time (s)
Weibull model
BHI to BHI II
0
1
2
3
4
5
6
7
8
0 20 40 60
log
cfu
/ml
time (s)
Weibull model
BHI to BHI II
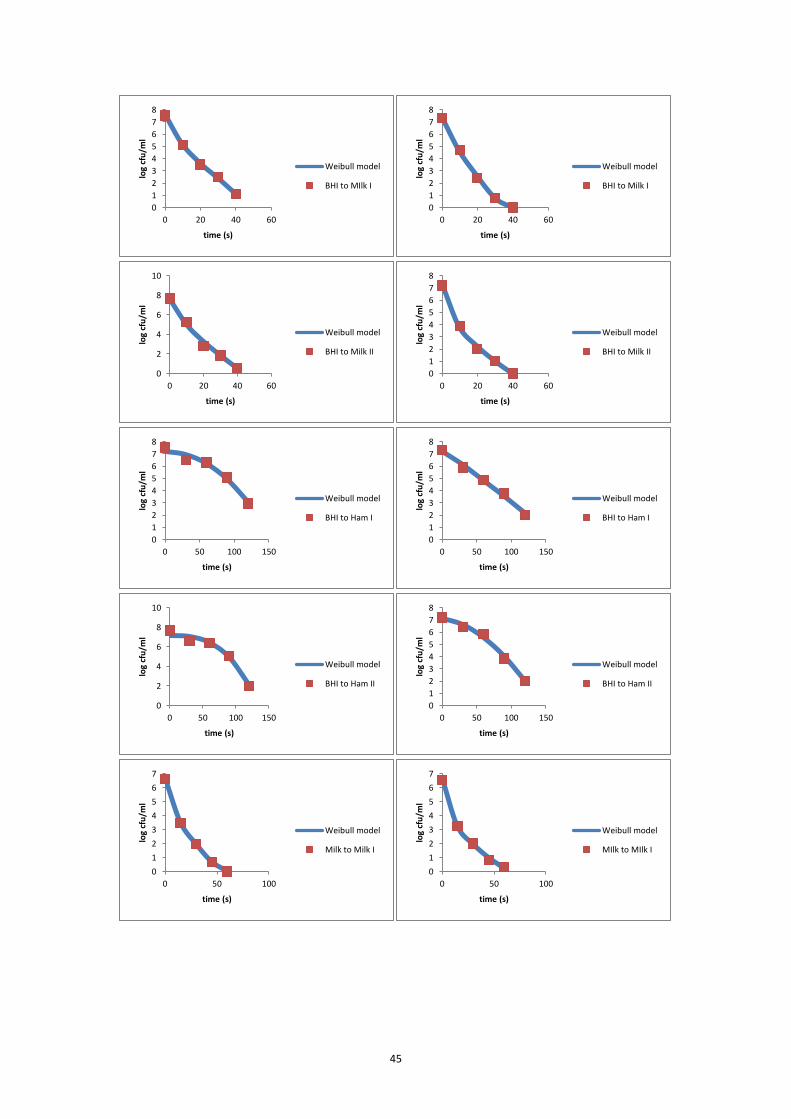
45
0
1
2
3
4
5
6
7
8
0 20 40 60
log
cfu
/ml
time (s)
Weibull model
BHI to MIlk I
0
1
2
3
4
5
6
7
8
0 20 40 60
log
cfu
/ml
time (s)
Weibull model
BHI to Milk I
0
2
4
6
8
10
0 20 40 60
log
cfu
/ml
time (s)
Weibull model
BHI to Milk II
0
1
2
3
4
5
6
7
8
0 20 40 60
log
cfu
/ml
time (s)
Weibull model
BHI to Milk II
0
1
2
3
4
5
6
7
8
0 50 100 150
log
cfu
/ml
time (s)
Weibull model
BHI to Ham I
0
1
2
3
4
5
6
7
8
0 50 100 150
log
cfu
/ml
time (s)
Weibull model
BHI to Ham I
0
2
4
6
8
10
0 50 100 150
log
cfu
/ml
time (s)
Weibull model
BHI to Ham II
0
1
2
3
4
5
6
7
8
0 50 100 150
log
cfu
/ml
time (s)
Weibull model
BHI to Ham II
0
1
2
3
4
5
6
7
0 50 100
log
cfu
/ml
time (s)
Weibull model
Milk to Milk I
0
1
2
3
4
5
6
7
0 50 100
log
cfu
/ml
time (s)
Weibull model
MIlk to MIlk I
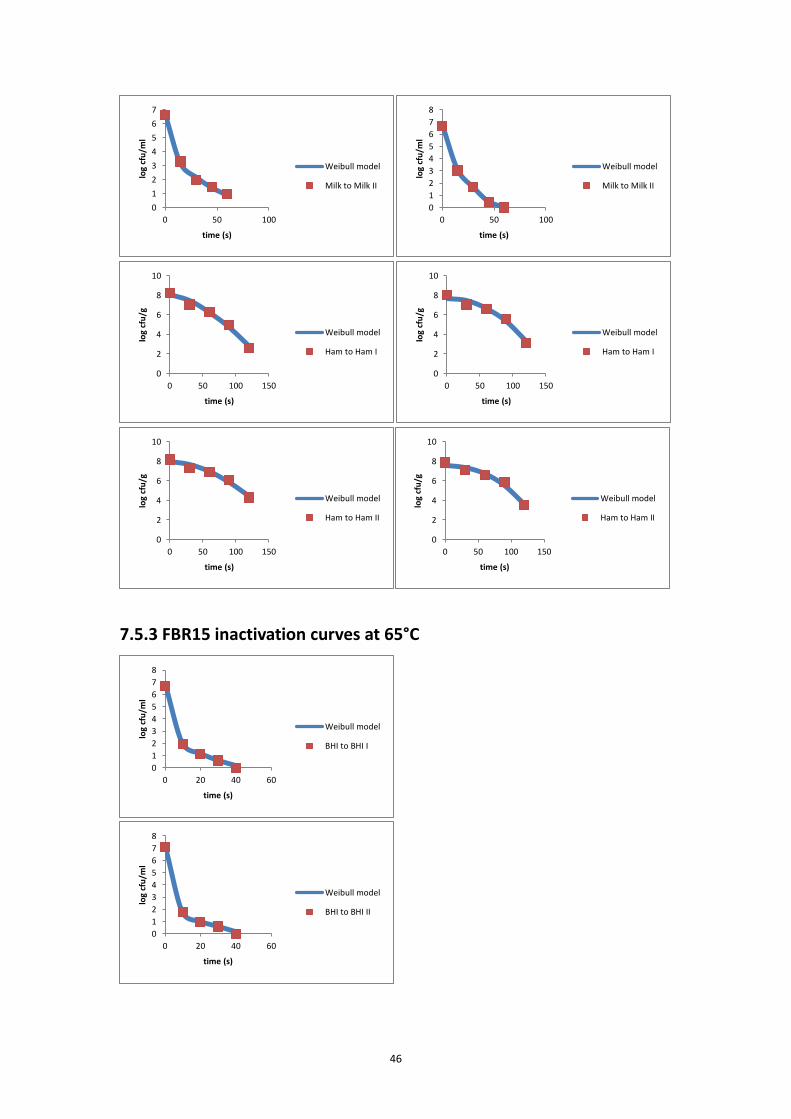
46
7.5.3 FBR15 inactivation curves at 65°C
0
1
2
3
4
5
6
7
0 50 100
log
cfu
/ml
time (s)
Weibull model
Milk to Milk II
0
1
2
3
4
5
6
7
8
0 50 100
log
cfu
/ml
time (s)
Weibull model
Milk to Milk II
0
2
4
6
8
10
0 50 100 150
log
cfu
/g
time (s)
Weibull model
Ham to Ham I
0
2
4
6
8
10
0 50 100 150
log
cfu
/g
time (s)
Weibull model
Ham to Ham I
0
2
4
6
8
10
0 50 100 150
log
cfu
/g
time (s)
Weibull model
Ham to Ham II
0
2
4
6
8
10
0 50 100 150
log
cfu
/g
time (s)
Weibull model
Ham to Ham II
0
1
2
3
4
5
6
7
8
0 20 40 60
log
cfu
/ml
time (s)
Weibull model
BHI to BHI I
0
1
2
3
4
5
6
7
8
0 20 40 60
log
cfu
/ml
time (s)
Weibull model
BHI to BHI II
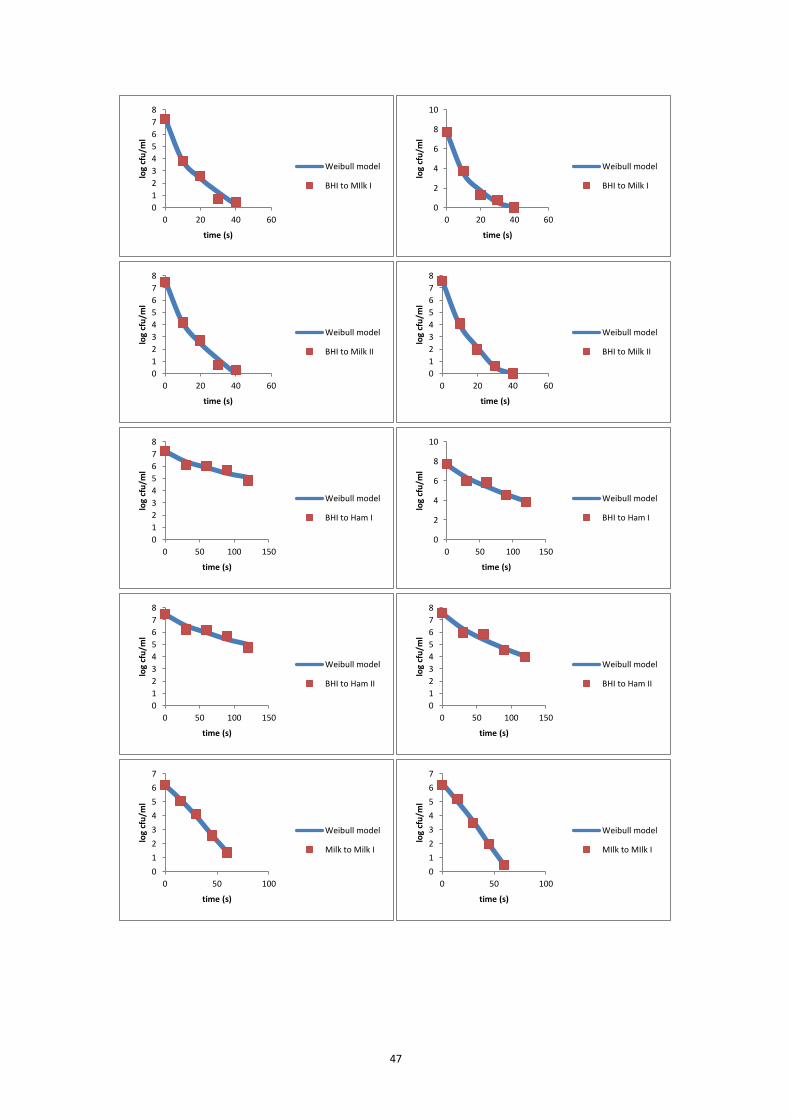
47
0
1
2
3
4
5
6
7
8
0 20 40 60
log
cfu
/ml
time (s)
Weibull model
BHI to MIlk I
0
2
4
6
8
10
0 20 40 60
log
cfu
/ml
time (s)
Weibull model
BHI to Milk I
0
1
2
3
4
5
6
7
8
0 20 40 60
log
cfu
/ml
time (s)
Weibull model
BHI to Milk II
0
1
2
3
4
5
6
7
8
0 20 40 60
log
cfu
/ml
time (s)
Weibull model
BHI to Milk II
0
1
2
3
4
5
6
7
8
0 50 100 150
log
cfu
/ml
time (s)
Weibull model
BHI to Ham I
0
2
4
6
8
10
0 50 100 150
log
cfu
/ml
time (s)
Weibull model
BHI to Ham I
0
1
2
3
4
5
6
7
8
0 50 100 150
log
cfu
/ml
time (s)
Weibull model
BHI to Ham II
0
1
2
3
4
5
6
7
8
0 50 100 150
log
cfu
/ml
time (s)
Weibull model
BHI to Ham II
0
1
2
3
4
5
6
7
0 50 100
log
cfu
/ml
time (s)
Weibull model
Milk to Milk I
0
1
2
3
4
5
6
7
0 50 100
log
cfu
/ml
time (s)
Weibull model
MIlk to MIlk I
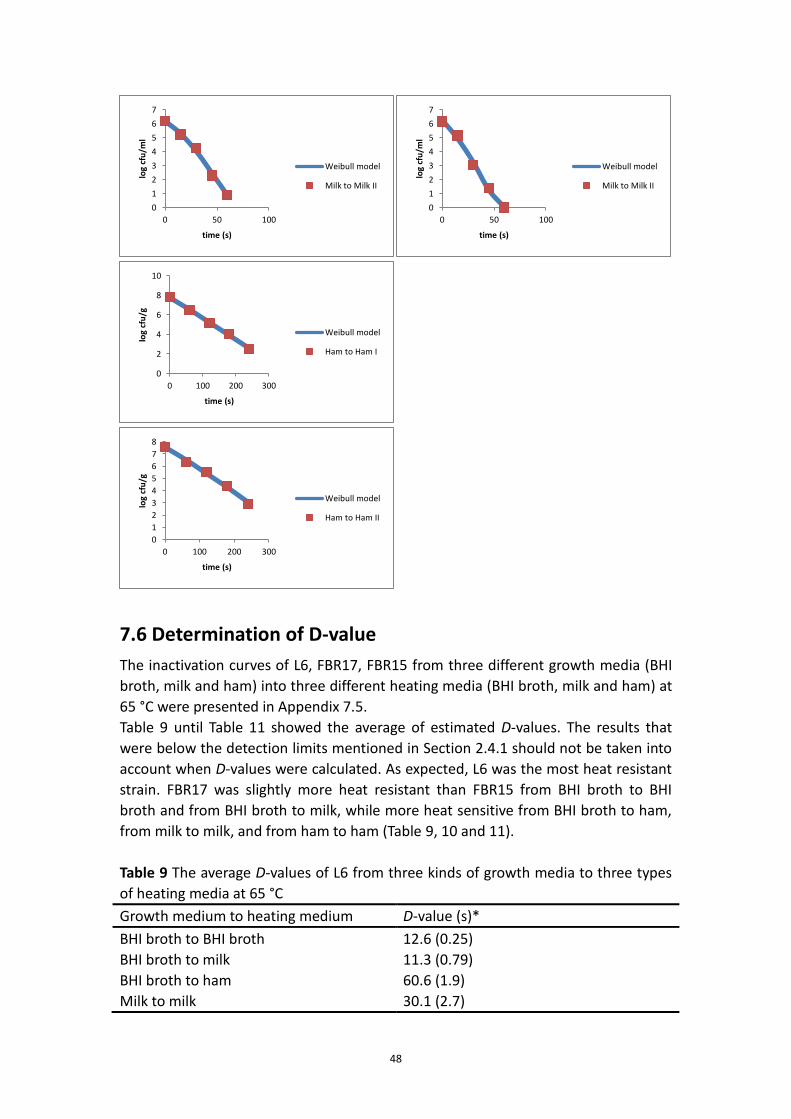
48
7.6 Determination of D-value
The inactivation curves of L6, FBR17, FBR15 from three different growth media (BHI
broth, milk and ham) into three different heating media (BHI broth, milk and ham) at
65 °C were presented in Appendix 7.5.
Table 9 until Table 11 showed the average of estimated D-values. The results that
were below the detection limits mentioned in Section 2.4.1 should not be taken into
account when D-values were calculated. As expected, L6 was the most heat resistant
strain. FBR17 was slightly more heat resistant than FBR15 from BHI broth to BHI
broth and from BHI broth to milk, while more heat sensitive from BHI broth to ham,
from milk to milk, and from ham to ham (Table 9, 10 and 11).
Table 9 The average D-values of L6 from three kinds of growth media to three types
of heating media at 65 °C
Growth medium to heating medium D-value (s)*
BHI broth to BHI broth 12.6 (0.25)
BHI broth to milk 11.3 (0.79)
BHI broth to ham 60.6 (1.9)
Milk to milk 30.1 (2.7)
0
1
2
3
4
5
6
7
0 50 100
log
cfu
/ml
time (s)
Weibull model
Milk to Milk II
0
1
2
3
4
5
6
7
0 50 100
log
cfu
/ml
time (s)
Weibull model
Milk to Milk II
0
2
4
6
8
10
0 100 200 300
log
cfu
/g
time (s)
Weibull model
Ham to Ham I
0
1
2
3
4
5
6
7
8
0 100 200 300
log
cfu
/g
time (s)
Weibull model
Ham to Ham II
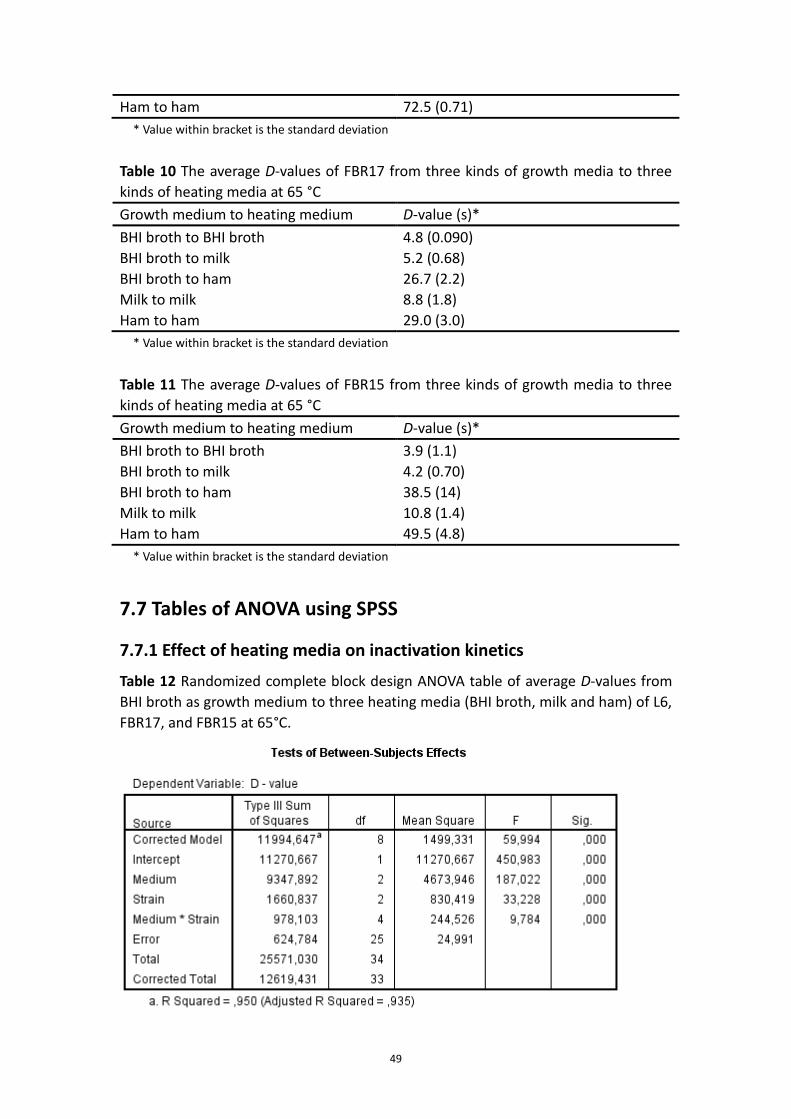
49
Ham to ham 72.5 (0.71)
* Value within bracket is the standard deviation
Table 10 The average D-values of FBR17 from three kinds of growth media to three
kinds of heating media at 65 °C
Growth medium to heating medium D-value (s)*
BHI broth to BHI broth 4.8 (0.090)
BHI broth to milk 5.2 (0.68)
BHI broth to ham 26.7 (2.2)
Milk to milk 8.8 (1.8)
Ham to ham 29.0 (3.0)
* Value within bracket is the standard deviation
Table 11 The average D-values of FBR15 from three kinds of growth media to three
kinds of heating media at 65 °C
Growth medium to heating medium D-value (s)*
BHI broth to BHI broth 3.9 (1.1)
BHI broth to milk 4.2 (0.70)
BHI broth to ham 38.5 (14)
Milk to milk 10.8 (1.4)
Ham to ham 49.5 (4.8)
* Value within bracket is the standard deviation
7.7 Tables of ANOVA using SPSS
7.7.1 Effect of heating media on inactivation kinetics
Table 12 Randomized complete block design ANOVA table of average D-values from
BHI broth as growth medium to three heating media (BHI broth, milk and ham) of L6,
FBR17, and FBR15 at 65°C.
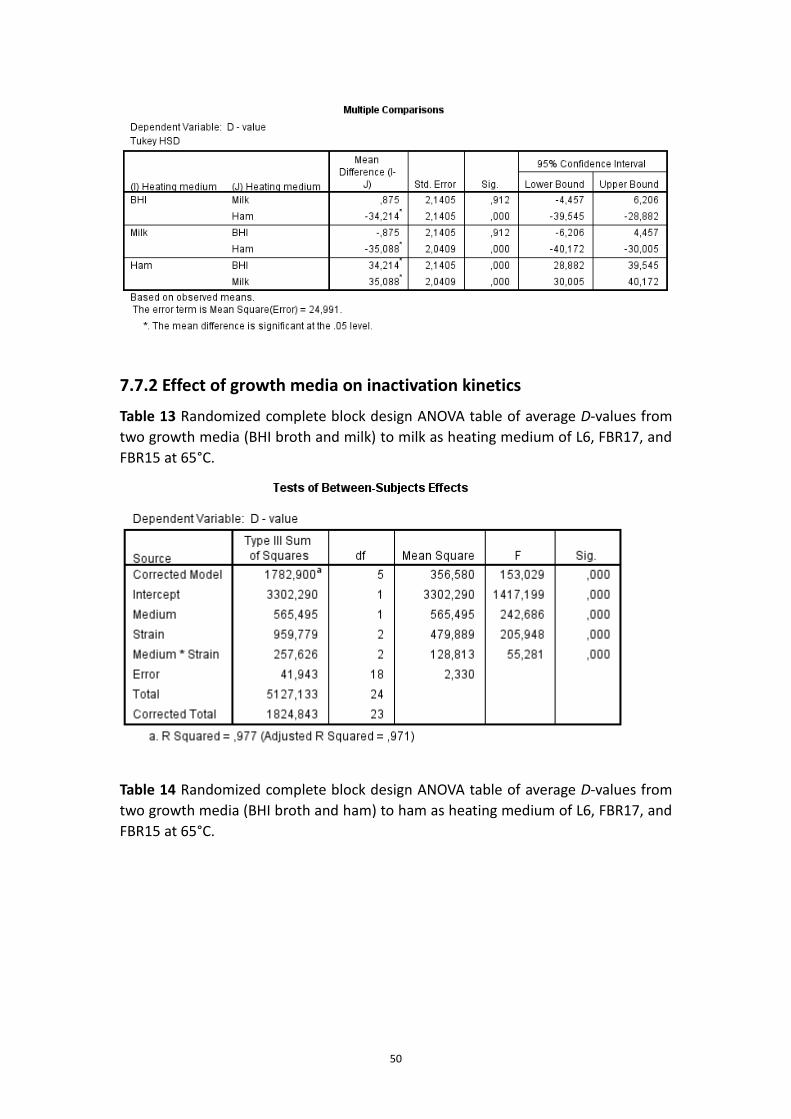
50
7.7.2 Effect of growth media on inactivation kinetics
Table 13 Randomized complete block design ANOVA table of average D-values from
two growth media (BHI broth and milk) to milk as heating medium of L6, FBR17, and
FBR15 at 65°C.
Table 14 Randomized complete block design ANOVA table of average D-values from
two growth media (BHI broth and ham) to ham as heating medium of L6, FBR17, and
FBR15 at 65°C.
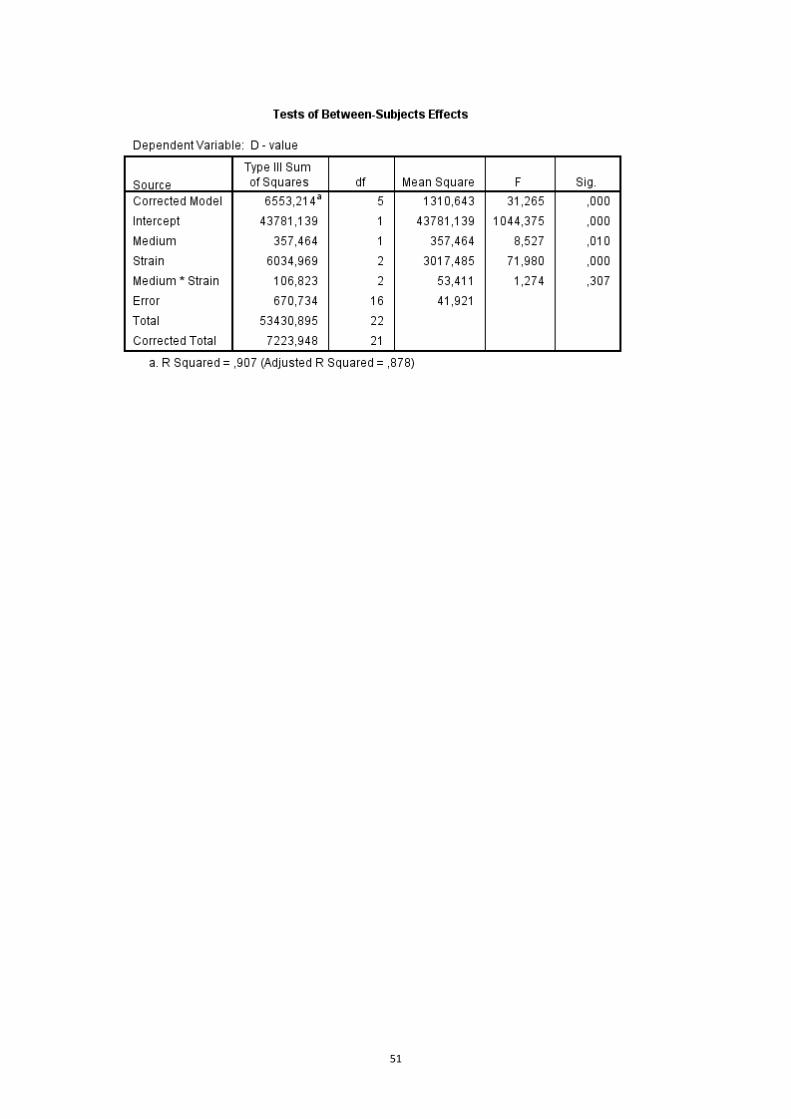
51
52
REFERENCES Allerberger, F. & Wagner, M. (2010). Listeriosis: a resurgent foodborne infection. Clinical microbiology
and infection : the official publication of the European Society of Clinical Microbiology and Infectious
Diseases 16, 16-23.
Aryani, D., den Besten, H., Hazeleger, W. & Zwietering, M. (2015a). Quantifying strain variability in
modeling growth of Listeria monocytogenes. International journal of food microbiology 208, 19-29.
Aryani, D. C., den Besten, H. M., Hazeleger, W. C. & Zwietering, M. H. (2015b). Quantifying variability
on thermal resistance of Listeria monocytogenes. International journal of food microbiology 193,
130-138.
Augustin, J.-C., Brouillaud-Delattre, A., Rosso, L. & Carlier, V. (2000). Significance of Inoculum Size in
the Lag Time of Listeria monocytogenes. Applied and environmental microbiology 66, 1706-1710.
Bae, Y.-M., Kim, B.-R., Lee, S.-Y., Cha, M., Park, K.-H., Chung, M.-S. & Ryu, K. (2012). Growth and
predictive model of Bacillus cereus on blanched spinach with or without seasoning at various
temperatures. Food Science and Biotechnology 21, 503-508.
Baranyi, J. (1998). Comparison of stochastic and deterministic concepts of bacterial lag. Journal of
Theoretical Biology 192, 403-408.
Buchanan, R. & Klawitter, L. (1991). Effect of temperature history on the growth of Listeria
monocytogenes Scott A at refrigeration temperatures. International journal of food microbiology 12,
235-245.
Buchanan, R. & Bagi, L. (1999). Microbial competition: effect of Pseudomonas fluorescens on the
growth of Listeria monocytogenes. Food microbiology 16, 523-529.
Carlier, V., Augustin, J. C. & Rozier, J. (1996). Heat resistance of Listeria monocytogenes (phagovar
2389/2425/3274/2671/47/108/340): D-and z-values in ham. Journal of Food Protection® 59, 588-591.
den Besten, H. M., Mataragas, M., Moezelaar, R., Abee, T. & Zwietering, M. H. (2006). Quantification
of the effects of salt stress and physiological state on thermotolerance of Bacillus cereus ATCC 10987
and ATCC 14579. Applied and environmental microbiology 72, 5884-5894.
Ding, T., Wang, J., Forghani, F., Ha, S. D., Chung, M. S., Bahk, G. J., Hwang, I. G., Abdallah, E. & Oh, D.
H. (2012). Development of predictive models for the growth of Escherichia coli O157: H7 on cabbage
in Korea. Journal of food science 77, M257-M263.
Donnelly, C. W. & Briggs, E. H. (1986). Psychrotrophic growth and thermal inactivation of Listeria
monocytogenes as a function of milk composition. Journal of Food Protection® 49, 994-1002.

53
Duffy, G., Sheridan, J., Buchanan, R., McDowell, D. & Blair, I. (1994). The effect of aeration, initial
inoculum and meat microflora on the growth kinetics of Listeria monocytogenes in selective
enrichment broths. Food microbiology 11, 429-438.
Earle, R. & Earle, M. (2004).Heat-transfer applications. In Unit Operations in Food Processing: The
New Zealand Institute of Food Science & Technology (Inc.).
EFSA (2015). The European Union summary report on trends and sources of zoonoses, zoonotic
agents and food-borne outbreaks in 2013. EFSa Journal 13.
Farber, J. M. & Peterkin, P. I. (1991). Listeria monocytogenes, a food-borne pathogen. Microbiological
reviews 55, 476-511.
Fedio, W. & Jackson, H. (1989). Effect of tempering on the heat resistance of Listeria monocytogenes.
Letters in applied microbiology 9, 157-160.
Gay, M., Cerf, O. & Davey, K. (1996). Significance of pre-incubation temperature and inoculum
concentration on subsequent growth of Listeria monocytogenes at 14°C. Journal of applied
bacteriology 81, 433-438.
George, S. M. & Lund, B. M. (1992). The effect of culture medium and aeration on growth of Listeria
monocytogenes at pH 4.5. Letters in applied microbiology 15, 49-52.
Gibson, A. M., Bratchell, N. & Roberts, T. (1988). Predicting microbial growth: growth responses of
salmonellae in a laboratory medium as affected by pH, sodium chloride and storage temperature.
International journal of food microbiology 6, 155-178.
Gorski, L., Flaherty, D. & Mandrell, R. E. (2006). Competitive fitness of Listeria monocytogenes
serotype 1/2a and 4b strains in mixed cultures with and without food in the US Food and Drug
Administration enrichment protocol. Applied and environmental microbiology 72, 776-783.
Juneja, V., Marks, H., Mohr, T. & Thippareddi, H. (2013). Predictive model for growth of Clostridium
perfringens during cooling of cooked beef supplemented with NaCl, sodium nitrite and sodium
pyrophosphate. Journal of Food Processing and Technology 4, 1-12.
Junttila, J., Hirn, J., Hill, P. & Nurmi, E. (1989). Effect of different levels of nitrite and nitrate on the
survival of Listeria monocytogenes during the manufacture of fermented sausage. Journal of Food
Protection® 52, 158-161.
Koutsoumanis, K. P., Kendall, P. A. & Sofos, J. N. (2004). A comparative study on growth limits of
Listeria monocytogenes as affected by temperature, pH and aw when grown in suspension or on a
solid surface. Food microbiology 21, 415-422.

54
Membré, J. M., Ross, T. & McMeekin, T. (1999). Behaviour of Listeria monocytogenes under
combined chilling processes. Letters in applied microbiology 28, 216-220.
Metselaar, K. I., den Besten, H. M., Abee, T., Moezelaar, R. & Zwietering, M. H. (2013). Isolation and
quantification of highly acid resistant variants of Listeria monocytogenes. International journal of food
microbiology 166, 508-514.
Mullan, W. M. A. (2007).Calculator for determining the F value of a thermal process.
Murphy, P., Rea, M. & Harrington, O. (1996). Development of a predictive model for growth of Listeria
monocytogenes in a skim milk medium and validation studies in a range of dairy products. Journal of
Applied Bacteriology 80, 557-564.
Murphy, R., Marks, B., Johnson, E. & Johnson, M. (2000). Thermal inactivation kinetics of Salmonella
and Listeria in ground chicken breast meat and liquid medium. Journal of Food Science 65, 706-710.
Pagán, R., Condón, S. & Sala, F. (1997). Effects of several factors on the heat-shock-induced
thermotolerance of Listeria monocytogenes. Applied and environmental microbiology 63, 3225-3232.
Pin, C., Baranyi, J., Fernando, D. & García, G. (2000). Predictive model for the growth of Yersinia
enterocolitica under modified atmospheres. Journal of applied microbiology 88, 521-530.
Pine, L., Malcolm, G., Brooks, J. & Daneshvar, M. (1989). Physiological studies on the growth and
utilization of sugars by Listeria species. Canadian journal of microbiology 35, 245-254.
Robinson, T. P., Aboaba, O. O., Kaloti, A., Ocio, M. J., Baranyi, J. & Mackey, B. M. (2001). The effect of
inoculum size on the lag phase of Listeria monocytogenes. International journal of food microbiology
70, 163-173.
Ross, T., Dalgaard, P. & Tienungoon, S. (2000). Predictive modelling of the growth and survival of
Listeria in fishery products. International journal of food microbiology 62, 231-245.
Silva, R. R., Moraes, C. A., Bessan, J. & Vanetti, M. C. D. (2009). Validation of a predictive model
describing growth of Salmonella in enteral feeds. Brazilian Journal of Microbiology 40, 149-154.
Smith, S. & Schaffner, D. W. (2004). Evaluation of a predictive model for Clostridium perfringens
growth during cooling. Journal of Food Protection® 67, 1133-1137.
Stewart, C. M., Cole, M. B., Legan, J. D., Slade, L., Vandeven, M. H. & Schaffner, D. W. (2002).
Staphylococcus aureus growth boundaries: moving towards mechanistic predictive models based on
solute-specific effects. Applied and environmental microbiology 68, 1864-1871.
Sutherland, J. & Bayliss, A. (1994). Predictive modelling of growth of Yersinia enterocolitica: the
effects of temperature, pH and sodium chloride. International journal of food microbiology 21,

55
197-215.
Sutherland, J., Bayliss, A. & Roberts, T. (1994). Predictive modelling of growth of Staphylococcus
aureus: the effects of temperature, pH and sodium chloride. International journal of food microbiology
21, 217-236.
Sutherland, J., Bayliss, A. & Braxton, D. (1995). Predictive modelling of growth of Escherichia coli
O157: H7: the effects of temperature, pH and sodium chloride. International journal of food
microbiology 25, 29-49.
Te Giffel, M. & Zwietering, M. (1999). Validation of predictive models describing the growth of Listeria
monocytogenes. International journal of food microbiology 46, 135-149.
Tompkin, R. B. (2002). Control of Listeria monocytogenes in the food-processing environment. Journal
of food protection 65, 709-725.
Walker, S., Archer, P. & Banks, J. G. (1990). Growth of Listeria monocytogenes at refrigeration
temperatures. Journal of Applied Bacteriology 68, 157-162.
Zwietering, M., Jongenburger, I., Rombouts, F. & Van't Riet, K. (1990). Modeling of the bacterial
growth curve. Applied and environmental microbiology 56, 1875-1881.
Zwietering, M., De Wit, J. & Notermans, S. (1996). Application of predictive microbiology to estimate
the number of Bacillus cereus in pasteurised milk at the point of consumption. International journal of
food microbiology 30, 55-70.
Zwietering, M. H. & den Besten, H. M. (2011). Modelling: One word for many activities and uses.
Food microbiology 28, 818-822.