validation of gating systems using a homemade …
TRANSCRIPT

VALIDATION OF GATING SYSTEMS USING AHOMEMADE GATING PHANTOM
Strugačevac, Maja
Master's thesis / Diplomski rad
2016
Degree Grantor / Ustanova koja je dodijelila akademski / stručni stupanj: Josip Juraj Strossmayer University of Osijek, Department of Physics / Sveučilište Josipa Jurja Strossmayera u Osijeku, Odjel za fiziku
Permanent link / Trajna poveznica: https://urn.nsk.hr/urn:nbn:hr:160:397040
Rights / Prava: In copyright
Download date / Datum preuzimanja: 2022-02-13
Repository / Repozitorij:
Repository of Department of Physics in Osijek

UNIVERSITY JOSIP JURAJ STROSSMAYER OSIJEK
DEPARTMENT OF PHYSICS
MAJA STRUGAČEVAC
VALIDATION OF A GATING SYSTEMS USING A
HOMEMADE GATING PHANTOM
Master thesis
OSIJEK, 2016

UNIVERSITY JOSIP JURAJ STROSSMAYER OSIJEK
DEPARTMENT OF PHYSICS
MAJA STRUGAČEVAC
VALIDATION OF A GATING SYSTEMS USING A
HOMEMADE GATING PHANTOM
Master thesis
Suggested to the Department of Physics of the University Josip Juraj Strossmayer in Osijek in
order to acquire the academic title MASTER OF EDUCATION OF PHYSICS AND
COMPUTER SCIENCE
OSIJEK, 2016

III
"This master thesis is made in Essen under the supervision of PD Dr. rer. nat. Lutz
Lüdemann and Assoc. prof.dr.sc. Dario Faj as part of the Graduate Study of Physics and
Computer Science at the Department of Physics of the University of Josip Juraj
Strossmayer in Osijek".

IV
Preface
First of all I would like to thank PD Dr. rer. nat. Lutz Lüdemann who gave me the
opportunity to write this thesis in university hospital Essen (UKE). While working in UKE I
gained knowledge and experience in medical physics which is important for my further work.
As well as to Dr. Lüdemann I would like to thank my second mentor Assoc. prof.dr.sc. Dario
Faj who gave me support during my stay in Essen and helped me in the writing phase in Croatia.
I would also like to thank Mr. Steve Günzerodt and Mr. Patrick Zylka as well as the
whole physics team in UKE who helped me and supported me during my work.
Many thanks to my family which supported my idea of going to Essen and writing my
thesis there and braced me not just during writing my thesis, but during the entire studies.
Special thanks to Niklas Ullrich who used his engineering knowledge and language
skills to help me during my work. Moreover he was my greatest support from the idea of writing
this thesis in UKE to the very end. Also many thanks to his parents who gave me great support
and a family during my stay in Essen.
V
Table of content
1. Introduction................................................................................................................1
2. Theoretical background............................................................................................2
2.1. Radiation and dose.........................................................................................2
2.1.1. Radiation used for medical purposes.....................................................2
2.1.2. Definition of the dose.................................................................................4
2.1.3. Dose measurements...................................................................................5
2.2. Radiation therapy...........................................................................................8
2.3. Tumor motion................................................................................................9
2.3.1. Tumor motion caused by breathing...........................................................9
2.3.2. Problems caused by respiratory motion during radiotherapy...................10
2.3.3. Gated radiotherapy...................................................................................11
2.3.4. Breath-hold therapy..................................................................................13
3. Materials and Methods....................................................................................................15
3.1. Computed tomography........................................................................................15
3.1.1. General about CT.....................................................................................15
3.1.2. Patient positioning and CT imaging.........................................................16
3.2. Treatment planning..............................................................................................18
3.3. Linear accelerators at University Clinic Essen.................................................20
3.3.1. Technical workflow of a clinical linear accelerator.................................20
3.3.2. Patient treatment......................................................................................21
3.4. Varian Real-time Position Management system..........................................22
3.5. GateRT.........................................................................................................25
3.6. Gating phantom....................................................................................................28
3.6.1. Description of the phantom......................................................................28
3.6.2. Phantom motion.......................................................................................33
4. Results and discussion.....................................................................................................36
4.1. Portalvision MV Imaging System..........................................................................36
4.2. Comparison of the breathing curves made by Varian RPM and GateRT systems.38
4.3. Film dosimetry........................................................................................................40
4.4. The dose measurements..........................................................................................42
5. Conclusion..........................................................................................................................55
6. Literature...........................................................................................................................56
VI
Sveučilište Josipa Jurja Strossmayera u Osijeku Diplomski rad
Odjel za fiziku
VALIDACIJA GATING SUSTAVA KORISTEĆI GATING FANTOM
KUĆNE IZRADE
MAJA STRUGAČEVAC
Sažetak
Gating radioterapija jedna je od metoda liječenja tumora pluća. U ovoj vrsti terapije CT
snimanje sinkronizirano je s tretmanom zračenja pomoću disanja pacijenta snimanog sustavom
za praćenje disanja pacjenata (imaging sustav).
Glavna svrha ovog rada je provjera valjanosti dva imaging sustava, Varian RPM i GateRT,
koristeći fantom koji simulira disanje pacjenta. Krivulja disanja fantoma snimana je s oba
sustava te su dobivene krivulje uspoređene. Vrijeme reakcije oba sustava izmjereno je te je
izračunata razlika između položaja očitanog na gating sustavu i stvarnog položaja fantoma.
Krivulja disanja implementirana je u plan zračenja koji je korišten pri zračenju fantoma.
Napravljena je film dozimetrija kako bi se dobilo saznanje o passing rates za oba sustava.
Vrijeme reakcije oba sustava ne utječe značajno na razliku između stvarnog položaja i položaja
koji u tom trenutku snima imaging sustav. Film dozimetrija pokazala je kako je passing rates
najviši za breath-hold terapiju. Za terapiju bez breath-holda passing rates nije dovoljno visok
kako bi se taj tip terapije preporučio u svakodnevnom liječenju tumora pluća.
64 stranice, 41 slika, 3 tablice, 20 literaturnih navoda
Rad je pohranjen u knjižnici Odjela za fiziku
Ključne riječi: Gated radioterapija/ GateRT/ gibanje tumora/ tumor pluća/ Varian RPM
Mentor: PD Dr. rer. nat. Lutz Lüdemann
izv.prof.dr.sc. Dario Faj
Ocjenjivači: izv.prof.dr.sc. Vanja Radolić, predsjednik
izv.prof.dr.sc. Dario Faj, mentor
dr.sc. Lutz Lüdemann, sumentor
mr.sc. Slavko Petrinšak, član
Rad prihvaćen:
VII
University Josip Juraj Strossmayer Osijek Master of Physics Thesis
Department of Physics
VALIDATION OF A GATING SYSTEMS USING A HOME MADE
GATING PHANTOM
MAJA STRUGAČEVAC
Abstract
Gated radiation therapy is a method for lung cancer treatment. In this type of therapy CT
imaging and the treatment are synchronized with the patients breathing monitored by imaging
systems.
The main purpose of this work is the validation of two monitoring systems Varian RPM and
GateRT using a homemade gating phantom simulating the patients breathing. The breathing
curve of the phantom was recorded with both systems and compared. The reaction time of both
systems and the difference between the monitored position and the actual phantom position was
calculated. The breathing curve was implemented in the treatment plan used for irradiation of
the phantom. During the gated irradiation film dosimetry was used to gain knowledge about the
passing rates for each system.
The reaction times of both systems do not influence the difference between the monitored
position and the actual phantom position significantly. The film dosimetry showed high passing
rates for breath-hold therapy. For the gated therapy without breath-hold passing rates are not
sufficient to recommend gated therapy in everyday cancer treatment.
64 pages, 41 figures, 3 tables, 20 references
Thesis deposited in Department of Physics library
Keywords: Gated radiotherapy/ GateRT/ lung cancer/ tumor motion/ Varian RPM
Supervisor: PD Dr. rer. nat. Lutz Lüdemann
Assoc. prof.dr.sc. Dario Faj
Reviewers: Assoc. prof.dr.sc. Vanja Radolić, president
Assoc. prof.dr.sc. Dario Faj, supervisor
PD Dr. rer. nat. Lutz Lüdemann, supervisor
mr.sc. Slavko Petrinšak, member
Thesis accepted:

1
1. Introduction
Since lung cancer is one of the leading by the mortality due to cancer, numerous studies
of early detection and treatment of this type of cancer were made. One of these studies made
by Y.Seppenwoolde et al [1] explained tumor motion due to breathing what makes cancer
treatment a very complex process. Tumor motion causes image acquisition limitations,
treatment planning problems and most of all problems during irradiation of the tumor [2].
Therefore, new methods of tumor treatment associated with breathing motion were developed.
One of the latest methods of lung cancer treatment is gated radiotherapy. In this type of
therapy the breathing cycle of the patient is monitored and the radiation is delivered only in a
particular phase of the breathing cycle. Different types of the imaging systems were developed
in order to monitor patients breathing. For a successful gating therapy it is important that the
difference between the monitored position and the actual position is minimized. This depends
on the delay time of the monitoring system. If the system has an excessive time delay the
radiation will be delivered when the patient is out of the planned position. Until now many
researches were made in order to explore reaction time between imaging system and linear
accelerator as one made by Jin JY and Yin FF [3] got in their study 0.17 ± 0.03 s time delay of
an imaging system. As the systems for monitoring of breathing were developed and improved
with time this study validates two of these systems, Varian RPM system and GateRT.
A homemade gating phantom made in university hospital Essen was used to simulate a
breathing patient. The breathing curves and reaction times of both systems were calculated and
compared. Using film dosimetry, the dose delivered to the phantom during gated therapy was
measured. The measured dose values for radiotherapy gated with Varian RPM system and
GateRT as well as values of the static case without the motion were compared in order to
validate the systems.
All measurements were made in university hospital Essen using the tracking systems
Varian RPM and GateRT in order to validate both systems and get a conclusion about their
applicability in radiotherapy.
2
2. Theoretical background
2.1. Radiation and dose
2.1.1. Radiation used for medical purposes
Until the end of the 19th century the word radiation was used to describe electromagnetic
waves. At the beginning of the 20th century X-Rays, electrons and natural radioactivity were
discovered and associated to the term radiation. Today radiation refers to the whole
electromagnetic spectrum as well as to all atomic and subatomic particles which have been
discovered [4].
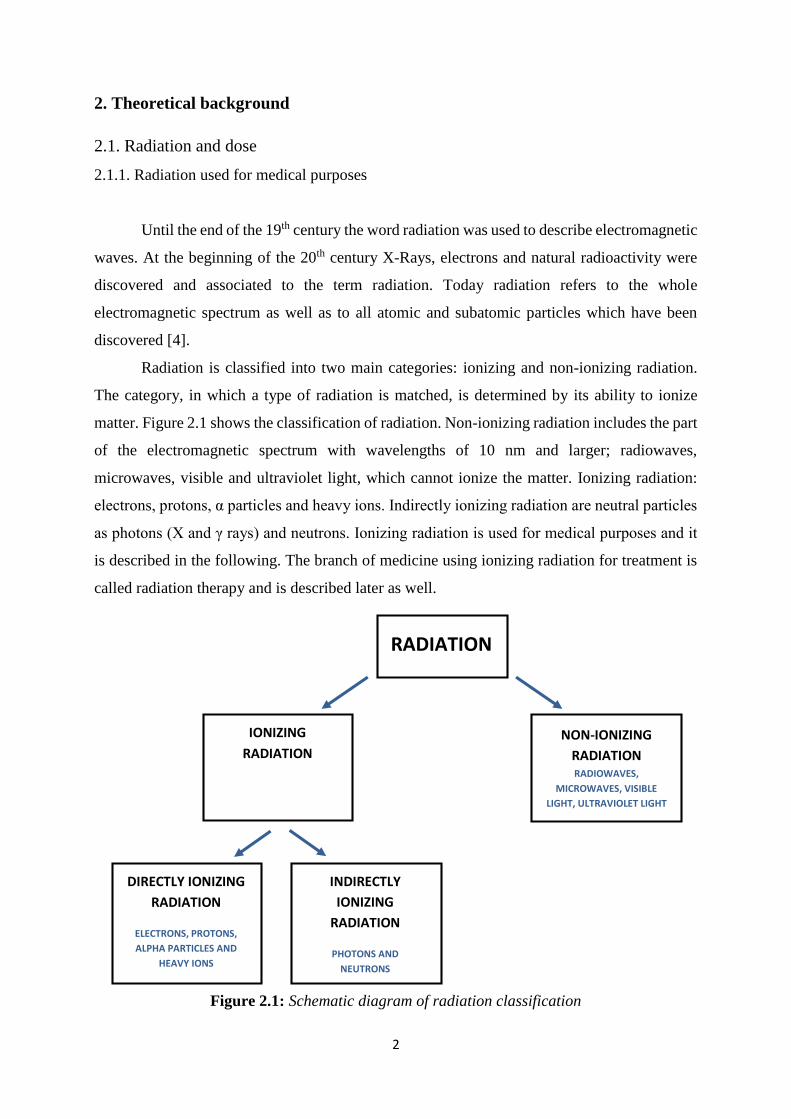
Radiation is classified into two main categories: ionizing and non-ionizing radiation.
The category, in which a type of radiation is matched, is determined by its ability to ionize
matter. Figure 2.1 shows the classification of radiation. Non-ionizing radiation includes the part
of the electromagnetic spectrum with wavelengths of 10 nm and larger; radiowaves,
microwaves, visible and ultraviolet light, which cannot ionize the matter. Ionizing radiation:
electrons, protons, α particles and heavy ions. Indirectly ionizing radiation are neutral particles
as photons (X and γ rays) and neutrons. Ionizing radiation is used for medical purposes and it
is described in the following. The branch of medicine using ionizing radiation for treatment is
called radiation therapy and is described later as well.
Figure 2.1: Schematic diagram of radiation classification
RADIATION
NON-IONIZING
RADIATION RADIOWAVES,
MICROWAVES, VISIBLE
LIGHT, ULTRAVIOLET LIGHT
IONIZING
RADIATION
DIRECTLY IONIZING
RADIATION
ELECTRONS, PROTONS,
ΑLPHA PARTICLES AND
HEAVY IONS
INDIRECTLY
IONIZING
RADIATION
PHOTONS AND
NEUTRONS

3
The most common types of ionizing radiation used in medical treatment are
electrons, protons, neutrons and photons. Due to different properties they can be used for
different purposes.
Electrons
Electrons produced in linear accelerators are usually used in external beam radiotherapy.
As electrons have a finite range after which the dose decreases rapidly, they are mostly used for
skin tumors or tumors close to the surface. The main benefit of electron therapy is sparing
deeper healthy tissue from irradiation. The depth of the treatment is determined by the chosen
energy, electrons with higher energy can reach deeper into the tissue. The most common use of
electrons in radiation therapy is in skin cancer treatment, nodal irradiation and melanoma or
lymphoma treatment.
Protons
Protons are positively charged subatomic particles which can be used in radiation
therapy. As protons have a relatively high mass, a proton beam does not have a wide lateral
side scatter while passing through the tissue. The maximum interaction of protons with matter
occurs when the proton reaches the tumor. In that way tissue from the skin to the tumor gets a
reduced dose and the tumor gets the maximal dose [5]. If the tumor is located deeper, the proton
accelerator has to produce a high energy beam to reach the tumor. Accelerators usually produce
proton beams with an energy range from 70 to 250 MeV. This energy can be adjusted in the
accelerator to give maximal damage to the tumor and minimal damage to the surrounding tissue.
Proton therapy is mostly used for ocular tumors, skull base, paraspinal and prostate tumors.
Neutrons
Neutrons are subatomic particles which have no charge. As they are uncharged, they
damage tumor cells by nuclear interactions. Malignant tumors usually have a low oxygen level
which means that they can be resistant to low linear energy transfer radiation. As neutrons
produce a high linear energy transfer radiation, in some cases neutron therapy could be a more
effective way of treatment. According to K. Shahri et al [6] neutron therapy requires one third
of the effective dose for destroying the same number of cancerous cells which would be used
in proton therapy. Further studies have shown some disadvantages of neutron therapy.
Absorbed dose calculation does not take into consideration additional neutron capture in
hydrogen-rich tissues which leads to higher energy release. The fact that RBE (relative

4
biological effectiveness) varies in different tissues was discarded as well as one that RBE
increases with dose decrease which reduces the dose in surrounding tissue. Previous thought
that RBE also varies with cell proliferation rate was also discarded [7]. Taking into account the
new findings leads us to the conclusion that neutron therapy should be more explored.
Photons
Photons are elementary particles also used in radiation therapy. Photon beam therapy
uses X-Rays generated from linear accelerators or γ rays emitted from sources like cobalt
(60Co). The linear accelerator produces megavoltage X-Rays whose shape and intensity can be
modified. The cobalt source machine is usually used for whole body irradiation while its
precision in radiation delivery is not as high as with linear accelerator.
The photon beam affects body cells from the skin where it enters the body, through the tumor
and until it exits the body. With the treatment plan the radiation delivery can be adjusted in a
way that the highest dose is delivered to the tumor with as little as possible dose to the
surrounding tissue. The photon beam therapy is the most common way of tumor treatment and
it will be used in this work as well.
2.1.2. Definition of the dose
One of the main terms describing radiation is the dose. There are different dose terms
with different definitions used in radiotherapy and this chapter describes some of them.
The absorbed dose is defined in terms of the related stochastic quantity energy imparted Є.
According to F. H. Attix [8] the energy imparted by ionizing radiation to matter of mass m in
volume V can be defined as:
Є = (Rin)u – (Rout)u + (Rin)c – (Rout)c + ∑Q (2.1.)
where (Rin)u is the radiant energy of uncharged particles entering volume V, (Rout)u is the radiant
energy of all uncharged particles leaving volume V, (Rin)c is the radiant energy of the charged
particles entering volume V, (Rout)c is the radiant energy of the charged particles leaving volume
V, ∑Q is the energy derived from rest mass in volume V.
The absorbed dose at any point in volume V can be defined as:
D = 𝑑𝜖
𝑑𝑚 (2.2.)
where 𝑑𝜖 is the expected value of the energy imparted at observed point in an infinitesimal
volume V whereas 𝑑𝑚 is the mass in that volume. Thus, the absorbed dose D is the expectation
value of the energy imparted to matter per mass unit. That leads us to the measurement unit of

5
the absorbed dose which is defined as the absorption of one joule of radiation energy per
kilogram of matter (𝐽
𝑘𝑔) which can also be expressed as 1 Gray.
The equivalent dose takes the different biological effectiveness of different radiation
qualities into consideration and is defined as:
HT = ∑ 𝑊𝑅 R ·DT, R’ (2.3)
where DT,R’ is the absorbed dose averaged over tissue due to the radiation and WR are weighting
factors which are estimated by relative biological effectiveness values at low doses and low
dose rates. The measurement unit for the equivalent dose is Sievert (Sv). For deterministic
effects at high doses the International Commission of Radiological Protection suggests the
following definition of the equivalent dose:
He = ∑ 𝑅𝐵𝐸𝑅 R, e ·DR (2.4)
where RBER,e are relative biological effectiveness values and DR the absorbed dose. The
measurement unit of the equivalent dose expressed by this relation is grey-equivalent (GyE).
The effective dose takes different tissue weighting factors wT for non-uniform exposure
to radiation into consideration. They reflect the different radiogenic sensitivity of the different
organs. The effective dose is then calculated with following formula:
HE = ∑ 𝑤𝑇 THT (2.5.)
where wT are earlier mentioned weighting factors and HT is the equivalent dose.
2.1.3. Dose measurements
During radiation therapy it is necessary to accurately measure the dose given to the
patient. In that way it is possible to avoid damage of normal body cells to much. It is important
to mention that energy absorbed per unit of mass (absorbed dose) will differ for two different
materials even if they are exposed to the same photon fluence. Reason for that is the difference
in electron density of the materials. In quantum mechanics electron density is defined as the
probability of finding an electron in volume V:
ρ(r) = N ∑ ⋯𝑆1∑ ∫ 𝑑𝑟2𝑆𝑁
⋯ ∫ 𝑑𝑟𝑁 ǀ ψ ( r, s1, r2, s2, ... , rN, sN) ǀ = ⟨𝜓ǀ𝜌(𝑟)ǀ𝜓⟩ (2.6.)
If the electron density is higher, the probability that radiation particle will react with it is higher
which implies that energy imparted per unit of mass will be higher. As body tissues consist of
different materials, the electron densities of different tissues differ and the dose will vary even
if they are exposed to the same radiation flux. According to the Brag-Gray theory the difference

6
between doses will be proportional with mass collision stopping power ratio as coefficient of
proportion. Namely, Bragg-Gray theory says that if a fluence Φ of identical charged particles
of kinetic energy T passes through an interface between two different media g and w, the dose
on the g side of boundary can be expressed as:
Dg = Φ[(𝑑𝑇
𝜌𝑑𝑥)
𝑐,𝑔]
𝑇
(2.7.)
where [(𝑑𝑇
𝜌𝑑𝑥)
𝑐,𝑔]
𝑇
is the mass collision stopping power of the media g evaluated at energy T.
The dose on the boundary of w media can be expressed as:
Dw = Φ[(𝑑𝑇
𝜌𝑑𝑥)
𝑐,𝑤]
𝑇
(2.8.)
where [(𝑑𝑇
𝜌𝑑𝑥)
𝑐,𝑤]
𝑇
is the collision stopping power of the media w evaluated at energy T.
Combining those two equations and assuming that fluence Φ is continuous, we come to the
equation for the ratio of the absorbed dose in two media:
𝐷𝑤
𝐷𝑔 =
(𝑑𝑇
𝜌𝑑𝑥)
𝑐,𝑤
(𝑑𝑇
𝜌𝑑𝑥)
𝑐,𝑔
(2.9.)
In dosimetry of radiation therapy the absorbed dose is usually measured and expressed
as absorbed dose to water. As humans body consists of around 70% of water and has overall
density around 1 𝑔
𝑐𝑚3 it is natural to calculate and calibrate dose measurements as dose to water.
Knowing the absorbed dose to water and collision stopping powers of water and observed media
it is easy to calculate dose in medium or tissue of interest using equation 2.9. More about Bragg-
Gray theory and converting absorbed dose to one media to absorbed dose to second media can
be read in Introduction to radiological physics and radiation dosimetry by Frank Herbert Attix
[8].
A dose can be measured by exposing convenient dosimeter to the radiation. “A radiation
dosimeter is a device, instrument or system that measures or evaluates, either directly or
indirectly, the quantities exposure, kerma, absorbed dose or equivalent dose, or their time
derivatives (rates), or related quantities of ionizing radiation” [9]. A dosimeter must have at
least one physical property which is a function of the measured dosimetric quantity that it can
be used for dosimetry measurements. It also has to be properly calibrated before use in order to
get valid measurement data. To get accurate measurement results dosimeters should have the
following characteristics: precision, linearity, dose rate dependence, energy response,
directional dependence and spatial resolution. Not all dosimeters can satisfy mentioned
characteristics. Therefore the dosimeters are selected according to what has to be measured. For

7
instance, ionization chambers will be chosen for determination of radiation dose, while films
will be chosen for geometry, positioning and dose with not so good dose accuracy. During this
study we were interested in positioning. For that reason Gafchromic EBT3 films were used as
dosimeters and they will be explained in following.
EBT3 films consist of an active layer thickness from 26 to 28 µm. That layer contains
active component, marker dye, stabilizers and other additives that provide low energy-
dependence. Active layer is placed between two transparent polyester substrates thickness about
120 µm [10]. The structure of the film can be seen on Figure 2.2. Since the film is symmetric it
is not necessary to track the film sides, while it can be scanned with any side facing the light
source. The polyester layers contain microscopic silica particles which maintain a gap between
film and scanner glass. As the gap is almost 10 times wavelength of visible light, appearance
of the Newton’s Rings is prevented.
Figure 2.2: The structure of the Gafchromic EBT3 Dosimetry Film. Source: Gafchromic
EBT3 Scan Handling Guide [10]
EBT3 films are used for dose measurements in external beam radiation therapy. When
the film is exposed to the photon radiation, photons induce reaction with matter in polyester
layer. Result of that reaction is lower energy photon and electron. Electron then reacts with
active layer what we can see as darkening of the film. Some of the photons pass through film
to second polyester layer and then interact with it and as a result there are backscattered
electrons which are then captured in active layer. It is important to mention that scattered
electrons are responsible for the main part of the darkening, but also some of the photons are
included. After exposure of film to the radiation film is scanned and dose can be recalculated
from the optical density. During scanning photons are again used to read the data from the film.

8
2.2. Radiation therapy
Shortly after the discovery, radioactivity was used for medical purposes. One of the
purposes is radiation therapy as an important part of cancer treatment. The radiation therapy is
a cancer treatment therapy which uses ionizing radiation to stop the growth or destroy malignant
cells. It is a good way to treat different types of cancers as long as they are localized. Another
application of the radiation therapy is after the tumor surgery to remove primary malignant
tumor. The mechanism of such therapy is effective for a cancer treatment considering that it
damages the DNA or genes responsible for the replication or growth of the cells.
As well as a normal tissue cells, tumor cells have 5 phases of the replication cycle.
Difference is that tumor cells have a mutation which tends them to divide more often since they
are undergoing through the replication cycle much faster than the normal cells. This leads to
the uncontrolled tissue growth. During the radiation therapy, particles, which are moving at a
high frequency, are used to target the DNA of cancer cells and change the way they are able to
replicate. The DNA can only be changed during the replication process in the phase when the
cell is preparing for division and not in the normal, resting state. When the DNA or gene for
replication is changed, the tumor cell is not able to replicate in its usual way and the growth of
a tumor is stopped. As it was mentioned before, cancerous cells pass through the replication
cycle much faster than healthy tissue cells. According to that cancerous cells will be more often
in the state when DNA can be damaged which means that radiation therapy will affect more
cancerous cells then the healthy ones and save the tissue around the tumor. Despite that, some
healthy tissue cells will be damaged which is one of the unwanted side effects.
In usual radiation therapy treatment total dose is divided into fractions. In that way total
dose is delivered to the tumor in small amounts during several treatments. As normal tissue
cells can recover much faster than the tumor ones, delivering the dose in small amounts gives
normal cells a chance to recover from one fraction until the other. This technique gives an
opportunity to treat cancerous cells effectively with less impact on the surrounding tissue. Some
fast growing tissues are often affected right away. Other tissues like nerve, breast and bones
react more slowly to the treatment. That increases the level of side effects. The radiation therapy
is balancing between irradiation of cancerous cells and minimizing damage of the normal body
cells in the surrounding area of the tumor.
External beam radiation therapy is type of a cancer treatment during which radiation
beam is directed through the skin to the tumor. The beam is usually generated by linear
accelerator which can produce a high energy photons or electrons. Beam can also be emitted
9
by radioactive sources like cobalt or caesium. There are several ways of external beam radiation
therapy, some of them are three-dimensional conformal radiation therapy, intensity modulated
radiation therapy, stereotactic radiation therapy, particle therapy and gated radiation therapy.
2.3. Tumor motion
2.3.1. Tumor motion caused by breathing
Irradiation of certain tumors is complex due to their motion caused by breathing. This
refers to tumors of the thorax area; lungs, breast, liver or pancreas. According to the American
Association of Physicists in Medicine [2] the most important muscle for inhalation is the
diaphragm. While the diaphragm contracts it moves down, forcing the abdomen to move down,
too. As a result the superior-inferior (SI) dimension of the chest cavity is increasing. The
muscles connecting the ribs participate in normal inhalation as well. They contract during
inhalation, pulling the ribs superiorly and anteriorly increasing both the lateral and anterior–
posterior (AP) movement of the thorax. Therefore a three dimensional tumor motion occurs.
Many researches regarding tumor motion have been made, but we will take a look at
those related to the movement of lung tumors. Y.Seppenwoolde et al [1] investigated 3D motion
of the lung tumor due to breathing during radiotherapy. Golden markers were implanted in or
near the tumor of twenty patients. Tracking the markers motion, different parameters were
measured; the amplitude, the position of the tumor in the inhale and exhale phases, the average
tumor position and the breathing cycles length. The results were fit into a function describing
the tumors position:
s (t) = s0 – S cos2n(𝜋∙𝑡
𝜏− 𝛷) (2.10.)
where s0 is the tumors position during exhalation phase, S is the amplitude of the tumor
movement, 𝜏 is the time period of breathing cycle in seconds and 𝛷 is the starting phase.
Parameter n comes from fitting the measurement results into the function. It is described as
parameter which gives the shape of the curve corresponding to the fact that between end of the
exhalation and beginning of the inhalation phase amplitude is constant for a small time period.
Figure 2.3 shows that effect. Parameter n has a value of 1 or 2 for most patients.

10
Figure 2.3: Plot of the function 2.10. with the values of the parameter n = 1,2,3,4. Source:
Bouguessaa, L.: Konstruktion eines Gatingphantoms für die Strahlentherapie [11]
Y. Seppenwooldes study gives us the amplitude values of three dimensional tumor
motion. The lateral motion amplitude has values from 0,2 mm to 2,8 mm, while the anterior–
posterior direction showed amplitude values from 0,2 mm to 8,2 mm. The highest amplitude is
observed in cranial-caudal direction with values from 0,2 mm to 24,6 mm. As we can see, the
motion of the lung tumor caused by breathing has an important role and should be taken into
consideration during lung cancer treatment.
2.3.2. Problems caused by respiratory motion during radiotherapy
As described earlier, breathing causes tumor motion in the thorax area. This chapter
explains the problems caused by respiratory motion. The first problem are image acquisition
limitations. Respiratory motion should be taken into consideration during image acquisition; if
not it can cause artifacts. These artifacts then cause incorrect positional and volumetric
information, but also distortion of the target volume. They occur because the parts of the object
move in and out the CT slice window. They are most common for thorax CT images while the
biggest motion is observed in that area. Artifacts also have negative influence on the accuracy
of the dose calculation [2].
The next problem are treatment planning limitations. The margins of the irradiated tissue
have to be contoured during treatment planning. The marked area includes the tumor tissue as
well as the surrounding tissue which might contain microscopic spread of the tumor. This area

11
is called clinical target volume (CTV). As the lung tumor is moving during therapy it is
important to expand the margins to cover the tumor area in every position during movement.
This increases the volume of the healthy tissue exposed to radiation, causing an amplification
of side effects. If the motion of the tumor is not included into the margins, parts of the CTV
will not get the required dose and the therapy will not be fully successful. Accurate
determination of a margin, including respiratory motion, but saving healthy tissue at the same
time, is hard if respiratory motion is not included in CT acquisition and artifacts occur.
The main problem of respiratory motion can be seen during the irradiation of a tumor.
As described before, the lung tumor moves due to breathing, with not insignificant amplitude.
If this is not taken into consideration, the tumor will move out of the planned margins and the
healthy tissue will be irradiated instead. Sometimes, even if tumor motion is considered,
respiratory movement can be so high that tumor will partly leave the planned margins. Different
techniques of radiation therapy have been developed to reduce tumor motion to a minimum.
Some of the methods are: respiratory gating method, breath-hold method, motion-
encompassing method and forced shallow breathing with abdominal compression. The first two
methods are described in next paragraphs.
2.3.3. Gated radiotherapy
During gated radiotherapy, the radiation is given to the patient only in a particular phase
of the patients breathing cycle. This phase is usually called “gate”. This gates position and width
in the breathing cycle are determined by monitoring the patient’s respiratory motion. External
or internal markers can be used for this. As the beam is not continuously delivered, this type of
therapy takes more time than non-gated one [2].
In gated radiotherapy, imaging and treatment are synchronized by patient’s breathing
cycle. Using that synchronization it is possible to contract the margins of the irradiated area, to
reduce side effects of radiation and save the healthy tissue around the tumor. Gated radiation
therapy has its benefits but there are also some disadvantages which have to be mentioned. The
breathing of the patient has to be continuous and with as little deviation as possible which is
hard to achieve. When an external marker is used it has to be attached well on the patient to
ensure the marker moves only by the patients breathing and not by any external motion caused
for instance by the patients clothing. If internal marker is used, patients receiving this type of
therapy have to be able to tolerate the implantation procedure. Another difficulty which may

12
occur is the phase shift which means that the target position does not match the respiratory
motion.
As mentioned before two types of gated radiotherapy are possible, using an external
respiration signal or using internal markers. In this study gating using an external respiration
signal is used and it will be explained in detail.
Gating using an external respiration signal
Thanks to its non-invasive nature, gating using an external respiration signal can be used
for almost every patient. Currently, the most widely used system is the Varian Real-time
Position Management (RPM) system. The Varian RPM system is also used in this study and
described in detail in chapter 3.4.
The Varian RPM system uses an infrared reflective plastic box as an external marker.
This marker is placed on the patient’s anterior surface of the abdomen. This position is selected
to maximize the anterior-posterior thorax motion caused by breathing. The described position
is a standard location in the thorax area which can be changed in special cases according to the
patient’s physiognomy [12]. When the location of the marker is determined it is important to
make a durable skin mark at the box location to ensure the position can be reproduced during
the treatment. It is also recommended to write the location into the patient’s chart so that it can
be reconstructed if the skin mark has been erased. Another way to improve gated radiotherapy
is breathing training which can help the patient to breath uniformly and equally during the CT
imaging and the treatment.
A gated CT scan of a patient has to be made as a part of the treatment. The gating
parameters are determined before the CT imaging by observing the external respiration signal.
In a so called “prospective gated CT”, the respiration gating system sends a trigger to the CT
scanner once per breathing cycle to acquire a CT slice. The CT parameters are the same as for
standard CT scans. To avoid errors, it is important to adjust the gate width and CT scan rotation
time to be similar. If the gate width is smaller than the CT scan rotation time, the anatomic
position outside of the desired gate will be included in the CT image. On the other hand, if the
gate width is greater than the scan rotation time, more anatomic motion will appear during the
gate than captured on the CT scan. Differences in between gate width and CT scan rotation time
cause errors in the amount of captured motion on the CT scan which causes errors during the
treatment [2].

13
When the treatment plan is made, the patient’s treatment can start. The patient has to be
positioned as during CT scanning and the marker has to be placed on the previously used
position. The patient is instructed to breathe normally and in the same way as during the CT
imaging. When stabile breathing is established and the gating thresholds are verified, gated
radiation delivery can start. The system enables beaming automatically in the desired position
which was set up in the patient’s treatment plan. If the patient’s breathing becomes irregular or
differs from the simulation, the therapist can intervene in every moment.
2.3.4. Breath-hold therapy
As the name implies, this type of therapy is based on a breath-hold of the patient during
treatment. As described before, the tumor motion caused by breathing makes radiation delivery
to the tumor difficult. During the breath-hold therapy radiation is delivered while the patient
holds his breath to prevent respiratory motion and to keep the tumor motionless. In this case it
is much easier to deliver radiation just to the tumor tissue and to reduce irradiation of the
surrounding tissue. A disadvantage of this type of therapy is that the patient has to be able to
hold his breath for 5 to 20 seconds, depending on the used technique. There are different types
of breath-hold therapy. In this study self-held breath-hold therapy with respiratory monitoring
technique is used and explained in detail.
Self-held breath-hold therapy with respiratory monitoring
This technique uses the Varian RPM system to monitor the patients breathing and to
control the dose delivery. The patient has to hold his breath during a certain part of his breathing
cycle. During the breath-hold the radiation is delivered continuously what makes this technique
more efficient than the free breathing respiratory-gated techniques. Another advantage of this
technique is that respiratory motion is continuously monitored. If the breath-hold differs from
the desired one, the beam hold is turned on automatically. If that is not so, the tumor would
change its position when the breath-hold is changed and it would not be irradiated according to
the plan.
During CT imaging the respiratory motion of the patient is also monitored by the Varian
RPM system. The patients breathing is guided to ensure the CT scan is synchronized with the
breath hold. Sometimes it is necessary to repeat sequences until the entire region of interest is
scanned. This applies particularly to the thorax scanning where several breath-holds are

14
required to scan the entire area. These CT scans are used for treatment planning. The treatment
planner should take into consideration that it is hard for a patient to achieve the exact breath-
hold position as during the CT imaging and therefore leave the space for position deviations.
Before the treatment the patient is placed into the specified position and his breathing
cycle is gated and monitored by the system. When the tracked marker is in the gated interval,
the therapist can start the radiation delivery by turning the beam on. Radiation is delivered only
while the markers position is in the selected area. If a patient cannot hold his breath, he can start
breathing normally which will move the marker from the desired position and the beam hold
will turn on automatically [2]. The patient is then instructed to take a small break and continue
with the therapy afterwards.
15
3. Materials and Methods
3.1. Computed tomography
3.1.1. General about CT
The computed tomography (CT) is a radiological method providing multi-layer body
view. The basic idea is to measure the attenuation of X-rays after passing through a body and
reconstruct it into three dimensional images [9]. The X-ray source is emitting a beam which is
passing through the patient. A human body consists of different types of organs which are
consisting of different types of tissue. Every organ reacts differently with the X-ray beam due
to its structure. This means the beam will be absorbed differently in every tissue. This
absorption is expressed by the attenuation coefficient which is depended on the X-ray energy
and proportional to the atomic number and the electronic density of the tissue [13]. After the
beam has passed through the patient where it has been weakened, it is measured by detectors.
These detectors convert radiation into an electric signal proportional to the attenuation
coefficient of the observed tissue. A complex mathematical algorithm reconstructs the image
of the scanned body, using a series of these signals.
Components of the CT scanner
The main parts of the CT scanner are the gantry, the treatment couch, the control panel
and a computer system for the device control, display and image reconstruction. Some of those
parts will be explained in detail.
The gantry is a part of a CT scanner which contains system components required to
make a record. Since records have to be made from different angles the system components are
mounted inside of the gantry in the way that they can rotate and make an image at any angle.
The system components inside the gantry are the X-ray tube with a high voltage generator and
a tube cooling system, the collimator, the beam shaping filters, the detector arc, the data
acquisition and the rotation system [14]. X-ray tubes for CT machines have to be specially
designed to stand long-term exposure during the rotation of the tube around the patient and a
large number of exposures in short intervals. During the rotation of the tube high heat load is
produced, for that reason the gantry has a cooling system with water circulation taking over the
heat. During CT scanning the X-ray beam is collimated into desired dimensions and by beam
shaping filters the desired gradient can be achieved. After passing through the patient weakened

16
X-rays arrive on the detectors. The solid state detectors are used in CT for their very high
detection efficiency and fast response with little afterglow. When the X-ray interacts with the
detector it generates light which is converted into an electrical signal by photodiodes. The signal
is then used for image reconstruction.
The treatment couch has to move in vertical, lateral and longitudinal direction so that
the patient could be positioned in a required way. It also has to be able to stand high rotation
speeds of the gantry and high weights without bending.
The computer system for the device control, display and image reconstruction is a
complex system reconstructing the image of the irradiated area from the detected radiation. As
described earlier when the beam passes through the patient it is absorbed depending on the
density of the tissue which it passed through. The beam causes scintillation on the detectors.
This light signal is then measured by a photocathode, amplified by a photomultiplier and
preamplifier, detected by a high pulse analyzer and in the scintillation computer converted into
computer data. The analog-to-digital converter converts the data into a numeric value of
attenuation coefficients for each pixel. This data is stored as "raw data" and later converted into
Hounsfield units (HU). The HU scale is expressed relatively to the linear attenuation coefficient
of water at room temperature (µw):
HU = 𝜇𝑚𝑎𝑡𝑒𝑟𝑖𝑎𝑙 − 𝜇𝑤𝑎𝑡𝑒𝑟
𝜇𝑤𝑎𝑡𝑒𝑟 ·1000 (3.1.)
The Hounsfield scale has values from -1024 to +3074 where water has a value of 0 HU [14].
The picture is reconstructed on the monitor in grayscale.
3.1.2. Patient positioning and CT imaging
During CT imaging the positioning of the patient is determined by the area which should
be scanned. For scanning the thorax area, the patient is lying on his back holding his arms above
his head. In order to make imaging more comfortable for the patient a head-arm rest can be
used as well as a leg support. When the patient is placed in the required position, the CT
scanning can be done.
For gated treatment of lung cancer it is important to make a 4D CT. The 4D CT is made
of several 3D CT scans in different points of time which gives the fourth dimension. Time
points are then connected to the breathing curve. Breathing curve of the patients can be recorded
with the Varian RPM system. During the CT scanning it is important to place the tracing marker

17
on the patient to record the breathing. Further information about the Varian RPM system will
be given in chapter 3.4.
In the case of the phantom imaging can start after the phantom was started and set up in
a position where it is ensured that the Varian marker can be detected by the camera when driving
through the gantry. The software used in this work for making CT images is SOMATOM
Sensation 40/64 made by Siemens. After starting the software the phantom had to be registered
as a patient with name and date of birth. When the patient is registered the type of examination
can be selected. For the phantom that was Respiratory Retrospective which means that the CT
images are made continuously and then synchronized with a recorded breathing curve. The
images are then sorted into corresponding phase bins of the breathing cycle. When the
retrospective mode is selected a topogram can be made to define the examination range. When
the topogram is made and the examination range is defined the slice thickness, quality reference
value (mAs), kV settings and table position can be defined. In this work a slice thickness of 2.0
millimeters was used as well as quality reference value of 200 mAs and 100 kV. The breathing
curve is recorded by the Varian RPM system during the whole CT scan. The curve has to be
inserted in the CT scans. The next step is to reconstruct the CT scans for different breathing
phases and export the data. Detailed explanation of CT scans reconstruction can be found in
[15].
When the CT scans are exported to the treatment planning software the isocenter can be
determined. The position of the isocenter mostly depends on where the tumor and organs at risk
are located in the body. In the best case the isocenter is placed in the middle of the tumor. If the
organs of risk are close to the tumor the isocenter can be shifted closer to them to insure higher
precision of dose delivery. When the isocenter is determined the scans are exported back to the
CT. The CT software is connected to the laser system which is used to mark the isocenter
position on the patient’s skin or mask. The isocenter marks are an aid to find the right patient
position during the treatment on the accelerator.
When it comes to using a gating phantom the isocenter marks are done manually and
not with the laser system. The CT scans are exported to the treatment planning software and the
isocenter is placed in the middle of the tumor. The position of the isocenter was measured and
external marks were placed on the surface of the phantom. Before the irradiation, the position
of the phantom regarding the isocenter was corrected by comparing the treatment plan with the
kV or MV image. In that way the maximum precision of matching the planned isocenter with
the accelerator isocenter was achieved.
18
3.2. Treatment planning
The treatment planning in the external beam radiotherapy is used to set up and form the
radiation fields in order to deliver the required dose to the tumor while minimizing the dose to
organs at risk. Nowadays the treatment plan is a complex, computer based plan which contains
all necessary information for treatment such as couch, gantry and collimator position, dose
information, security checks, etc. The treatment plan is usually made by a radiation oncologist
and a medical physicist. The radiation oncologist contours the tumor, the planning target
volume (PTV) and the organs at risk on the CT scans. After contouring, the medical physicist
can begin the planning of radiation fields and dose distribution. The software used for treatment
planning in case of the gating phantom is Eclipse treatment planning.
When the medical physicist is creating the treatment plan based on the 4D CT he has to
choose the breathing phase in which he will plan and in which the radiation will be delivered.
In the case of the gating phantom the phase 90PI was chosen while in this phase maximum
inhalation was achieved. When the phase is chosen, fields can be set up. During insertion the
field has to be named and its energy and dose rate have to be defined as well as the positioning
tolerance. In this work Field 1 and Field 2 were used with maximum dose rate of 600 monitor
units per minute as well as energies of 6, 8 and 15 MV. If there is more than one linear
accelerator the chosen one has to be defined. When all parameters are set the field is inserted
into the CT scan. In the next step gantry rotation and couch position are defined. For the gating
phantom gantry positions 0° (Field 1) and 270° (Field 2) are used as can be seen in Figure 3.1.
Couch position was set up manually at the accelerator. To precisely shape the field a multileaf
collimator (MLC) is selected and by clicking the Fit the structure button the field is fit to the
defined Target structure, tumor or PTV. If necessary, leafs can be adjusted manually as well.
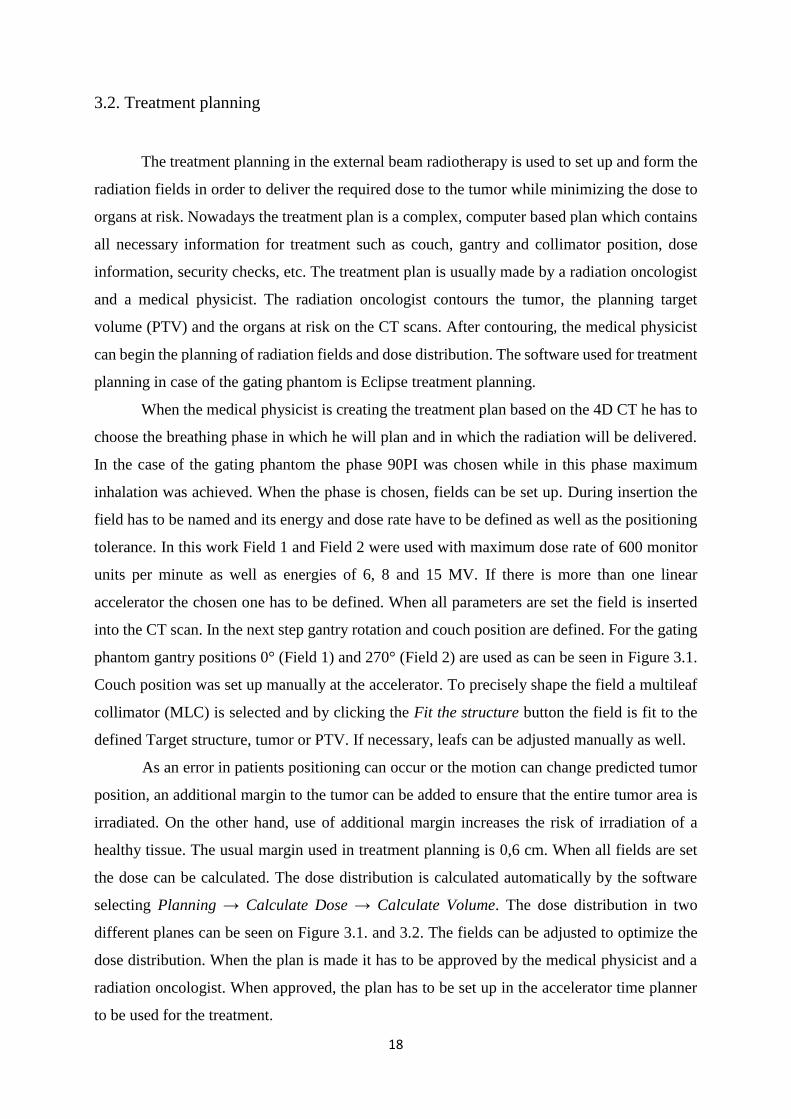
As an error in patients positioning can occur or the motion can change predicted tumor
position, an additional margin to the tumor can be added to ensure that the entire tumor area is
irradiated. On the other hand, use of additional margin increases the risk of irradiation of a
healthy tissue. The usual margin used in treatment planning is 0,6 cm. When all fields are set
the dose can be calculated. The dose distribution is calculated automatically by the software
selecting Planning → Calculate Dose → Calculate Volume. The dose distribution in two
different planes can be seen on Figure 3.1. and 3.2. The fields can be adjusted to optimize the
dose distribution. When the plan is made it has to be approved by the medical physicist and a
radiation oncologist. When approved, the plan has to be set up in the accelerator time planner
to be used for the treatment.

19
Figure 3.1.: Field 1 and Field 2 with corresponding isodose lines. Source: Eclipse treatment
planning
Figure 3.2.: Dose distribution for Field 1. Source: Eclipse treatment planning

20
3.3. Linear accelerators at University Clinic Essen
3.3.1. Technical workflow of a clinical linear accelerator
The linear accelerator (linac) is used in radiation therapy for tumor treatment. It uses
high frequency electromagnetic waves to accelerate charged particles to high energies. There
are two types of linear accelerators used for medical purposes. Linear accelerators with a
klystron are called high energy machines and they produce photon energies up to 23 MV and
electron energies up to 21 MeV. Linacs equipped with a magnetron are called middle energy
machines with photon energies up to 15 MV and electron energies of 14 MeV [16]. The linear
accelerator used in this work is Varian Clinac CL-2100 C/D and it can be seen in Figure 3.3.
Using microwaves, electrons are accelerated in the waveguide. These high energy electrons
collide with a heavy metal target and because of the resulting Bremsstrahlung high energy
photons are emitted. These photons are then filtered in a form determined in the treatment plan.
Figure 3.3: Varian Clinac CL-2100 C/D
Components of linear accelerators
Linear accelerators consist of three main parts. The stationary structure is mounted on
the floor of the treatment room. It contains parts as klystron or magnetron, depending on the
type of the accelerator, the radio-frequent waveguide, the circulator and the cooling system [9].
Klystron or magnetron is a source producing microwave radiation. This radiation then passes

21
the radio-frequent waveguide to the accelerator structure to accelerate the electrons. The water
cooling system ensures dissipation of the heat generated during the production of microwave
radiation and the acceleration of the electrons providing thermal stability to the system.
The gantry directs photons or electrons to the patient. It can rotate 185 degrees in a
clockwise direction and 185 degrees in the opposite direction. Main components are the pulse
forming network, the electron gun, the accelerator structure and the treatment head. The pulse
forming network provides flat topped DC pulses which are delivered to the electron gun. The
electron gun uses these pulses to produce electrons by thermionic emission. The pulsed electron
bunches are injected into the system and accelerated in the accelerator structure. The most
complex part of the gantry, the treatment head, contains components to shape and monitor the
treatment beam [9]. One of them is the bending magnet, bending the pulses of the electrons.
The electrons collide with the target, producing high energy photons. These photons are passing
through the beam flattening filter which shapes the beam in cross sectional shape and ensures
uniformity and symmetry of the beam. This beam passes through the monitor ionization
chambers which measures the integrated dose, the dose rate and the field symmetry. After that
the beam is collimated by adjusting the upper and lower collimator jaws. With the multi leaf
collimator (MLC) the beam can be shaped more precisely. The MLC is a system of heavy metal
leafs moving independently and creating a field shape set in the treatment plan.
The treatment couch has to be able to stand weight and motion without bending. It can
rotate around the isocenter and also move in vertical, lateral and longitudinal direction.
3.3.2. Patient treatment
At the beginning of the treatment the patient has to be positioned in the same way as
during the CT acquisition. The technician starts two consoles to control the treatment. One is
used to load the treatment plan and the other one to control the accelerator. On the first console
the patient to be treated has to be selected from patients list as well as the fields which should
be irradiated. After clicking the Treat button the fields are loaded. The fields and isocenter
documentation will be shown in the upper left corner. The isocenter documentation is used to
find the right position of the isocenter. The image of the patient is made with kV or MV imager
and compared with the isocenter documentation image. The couch can be moved in the right
position. The patient’s data is shown below the loaded field. On the upper right corner the
position of the leafs and MLC’s can be seen. The main part of the window shows the beam and
energy type, dose rate, monitor units, gantry’s rotation and collimator and couch coordinates.

22
The technician chooses the field which has to be irradiated and clicks Mode up button to send
the field data to the linac. When the field is loaded the gantry, couch and collimator target
positions appear on the screen as well as the current positions. That can be seen on Figure 3.4.
Figure 3.4.: Target positions at the second console
If current and target positions differ pressing Motion enable and >> start gantry, couch and
collimator motion to reach the target position. Once these positions are reached, active
interlocks will be shown on the screen. These interlocks have to be solved and the key switch
has to be turned from beam off to beam ready. By pressing the Beam on button radiation is
delivered to the patient.
3.4. Varian Real-time Position Management system
The Varian Real-time Position Management (RPM) system is a video based system used
for tracking the respiratory motion. The system can be used to improve CT scanning and
treatment of tumors whose motion is caused by breathing.

23
The Varian RPM system consists of an infrared tracking camera, a marker block and
software. The infrared tracking camera is directed towards the patient and contains LEDs
emitting infrared light on the block marker. The block marker is a plastic box with six dots on
one side. It is placed on the patient in the area in between umbilicus and xiphoid with the dots
pointed in camera direction. Figure 3.5. shows patient with the marker block. The dots reflect
the infrared light to the camera which can capture it as a signal. The signal is then used by the
software to analyze the motion of the dots corresponding to the motion of the patient. The
software uses two extreme positions of the marker to set the motion range. That range is used
to set the scale of the motion plot. More information about converting the camera signal to the
motion curve can be found in RPM Respiratory Gating System Reference Guide [12].
Figure 3.5: Patient with the Varian RPM marker block. Source: www.varian.com
Using the RPM software, first of all the user has to create a new patient dataset and
name the field. After that the main window opens. Figure 3.6. shows that window. In the upper
left corner the camera recorded motion is shown (1) as well as the motion values in anterior-
posterior, left-right and superior-inferior direction. Below the camera view the user can see the
patient data (2), set up the session options or close the patient. Next to it the breathing data
section with the breathing curve representing the patient’s motion is shown (3). On the
breathing curve the user can set up lower and upper gating thresholds (4) and the scale size in
centimeters. Below the breathing curve is a curve showing when the beam is on or off (5). When
the motion is recorded the user can see the gated motion range in millimeters and the length of

24
the breathing cycle, as well as the inspiration and expiration phases. Above the breathing data
section a visual prompt representing the markers position in relation to the thresholds is shown
(6).
Figure 3.6.: Varian RPM window: (1) Camera recorded motion, (2) Patients data, (3)
Breathing curve, (4) Gating thresholds, (5) Beam on/off curve, (6) Visual prompt
The first step of the treatment is saving the reference curve. When the reference curve
is saved it can be selected from the patients data and in the tool bar the verify button will appear.
The user has to click verify and then the software verifies the reference curve with the current
breathing of the patient. The record button is then enabled. Once selected, the breathing curve
is shown in the lower right corner. After defining the thresholds the enable gating button is
activated. When the marker is in the area of the set thresholds the beam is turned on. A beam
on indicator is located in the visual prompt.
During CT imaging the RPM system can be used for prospective gated imaging or
retrospective image acquisition. In the first case the RPM system is used as a trigger to
synchronize image acquisition with the breathing motion. The gating thresholds are set before
the scan. Only when the marker is in the threshold area an image slice is acquired. In case of

25
retrospective acquisition images are made continuously with a spiral mode and synchronized
with the RPM breathing curve. The images are then sorted in corresponding phase bins of the
breathing cycle and the most convenient is selected for the treatment.
For the patient’s treatment at the linear accelerator the RPM marker has to be set up in
the same position as it was during the CT scan. The therapist starts the RPM system, defines
the thresholds, sets the treatment session as usual and enables gating. The RPM system tracks
the motion of the marker and enables the beam when the marker is in the thresholds range.
While the marker is outside the set position the beam is off. If the patient breathing differs
significantly from the predicted breathing pattern the software detects the change and stops
beaming.
3.5. GateRT
The GateRT is a system used for tracking the patients breathing during tumor treatment.
The system can be connected to a linear accelerator and used for gating therapy. Without the
connection, the system can be used to monitor the patients breathing and assists in manual
beaming during a breath-hold.
The GateRT contains three infrared cameras which derive the signal from the patient’s
surface. One infrared camera is shown in figure 3.7. Before the treatment, daily quality
assurance (QA) has to be made. This is done with AlignRT and a calibration board which is set
in the isocenter to control the positioning of the cameras. When the QA is finished and the
positions of the cameras are accepted, GateRT can be started and the treatment can begin.
Figure 3.7.: The GateRT infrared camera. Source: www.visionrt.com

26
First of all the patient dataset has to be created and site, field and phase have to be
defined. If the patient dataset already exists it can be retrieved from the database. The next step
is to select the capture tab and make a reference image. In the capture tab the standard or gating
reference image can be captured, the respiratory and monitoring points can be set and the phase
tag and capture settings can be defined. The standard capture is taking one reference image of
the patient. Before recording in the capture settings the proper skin tone for the patient can be
selected. The system recognizes only skin colors. For the gating phantom which was made of
Plexiglas the surface had to be covered with skin tone paper so that it could be recognized. After
the standard image is made, respiratory and monitoring points can be selected. The respiratory
point should be selected on the area where the motion should be tracked. The monitoring point
should be chosen in an area not affected by breathing while its role is to track the motion of the
patient independently from respiratory motion. A benefit of this system is that the tracking point
is selected on the patient and the system does not use any block markers whose motion is then
considered as a patient’s motion. Another benefit is that the system also tracks the motion of
the patient not caused by breathing.
For a gated capture the tracking point on the 3D surface has to be selected. When the
tracking point is defined, gated capture can be selected and the tracking will start automatically.
The respiratory signal will be shown and the user can click gate when the trace is in the desired
position, the 3D display will be updated and this position will be used for gating.
The track bar enables when the capturing is finished. In the track bar the respiratory and
monitoring thresholds can be set and amplitude or phase gating can be chosen (1). The values
for abnormal breathing detection by amplitude or phase can be set as well (2) to ensure the
beam is off when the breathing is not in the set range. When all parameters are set, the user can
click on Start tracking. Four plots are now shown on the screen as shown in Figure 3.8. First is
the beam status (3) showing whether the beam is on or off. Next to it is the respiratory signal
curve (4) representing the motion of the respiratory point i.e. the patients breathing curve. The
curve is colored red when the beam is off and yellow when the beam is on. Below the respiratory
signal curve, the abnormal breathing curve (5) showing any unusual breathing behavior is to be
found. The last plot is the monitoring signal curve (6) showing the motion of the monitoring
point. The beam will be enabled when the respiratory point is in the previously defined
threshold range and the motion of the monitoring point and the abnormal breathing are
minimized and in the defined range. The tracking can be stopped by clicking on the Stop
tracking button. By selecting the Review and Export bar, the data can be reviewed or exported
to the patient’s database as a text file.

27
Figure 3.8.: GateRT window: (1) Respiratory and monitoring thresholds set up, (2) Abnormal
breathing detection, (3) Beam status, (4) Respiratory signal curve, (5) Abnormal breathing
curve, (6) Monitoring signal curve
As mentioned before, GateRT can be used for breath-hold monitoring and manual
beaming. In case that GateRT is not connected to the linear accelerator this method gives a good
opportunity to improve usual therapy. Irradiation of the tumor should be planned in inspiration
or expiration phase. The therapy session can be started as usual and the GateRT as described
above. The patient should be instructed to hold his breath in the phase predicted by the treatment
plan in specified duration. On the screen the patients breathing signal can be monitored. When
the tracking signal shows breath-hold the beam can be started and stopped manually. As the
user knows the breath hold time, the end can be predicted to minimize the reaction time when
shutting the beam off. The tumor is irradiated during the breath hold and its motion is
minimized. The irradiated area is smaller than during usual therapy and less of the healthy tissue
is exposed to the radiation.

28
3.6. Gating phantom
3.6.1. Description of the phantom
The gating phantom used in this research describes the motion of a thorax and a lung
tumor. The motion is achieved by an eccentric disc connected to a stepper motor. The disk
rotates with a frequency given by the user through the phantom software. The amplitude of the
motion is determined by the geometry of the disc. As the disc rotates, it moves the thorax part
of the phantom in a manner corresponding to the movement of the patient and simulates his
breathing. The part of the phantom representing the thorax is made of Polymethyl methacrylate,
PMMA, also known as Plexiglas. The top of the phantom is covered with a paper cover in skin
tone to be recognized by AlignRT and GateRT systems.
Inside the phantom are two cylinders representing the lungs. These are made of balsa
wood as a lung equivalent material with a mass density of 0,083 𝑔
𝑐𝑚3 and -895 ± 34 Hounsfield
units. One of the cylinders contains a specially designed part representing the tumor. The tumor
is made of polystyrene in a sphere shape. The cylinder is cut in half in order to insert a film.
The second cylinder is made of the same material with the same tumor characteristics.
This cylinder has a hole to insert the ionization chamber. The cylinders can be exchanged
depending on what kind of dosimetric measurement is to be made. The first cylinder is
additionally connected to a linear stepper motor to simulate longitudinal motion of the tumor.
The motion parameters like amplitude and period can be set in the phantom software. Figure
3.9. shows the phantom.

29
Figure 3.9.: Gating phantom
The software for the phantom is made in LabVIEW (Laboratory Virtual Instrument
Engineering Workbench), a system-design platform for a visual programming language. First
of all the user has to connect the phantom to the notebook or computer via two USB cables
before opening the program. The window opens in the Komunikation (Communication) menu
and the user has to click the Programm starten button (1) to start the program and confirm the
given settings about the COM ports (2). The window shown when program is started can be
seen in Figure 3.10. In Kalibrieren (Calibration) menu the user can calibrate the phantom and
set the zero position of the eccentric disc and the cylinder. The zero position of the disk used in
this research was at the maximum amplitude. After the calibration the user can choose one of a
few menus depending on which kind of motion is to achieve. The Exzenter (Eccentric) menu is
used for motion of the thorax part of the phantom. The Linear menu is used for motion of the
cylinder and the Kombiniert (Combined) menu gives an option to adjust parameters for
combined linear and eccentric motion.
30
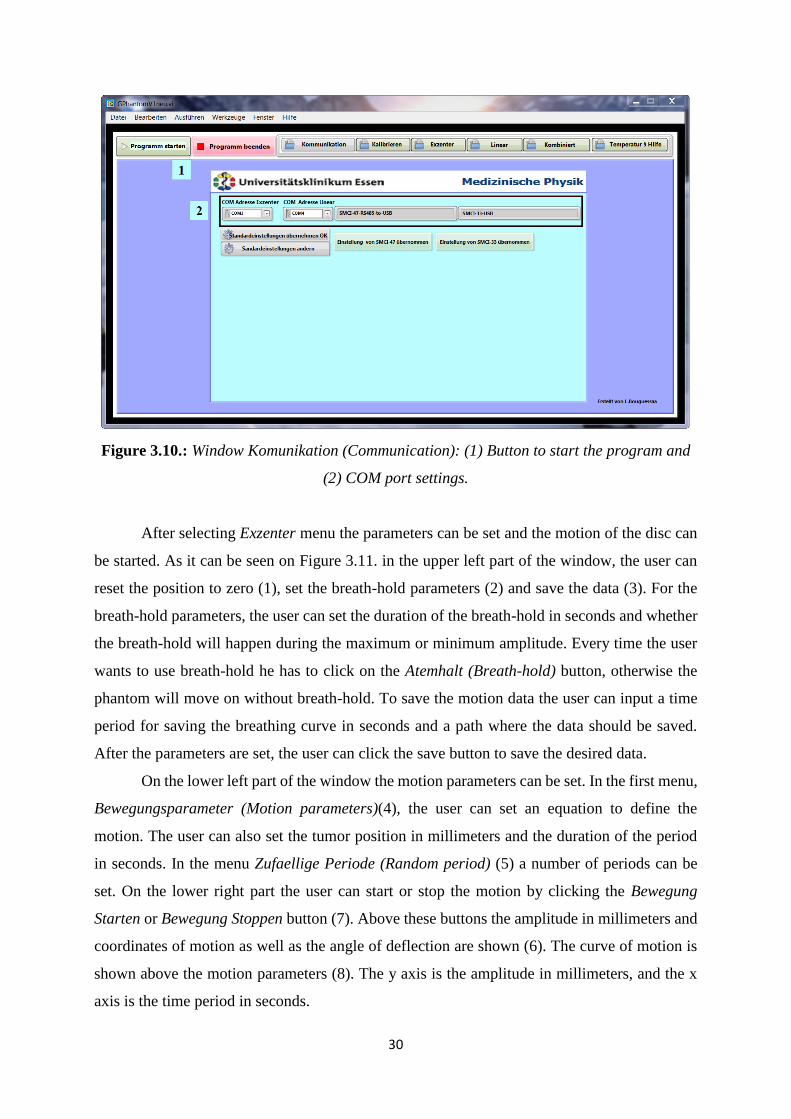
Figure 3.10.: Window Komunikation (Communication): (1) Button to start the program and
(2) COM port settings.
After selecting Exzenter menu the parameters can be set and the motion of the disc can
be started. As it can be seen on Figure 3.11. in the upper left part of the window, the user can
reset the position to zero (1), set the breath-hold parameters (2) and save the data (3). For the
breath-hold parameters, the user can set the duration of the breath-hold in seconds and whether
the breath-hold will happen during the maximum or minimum amplitude. Every time the user
wants to use breath-hold he has to click on the Atemhalt (Breath-hold) button, otherwise the
phantom will move on without breath-hold. To save the motion data the user can input a time
period for saving the breathing curve in seconds and a path where the data should be saved.
After the parameters are set, the user can click the save button to save the desired data.
On the lower left part of the window the motion parameters can be set. In the first menu,
Bewegungsparameter (Motion parameters)(4), the user can set an equation to define the
motion. The user can also set the tumor position in millimeters and the duration of the period
in seconds. In the menu Zufaellige Periode (Random period) (5) a number of periods can be
set. On the lower right part the user can start or stop the motion by clicking the Bewegung
Starten or Bewegung Stoppen button (7). Above these buttons the amplitude in millimeters and
coordinates of motion as well as the angle of deflection are shown (6). The curve of motion is
shown above the motion parameters (8). The y axis is the amplitude in millimeters, and the x
axis is the time period in seconds.

31
Figure 3.11.: Window Exzenter (Eccentric): (1) Button to reset the position, (2) Breath-hold
parameters, (3) Saving data parameters, (4) Bewegungsparameter (Motion parameters), (5)
Zufaellige Periode (Random period), (6) Amplitude parameters, (7) Start and stop buttons,
(8) Motion curve.
For using just linear motion of the cylinders Linear menu is chosen. Figure 3.12. shows
that menu. On the left hand side parameters like user (Nutzer), device (Gerät), tumor volume
(1) and period of motion (Periodendauer) (2) can be set. The position error can be seen and the
position can be reset (3). The motion data can be saved into a file, for this the path as well as
the time period can be set (4). The data will be saved after clicking on Speichern (Save) button.
On the right hand side the motion curve can be seen (5). Below the curve the amplitude
in millimeters can be set and by clicking on button Überneen [sic] applied (6). On the left hand
side the cylinders position can be tracked visually with its numerical value on the right hand
side. Buttons for starting and stopping the linear motion are below the amplitude settings (7).
32
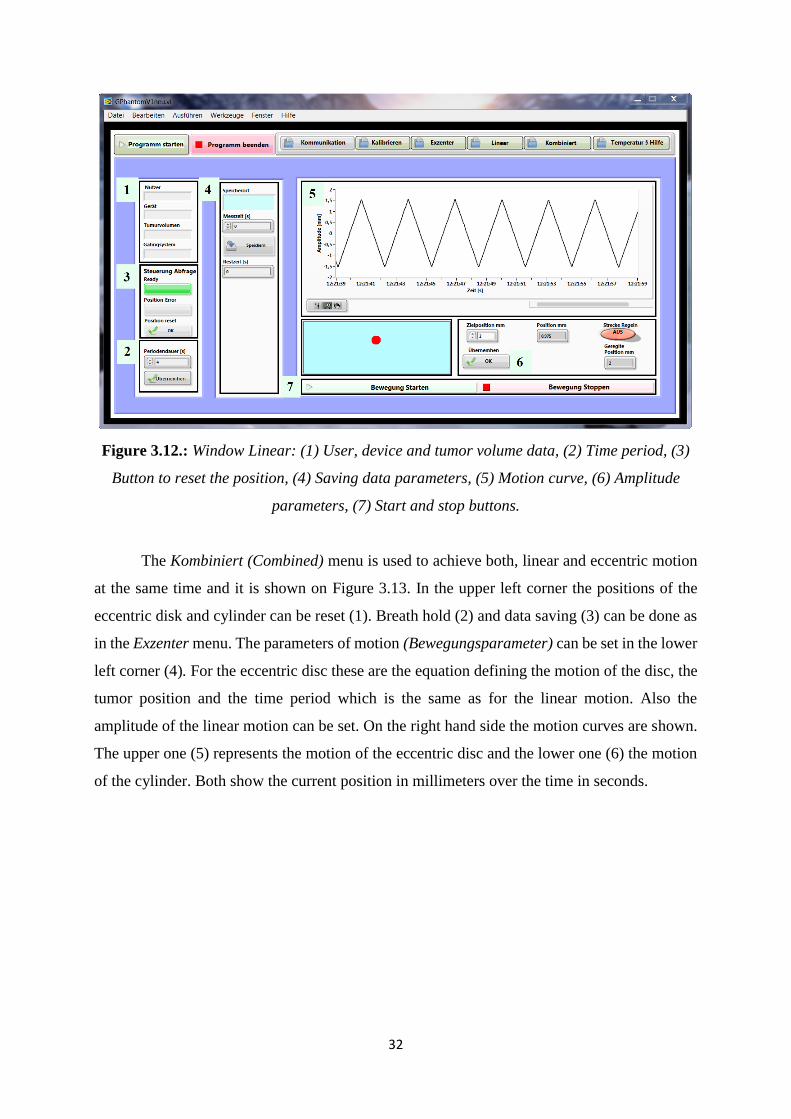
Figure 3.12.: Window Linear: (1) User, device and tumor volume data, (2) Time period, (3)
Button to reset the position, (4) Saving data parameters, (5) Motion curve, (6) Amplitude
parameters, (7) Start and stop buttons.
The Kombiniert (Combined) menu is used to achieve both, linear and eccentric motion
at the same time and it is shown on Figure 3.13. In the upper left corner the positions of the
eccentric disk and cylinder can be reset (1). Breath hold (2) and data saving (3) can be done as
in the Exzenter menu. The parameters of motion (Bewegungsparameter) can be set in the lower
left corner (4). For the eccentric disc these are the equation defining the motion of the disc, the
tumor position and the time period which is the same as for the linear motion. Also the
amplitude of the linear motion can be set. On the right hand side the motion curves are shown.
The upper one (5) represents the motion of the eccentric disc and the lower one (6) the motion
of the cylinder. Both show the current position in millimeters over the time in seconds.

33
Figure 3.13.: Window Kombiniert (Combined): (1) Button to reset the position, (2) Breath-
hold parameters, (3) Saving data parameters, (4) Bewegungsparameter (Motion parameters),
(5) Eccentric motion curve, (6) Linear motion curve.
The menu Temperatur & Hilfe (Temperature and Help) shows temperature and error
data.
3.6.2. Phantom motion
As described in the last subchapter, the motion of the phantom is achieved using a
stepper motor to rotate the eccentric disc whose rotation is moving the part of the phantom
representing the thorax. The cylinders representing the lungs with the inserted tumor are moving
with the thorax part. The cylinder connected to the linear stepper motor has a motion in
longitudinal direction as well. The imaging systems, Varian RPM and GateRT are tracking a
point on the surface of the phantom and do not take the linear motion into consideration. A part
of this research is the comparison of breathing curves given by both systems. For that reason it
was necessary to make a mathematical description of the movement to calculate the position of
the observed point over the time. The main motion of the thorax part is in z and y direction
which means that the motion in x direction is neglected. Figure 3.14. shows the coordinates. As
the desired point on the phantoms surface is moving on a circle, the formulas are made in a
polar coordinate system and then transferred into Cartesians.

34
The formula in z direction describes the change in the height position of the point:
z (𝜌) = r · cos { 𝜋
2− [ 𝛽0 − cos (
𝑟−(𝑑𝑜+𝐴∙𝑐𝑜𝑠4(𝜌
2+
𝜋
2))
𝑟 )]} (3.2)
where r is the distance from the turning point to the observed point and can be calculated as r =
√𝑎2 + ℎ2, 𝑎 is the y distance from the turning point to the observed point and ℎ the z distance
from the turning point to the observed point. The angle 𝛽0 in radian which the height of the
desired point closes with the y axis, it can be calculated as 𝛽0 = atan (ℎ
𝑎).
The part 𝑑𝑜 + 𝐴 ∙ 𝑐𝑜𝑠4 (𝜌
2) describes the motion of the eccentric disc which is made to
fit this formula. An explanation of the basic formula was given earlier in this work describing
the study made by Y. Seppenwoolde et al [1]. 𝑑𝑜 is the position of the exhalation, in this case
it is 0. A is the amplitude of the disc which is 25 mm. 𝜌 is the angle of rotation of the disc which
can reach values from 0 to 2𝜋. As the disc is turning continuously, 𝜌 can be expressed through
𝜌 = 2𝜋
𝑇 · t, where T is the time period of breathing set in the software and t is elapsed time.
Exponent 4 for cosine comes from fitting the measurements of patients breathing curve to the
equation.
The formula in y direction describes the change in the length position of the point:
y (𝜌) = r · sin { 𝜋
2− [ 𝛽0 − cos (
𝑟−(𝑑𝑜+𝐴∙𝑐𝑜𝑠4(𝜌
2+
𝜋
2))
𝑟 )]} (3.3)
using the same parameters as in the formula for z direction. Figure 3.14. shows the parameters
of the equations.
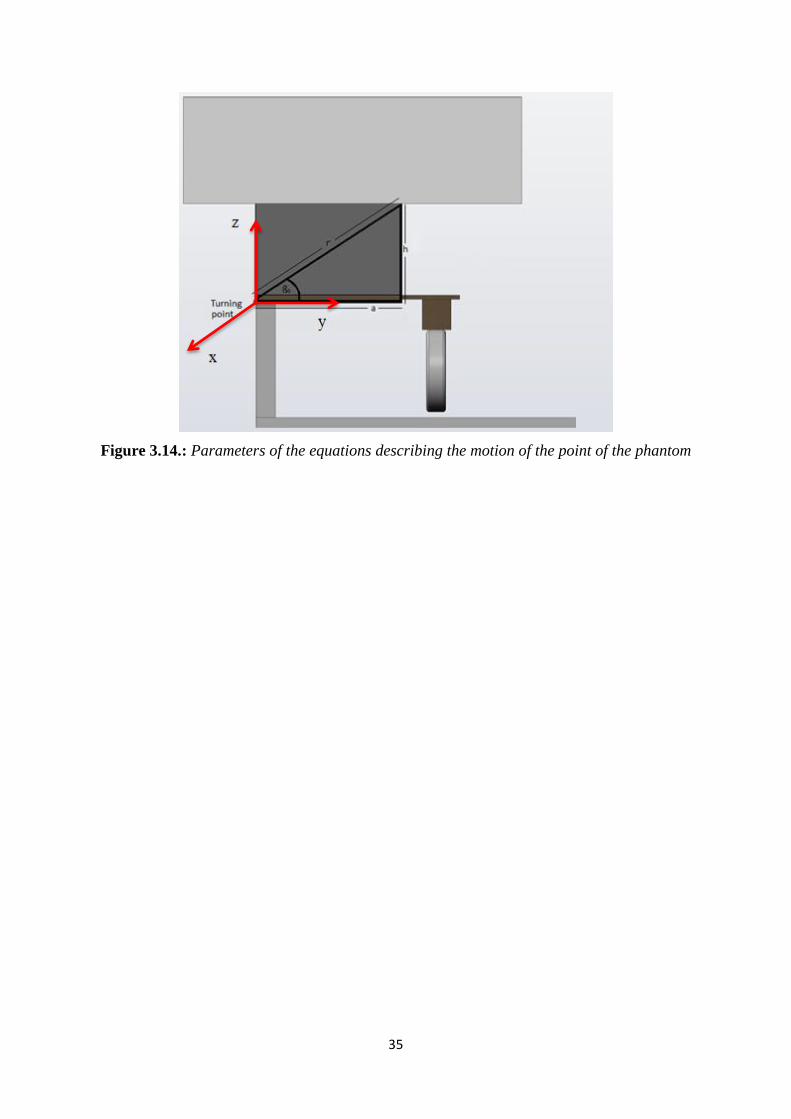
35
Figure 3.14.: Parameters of the equations describing the motion of the point of the phantom
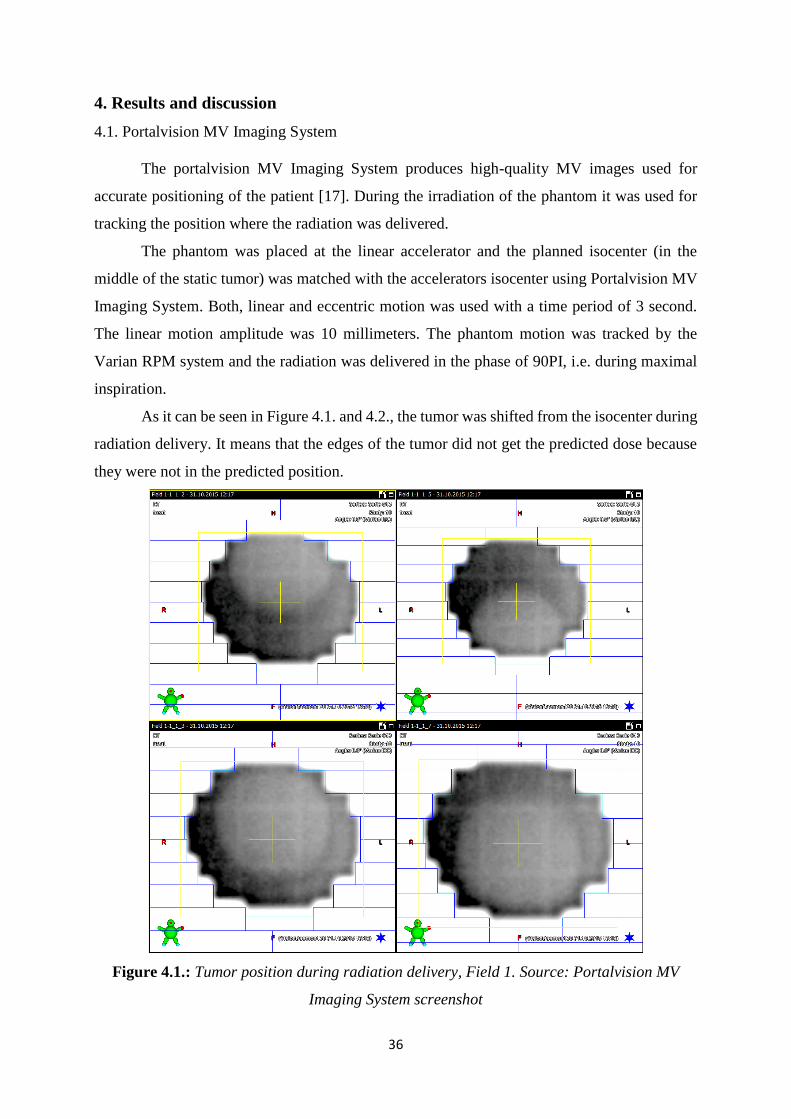
36
4. Results and discussion
4.1. Portalvision MV Imaging System
The portalvision MV Imaging System produces high-quality MV images used for
accurate positioning of the patient [17]. During the irradiation of the phantom it was used for
tracking the position where the radiation was delivered.
The phantom was placed at the linear accelerator and the planned isocenter (in the
middle of the static tumor) was matched with the accelerators isocenter using Portalvision MV
Imaging System. Both, linear and eccentric motion was used with a time period of 3 second.
The linear motion amplitude was 10 millimeters. The phantom motion was tracked by the
Varian RPM system and the radiation was delivered in the phase of 90PI, i.e. during maximal
inspiration.
As it can be seen in Figure 4.1. and 4.2., the tumor was shifted from the isocenter during
radiation delivery. It means that the edges of the tumor did not get the predicted dose because
they were not in the predicted position.
Figure 4.1.: Tumor position during radiation delivery, Field 1. Source: Portalvision MV
Imaging System screenshot

37
Figure 4.2.: Tumor position during radiation delivery, Field 2. Source: Portalvision MV
Imaging System screenshot
A comparison of the linear and eccentric motion curves shows the cause for the tumor
displacement. As it can be seen in Figure 4.3. the maximum of the linear motion was not at the
same time point as the maximum of the eccentric motion despite a correct calibration and even
though their entered time period was the same. This means that, against all expectations, the
movement is not synchronized, so the real tumor position cannot be predicted in this setup. This
misbehavior was attributed to an error in the phantom software. Because of that, linear motion
was no longer used in this work.

38
Figure 4.3.: Comparison of eccentric and linear motion curves
4.2. Comparison of the breathing curves made by Varian RPM and GateRT systems
As described before Varian RPM and GateRT are systems used for patient breathing
monitoring. Both systems are recording the breathing signal given as current position over time.
The Varian RPM block marker was positioned on top of the phantom where the y distance from
the turning point to the observed point was 19,0 cm and the z distance 20,6 cm. Using formula
3.2. the amplitude of motion at the marker position was 1,977 cm. As it can be seen in Figure
4.4. the amplitude of the motion recorded by Varian RPM system is 2,087 ± 0,018 cm. The
difference between the calculated and recorded amplitude is 0,111 ± 0,018 cm.
Figure 4.4.: Motion curve recorded by Varian RPM system
-15
-10
-5
0
5
10
15
20
25
30
0.0
4
0.5
2 1
1.4
8
1.9
6
2.4
4
2.9
2
3.4
3.8
8
4.3
6
4.8
4
5.3
2
5.8
6.2
8
6.7
6
7.2
4
7.7
2
8.2
8.6
8
9.1
6
9.6
4
10
.12
10
.6
11
.08
11
.56
Comparison of eccentric and linear motion
Exzenter Amplitude Linear Amplitude
Am
plit
ud
e (c
enti
me
ters
)
Time (seconds)
0
0.2
0.4
0.6
0.8
1
1.2
1.4
1.6
1.8
2
2.2 Motion of the marker block
Amplitude
Time (seconds)
Am
plit
ud
e (c
enti
me
ters
)

39
As the tracking point was set on the GateRT systems image of the phantom, the
coordinates of the tracking point were measured with a measurement error of ± 0,5 cm. As it
can be seen in Figure 4.5. the recorded amplitude of the tracking point is 1,745 ± 0,001 cm. The
calculated amplitude of the tracking point placed on approximately 12,5 ± 0,5 cm in y direction
from the turning point and 20,6 cm in z direction is 1,817 ± 0,020 cm. The difference between
the calculated and recorded amplitude is 0,072 ± 0,020 cm.
Figure 4.5.: Motion curve recorded by GateRT
The measured values do not differ significantly to the calculated ones. Therefore we can
conclude that both imaging systems can determine the motion amplitude very accurately.
The second important thing in system comparison and evaluation is the reaction time.
That is the time difference between the moment the phantom starts moving and the moment the
imaging system recognizing that motion. The reaction time has to be as short as possible to
increase the precision of motion monitoring.
The reaction time was measured by comparing the live curves of Varian RPM and
GateRT software with the motion curve given by the phantom software. A slow motion video
of the Varian RPM or GateRT motion curve and the phantom motion curve was made. The
video was exported to Windows Media Player and the frame showing the maximum of the
phantom breathing curve was found. The frames were then forwarded until the maximum of
the imaging systems curve was found. The time difference between maximum amplitude of the
40
phantom curve and the imaging system curve was determined by counting the number of frames
and multiplying it with the time difference between two frames, which is 0,004 s. This time
difference is the reaction time of the system. For the Varian RPM system the reaction time was
0,134 ± 0,004 s while the reaction time for the GateRT was 0,142 ± 0,004 s.
Using formula 3.2 the actual position of the phantom in maximum was calculated, that
position is for t = 3 s. Using the reaction time of the imaging system, the position shown by the
system in the moment the phantom was in maximum was calculated. The time t in formula 3.2
was
Δt = te - tr (4.1)
where te is the elapsed time until the phantom came to the maximum position and tr is the
reaction time of the imaging system. The difference between the monitored position and the
actual phantom position was calculated with following formula:
Δz = zmax - zmo (4.2)
where zmax is maximum position of a phantom and zmo is monitored position. For the Varian
RPM system that difference in position is 0,0077 mm and for the GateRT the position difference
is 0,0089 mm. As it can be seen the position difference is lower than the precision of a linear
accelerator which is around 0,5 mm [18]. This leads to the conclusion that the reaction times of
both systems do not influence significantly the difference between the actual phantom position
and the position given by the imaging system.
4.3. Film dosimetry
The gating phantom was used for film dosimetry to compare the planned dose with the
one received by the phantom. The Gafchromic EBT3 Dosimetry Films were inserted into a lung
representing cylinder and exposed to different energies with and without phantom motion.
Irradiation without phantom motion was made to measure the dose in static case and get the
reference maximum dose for each energy. The phantom was moving with and without breath
hold and the movement was tracked by the Varian RPM system and GateRT.
First of all the film calibration had to be made to get a calibration curve which was later
used during film scanning and data analysis. The dose response of an EBT3 film on an rgb
scanner gives a red, blue and green channel and every channel has a different dose range. Figure
4.6. shows the dose response of a Gafchromic EBT3 film in all color channels.
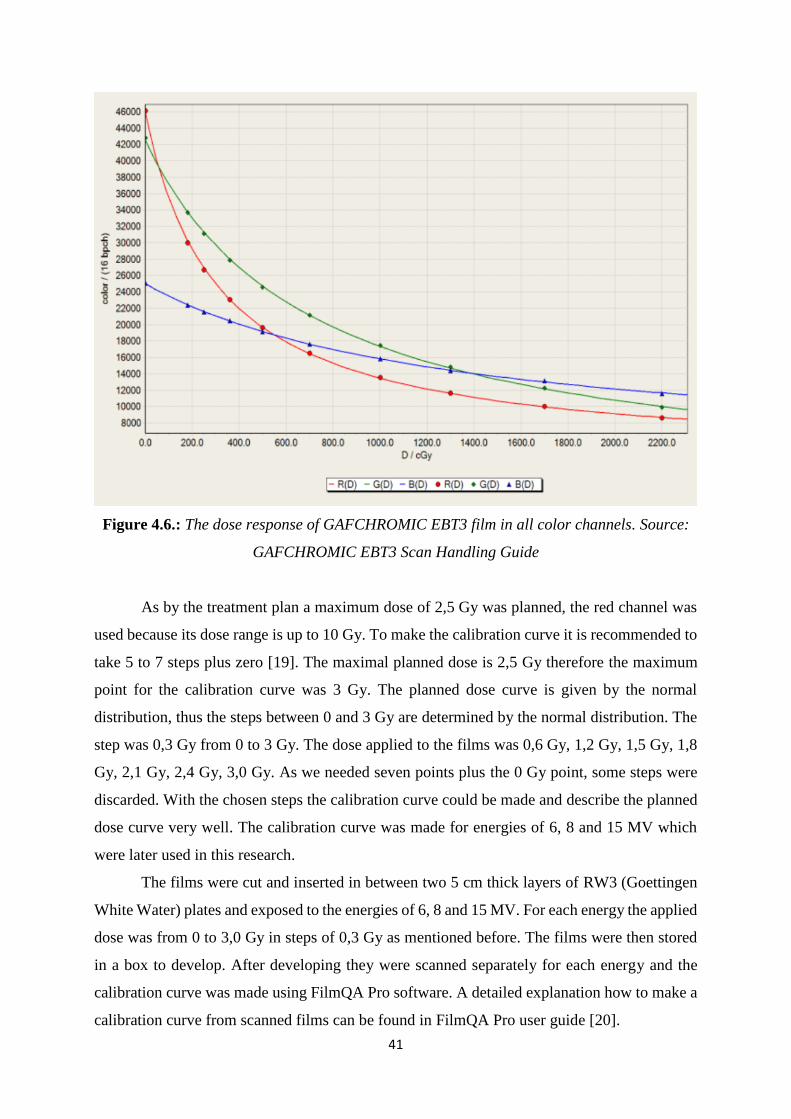
41
Figure 4.6.: The dose response of GAFCHROMIC EBT3 film in all color channels. Source:
GAFCHROMIC EBT3 Scan Handling Guide
As by the treatment plan a maximum dose of 2,5 Gy was planned, the red channel was
used because its dose range is up to 10 Gy. To make the calibration curve it is recommended to
take 5 to 7 steps plus zero [19]. The maximal planned dose is 2,5 Gy therefore the maximum
point for the calibration curve was 3 Gy. The planned dose curve is given by the normal
distribution, thus the steps between 0 and 3 Gy are determined by the normal distribution. The
step was 0,3 Gy from 0 to 3 Gy. The dose applied to the films was 0,6 Gy, 1,2 Gy, 1,5 Gy, 1,8
Gy, 2,1 Gy, 2,4 Gy, 3,0 Gy. As we needed seven points plus the 0 Gy point, some steps were
discarded. With the chosen steps the calibration curve could be made and describe the planned
dose curve very well. The calibration curve was made for energies of 6, 8 and 15 MV which
were later used in this research.
The films were cut and inserted in between two 5 cm thick layers of RW3 (Goettingen
White Water) plates and exposed to the energies of 6, 8 and 15 MV. For each energy the applied
dose was from 0 to 3,0 Gy in steps of 0,3 Gy as mentioned before. The films were then stored
in a box to develop. After developing they were scanned separately for each energy and the
calibration curve was made using FilmQA Pro software. A detailed explanation how to make a
calibration curve from scanned films can be found in FilmQA Pro user guide [20].

42
4.4. Dose measurements
Static case
To measure how much of the planned dose the phantom receives when it is not moving
Gafchromic EBT3 films were used. The static case can be used as a reference measurement of
a dose received by the phantom for different fields and energies, while there is no influence due
to phantom motion and all the dose is delivered in the planned position. The static case
measurements were done for the energies of 6, 8 and 15 MV at gantry positions 0° (Field 1)
and 270° (Field 2). The planned dose for all energies and fields was 2,5 Gy.
After the films were exposed to the radiation, they were left to be developed and scanned
the next day. Using the software FilmQA Pro, the scanned films were compared with the
treatment plan. The results gained by that comparison are the passing rates, isolines and the
isomap of the relative error, a plot of the passing rate vs tolerance, a 3D surface of errors and
the user-made profiles. In this research we will take the passing rates, the relative error and the
isomap of the relative error and the user-made profiles into consideration. The passing rate says
how many of the evaluated 3mm diameter points on a film differ less than 3% from the planned
dose in that point. The relative error is the difference between the planned dose and the dose
delivered to the phantom scanned from the film. The user-made profile is the profile through
the overlay of the field made in treatment plan and scanned film. It is shown as a plot of the
absorbed dose and the position through the overlay. Table 4.1 shows the passing rates for
different fields and energies.
Table 4.1.: Passing rates for different fields and energies
6 MV 8 MV 15 MV
Field 1 91,5 % 86,8 % 69,6 %
Field 2 97,2 % 88,7 % 73,6 %
As it can be seen the passing rates are decreasing as the energy goes higher. One of the
reasons for that is a high error in dose prediction for higher energies in the Eclipse treatment
planning system.
The relative error is the difference between the planned dose and the dose delivered to
the phantom scanned from the film. For energy of 6 MV in case of Field 1 the relative error is
3,5 % and in case of Field 2 1,3%. Figure 4.7. shows the isomap of the relative error for both

43
fields. As it can be seen the relative error is low for both fields which shows great
correspondence between the planned and delivered dose.
Figure 4.7.: Isomap of the relative error for Field 2 and Field 1.
That correspondence can be seen also in the Figure 4.8. showing a plot of the absorbed
dose versus position on the irradiated film. As it can be seen both lines are close to each other,
this means a high correspondence between the planned absorbed dose in the position and the
delivered dose in the same position.
Figure 4.8.: Plot of the absorbed dose versus position on the irradiated film for Field
2 and Field 1.

44
The passing rates for energy of 6 MV are for Field 1 91,5% and for Field 2 97,2 %.
For both fields the passing rates are over 90% what is the self-set tolerance for this thesis,
based on the tolerance used in university hospital Essen.
For energy of 8 MV in case of Filed 1 the passing rate is 86,8 % and in case of
Field 2 88,7%. The relative error for Field 1 is 8,8 % while for Field 2 relative error is 9,3 %.
The isomap of the relative error for both fields is shown in Figure 4.9. As it can be seen in
Figure 4.9. the correspondence between the Fields 1 and 2 for energy 8 MV is lower in
comparison to the correspondence of Fields 1 and 2 for energy of 6 MV.
Figure 4.9.: Isomap of the relative error for Field 1 and Field 2 for the energy of 8 MV.
Figure 4.10.: Plot of the absorbed dose versus position on the irradiated film for Field
1 and Field 2 for the energy of 8 MV.
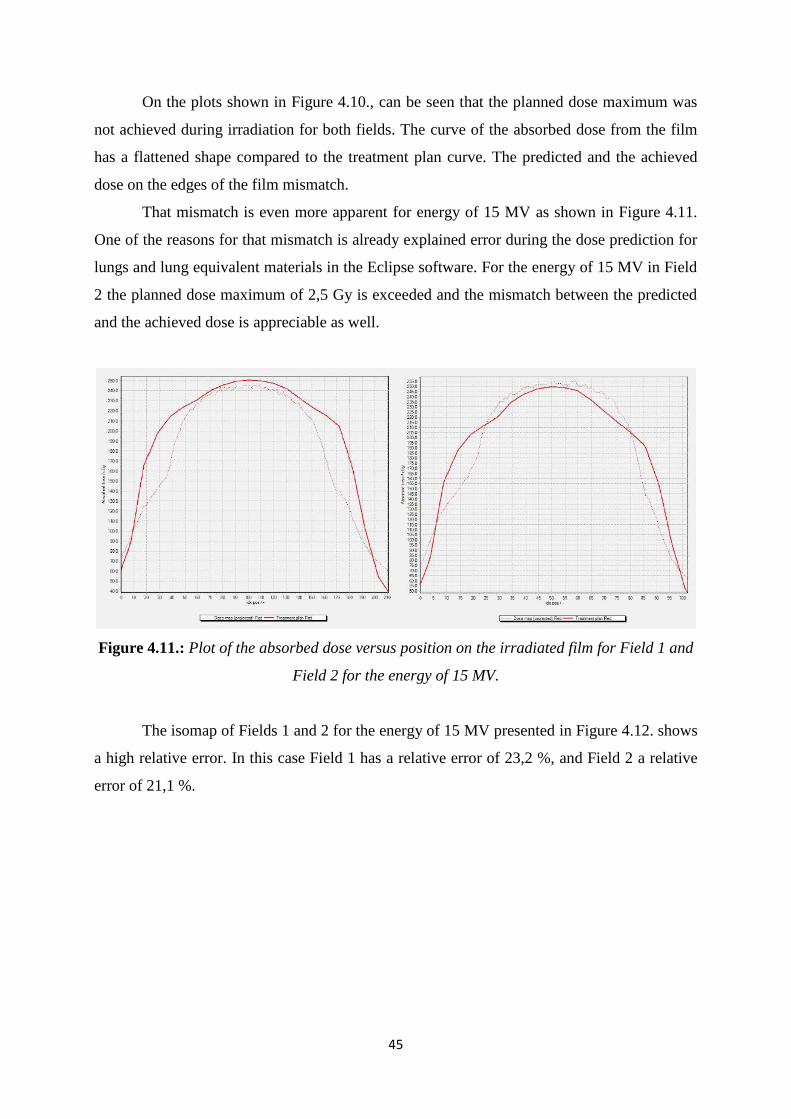
45
On the plots shown in Figure 4.10., can be seen that the planned dose maximum was
not achieved during irradiation for both fields. The curve of the absorbed dose from the film
has a flattened shape compared to the treatment plan curve. The predicted and the achieved
dose on the edges of the film mismatch.
That mismatch is even more apparent for energy of 15 MV as shown in Figure 4.11.
One of the reasons for that mismatch is already explained error during the dose prediction for
lungs and lung equivalent materials in the Eclipse software. For the energy of 15 MV in Field
2 the planned dose maximum of 2,5 Gy is exceeded and the mismatch between the predicted
and the achieved dose is appreciable as well.
Figure 4.11.: Plot of the absorbed dose versus position on the irradiated film for Field 1 and
Field 2 for the energy of 15 MV.
The isomap of Fields 1 and 2 for the energy of 15 MV presented in Figure 4.12. shows
a high relative error. In this case Field 1 has a relative error of 23,2 %, and Field 2 a relative
error of 21,1 %.
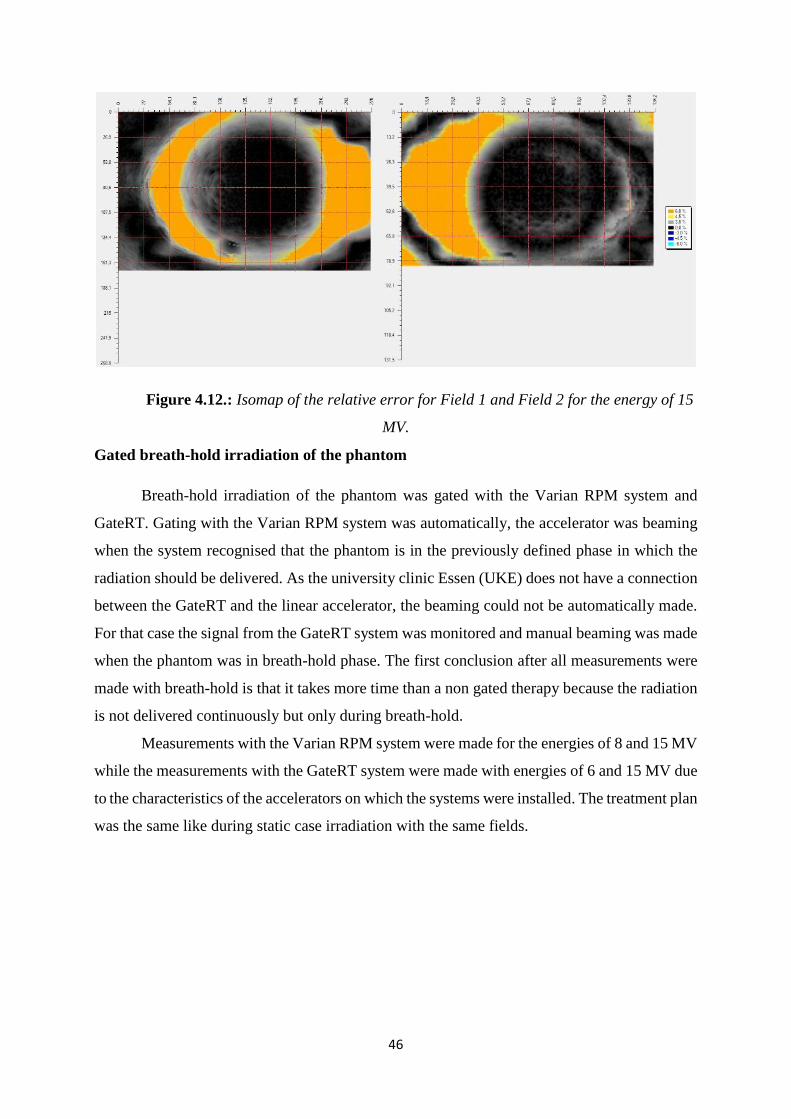
46
Figure 4.12.: Isomap of the relative error for Field 1 and Field 2 for the energy of 15
MV.
Gated breath-hold irradiation of the phantom
Breath-hold irradiation of the phantom was gated with the Varian RPM system and
GateRT. Gating with the Varian RPM system was automatically, the accelerator was beaming
when the system recognised that the phantom is in the previously defined phase in which the
radiation should be delivered. As the university clinic Essen (UKE) does not have a connection
between the GateRT and the linear accelerator, the beaming could not be automatically made.
For that case the signal from the GateRT system was monitored and manual beaming was made
when the phantom was in breath-hold phase. The first conclusion after all measurements were
made with breath-hold is that it takes more time than a non gated therapy because the radiation
is not delivered continuously but only during breath-hold.
Measurements with the Varian RPM system were made for the energies of 8 and 15 MV
while the measurements with the GateRT system were made with energies of 6 and 15 MV due
to the characteristics of the accelerators on which the systems were installed. The treatment plan
was the same like during static case irradiation with the same fields.

47
Table 4.2.: Passing rates for different fields and energies
6 MV 8 MV 15 MV
Varian RPM Field 1 - 93,2 % 77,9 %
Field 2 - 90,8 % 60,5 %
GateRT Field 1 97,5 % - 67,8 %
Field 2 92,5 % - 75,4 %
Table 4.2. shows the passing rates for all energies for both fields. The passing rates for
the GateRT system with an energy level of 6 MV are very high and above the tolerance used in
UKE, which means that this type of therapy can be used during every day treatment. The same
system was used for the energy of 15 MV and the passing rates are, as it was expected, lower.
During automatic gating using the Varian RPM system the passing rates were high for the
energy of the 8 MV, also above the tolerance used in UKE and it is recommended for usual
treatment.The passing rates for both fields for the energies of 15 MV are low as expected. The
difference between the values for energy of 15 MV for both fields and systems can be explained
as measurements errors. It is important to take into consideration that gating with the GateRT
system was manual and depends on the reaction of a person doing the manual beaming.
The relative errors for the fields 1 and 2 using energy of 8 MV and the Varian RPM
system are 5,4 % and 6,7 %. As it can be seen on the isomap shown in Figure 4.13. the relative
error is low and the correspondence between the planned and delivered dose is high what is
confirmed in the plot of the user-made profile shown in Figure 4.14.
Figure 4.13.: Isomap of the relative error for Field 1 and Field 2 for the energy of 8
MV using the Varian RPM system.

48
Figure 4.14.: Plot of the absorbed dose versus position on the irradiated film for Field
1 and Field 2 for the energy of 8 MV using the Varian RPM system.
For the energy of 15 MV the relative errors are much higher as it can also be seen in
Figure 4.15. For Field 1 the relative error is 14,6% and for Field 2 the relative error is 31,0%.
A large discrepancy between planned and delivered dose can be seen on the user-made profile
plot shown in Figure 4.16. as well.
Figure 4.15.: Isomap of the relative error for Field 1 and Field 2 for the energy of 15
MV using the Varian RPM system.

49
Figure 4.16.: Plot of the absorbed dose versus position on the irradiated film for Field
1 and Field 2 for the energy of 15 MV using the Varian RPM system.
The phantom was exposed to the radiation energies of 6 and 15 MV and gated with
GateRT. The relative error for the energy of 6 MV for fields 1 and 2 are 1,8% and 3,3% what
shows a great correspondence between planned and delivered dose. The isomap shown in
Figure 4.17. as well as the user-defined profile plot shown in Figure 4.18. confirm that
correspondence.
Figure 4.17.: Isomap of the relative error for Field 1 and Field 2 for the energy of 6
MV using the GateRT system.

50
Figure 4.18.: Plot of the absorbed dose versus position on the irradiated film for Field
1 and Field 2 for the energy of 6 MV using the GateRT system.
For the energy of 15 MV in case of Field 1 the relative error is 24,5 % and in case of
Field 2 the relative error is 13,8 %. The isomap for both fields is shown in Figure 4.19. A high
disagreement between planned and delivered dose is shown in Figure 4.20. with the plot of the
user-defined profile.
Figure 4.19.: Isomap of the relative error for Field 1 and Field 2 for the energy of 15 MV
using the GateRT system.

51
Figure 4.20.: Plot of the absorbed dose versus position on the irradiated film for Field
1 and Field 2 for the energy of 6 MV using the GateRT system.
Automatic gating without breath-hold
The main purpose of gated therapy is automatic gating, which means the monitoring system
recognizes the position of the patient in which the radiation should be delivered and gives the
signal to the accelerator turning the beam on. For automatic gating without breath-hold the
phantom was moving continuously without any hold and the radiation was delivered only in
the specific phase. The breathing period for this case was 3 s.
In UKE the connection between the monitoring system and the accelerator exists just
for the Varian RPM system, due to that all measurements were made using the Varian RPM
system with energies of 8 and 15 MV with earlier defined fields, gantry position 0° (Field 1)
and 270° (Field 2). As it can be seen in Table 4.3. the passing rates in automatic gating are very
low for both energies and fields and far below the level of tolerance set up for this study. One
of the reasons for such a result is an already known problem in the treatment planning software.
The second reason is in the motion of the phantom during radiation delivery. As the reaction
time between the Varian RPM system and the linear accelerator is not taken into consideration
in this study, that reaction time could influence our results. When the phantom is moving
continuously, just a small time delay between the moments when the Varian RPM system
recognizes that the phantom is in the desired position and when the accelerator started to beam,
could cause a significant displacement in the position. That means that a part of the planned
dose is delivered when the phantom is not in the planned position what can be seen as a lack of

52
dose on a film. As we compared the planned dose with the delivered one, the passing rates are
below the level of tolerance.
Table 4.2.: Passing rates for different fields and energies
8 MV 15 MV
Field 1 83,5 % 57,4 %
Field 2 77,1 % 62,3 %
The isomap of the relative error for the measurement with energy of 8 MV for fields one
and two are shown in Figure 4.21. and for the energy of 15 MV in Figure 4.22. The relative
error for the energy of 8 MV for Filed 1 is 12,3 % and for Field 2 19,8 % while for the energy
of 15 MV the relative errors are 33,9 % and 30,9 %. All values are very high.
Figure 4.21.: Isomap of the relative error for Field 1 and Field 2 for the energy of 8 MV in
case when phantom was gated automatically with Varian RPM system.

53
Figure 4.22.: Isomap of the relative error for Field 1 and Field 2 for the energy of 15 MV in
case when phantom was gated automatically with Varian RPM system.
A high disagreement between the planned dose and the delivered one is shown in
Figures 4.23. and 4.24. for energies of 8 and 15 MV. The main reasons for such a difference is
explained above.
Figure 4.23.: Plot of the absorbed dose versus position on the irradiated film for Field
1 and Field 2 for the energy of 8 MV in case when phantom was gated automatically with
Varian RPM system.

54
Figure 4.24.: Plot of the absorbed dose versus position on the irradiated film for Field
1 and Field 2 for the energy of 15 MV in case when phantom was gated automatically with
Varian RPM system.

55
5. Conclusion
The important part of gated radiotherapy is the monitoring system observing the patients
motion and sending signals to the accelerator to start beaming when the patient is in the desired
position. As gating systems are developing they have to be evaluated before clinical use. This
work presents the evaluation of two gating systems, Varian RPM and GateRT.
The first part of the research was to gain knowledge about the amplitude measured by
both systems. The difference between the calculated amplitude of the phantom and the recorded
amplitude by the Varian RPM system was 0,111 ± 0,018 cm. For GateRT that difference was
0,072 ± 0,020 cm, what leads to the conclusion that the GateRT system is more precise in
determination of the amplitude of motion.
The second part showed the influence of the reaction time of the system on the
difference between the monitored position and the actual phantom position. For the Varian
RPM system the reaction time was 0,134 ± 0,004 s what gives a position displacement of 0,0077
mm. The reaction time of GateRT was 0,142 ± 0,004 s causing a position difference of 0,0089
mm. As the precision of the linear accelerator is 0,5 mm [18] we can conclude that even if the
reaction time of both systems causes a position displacement, that displacement does not affect
the precision of the beam in a relevant way.
The main part of the system validation were film measurements. Film dosimetry was
made for three different cases: static case, breath-hold measurements and gating without breath-
hold. The static case showed high passing rates for energies of 6 and 8 MV while for 15 MV
energy the passing rate was low. That is due to measurement errors as well as the error in the
dose prediction of the treatment plan system. Breath-hold measurements with both systems
showed similar results. High passing rates were achieved for lower energies leading to the
conclusion that breath-hold therapy can be recommended in tumor treatment.
Film dosimetry for gating without breath-hold showed low passing rates for all used
energies. During the measurements, the reaction time between the Varian RPM system and the
linear accelerator is not taken into consideration and it definitely influences our results. To be
sure that gated therapy without breath-hold can be recommended for everyday tumor treatment,
the evaluation of the Varian RPM system should be repeated and the mentioned reaction time
should be taken into consideration. The same measurements should be made with the GateRT
system to make a complete validation and comparison of the systems.

56
6. Literature
1. Seppenwoolde Y. et al; Precise and real-time measurement of 3D tumor motion in
lung due to breathing and heartbeat, measured during radiotherapy // International Journal of
Radiation Oncology, Biology, Physics. 53 (4), 2002; 822–834
2. American Association of Physicists in Medicine Task Group 76; The Management of
Respiratory Motion in Radiation Oncology. College Park, MD: American Association of
Physicists in Medicine, 2006.
3. Jin JY, Yin FF; Time delay measurement for linac based treatment delivery in
synchronized respiratory gating radiotherapy // Medical Physics. 32 (5), 2005; 1293-1296.
4. Tsoulfanidis, N; Measurement and detection of radiation. Washington: Taylor &
Francis, 1995.
5. Metz, J.: Differences between Protons and X-rays. The Abramson Cancer Center of
the University of Pennsylvania, 2006.
6. Shahri K. et al; Neutron Applications in Cancer Treatment // Hellenic Journal of
Nuclear Medicine. 14 (2), 2011.
7. Wurzbacher, K.; Krebsbehandlung mit Neutronen fragwuerdig. Umweltinstitut
Muenchen, 2003.
8. Attix, F. H.; Introduction to radiological physics and radiation dosimetry. John Wiley
& Sons, Inc, 1986.
9. Podgorsak, E. B.; Radiation Oncology Physics: A Handbook for Teachers and
Students. International atomic Energy Agency, Vienna, 2005.
10. Gafchromic EBT3 Scan Handling Guide, Ashland, 2015.
11. Bouguessaa, L., Construction of gating phantom for radiation therapy. Westfälische
Hochschule Gelsenkirchen, 2014.
12. RPM Respiratory Gating System Reference Guide, Varian Medical Systems, Inc.
Palo Alto, 2012.
13. Hubbell J. H., Seltzer S. M.; Tables of X-Ray Mass Attenuation Coefficients and
Mass Energy-Absorption Coefficients from 1 keV to 20 MeV for Elements Z = 1 to 92 and 48

57
Additional Substances of Dosimetric Interest. U.S. Secretary of Commerce on behalf of the
United States of America, 1996.
14. Dance D.R., Christofides, S., Maidment, A. D. A., McLean, I. D., Ng, K. H.;
Diagnostic Radiology Physics: A Handbook for Teachers and Students. International atomic
Energy Agency, Vienna, 2014.
15. SOMATOM Sensation 40/64 Application Guide, Siemens Medical, 2007.
16. Dizdarević, E; Osnovne komponente Sistema linearnih akceleratora sa osvrtom na
fizikalnost pojedinih. Neum, 2010.
17. Quality Check with Portal Vision Imaging, 2012. URL: http://www.ra-
workshop2012.dk/RA%20Workshop%20QA_PVI%20customers%202012-01.pdf
(14.12.2015.)
18. Basic applications of multileaf collimators, 2001. URL:
https://www.aapm.org/pubs/reports/RPT_72.pdf (02.03.2016.)
19. Lewis, D. F.; Using Radiochromic Film Tips and Techniques, 2010.
20. FilmQA Pro User Manual, Ashland. Wayne, New Jersey, 2013.