validation of an analytical methodology by gas ... of an analytical methodology by gas...
TRANSCRIPT
Rev. Colomb. Cienc. Quím. Farm. Vol. 37 (1), 5-17, 2008 www.farmacia.unal.edu.co
5
Artículo de investigación
Validation of an analytical methodology by gas chromatography for the assay of barbiturates in blood samples
Catalina Daza1, Yady Cabrera1, Jorge A. Martínez2 y Jaime H. Rojas1
1 Universidad Nacional de Colombia, Departamento de Farmacia, A. A. 14490, Bogotá, D. C., Colombia. Correo electrónico: [email protected]
2 Instituto Nacional de Medicina Legal y Ciencias Forenses. Correo electrónico: [email protected]
Recibido para evaluación: marzo 16 de 2007Aceptado para publicación: diciembre 17 de 2007
SUMMARY
An analytical methodology was developed for the quantitative assay of phenobar-bital, pentobarbital and butobarbital in blood samples, using aprobarbital as an in-ternal standard. After sample cleaning by liquid-liquid extraction, the separation was achieved by liquid gas chromatography using a capillary column in pulsed splitless mode, temperature ramp, and helium as carrier gas and flame ionization detector. The methodology was selective, linear, precise and accurate. The linearity was ad-equate, between 20 and 100 mcg/mL, for all of three barbiturates studied. The de-veloped methodology was applied in two forensic cases presented in the Toxicology lab of the National Institute of Legal Medicine and Forensic Sciences in Bogotá.
Key words: Barbiturates, gas chromatography, forensic samples, validation, flame ionization detector.
RESUMEN
Validación de una metodología analítica para la determinación de barbitúricos en muestras de sangre por cromatografía gaseosa
con detector de ionización de llamaUna metodología analítica fue desarrollada y validada para la determinación de bu-tabarbital, pentobarbital y fenobarbital en muestras de sangre, utilizando aprobarbital como estándar interno. Para la identificación de los diferentes fármacos se llevó a cabo una extracción líquido-líquido con posterior separación cromatográfica em-pleando una columna capilar en modo de inyección pulsado sin división con rampa de temperatura, helio como gas de arrastre y detector de ionización de llama. La metodología validada fue selectiva, lineal, precisa y exacta. La linealidad fue evaluada
6
Daza et al.
para concentraciones entre 20 y 100 mcg/mL para cada uno de los tres barbitúricos. La metodología desarrollada se aplicó en dos casos forenses presentados en el La-boratorio de Toxicología del Instituto Nacional de Medicina Legal y Ciencias Forenses en Bogotá.
Palabras clave: Barbitúricos, cromatografía gaseosa, muestras forenses, detector de ionización de llama, validación.
INTRODUCTION
Numerous cases associated with intoxications from a great variety of substances arrive at the National Institute of Legal Medicine and Forensic Sciences (NILMFC). Some of those substances are benzodiazepines, illegal recreational drugs and barbiturates. Such intoxications are related to criminal acts such as theft and sexual crimes. This is the reason why the identification and quantification of these substances is important.
In the field of forensics, several preliminary or screening tests are used for identi-fication of these substances. The most commonly used are the inmunoenzimatic methods, which in spite of their high sensitivity can show a lack of selectivity and can therefore produce false positives. For this reason, and to confirm any preliminary posi-tive result, chromatographic techniques are used.
In the determination of barbiturates, liquid chromatography (1-4) and gas chroma-tography (5-9) techniques are used. Wand et al. reported the use of micellar capillary electrophoresis for the analysis of two barbiturates, barbital and phenobarbital (10). In this research, the results of development and validation of a gas chromatographic method for the determination of butabarbital, pentobarbital and phenobarbital in blood samples are presented. Aprobarbital was used as internal standard. For the validation of methodology we used FDA’s parameters and guidelines (11) as well as some recommendations made by other authors (12, 13).
EXPERIMENTAL PHASE OF DEVELOPMENT
Instrumentation and materials
Analysis was performed using Hewlett Packard gas chromatography (Mod. 6890, USA) equipped with a flame ionization and nitrogen/phosphorus detector, a split/splitless injector, a series automatic and GC/HP Chemstation Data System (Mod. 7683, USA). The GC column was a HP-1 capillary column, 30 m large, 0.32 mm i.d and 0.25 µm film thickness. Also a vortex mixer, an evaporation system Rapid-Vap® (Labconco, USA) roto-mix tubes, a Depot centrifuge, a Galaxy analytical balance (Ohaus, Germany) and glass silanizated were used.

Validation
7
Reagents and standards
Methanol, n-hexane, dichloromethane, n-butyl chloride, chloroform, monosodium phosphate, disodium phosphate, acetic acid, sodium hydroxide (all analytical grade). Deionized water was used throughout all experiments. The standards butabarbital, phenobarbital, pentobarbital, aprobarbital, paracetamol, nicotinamide, caffeine, ibu-profen, and aspirin were purchased from Sigma Aldrich (USA).
Specimens
Blank preserved blood fluid, which was used for the extraction procedures, development of the methodology and validation stage, was obtained from Cruz Roja Colombiana.
Optimization of chromatographic parameters
For this development stage, two analytical procedures reported by Anderson y Fuller (6) and Ojanpera (7) for the identification and determination of acid and neutral drugs were revised and evaluated. The chromatographic conditions and parameters used in this work are shown in Table 1.
Table 1. Chromatographic parameters of the analytical procedures.
Parameter Method 1 Method 2
Column100 % polydimehtyl siloxane
30 m, d.i. 0.32 mm, f.t. 0.25µm5 % diphenyl 95 % methyl siloxane
30 m, d.i. 0.25 mm, f.t. 0.25µm
Mode pulsed split less split lessGas: helium 1 mL/min 0.7 mL/min
Makeup: nitrogen 25 mL/min 293 mL/minHydrogen 40 mL/min 30 mL/min
Air 450 mL/min 400 mL/min
Injector temperature
250 °C 270 °C
Detector temperature
300 °C 290 °C
Oven temperature Initial T : 80°C x 1 min Initial T : 70°C x 0.7 min
Oven Ramp 10°C/min to 150°C
5°C/min to 280°C (final)20°C/min to 130°C
10°C/min to 280°C (final)
After the corresponding trials, Method 1 was selected for the subsequent validation stage considering resolution of the different substances peaks signs and the internal standard, as well as the reproducibility of selection criteria. The internal standard, apro-barbital, was used in concentration of 60 µg/mL. Table 2 shows the results for the GC system suitability parameters related to the first method.

8
Daza et al.
Table 2. Chromatographic parameters for system suitability test.
Drug tr (min) Capacity factor
Number Plate N
Resolution R
Tailing factor
Aprobarbital 9,54 4,10 308252 15,44 2,32
Phenobarbital 12,89 5,89 1406672 5,73 2,41
Pentobarbital 10,79 4,77 290574 10,30 1,37
Butabarbital 9,96 4,33 252408 5,77 1,32
The obtained values for capacity factor, number plates, resolution and tailing factor for all drugs were according to pharmacopoeia requirements (14).
SAMPLE EXTRACTION AND PURIFICATION STANDARDIZATION
In accordance with the reviewed literature, there are two keys for the best adequacy and extraction of barbiturates in biological fluids, namely, pH of the buffer and organic solvent used (5-9). For this purpose, a 22 factorial design was used to determine the best combination of these variables. The independent variable was the amount of drug extracted and the working pH values were 4.5 and 5.6. For the solvent categori-cal levels, butyl chloride and heptane -dichloromethane mixture (50 -50) were used. The factorial designs are shown in Tables 3 and 4.
Table 3. Treatments table for factorial design.
Variations Treatment
pH 5,6 Heptane – dichloromethane 1
pH 4,5 Heptane – dichloromethane 2
pH 5,6 Butyl chloride 3
pH 4,5 Butyl chloride 4
The computed recovery differences between treatments were statistically significant (Scheffe’s test, p = 0,05). As a result of these statistical analyses, the combination of a pH 4.5 buffer and the 50/50 heptane-dichloromethane mixture was selected as the best treatment.
With this treatment, a chromatogram with fewer interfering signals was found, improv-ing the selectivity of the methodology.
In summary, the extraction procedure established was: to 2 mL of the blood sample 0,1 mL of the internal standard solution, 3 mL of the pH 4,5 buffer and 10 mL of
Validation
9
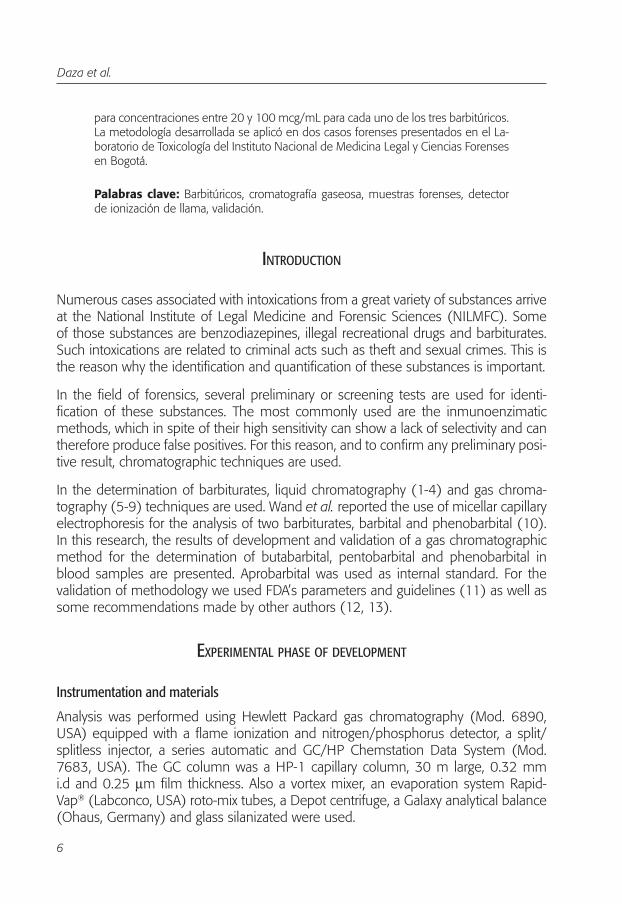
extraction solvent were added. The mix was placed in the rotomixer for 15 minutes, centrifuged at 2000 rpm for 20 minutes and the organic phase removed afterwards by evaporation at 50 °C under nitrogen atmosphere. The residue was dissolved in 100 µL of methanol and 2 µL injected into GC/FID system.
Table 4. Percentage of recovery of barbiturates for treatments.
pH 5.6 Heptane - dichloromethane (50:50)
Aprobarbital Phenobarbital Pentobarbital Butabarbital
47,4 (0.57)* 65,0 (3,21)* 60,9 (2,38)* 59,7 (1,27)*
pH 4,5 Heptane - dichloromethane (50:50)
Aprobarbital Phenobarbital Pentobarbital Butabarbital
81,7 (4,62)* 87,1 (2,39)* 85,9 (3,84)* 83,9 (3,84)*
pH 5,6 Butyl chloride
Aprobarbital Phenobarbital Pentobarbital Butabarbital
38,3(3,05)* 56,8 (1,50)* 40,3 (3,14)* 48,3 (0,33)*
pH 4,5 Butyl chloride
Aprobarbital Phenobarbital Pentobarbital Butabarbital
38,4 (1,86)* 58,9 (2,34)* 41,1 (0,98)* 53,7 (3,01)*
*Standard deviation of four determinations for each treatment.
SAMPLE STABILITY
Ina accordance with the FDA guidelines (11) it is necessary to know the stability of the substances under study in the different biological matrixes selected and under different conditions. This stability depends on the nature of the substance, the type of matrix, the storage conditions, and also on the container of the matrix. The stability of substances in the selected matrix was experimentally evaluated under the freez-ing cycles (at -20°C) between 12 and 24 hours and thawing it at room temperature, which was repeated three times. The short-term stability was analyzed, using a 4-hour period at room temperature; the storage temperature of -20°C. The long term stability for freezing was carried out at -20°C during the period between the preparation of the first sample and the date of the last analysis, as well as in the auto-sampler tray.
The chromatogram of the blank blood sample obtained after storage at -20°C during 2 months, showed change when compared to the chromatogram obtained at the beginning of the study (Figure 1).

10
Daza et al.
Figure 1. GC chromatogram of the blank blood sample.
Table 5 shows the results of the study expressed as a percentage of the initial con-centration.
Table 5. Stability of substances under the experimental storage conditions adopted in this work.
Assay Butabarbital % Pentobarbital % Phenobarbital %
Stock solution 98,3 99,4 94,2
Freeze and thaw stability
C1 93,4 81,1 66,3
C2 94,2 84,2 73,8
C3 94,3 85,7 79,4
Short-Term temperature stability
C1 89,9 86,2 80,2
C2 93,5 89,4 80,9
C3 96,3 91,5 86,2
Long term stability
C1 94,0 92,3 89,9
C2 92,4 93,8 92,4
C3 95,7 91,7 93,8
Post preparative stability (Auto sampler)
t 1 96,3 97,9 92,4
t 2 97,4 92,4 89,9
t 3 99,2 95,3 81,2
C1, C2, C3: 20, 60 y 100 mcg/mL. t1, t2, t3: 6, 12 y 18 hours.
We can observe a slight decrease in the concentration of the standard solution of bar-biturates except in the Phenobarbital, the concentration of which is reduced by 5,8%. The internal standard, aprobarbital, showed a 0,4% decrease. We can also observe a reduction in the concentration of barbiturates facing the freezing and thawing cycles,

Validation
11
phenobarbital again being the most affected. This last evidence, but in different pro-portions, is repeated for the study at room temperature prior to the -20°C storage. In the long-term study and for the three concentration levels, the instability is less marked than in the previous cases. As for the stability of the drugs in the auto-sampler of the descend equipment, the decrease of concentration became significant after 18 hours, mainly in the case of phenobarbital, an important fact which should be taken into account during the analysis of serial samples that remain on the auto-sampler tray for some time. Generally speaking, all of the stability studies carried out show that some necessary precautions must be taken for the conservation of samples in order to establish the best appropriate times for the analysis.
VALIDATION STAGE
Selectivity. Figure 1 shows no signals of endogen interferences that may come from blank blood samples.
Likewise, and according to the FDA’s guidelines (11), effectiveness of the chromato-graphic system was verified against the use of some commonly used drugs, such as ibuprofen, nicotine, caffeine and aspirin, without finding any interferences or overlap-ping with the chromatographic signs produced by the barbiturates under study. Reten-tion times for such substances were 5,1, 8,3, 11,5 and 14,6 minutes respectively.
Calibration standard curve. In order to determine the proportionality of the answers as a function of the concentration for each one of the drugs, standard solutions for the system linearity and spiked blank blood samples for the method linearity were stud-ied. Five and three concentration levels for the system and method were used respec-tively. Figure 2 shows the regression curve for phenobarbital, system and method.
Figure 2. Curve obtained for the linearity test of phenobarbital: 1. System (standards) 2. Method (spiked samples).

12
Daza et al.
The intercept and slope as well as the experimental t values for student test, system and method, are shown in Table 6.
Table 6. t Values for intercept and slope, absolutes areas.
Drug ParameterParameter Value t exp
System1 Blood2 System1 Blood2
ButabarbitalIntercept 0,003 0,013 1,093 1,039
Slope 0,016 0,014 416,69 76,97
PentobarbitalIntercept -0,020 -0,019 -1,336 -1,064
Slope 0,019 0,018 84,73 67,41
PhenobarbitalIntercept -0,003 -0,010 -1,393 -1,496
Slope 0,005 0,004 135,05 42,59
1 n = 15, t tab (13, 0.05): 2.16, 2 n = 9, t tab (7, 0.05): 2.37.
Because in all cases the experimental t-values for the intercepts were lower than the value of t in t-Student the intercept values were not significantly different from zero. Related to the slopes, they are significantly different from zero (t experimental value is higher than the critical value). Table 7 shows the results of ANOVA test for the linear regression.
Table 7. ANOVA of linear regression and lack-of-fit test.
DrugFexp regression Fexp lack of fit
System Blood System Blood
Butabarbital 173629,85 5923,57 0,658 0,363
Pentobarbital 7179,50 4543,39 1,854 1,412
Phenobarbital 18239,00 1813,66 3,073 0,040
1 F tab regression: system F(1/10, 0.05): 4.96, method (1/6, 0.05): 3.71.2 F tab lack of fit: system F(1/10, 0.05): 4.96, method (1/6, 0.05): 3.71.
For the system, F’s experimental values show significant regressions for the three drugs and non-significant linearity deviations. Similar results were found for the method.
Minimum detectable and quantifiable concentration. For estimate the detection limit (LOD) and the quantification limit (LOQ) the intercept and the slope of the calibration curve were used (11). The detection and quantification limits found are shown in Table 8.

Validation
13
Table 8. LOD and LOQ values for barbiturates1.
Drug LOD (mcg/mL) LOQ (mcg/mL)Butabarbital 2,77 9,22Pentobarbital 3,24 10,79Phenobarbital 6,97 23,26
1 LOD: 3a/b, LOQ: 10a/b.
Precision. To evaluate the repeatability and intermediate precision of the method, three concentration levels of each drug were used: 20, 60 y 100 mcg/mL. Intermedi-ate precision was evaluated between days and between analysts. Six and three deter-minations were carried out for repeatability and intermediate precision, respectively. Table 9 reports the coefficients of variation (RSD) for repeatability, as well as the coef-ficients for each one of two analysts during the three days of assay. The global values found in all the cases were lower than 15%, values established as the maximum permissible value for bio-analytical methodologies (11).
Table 9. Repeatability and Intermediate precision of methodology (RSD %).
Drug Concentration (ug/ml)
Repeatability RSD%
Analyst 1 RSD%
Analyst 2 RSD%
Butabarbital20 10,11 8,97 10,1060 4,51 5,62 5,12100 4,45 4,13 4,49
Pentobarbital20 7,38 7,98 8,8560 5,64 5,21 5,25100 4,51 3,75 2,77
Phenobarbital20 12,56 11,39 11,4760 8,99 11,37 12,13100 3,88 4,36 4,82
Likewise, Table 10 shows the results for the ANOVA test for intermediate precision, using the 20 mcg/mL concentration data.
Table 10. Intermediate precision and analysis of variance.
Source dfF exp
Ftab1
Butabarbital Pentobarbital PhenobarbitalAnalyst 1 0,141 0,141 0,181 4,75
Day 2 0,908 0,908 0,594 3,89Assays 2 0,052 0,052 0,480 3,89
1 Analysts F(1/12, 0,05): 4,75, days / assays (2/12, 0,05): 3,89.
14
Daza et al.
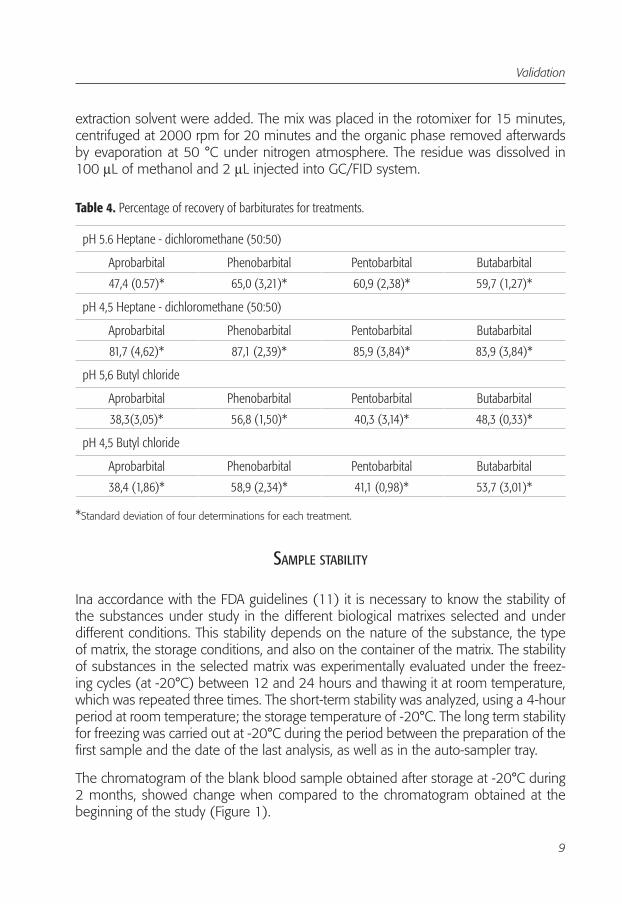
In accordance with the results for each one of the three barbiturates, experimental F-values are lower than tabulated F-values, showing that there are not significant dif-ferences between analysts, days and determinations.
Accuracy. This parameter was evaluated through the recovery percentage, replacing the Y data or the average answer values in the system regression equation obtained for each drug. The value of the experimental concentration was compared to the real concentration added to the matrix, obtaining the percentage of recovery for each drug and for each concentration level (Table 11).
Table 11. Accuracy of methodology through the percentage of recovery.
Drugs C real Y exp blood C exp % Recovery
Butabarbital20 0,285 18,23 91,1760 0,844 54,26 90,43100 1,386 89,27 89,27
Pentobarbital20 0,333 18,47 92,3660 1,073 57,24 95,40100 1,771 93,76 93,76
Phenobarbital20 0,075 16,57 82,8460 0,247 53,23 88,72100 0,416 89,26 89,26
For each one of the barbiturates the recovery percentage is around 80%, which is a value higher than the minimum recommended by the la FDA (11) for bio-analytical methodologies (60%).
Robustness. The variables selected for this study were modified in order to observe the influence of these changes in the answer. In Table 12, the robustness parameters or variables studied are reported.
Table 12. Robustness parameters.
Parameters Standardized Factor Alternative Factor
Equipment Chromatograph HP 6890 Chromatograph HP 5890 Series II
Column HP-1 100% polydimehtyl siloxane HP-5, 5% phenyl -95% polydimehtyl siloxane
Flow 1 mL/min 1,4 mL/min
Liner Activate Deactivate
Silanizated material Yes No
Reconstitution time Immediate 12 hours after
Injection time Immediate 4 hours after

Validation
15
For the three barbiturates, according to Youden’s method reported by Quattrochi and Laba (15) the critical factors that have to be carefully controlled during the analysis are: equipment, column, liner, material and redisolution time of the dry extract.
APPLICATION. To determine the usefulness of the validated methodology, we car-ried out a preliminary analysis of ten forensic samples that could contain some of the barbiturates under study. Of them, two showed positive results for phenobarbital with concentrations of 21 and 15,7 mcg/mL respectively. One of them showed toxic con-centration (see Table 13). Phenobarbital identity was also confirmed with a second validated HPLC method. Figure 3 shows the chromatogram obtained with one of the two forensic samples.
Table 13. Therapeutic and toxic barbiturates concentration.
Drugs Therapeutic concentration (mg/L)
Toxic concentration (mg/L)
Butabarbital 1 - 10 10 - 25
Pentobarbital 1 - 10 8 - 12
Phenobarbital 1 - 10 17 - 90
Plasma concentrations (16).
Figure 3. Blood forensic sample chromatogram.
16
Daza et al.
CONCLUSIONS
An analytical method was develop and validated for the identification and quanti-fication of butabarbital, pentobarbital and phenobarbital in blood samples by gas chromatography with flame ionization detector and pulsed splitless. The validated bioanalytical methodology is specific, linear, precise and accurate between 20 and 100 mcg/mL for phenobarbital, pentobarbital and butabarbital. The stability of the drugs used was rigorously evaluated, mainly for samples stored at room temperature. The validated methodology, as it was demonstrated, proved useful in establishing the presence of studied barbiturates and for their quantitative determination in blood forensic samples.
ACKNOWLEDGES
To the Toxicology Lab from Instituto Nacional de Medicina Legal y Ciencias Forenses, where this work was developed, and to the Universidad Nacional de Colombia, espe-cially to the Pharmacy Department.
BIBLIOGRAPHY
1. Pihlainen K., Sippola E. y Kostiainen R., Rapid identification and quantification of compounds with forensic interest using phase liquid chromatography-ion trap mass spectrometry and library searching, Journal of Chromatography A, 995, 93-102 (2003).
2. Miyaguchi, H., Kuwayama K., Tsujikawa T., Kanamon T, Iwata Y. y Kishi, T., A method for screening for various sedative-hypnotics in serum by liquid chroma-tography/single quadruple mass spectrometry, Forensic Science International, 157, 57-70 (2006).
3. Capella-Pieró M., Gil-Agusti M., Martinavarro-Domínguez A. y Esteve-Romero J., Determination in serum of some barbiturates using micellar liquid chromatog-raphy with direct injection, Analytical Biochemistry, 309, 261-268 (2002).
4. Esteve-Romero J., Carda-Broch S., Gil-Agusti M. Capella-Pieró M. y Bose, D. Micellar liquid chromatography for the determination of drugs materials in pharmaceutical preparations and biological samples, TrAc Trends in Analytical Chemistry, 24, 75-91 (2005).
5. Zhao H., Wang L., Qiu Y., Zhou Z., Li X. y Zhong W., Simultaneous determination of three residual barbiturates in pork using accelerated solvent extraction and

Validation
17
gas chromatography-mass spectrometry, Journal of Chromatography B., 840, 139-145 (2006).
6. Anderson W.H. y Fuller D.C., A simplified procedure for the isolation, charac-terization and identification of weak acid and neutral drugs from whole blood, Journal of Analytical Toxicology, 11, Sep-Oct (1987).
7. Ojanpera, I., Automated quantitative screening for acidic and neutral drugs in whole blood by dual-column capillary gas chromatography, Journal of Analytical Toxicology, Jul- Aug, 14(4), 2048 (1997).
8. Whitter P. y Cary, P., A rapid method for the identification of acidic, neutral and basic drugs in postmortem liver specimens by toxi-lab, Journal of Analytical Toxicology, Mar-Apr., 10, 68-71 (1986).
9. Perchalki, R., Rapid, Simultaneous GLC determination of phenobarbital, primi-done and diphenylhidantoin, Journal of Pharmaceutical Sciences, 62, 1735-1736 (1973).
10. Wang Q-L., Fan L-Y., Zhang W. y Cao C-X., Sensitive analysis of two barbiturates in human urine by capillary electrophoresis with sample stacking induced by moving reaction boundary, Analytica Chimica Acta, 580, 200-205 (2006).
11. Guidance for Industry, Bioanalytical Methods Validation, Guidance, Food and Drug Administration, Centre for Drug Evaluation and Research CDER, May 2001.
12. Singtoroj. T, Tarning J. A new approach to evaluate regression models during validation of bioanalytical assays, Journal of Pharmaceutical and Biomedical Analysis, 41, 219-227 (2006).
13. Boulanger B. Chiap. P. An analysis of the SFSTP guide on validation of chroma-tographic bioanalytical methods: progresses and limitations, Journal of Pharma-ceutical and Biomedical Analysis, 32, 753-765 (2003).
14. The United States Pharmacopoeia, USP 29, The Pharmacopoeia Convention Inc., 2006, page 588.
15. O.A. Quattrochi, R.F. Laba y S.I. Belaira, “Introducción a la Cromatografía Líquida de Alta Eficiencia, Aplicación y Práctica”, Artes Gráficas Farro S.A., B.A., Argentina, 1992.
16. Anthony C. Moffat, M. David Osselton, Clarke’s Analysis of drugs and Poisons, The Pharmaceutical Press, 3a Ed., 2004.