chronic nicotinamide mononucleotide supplementation
TRANSCRIPT
Chronic nicotinamide mononucleotidesupplementation elevates blood nicotinamideadenine dinucleotide levels and alters musclemotility in healthy old menMasaki Igarashi
Graduate School of Medicine, The University of TokyoMasaomi Miura
Graduate School of Medicine, The University of TokyoYoshiko Nakagawa-Nagahama
Graduate School of Medicine, The University of TokyoKeisuke Yaku
University of ToyamaKosuke Kashiwabara
The University of Tokyo HospitalMika Sawada
The University of Tokyo HospitalRie Sekine
The University of Tokyo HospitalYuichiro Fukamizu
Mitsubishi Corporation Life Sciences LimitedToshiya Sato
Mitsubishi Corporation Life Sciences LimitedTakanobu Sakurai
Mitsubishi Corporation Life Sciences LimitedJiro Sato
Tokyo Metropolitan Police HospitalKenji Ino
The University of Tokyo HospitalNaoto Kubota
Graduate School of Medicine, The University of TokyoTakashi Nakagawa
University of Toyama https://orcid.org/0000-0001-5539-7605Takashi Kadowaki

Department of Prevention of Diabetes and Lifestyle-Related Diseases, Graduate School of Medicine, TheUniversity of Tokyo, Tokyo https://orcid.org/0000-0002-5428-3582Toshimasa Yamauchi ( [email protected] )
Department of Diabetes and Metabolic Diseases, Graduate School of Medicine, The University of Tokyohttps://orcid.org/0000-0003-4827-6404
Article
Keywords: Aging-related Disorders, Physiological Dysfunctions, Muscle Weakness, Body Composition
Posted Date: June 9th, 2021
DOI: https://doi.org/10.21203/rs.3.rs-455083/v1
License: This work is licensed under a Creative Commons Attribution 4.0 International License. Read Full License
1
Chronic nicotinamide mononucleotide supplementation elevates
blood nicotinamide adenine dinucleotide levels
and alters muscle motility in healthy old men
Masaki Igarashi1,9, Masaomi Miura1,9, Yoshiko Nakagawa-
Nagahama1,9, Keisuke Yaku2, Kosuke Kashiwabara3, Mika Sawada4,
Rie Sekine4, Yuichiro Fukamizu5, Toshiya Sato5, Takanobu Sakurai5,
Jiro Sato6, Kenji Ino7, Naoto Kubota1,4, Takashi Nakagawa2, Takashi
Kadowaki8 & Toshimasa Yamauchi1*
1. Department of Diabetes & Metabolic Diseases, Graduate School
of Medicine, The University of Tokyo, Tokyo, Japan
2. Department of Metabolism and Nutrition, Graduate School of
Medicine and Pharmaceutical Science for Research, University
of Toyama, Toyama, Japan.
3. Data Science Office, Clinical Research Promotion Center, The
University of Tokyo Hospital, Tokyo, Japan

2
4. Department of Clinical Nutrition Therapy, The University of
Tokyo Hospital, The University of Tokyo, Tokyo, Japan.
5. Mitsubishi Corporation Life Sciences Limited, Japan
6. Department of radiology, Tokyo Metropolitan Police Hospital
Tokyo, Japan.
7. Department of Radiation Technology, The University of Tokyo
Hospital, Tokyo, Japan.
8. Toranomon Hospital, Tokyo, Japan.
9. These authors contributed equally
*. Corresponding author
Contact: [email protected]

3
Abstract
Preclinical studies have revealed that the elevation of nicotinamide adenine
dinucleotide (NAD+) levels on administration of an NAD+ precursor, nicotinamide
mononucleotide (NMN), can mitigate aging-related disorders; however, human data
are sparse. Therefore, we aimed to investigate whether the chronic oral
supplementation of NMN can elevate blood NAD+ levels and alter physiological
dysfunctions, including muscle weakness, in healthy elderly participants. We
administered 250 mg NMN per day to aged men for 6 or 12 weeks (n=21 for 6
weeks, n=10 for 12 weeks) in a placebo-controlled, randomized, double blind,
parallel-group trial. Chronic supplementation with NMN was well tolerated and did
not cause any significant deleterious effect. Metabolomic analysis of whole blood
demonstrated that the oral supplementation of NMN significantly increased the
concentrations of NAD+ and NAD+ metabolites. Moreover, NMN significantly
improved muscle strength and performance, which were evaluated using the 30-
second chair stand test, walking speed, and grip strength, and it showed no
significant effect on body composition. Thus, our evidence indicates that chronic oral
NMN supplementation can be an efficient NAD+ booster for preventing aging-related
muscle dysfunctions in humans.

4
Aging is a risk factor for diabetes, cardiovascular diseases, cancer, and
neurological diseases such as Alzheimer's disease, and the suppression of
physiological decline in aging is an important approach to prevent aging-related
diseases1. Calorie restriction is known to have life-extending and health-promoting
effects in many species, including mammals2, and it regulates several molecular
mechanisms that cause health-promoting effects. Among them, nicotinamide
adenine dinucleotide (NAD+)-dependent deacetylase sirtuins, discovered in yeast
and proven to extend the lifespan in mice, mediate the health-promoting effects of
calorie restriction2.
Aging- and age-related diseases have been shown to be closely related to
decreased NAD+ levels and sirtuin activity3. In animal studies, administration of
intermediate NAD+ metabolites, nicotinamide mononucleotide (NMN) or
nicotinamide riboside (NR), increases NAD+ concentrations and activates sirtuins to
improve health and extend the lifespan3-5. For example, NR administration
ameliorates age-related decline in the self-renewal of intestinal stem cells6. Thus, the
potential of intermediate NAD+ metabolites to improve tissue rejuvenation in humans
has led to many clinical trials with NR and NMN.
NR, a vitamin B3 analog, is a major vitamin component found in milk (~1
mg/L) 7. NMN is found in foods such as edamame, broccoli, and meat (~1 mg/100 g
5
food) 8. However, due to their extremely low amounts in foods, it is difficult to obtain a
sufficient amount of these components from food. Therefore, purified and
concentrated NR and NMN have been used in clinical trials.
The results of NR clinical trials have already been reported. NR (100–2000
mg/day) has been administered to healthy or obese participants for a maximum of 12
weeks9-19. Most NR clinical trials have reported the safety of NR administration9-18
and elevated NAD+ or NAD+-related metabolites in the blood or tissues9-17. The
most recent report showed that NR increases the fat-free body mass in obese
participants, although no effect was observed on insulin sensitivity, mitochondrial
function, and hepatic and intramyocellular lipid accumulation17.
Recently, for the first time, the safety of single-day NMN oral administration
has been reported in humans20. However, the evidence of human interventions with
NMN is limited and the safety and efficacy of long-term NMN administration have not
been determined.
Therefore, to elucidate the safety and efficacy of NMN administration, we
conducted a placebo-controlled, randomized, double-blind, parallel-group study with
the administration of 250 mg of NMN to healthy men aged 65 years or above for 12
weeks. We demonstrated that the oral supplementation of 250 mg/day NMN in
healthy old men for 12 weeks was safe, well tolerated, and significantly increased

6
NAD+-and NAD+- related metabolites in the whole blood. Furthermore, NMN
administration significantly improved muscle performance in healthy elderly men.
Thus, the chronic oral administration of NMN can be a therapeutic strategy for aging-
related disorders in humans such as sarcopenia.

7
Results
Participant enrollment and baseline characteristics
Sixty-five elderly men aged 65 years and above were screened for the study,
which was conducted between July 2019 and November 2019 and registered on
UMIN-CTR under the identifier UMIN000036321. Eight participants were excluded
due to a specific medical history or abnormal laboratory data. Three participants
were enrolled in other clinical trials after obtainment of consent. The other two
participants were excluded because they requested to withdraw immediately after
providing consent. The 42 enrolled subjects were randomized between the two
treatment groups (placebo group and 250 mg NMN/day group) (Figure 1).
The supplements (placebo or NMN) were supplied to each group of
participants at 0- and 6-week visits. However, after completion of the study, it came
to light that at the 6-week visit, 11 participants each in the NMN and placebo groups
received the other supplement due to the supplier's mistake. According to the
decision of the Ethics Committee of the University of Tokyo Hospital, we decided to
exclude the acquired data from the 22 participants at the 12-week visit (Figure 1).

8
The main physical and metabolic features of the NMN (n=21) and placebo
groups (n=21) are summarized in Table 1. Key parameters were comparable
between the two groups at baseline. Excluding the 22 participants, the physical
characteristics of all participants in the NMN and placebo groups at baseline are
shown in Table S1.
Supplementation of 250 mg/day NMN for 12 weeks is well tolerated
Adherence to the study treatment was excellent, with all participants
consuming greater than 90% of all NMN and placebo supplements administered.
NMN (250 mg/day) was well tolerated, and no serious adverse event occurred.
Clinical laboratory values were obtained from blood samples collected at baseline
and at the 12-week visit. No significant difference was observed between the NMN
and placebo groups for hematology and blood chemistry, including liver enzymes
and renal function markers (Tables S2 and S3). Importantly, all clinical laboratory
values remained within the normal range in the NMN group. These results support
that the supplementation of 250 mg/day NMN for 12 weeks is well tolerated in
healthy old men.

9
Chronic oral administration of NMN increases NAD+ and related metabolites in
the whole blood
Whole blood was collected at baseline and at the 12-week visit from
participants for subsequent analysis of NAD+ and related metabolites using liquid
chromatography-mass spectrometry (LC-MS/MS). As shown in Figure 2, oral NMN
supplementation effectively elevated the levels of NMN and NAD+ as compared to
the placebo. We also observed an increase in NR, which may indicate the possible
conversion of NMN to NR by CD7321. Notably, NMN also significantly elevated
nicotinic acid mononucleotide (NAMN) and nicotinic acid riboside (NAR) levels,
which are intermediates of the NAD+ de novo synthesis pathway. Collectively, these
findings indicate that the chronic oral supplementation of NMN effectively stimulates
NAD+ metabolism in healthy elderly men.
Chronic oral administration of NMN improves motor functions
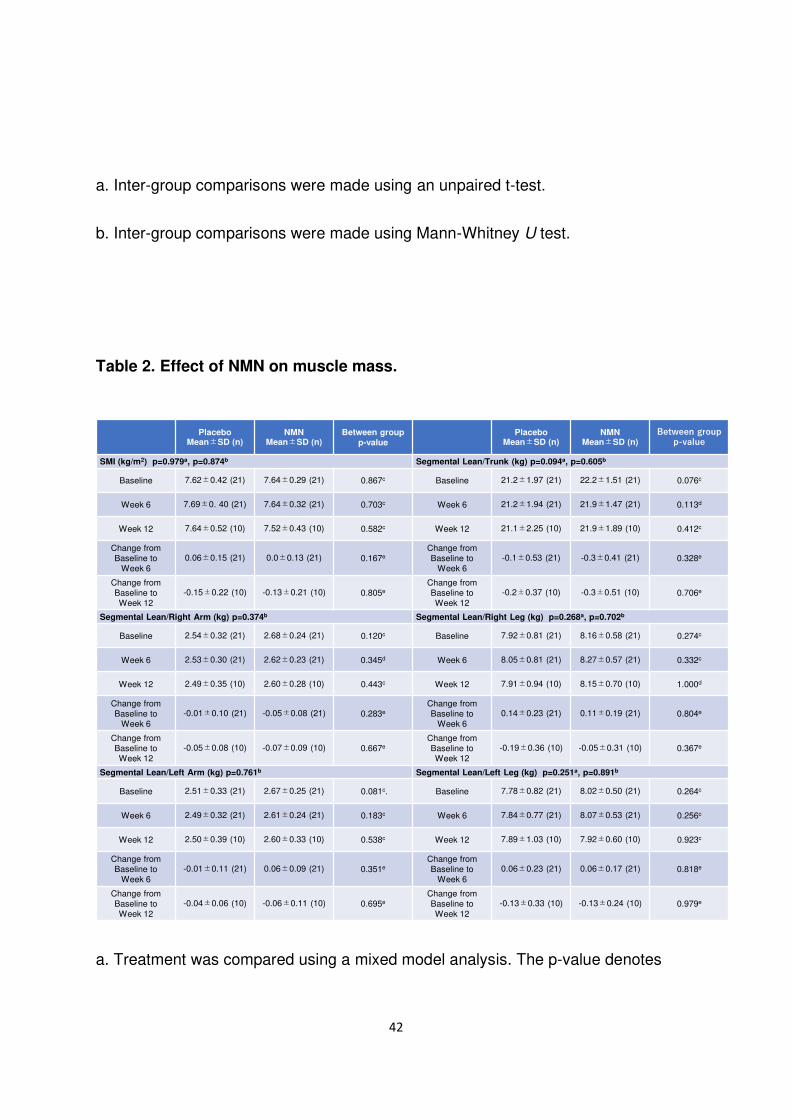
To examine the effect of oral administration of NMN on skeletal muscle mass
in healthy old men, skeletal mass index (SMI) and segmental lean (lean trunk, arms,
and legs) were measured using bioimpedance analysis (BIA), and the mean values
10
in the NMN and placebo groups at baseline and the 6-and 12-week visits were
evaluated using mixed model analysis or mixed-effect model for repeated measures
(MMRM) 22. The means of each group at both the visits were compared using the
Mann-Whitney U and t-tests for non-normal distribution. Furthermore, the difference
between pre- and post-placebo and pre- and post-NMN supplementation (Placebo
and NMN, respectively) at the 6-and 12-week visits were analyzed using ANCOVA.
No significant difference was observed in the skeletal muscle mass in any of these
analyses (Table 2).
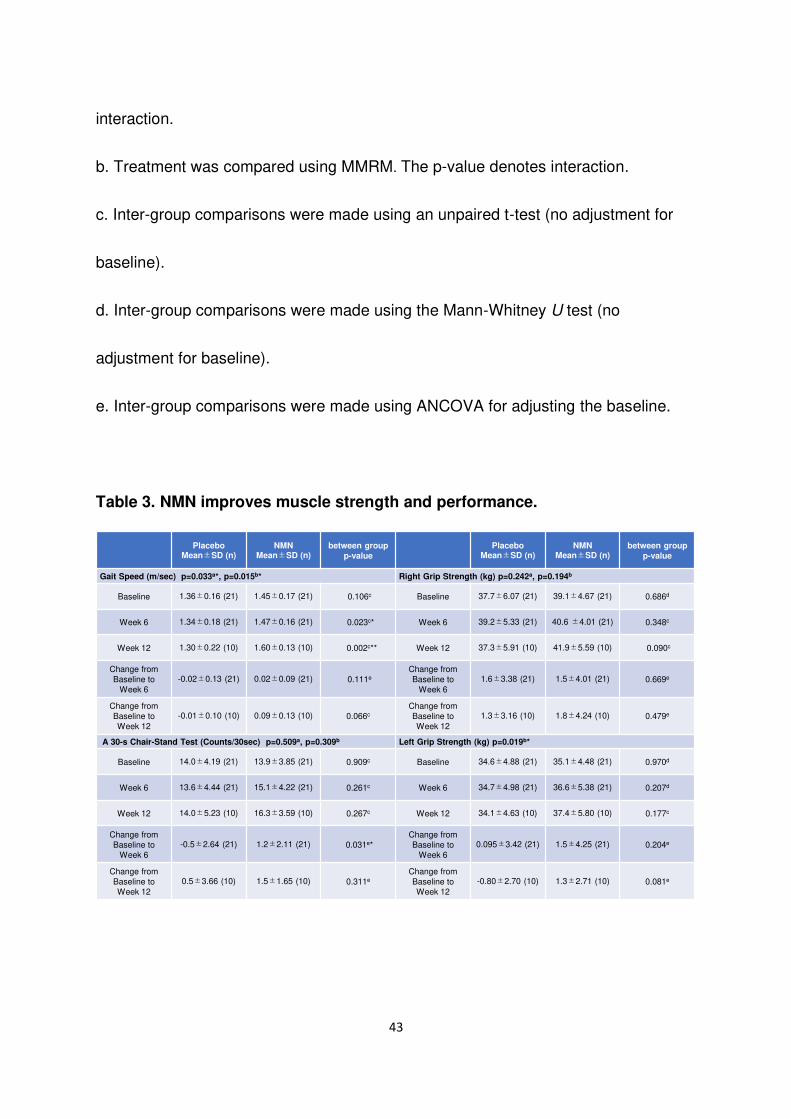
On the other hand, to examine muscle strength and performance, gait
speed, counts in 30-second chair stand test, and grip strength were assessed and
analyzed using the same statistical method. (Table 3). Mixed model analysis or
MMRM showed a significant improvement in gait speed (p=0.033) and left grip test
(p=0.019) after NMN administration. We also observed a significant difference in gait
speed between the mean values of each group at the 6-and 12-week visits (p=0.023
and p=0.002, respectively). Furthermore, a significant difference was observed in the
30-second chair stand test between Placebo and NMN groups at the 6-week visit
(p=0.031) (Table 3).
These findings indicate that the chronic oral supplementation of NMN
improved muscle strength and performance in healthy old men, although NMN did

11
not affect skeletal muscle mass.
Liver and visceral fat mass are not affected on NMN supplementation
Next, we investigated the effect of NR on fat mass distribution because
animal studies suggest a positive role of NMN on insulin sensitivity and hepatic
steatosis4, 5 (Figure 3). Chronic NMN supplementation did not affect the visceral fat
area (Figure 3A) and CT values of the liver and spleen (L/S ratio) in the CT scan
(Figure 3B), in accordance with the measurement of fat mass using BIA (Figure 3B).
Likewise, NMN administration did not affect the homeostatic model assessment of
insulin resistance (HOMA-IR), an indicator of hepatic insulin sensitivity in blood
analysis (Figure 3C). Adiponectin and interleukin (IL) 6, which are also related to
insulin sensitivity, were not affected by NMN administration (Table S4). These data
indicate that insulin sensitivity and fat mass were not affected by NMN
supplementation in our study. Consistently, no significant difference or trend was
observed in triglycerides, LDL cholesterol, HDL cholesterol, HbA1c, FBG, HOMA-β,
calculated AUC of glucose, insulin, and C-peptide in 75 g of the sample using oral
glucose tolerance test OGTT after NMN supplementation (Figure 3C and TableS4).

12
Effect of NMN on other aging-related phenotypes
To gain exploratory insight into the potential benefits of NMN
supplementation on other domains of physiological functions in healthy old men, we
assessed a wide variety of outcomes indicative of sensory, vascular, and cognitive
functions. Right audibility improved with a significant difference (p=0.0268, mixed
model analysis) (Table S5). On the other hand, no difference was observed in the
indicators of vascular functions, such as assessed blood pressure and Flow
Mediated Dilation (Table S6). Finally, no effect was observed of the intervention on
overall cognitive function, as assessed by mini-mental state examination-Japanese
(MMSE-J) and the Japanese version of the Montreal Cognitive Assessment (MOCA-
J) (Table S5).

13
Discussion
In this study, we reported that the chronic oral supplementation of 250 mg
NMN per day is safe and a well-tolerated and effective strategy for boosting NAD+
metabolism in healthy elderly men. Additionally, our exploratory analyses of the
effects of NMN supplementation on physiological functions suggest the ability of
NMN to improve muscle strength, which is an important clinical indicator of aging.
When this study was designed, the results of the NMN clinical trial were not
available. Some studies have reported the effects of oral or intraperitoneal NMN
(100–500 mg/kg/day) administration in mice4, 5. Particularly, long-term administration
of NMN at doses of 100 or 300 mg/kg/day for one year showed no significant side
effect; however, insulin sensitivity and eye functions deteriorate with aging8. If this
dosage is converted to the absorption area of the small intestine, 100 mg/kg/day
NMN in mice is considered equivalent to 8 mg/kg/day intake in humans23. On the
other hand, some clinical studies have been conducted on humans in Japan and the
US. The US study (ClinicalTrials.gov Identifier: NCT03151239) was performed at a
dose of 250 mg/day for 8 weeks, and the Japanese study (UMIN ID
UMIN000025739) was performed at a dose of 100 or 200 mg/day for 24 weeks.
Additionally, several human clinical trials have been conducted on NR, another
14
precursor of NAD+, in which NR has been administered at doses of 100-2000
mg/day for up to 12 weeks with no serious side effects9-19. Finally, the NMN dose in
this study was set in consideration of the dose in previously reported NR (100–2000
mg/day) and ongoing NMN clinical trials (100, 200, 250 mg/day).
In the first NMN study, a single oral administration of 500 mg NMN did not
show any specific deleterious side effects in healthy men20. Likewise, the 12-week
chronic administration of 250 mg NMN also showed no significant side effect. NR
has been demonstrated to be well-tolerated in all published clinical studies9-19
whereas niacin analogs, including nicotinic acid (NA), nicotinamide (NAM), and
NAD+ precursors, are known to induce nausea and flushing, leading to a difficulty in
using high doses of niacin to increase NAD+24,25. Niacin has also been reported to
induce hepatotoxicity, hyperglycemia, and hyperuricemia24, 25; however, we did not
find any abnormality in clinical laboratory values, including those of liver or muscle
enzymes in our study. Overall, NMN was well tolerated up to a chronic dose of 250
mg.
A previous study reported that NR administration significantly increases tissue
NAD+ and plasma or whole blood NAD+ levels in healthy participants9-12, 15, 16. On
the other hand, no previous NMN study directly detected NAD+ increase in the blood
whereas the major final metabolites of NMN, such as methylnicotinamide, N-methyl-

15
2-pyridone-5-carboxamide, and N-methyl-2-pyridone-5-carboxamide, have been
analyzed20. Thus, this is the first study to report that NMN administration significantly
increased NAD+ and NAD+ metabolites in the whole blood. One unexpected finding
was a remarkable elevation in NAMN and NAR levels, which was not an en route for
the conversion of NMN to NAD+. Previous reports have shown that as the rate of
NAD+ synthesis increases, the deamination of NAD+ to nicotinic acid adenine
dinucleotide (NAAD) occurs in competition with NAD+ turnover to nicotinamide,
suggesting that NAAD can serve as a sensitive biomarker for increased NAD+
metabolism9. Alternatively, an increase in NAD+ can result in NMN deamination,
giving rise to NAMN. Another explanation is the deamination of NMN by gut
microbiota. Oral NAM or NR can be deamidated into NA, NAR, NAAD, and NAMN by
gut microbiota in the small intestine and colon26. These deamidated
NAD+ metabolites circulate to the tissues, contributing to NAD+ synthesis26.
Skeletal muscle mass and strength decrease with aging because of muscle
atrophy, leading to a reduced quality of life27. The application of NMN in vivo
ameliorates muscle decline in rodent models4, 5. NMN has also been reported to
improve mitochondrial functions in the skeletal muscles of rodents4, 5, 28. In
agreement with the evidence reported in rodents, we found that our chronic NMN
supplementation improved muscle strength and performance in old men, which was

16
evaluated using the 30-second chair stand test, walking speed, and grip strength. On
the other hand, contrary to the animal study, in which 300 mg/kg/day NMN tended to
have an increased lean mass as compared to that of the controls8, NMN did not
affect skeletal muscle mass in our study. Recently, several NR human studies have
reported that skeletal muscle mitochondrial functions do not increase following NR
supplementation16, 17, 19. Therefore, our findings suggest that the chronic
supplementation of NMN may support overall muscle health, but further studies are
warranted to elucidate the mechanisms behind this observed increase in mobility.
NMN supplementation has also been suggested to improve insulin sensitivity
and metabolic health in rodent models4, 5. A previous NR human study reported a
decrease in haptic lipid content in obese men, although it was not significant13. In this
study, no effect of NMN was observed on hepatic lipid accumulation and insulin
sensitivity. This may be attributed to the normal metabolic status of our study
population.
In this study, we also performed a preliminary evaluation of auditory capacity
using an audiometer before and after intervention with NMN. In mice, SIRT3, an
NAD+-dependent protein deacetylase localized in the mitochondria, has been
reported to be involved in the regulation of hearing ability during aging29. NR
supplementation in rodents has also been reported to improve noise-induced and

17
age-related hearing loss via SIRT3 activation29-31. In our study, NMN
supplementation partially improved the auditory capacity of elderly people. However,
little is known about the underlying mechanisms by which NAD+ precursors may
improve hearing in humans. Based on preclinical studies29-32, NMN can similarly
affect hearing in humans through mechanisms involving SIRT3 activation and the
increased ratio of reduced to oxidized glutathione in the mitochondria. However,
future mechanistic studies are needed to test this hypothesis. Such studies will be
technically challenging in humans, and it will be important to dissociate the effects of
SIRT3 activation from the possible pleotropic effects of elevating NAD+ metabolites.
While this study offers novel insights into NMN as a nutritional supplement
and potential therapeutic entity, there are some limitations. First, the enrolled 42
participants were randomized between the two treatment groups that were adjusted
for age, body mass index (BMI), and SMI. However, 22 participants dropped out and
the adjustment between the two groups was broken, which may compromise some
results in this study. Second, we included only healthy elderly men in this study.
Elderly participants were included in the study because NAD+ levels decrease with
age in rodents and humans33 and NAD+ supplementation can be more effective in
elderly people. Moreover, men were chosen as participants, considering the
possibility that the data from older women are affected by the rapid decrease in

18
estrogen or progesterone levels associated with menopause. We still speculate that
NMN administration may be effective in different populations, such as middle-aged
adults or elderly women, because the apparent difference in the response to NR,
another NAD+ precursor, due to age or sex has not been reported in human clinical
studies9-19. However, it remains to be determined whether NMN supplementation is
effective in populations that are different in gender, age, or baseline physiological
functions, which is critical in determining the therapeutic potential of oral NMN
supplementation. Thus, further clinical studies should be conducted in specific
populations in this regard.
Conclusion
We report that supplementation of 250 mg/d NMN for 12 weeks in healthy old
men was safe, well tolerated, and significantly increased NAD+ and
NAD+ metabolites in whole blood. Additionally, NMN induced improvements in
muscle strength and performance. Thus, chronic oral administration of NMN could
be an effective strategy for the prevention of age-related muscle disorders such as
sarcopenia.

19

20
Materials and Methods
Ethical approval, informed consent, and study location
The study was conducted in accordance with the Declaration of Helsinki
guidelines, and it was approved by the Graduate School of Medicine and Faculty of
Medicine, The University of Tokyo Research Ethics Committee (2018013P). The
study was registered at UMIN-CTR (UMIN000036321) before the patients were
recruited. The participants received oral and written information before obtaining
written consent. The study was conducted at the Clinical Research Support Center
Phase 1 Unit at the University of Tokyo Hospital.
Study design, randomization, and intervention
The study was designed as a placebo-controlled, randomized, double blind,
parallel-group trial. Participants were examined at baseline and the 6-week and 12-
week visits. After completion of the baseline investigations, participants were
randomized to a 12-week supplementation with NMN or placebo with daily
administration by a third party, C&C QUALITATIVE RESEARCH INSTITUTE INC

21
(Tokyo, Japan), with no significant difference in age, BMI, or SMI between the two
groups (Table 1). The allocation of NMN or placebo group was also managed by the
C&C QUALITATIVE RESEARCH INSTITUTE INC until the end of the study. The
participants received oral supplementation of 250 mg of NMN (Mitsubishi
Corporation Life Sciences Limited, Tokyo, Japan) once daily or placebo for 12
weeks. The participants and data collectors were blinded to the treatment. Once all
participants completed the study, the randomization code was released.
The primary objective of this study was to evaluate the potential benefits of
NMN in increasing blood NAD+ concentration and affecting the body composition of
elderly participants after the 12-week treatment. The secondary objective of the
study was to evaluate aging-related parameters such as muscle strength and
performance, bone density, vision, and hearing ability.
Study participants
Sixty-five healthy Japanese male volunteers were recruited in the study. The
inclusion criteria were as follows: male, over 65 years of age, BMI (in kg/m2) 22-28,
nonsmokers, and having no active diseases. Participants with a history of treatment
for malignancy, heart failure, or myocardial infarction; with a prescription medication
22
and supplement that may affect clinical research; or who had exercised for at least
one hour daily for at least six months continuously were excluded. Participants
underwent a physical examination by a physician, including routine clinical
biochemistry, to evaluate their eligibility for the study.
During the intervention, participants were instructed not to change their
lifestyle and to abstain from Vitamin B3-related dietary supplements. Finally, 20
participants completed the study whereas 22 dropped out because of a mistake in
the distribution of NMN or placebo at the 6-week visit (Figure 1).
Evaluation of safety, tolerability, and adherence
Participants were instructed to record any adverse event in a diary, and they
were asked during the visit if they had experienced any difficulty or problem since the
last visit. Participants were also requested to immediately report any serious adverse
event during the study to the investigators. Adverse events were monitored via a
blood test and by observing the participants during safety checkups at the 6- and 12-
week visits. Adherence was checked using the pill count.
23
Laboratory measurements
Blood was collected from the forearm of each participant at baseline and the
12-week visit. Hematological tests, including white blood cell count, red blood cell
count, hemoglobin, hematocrit level, platelet count, mean red blood cell pigment
content, mean red blood cell volume, and mean red blood cell pigment
concentration, were measured.
An OGTT was performed using 75 g of glucose. Blood glucose, insulin, and
C-peptide levels were measured at 0, 30, 60, and 120 min after oral glucose loading.
The areas under the curves (AUC) for glucose, insulin, and C-peptide were
calculated using the trapezoidal formula. Insulin resistance, determined using
HOMA-IR, was calculated using the following equation: fasting glucose (mg/dL) ×
fasting insulin (µU/mL)/405. HOMA- was calculated using the following formula: 360
× fasting insulin (µU/mL) / (fasting glucose [mg/dL] - 63).
Biochemical tests, including triglyceride, total cholesterol, LDL-cholesterol,
HDL-cholesterol, glucose, HbA1c, insulin, blood C-peptide, AST, ALT, γ-GTP, CK,
total protein, albumin, uric acid, uric acid nitrogen, creatinine, sodium, potassium,
high-sensitivity C-reactive protein, adiponectin, and IL-6 levels, were measured.
For adiponectin and IL-6, blood samples were left to stand for 30 min,

24
centrifuged at 25 °C and 3500 rpm for 5 min, and stored at -30 °C. Blood samples for
adiponectin and IL-6 were sent to SRL (SRL, Inc. Tokyo, Japan) for testing. Other
blood tests were performed at the University of Tokyo Hospital.
Extraction of NAD+ and LC-MS analysis
At baseline and the 12-week visit, blood samples were collected in
heparinized tubes, frozen at -80 °C, and analyzed at University of Toyama.
Metabolite extraction and NAD+ metabolomics were performed as previously
described34. Briefly, metabolites were extracted by mixing 50 µL of blood and 450 µL
of MeOH, and this was followed by vortexing for 10 s. An equal volume of chloroform
was added to the solution. The mixture was centrifuged at 13,000 × g at 4 °C for 10
min. The separated upper aqueous phase was transferred into a new tube, and the
same procedure was repeated. The aqueous phase was dried and reconstituted in
LC/MS-grade water. Metabolites were analyzed using an Agilent 6460 Triple Quad
mass spectrometer (Agilent Technologies Inc., Santa Clara, CA, United States)
coupled with an Agilent 1290 HPLC system (Agilent Technologies Inc., Santa Clara,
CA, United States). Analytes were separated on an Atlantis T3 column (2.1 × 150
mm, particle size 3 µm, Waters) using mobile phase A (5 mM ammonium formate)

25
and mobile phase B (methanol) with a flow rate of 150 µL/min and column
temperature of 40 °C. The programmed mobile phase gradient was as follows: 0-10
min, 0%-70% B; 10-15 min, 70% B; 15-20 min, 0% B. Data were analyzed using
MassHunter Quantitative Analysis software (Agilent). A standard curve was obtained
from various concentrations of the standard compounds and used for quantification.
Body composition
A direct segmental multifrequency bioelectrical impedance analyzer (InBody
S10®; InBody Japan Inc., Tokyo, Japan) was used to measure body composition.
We recorded whole-body skeletal muscle mass, segmental lean (right arm, left arm,
trunk, right leg, and right leg), fat mass, and percentage of body fat at baseline and
6- and 12-week weeks. SMI was calculated by dividing the whole-body skeletal
muscle mass by height squared (kg/m2).
Computed tomography

26
Abdominal CT was performed to assess liver and visceral fat (Aquilion
PRIME/TSX-303A/BI, Aquilion Precison/TSX-304A/2A, Aquilion ONE/TSX-101A
Vision Edition) at baseline and 12-week visit.
The ratio of the CT values of the liver and spleen (L/S ratio) was evaluated to
assess liver fat using the images on a Centricity RA1000 workstation (GE
Healthcare, Chicago, Illinois, United States). Three circular or ovoid regions of
interest (ROIs) (diameter, ~15 mm) in the liver were placed on the left lobe and
ventral and dorsal parts of the right lobe at the level of the umbilical portion of portal
vein. In contrast, two ROIs in the spleen were placed on the ventral and dorsal parts
of the spleen at the level of its maximum diameter. The apparent main vasculature,
bile duct, and calcification were avoided when ROIs were placed in each image set.
The CT values and standard deviations (i.e., image noise) were recorded after
placing ROIs on each image. CT (L/S) was calculated as the ratio of the mean CT
values of three ROIs in the liver (CT[L]) to two ROIs in the spleen (CT[S]).
Visceral fat was assessed using Fat Scan (East Japan Institute of
Technology Co., Ltd. Ibaraki, Japan). The visceral fat area was measured at the slice
at the umbilicus (Figure 3)35.

27
Assessment of exercise capacity and physical function
To evaluate physical functions, the participants were tested for gait speed,
grip strength, and 30-s chair-stand test at baseline and the 6- and 12-week visits.
Gait speed was measured twice for a 10 m walking time, as described
previously36, and the average of two measurements was used as the outcome data.
Grip strength was measured as previously described37 using a Smedley-
type digital hand dynamometer (Grip D®; Matsuyoshi & Co., Ltd., Tokyo, Japan).
Measurements were repeated twice for each hand. The highest hand grip strength
value was used for calculations.
30-s chair-stand test was performed as previously described38,39. The
number of times a participant stood up from the chair in 30 seconds was recorded.
Hearing tests
The hearing ability of both ears was measured using an audiometer
(Audiometer AA-79, RION Co., Ltd.) at baseline and the 12-week visit. In the hearing
test, only air conduction was measured, and the pure tone hearing level averages of
500, 1000 × 2, and 2000 Hz were evaluated.
28
Cognitive function test
MMSE-J and MOCA-J were performed to assess the cognitive performance
of participants at the start and after the 12-week intervention40,41.
Flow Mediated Dilation
After 10 min of rest, a blood flow-dependent vasodilatation response test
was performed using a vascular ultrasound system (UNEX EF 18VG, UNEX
Corporation) at baseline and 6- and 12-week weeks. When the cuff was used to stop
and release the blood flow from the forearm, the amount of blood vessel dilation was
measured as the percentage of vessel diameter dilatation (lrb%).
Statistical analysis

29
Statistical analysis was performed using Easy R for Microsoft Windows42 using
the data at baseline (N=21) and 6- (N=21) and 12-week (N=10) visits in the NMN or
placebo group. Outcome data are reported as mean ± standard deviation. For
comparisons between the NMN and placebo groups, each outcome data followed the
Shapiro-Wilk test as a normality test. Data that followed a normal distribution were
analyzed using an unpaired t-test. Changes in NMN and placebo groups from baseline
to Week 6 or Week 12 were compared using ANCOVA to adjust for baseline. Data that
did not follow a normal distribution were compared using the Mann-Whitney U test.
Treatment comparison was performed using mixed model analysis, in which
intercept and visit were included as random effects, and group, visit, and group-by-
visit interaction were included as fixed effects. As some endpoints could not be
calculated using mixed model analysis, all endpoints followed MMRM, in which the
fixed effects were group, visit, group-by-visit interaction. The values of the outcomes
at the baseline visit and covariance structure between visits was estimated without
restriction. The p-values denote group-by-visit interaction.
Acknowledgements

30
We thank all volunteers for participating in this study and the staff of the
Clinical Research Support Center Phase 1 Unit, The University of Tokyo Hospital for
supporting this study. We also would like to thank Editage (www.editage.com) for
English language editing.
Author contributions
M.I., M.M., Y.F., T.S., and T.S. conceived the trial; M.I., M.M., T.K., and T.Y.
designed the trial; M.I, M.M., and Y.N. conducted the clinical trial; K.Y. and T.N.
undertook targeted metabolomics and quantitation of NAD+ related metabolites;
M.S., R.S., and N.K. provided technical support regarding the measurement and
analysis of the body composition; J.S. and K.I. provided technical support regarding
the CT techniques and aided in CT data analysis; Y.N. and K.K. conducted statistical
analyses. M.I., M.M., Y.N., and T.Y. interpreted the data. M.I., M.M., and Y.N. took the
leading roles in writing the manuscript and creating the figures. All authors read and
approved of the final manuscript.
Competing interests statement
31
Yuichiro Fukamizu, Toshiya Sato, and Takanobu Sakurai are employees of
Mitsubishi Corporation Life Sciences Limited. The other authors declare no conflicts
of interest. This study was funded by Mitsubishi Corporation Life Sciences Limited,
and the firm provided NMN.

32
References
1. Niccoli, T. & Partridge, L. Ageing as a risk factor for disease. Curr Biol 22,
R741–R752 (2012).
2. Guarente, L. Calorie restriction and sirtuins revisited. Genes Dev 27, 2072–
2085 (2013).
3. Imai, S. I. & Guarente, L. NAD+ and sirtuins in aging and disease. Trends Cell
Biol 24, 464–471 (2014).
4. Yoshino, J., Baur, J. A., Imai, S. I. NAD+ intermediates: the biology and
therapeutic potential of NMN and NR. Cell Metab 27, 513–528 (2018).
5. Fang, E. F., et al. NAD+ in aging: molecular mechanisms and translational
implications. Trends Mol Med 223, 899–916 (2017).
6. Igarashi, M., et al. NAD+ supplementation rejuvenates aged gut adult stem
cells. Aging Cell 18, e12935 (2019).
7. Trammell, S. A., Yu, L., Redpath, P., Migaud, M. E., Brenner, C. J.
Nicotinamide riboside is a major NAD+ precursor vitamin in cow milk. J Nutr
146, 957–963 (2016).
8. Mills, K. F., et al. Long-term administration of nicotinamide mononucleotide
mitigates age-associated physiological decline in mice. Cell Metab 24, 795–

33
806 (2016).
9. Trammell, S. A., et al. Nicotinamide riboside is uniquely and orally
bioavailable in mice and humans. Nat Commun 7, 12948 (2016).
10. Airhart, S. E., et al. An open-label, non-randomized study of the
pharmacokinetics of the nutritional supplement nicotinamide riboside (NR)
and its effects on blood NAD+ levels in healthy volunteers. PLoS One 12,
e0186459 (2017).
11. Dellinger, R. W., et al. Repeat dose NRPT (nicotinamide riboside and
pterostilbene) increases NAD(+) levels in humans safely and sustainably: a
randomized, double-blind, placebo-controlled study. NPJ Aging Mech Dis 3,
17 (2017).
12. Martens, C. R., et al. Chronic nicotinamide riboside supplementation is well-
tolerated and elevates NAD(+) in healthy middle-aged and older adults. Nat
Commun 9, 1286 (2018).
13. Dollerup, O. L., et al. A randomized placebo-controlled clinical trial of
nicotinamide riboside in obese men: safety, insulin-sensitivity, and lipid-
mobilizing effects. Am J Clin Nutr 108, 343–353 (2018).
14. Dolopikou, C. F., et al. Acute nicotinamide riboside supplementation improves
redox homeostasis and exercise performance in old individuals: a double-

34
blind cross-over study. Eur J Nutr 59, 505–515 (2020).
15. Conze, D., Brenner, C., Kruger, C. L. Safety and metabolism of long-term
administration of NIAGEN (nicotinamide riboside chloride) in a randomized,
double-blind, placebo-controlled clinical trial of healthy overweight adults. Sci
Rep 9, 9772 (2019).
16. Elhassan, Y. S., et al. Nicotinamide riboside augments the aged human
skeletal muscle NAD+ metabolome and induces transcriptomic and anti-
inflammatory signatures. Cell Rep 28, 1717–1728 (2019).
17. Remie, C. M. E., et al. Nicotinamide riboside supplementation alters body
composition and skeletal muscle acetylcarnitine concentrations in healthy
obese humans. Am J Clin Nutr 112, 413–426 (2020).
18. Simic, P., et al. Nicotinamide riboside with pterostilbene (NRPT) increases
NAD+ in patients with acute kidney injury (AKI): a randomized, double-blind,
placebo-controlled, stepwise safety study of escalating doses of NRPT in
patients with AKI. BMC Nephrol 21, 342 (2020).
19. Dollerup, O. L., et al. Nicotinamide riboside does not alter mitochondrial
respiration, content or morphology in skeletal muscle from obese and insulin-
resistant men. J Physiol 598, 731–754 (2020).
20. Irie, J., et al. Effect of oral administration of nicotinamide mononucleotide on

35
clinical parameters and nicotinamide metabolite levels in healthy Japanese
men. Endocr J 67, 153–160 (2020).
21. Garavaglia, S., et al. The high-resolution crystal structure of periplasmic
Haemophilus influenzae NAD nucleotidase reveals a novel enzymatic function
of human CD73 related to NAD metabolism. Biochem J 441, 131–141 (2012).
22. Mallinckrodt, C. H., Clark, W. S., David, S. R. Accounting for dropout bias
using mixed-effects models. J Biopharm Stat 11, 9–21 (2001).
23. Freireich, E. J., Gehan, E. A., Rall, D. P., Schmidt, L. H., Skipper, H. E.
Quantitative comparison of toxicity of anticancer agents in mouse, rat,
hamster, dog, monkey, and man. Cancer Chemother Rep 50, 219–244
(1966).
24. Knip, M., et al. Safety of high-dose nicotinamide: a review. Diabetologia 43,
1337–1345 (2000).
25. Guyton, J. R. & Bays, H. E. Safety considerations with niacin therapy. Am J
Cardiol 99, S22–S31 (2007).
26. Shats, I., et al. Bacteria boost mammalian host NAD metabolism by engaging
the deamidated biosynthesis pathway. Cell Metab 31, 564–579 (2020).
27. Goodpaster, B. H., et al. The loss of skeletal muscle strength, mass, and
quality in older adults: the health, aging and body composition study. J
36
Gerontol A Biol Sci Med Sci 61, 1059–1064 (2006).
28. Gomes, A. P., et al. Declining NAD(+) induces a pseudohypoxic state
disrupting nuclear-mitochondrial communication during aging. Cell 155, 1624–
1638 (2013).
29. Someya, S., et al. Sirt3 mediates reduction of oxidative damage and
prevention of age-related hearing loss under caloric restriction. Cell 143, 802–
812 (2010).
30. Brown, K. D., et al. Activation of SIRT3 by the NAD+ precursor nicotinamide
riboside protects from noise-induced hearing loss. Cell Metab 20, 1059–1068
(2014).
31. Han, S., Du, Z., Liu, K., Gong, S. Nicotinamide riboside protects noise-
induced hearing loss by recovering the hair cell ribbon synapses. Neurosci
Lett 725, 134910 (2020).
32. Okur, M. N., et al. Short-term NAD(+) supplementation prevents hearing loss
in mouse models of Cockayne syndrome. NPJ Aging Mech Dis 6, 1 (2020).
33. Clement, J., Wong, M., Poljak, A., Sachdev, P., Braidy, N.
The plasma NAD(+) metabolome is dysregulated in "normal" aging.
Rejuvenation Res 22, 121–130 (2019).
34. Yaku, K., Okabe, K., Nakagawa, T. Simultaneous measurement of NAD

37
metabolome in aged mice tissue using liquid chromatography tandem-mass
spectrometry. Biomed Chromatogr 32, e4205 (2018).
35. Yasaka, K., et al. Dose-reduced CT with model-based iterative reconstruction
in evaluations of hepatic steatosis: how low can we go? Eur J Radiol 83,
1063–1068 (2014).
36. Graham, J. E., Ostir, G. V., Fisher, S. R., Ottenbacher, K. J.
Assessing walking speed in clinical research: a systematic review. J Eval Clin
Pract 14, 552–562 (2008).
37. Watanabe, T., et al. The short-
term reliability of grip strength measurement and the effects of posture
and grip span. J Hand Surg Am 30, 603–609 (2005).
38. Jones, C. J., Rikli, R. E., Beam, W. C. A 30-s chair-stand test as a measure of
lower body strength in community-residing older adults. Res Q Exerc Sport
70, 113–119 (1999).
39. Nakatani, T., Nadamoto, M., Itoh, M. Validation of a 30-sec chair-stand test for
evaluating lower extremity muscle strength in Japanese elderly
adults. Japanese Society of Physical Education 47, 451–461 (2002).
40. Folstein, M. F., Folstein, S. E., McHugh, P. R. "Mini-mental state".
A practical method for grading the cognitive state of patients for the clinician. J

38
Psychiatr Res 12, 189–198 (1975).
41. Nasreddine, Z. S., et al. The Montreal Cognitive Assessment (MoCA): a brief
screening tool for mild cognitive impairment. J Am Geriatr Soc 53, 695–699
(2005).
42. Kanda Y. Investigation of the freely available easy-to-use software ‘EZR’ for
medical statistics. Bone Marrow Transplant 48, 452–458 (2013).
39
Figure legends
Figure 1
Clinical trial diagrams
Clinical trial flow chart illustrating the procedures for the selection of study
participants and data analyses. A total of 65 potential participants were screened,
and 42 eligible participants were selected and randomized in a 1:1 ratio into the two
groups. Clinical examinations were performed at the 0-, 6-, and 12-week visits.
Twenty-two participants deviated from the protocol after the 6-week visit, and 20
participants completed the 12-week study.
Figure 2
Chronic oral NMN administration increases whole blood NAD+ and related
metabolite levels.
(A-G) Changes in whole blood NAD+ and NAD+ metabolite levels; NMN (A), NAD+
(B), NR (C), NAMN (D), NAR (E), NA (F), and NAM (G) after 12 weeks of placebo

40
(n=10) or NMN (n=10) supplementation.
a. Inter-group comparisons were made using an unpaired t-test.
b. Inter-group comparisons were made using Mann-Whitney U test.
*P<0.05; **P<0.01; ***P<0.001
Figure 3
NMN supplementation does not affect metabolic parameters.
(A) A representative single CT slice of the navel level of an NMN or placebo group
participant at the 0- or 12-visit to calculate the area of visceral fat; the red region is
visceral fat and the blue region is subcutaneous fat. (B) The effect of NMN on CT L/S
ratio, visceral fat area calculated from CT slices, and fat mass (lrb%) measured using
the BIA method. (C) The effect of NMN on HbA1c, FBG, HOMA-β, HOMA-IR,
glucose AUC, insulin AUC, and C-peptide AUC. The AUC was calculated from the
result of 75 g OGTT.
a. Treatment was compared using a mixed model analysis. The p-value denotes the
interaction.
41
b. Treatment was compared using MMRM. The p-value denotes interaction.
c. Inter-group comparisons were made using an unpaired t-test (no adjustment for
baseline).
d. Inter-group comparisons were made using the Mann-Whitney U test (no
adjustment for baseline).
e. Inter-group comparisons were made using ANCOVA for adjusting the baseline.
*P<0.05; **P<0.01; ***P<0.001
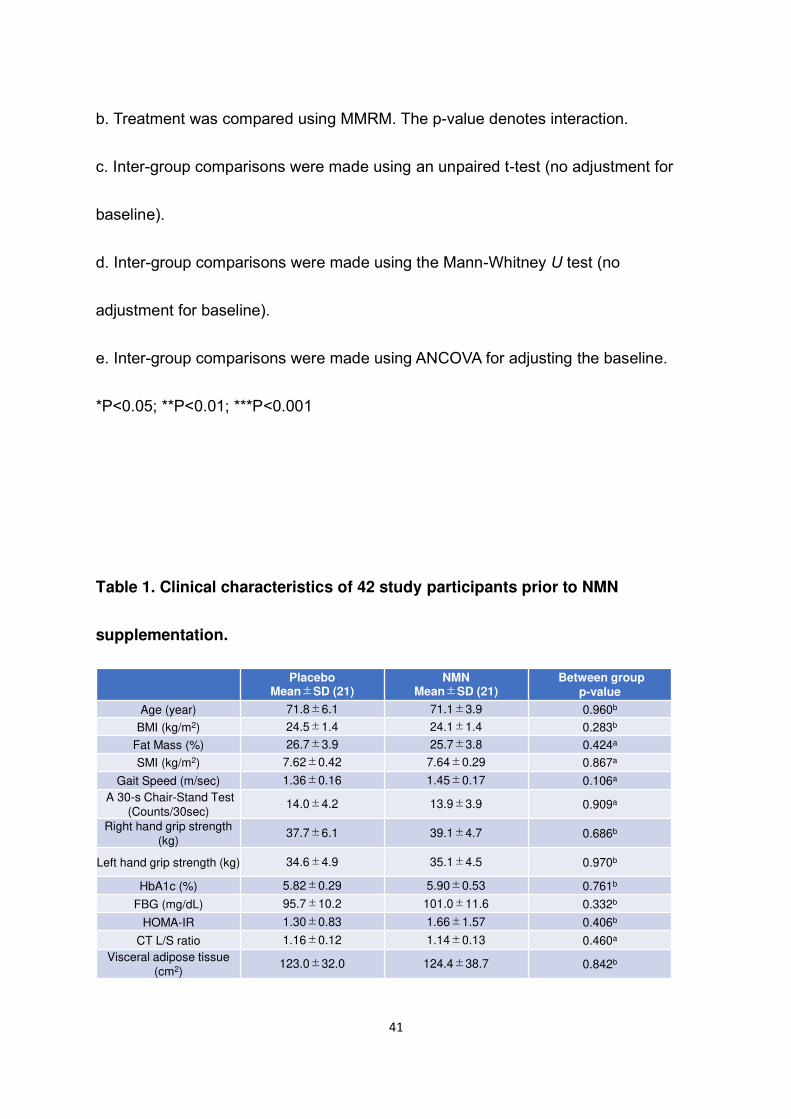
Table 1. Clinical characteristics of 42 study participants prior to NMN
supplementation.
PlaceboMean±SD (21)
NMNMean±SD (21)
Between groupp-value
Age (year) 71.8±6.1 71.1±3.9 0.960b
BMI (kg/m2) 24.5±1.4 24.1±1.4 0.283b
Fat Mass (%) 26.7±3.9 25.7±3.8 0.424a
SMI (kg/m2) 7.62±0.42 7.64±0.29 0.867a
Gait Speed (m/sec) 1.36±0.16 1.45±0.17 0.106a
A 30-s Chair-Stand Test
(Counts/30sec) 14.0±4.2 13.9±3.9 0.909a
Right hand grip strength
(kg)37.7±6.1 39.1±4.7 0.686b
Left hand grip strength (kg) 34.6±4.9 35.1±4.5 0.970b
HbA1c (%) 5.82±0.29 5.90±0.53 0.761b
FBG (mg/dL) 95.7±10.2 101.0±11.6 0.332b
HOMA-IR 1.30±0.83 1.66±1.57 0.406b
CT L/S ratio 1.16±0.12 1.14±0.13 0.460a
Visceral adipose tissue
(cm2)123.0±32.0 124.4±38.7 0.842b
42
a. Inter-group comparisons were made using an unpaired t-test.
b. Inter-group comparisons were made using Mann-Whitney U test.
Table 2. Effect of NMN on muscle mass.
a. Treatment was compared using a mixed model analysis. The p-value denotes
PlaceboMean±SD (n)
NMNMean±SD (n)
Between group
p-value
PlaceboMean±SD (n)
NMNMean±SD (n)
Between groupp-value
SMI (kg/m2) p=0.979a, p=0.874b Segmental Lean/Trunk (kg) p=0.094a, p=0.605b
Baseline 7.62±0.42 (21) 7.64±0.29 (21) 0.867c Baseline 21.2±1.97 (21) 22.2±1.51 (21) 0.076c
Week 6 7.69±0. 40 (21) 7.64±0.32 (21) 0.703c Week 6 21.2±1.94 (21) 21.9±1.47 (21) 0.113d
Week 12 7.64±0.52 (10) 7.52±0.43 (10) 0.582c Week 12 21.1±2.25 (10) 21.9±1.89 (10) 0.412c
Change from
Baseline to
Week 6
0.06±0.15 (21) 0.0±0.13 (21) 0.167e
Change from
Baseline to
Week 6
-0.1±0.53 (21) -0.3±0.41 (21) 0.328e
Change from
Baseline to
Week 12
-0.15±0.22 (10) -0.13±0.21 (10) 0.805e
Change from
Baseline to
Week 12
-0.2±0.37 (10) -0.3±0.51 (10) 0.706e
Segmental Lean/Right Arm (kg) p=0.374b Segmental Lean/Right Leg (kg) p=0.268a, p=0.702b
Baseline 2.54±0.32 (21) 2.68±0.24 (21) 0.120c Baseline 7.92±0.81 (21) 8.16±0.58 (21) 0.274c
Week 6 2.53±0.30 (21) 2.62±0.23 (21) 0.345d Week 6 8.05±0.81 (21) 8.27±0.57 (21) 0.332c
Week 12 2.49±0.35 (10) 2.60±0.28 (10) 0.443c Week 12 7.91±0.94 (10) 8.15±0.70 (10) 1.000d
Change from
Baseline to
Week 6
-0.01±0.10 (21) -0.05±0.08 (21) 0.283e
Change from
Baseline to
Week 6
0.14±0.23 (21) 0.11±0.19 (21) 0.804e
Change from
Baseline to
Week 12
-0.05±0.08 (10) -0.07±0.09 (10) 0.667e
Change from
Baseline to
Week 12
-0.19±0.36 (10) -0.05±0.31 (10) 0.367e
Segmental Lean/Left Arm (kg) p=0.761b Segmental Lean/Left Leg (kg) p=0.251a, p=0.891b
Baseline 2.51±0.33 (21) 2.67±0.25 (21) 0.081c. Baseline 7.78±0.82 (21) 8.02±0.50 (21) 0.264c
Week 6 2.49±0.32 (21) 2.61±0.24 (21) 0.183c Week 6 7.84±0.77 (21) 8.07±0.53 (21) 0.256c
Week 12 2.50±0.39 (10) 2.60±0.33 (10) 0.538c Week 12 7.89±1.03 (10) 7.92±0.60 (10) 0.923c
Change from
Baseline to
Week 6
-0.01±0.11 (21) 0.06±0.09 (21) 0.351e
Change from
Baseline to
Week 6
0.06±0.23 (21) 0.06±0.17 (21) 0.818e
Change from
Baseline to
Week 12
-0.04±0.06 (10) -0.06±0.11 (10) 0.695e
Change from
Baseline to
Week 12
-0.13±0.33 (10) -0.13±0.24 (10) 0.979e
43
interaction.
b. Treatment was compared using MMRM. The p-value denotes interaction.
c. Inter-group comparisons were made using an unpaired t-test (no adjustment for
baseline).
d. Inter-group comparisons were made using the Mann-Whitney U test (no
adjustment for baseline).
e. Inter-group comparisons were made using ANCOVA for adjusting the baseline.
Table 3. NMN improves muscle strength and performance.
PlaceboMean±SD (n)
NMNMean±SD (n)
between group
p-value
PlaceboMean±SD (n)
NMNMean±SD (n)
between group
p-value
Gait Speed (m/sec) p=0.033a*, p=0.015b* Right Grip Strength (kg) p=0.242a, p=0.194b
Baseline 1.36±0.16 (21) 1.45±0.17 (21) 0.106c Baseline 37.7±6.07 (21) 39.1±4.67 (21) 0.686d
Week 6 1.34±0.18 (21) 1.47±0.16 (21) 0.023c* Week 6 39.2±5.33 (21) 40.6 ±4.01 (21) 0.348c
Week 12 1.30±0.22 (10) 1.60±0.13 (10) 0.002c** Week 12 37.3±5.91 (10) 41.9±5.59 (10) 0.090c
Change from
Baseline to
Week 6
-0.02±0.13 (21) 0.02±0.09 (21) 0.111e
Change from
Baseline to
Week 6
1.6±3.38 (21) 1.5±4.01 (21) 0.669e
Change from
Baseline to
Week 12
-0.01±0.10 (10) 0.09±0.13 (10) 0.066c
Change from
Baseline to
Week 12
1.3±3.16 (10) 1.8±4.24 (10) 0.479e
A 30-s Chair-Stand Test (Counts/30sec) p=0.509a, p=0.309b Left Grip Strength (kg) p=0.019b*
Baseline 14.0±4.19 (21) 13.9±3.85 (21) 0.909c Baseline 34.6±4.88 (21) 35.1±4.48 (21) 0.970d
Week 6 13.6±4.44 (21) 15.1±4.22 (21) 0.261c Week 6 34.7±4.98 (21) 36.6±5.38 (21) 0.207d
Week 12 14.0±5.23 (10) 16.3±3.59 (10) 0.267c Week 12 34.1±4.63 (10) 37.4±5.80 (10) 0.177c
Change from
Baseline to
Week 6
-0.5±2.64 (21) 1.2±2.11 (21) 0.031e*
Change from
Baseline to
Week 6
0.095±3.42 (21) 1.5±4.25 (21) 0.204e
Change from
Baseline to
Week 12
0.5±3.66 (10) 1.5±1.65 (10) 0.311e
Change from
Baseline to
Week 12
-0.80±2.70 (10) 1.3±2.71 (10) 0.081e
44
a. Treatment was compared using a mixed model analysis. The p-value denotes
interaction.
b. Treatment was compared using MMRM. The p-value denotes interaction.
c. Inter-group comparisons were made using an unpaired t-test (no adjustment for
baseline).
d. Inter-group comparisons were made using the Mann–Whitney U test (no
adjustment for baseline).
e. Inter-group comparisons were made using ANCOVA for adjusting for baseline.
*P<0.05; **P<0.01; ***P<0.001
Supplementary Table 1. Clinical characteristics of 20 study participants
completing the 12-week study prior to NMN supplementation, Related to Table
1.
a. Inter-group comparisons were made using an unpaired t-test.
b. Inter-group comparisons were made using Mann–Whitney U test.
*P<0.05
Supplementary Table 2. The effect of NMN on clinical laboratory data

45
(hematology and CRP).
a. Inter-group comparisons were made using an unpaired t-test.
b. Inter-group comparisons were made using the Mann–Whitney U test.
c. Inter-group comparisons were made using ANCOVA for adjusting the baseline.
*P<0.05
Supplementary Table 3. The effect of NMN on clinical laboratory data
(hematology and CRP) (blood chemistry).
a. Inter-group comparisons were made using an unpaired t-test.
b. Inter-group comparisons were made using Mann–Whitney U test.
c. Inter-group comparisons were made using ANCOVA for adjusting the baseline.
*P<0.05
Supplementary Table 4. NMN supplementation does not affect metabolic
parameters. Related to Figure 3.
a. Inter-group comparisons were made using an unpaired t-test.

46
b. Inter-group comparisons were made using the Mann–Whitney U test.
c. Inter-group comparisons were made using ANCOVA for adjusting the baseline.
*P<0.05
Supplementary Table 5. The effect of NMN on auditory and cognitive functions.
a. Treatment was compared using a mixed model analysis. The p-value denotes
interaction.
b. Treatment was compared using MMRM. The p-value denotes interaction.
c. Inter-group comparisons were made using an unpaired t-test (no adjustment for
baseline).
d. Inter-group comparisons were made using the Mann–Whitney U test (no
adjustment for baseline).
e. Inter-group comparisons were made using ANCOVA for adjusting the baseline.
*P<0.05
Supplementary Table 6. The effect of NMN on vascular function.
a. Treatment was compared using a mixed model analysis. The p-value denotes

47
interaction.
b. Treatment was compared using MMRM. p-value denotes interaction.
c. Inter-group comparisons were made using an unpaired t-test (no adjustment for
baseline).
d. Inter-group comparisons were made using the Mann–Whitney U test (no
adjustment for baseline).
e. Inter-group comparisons were made using ANCOVA for adjusting the baseline.

Figure 1
Figure 1 Clinical trial diagrams
Clinical trial flow chart illustrating the procedures for the selection of study participants and
data analyses. A total of 65 potential participants were screened, and 42 eligible participants
were selected and randomized in a 1:1 ratio into the two groups. Clinical examinations were
performed at the 0-, 6-, and 12-week visits. Twenty-two participants deviated from the
protocol after the 6-week visit, and 20 participants completed the 12-week study.
Assessed for eligibility (n=65)
Randomized (n=42)
Excluded (n=23)● Did not meet inclusion criteria (n=0)● Met exclusion criteria (n=11)● Withdrew consent (n=2)● Enrollment complete (n=10)
Allocated to NMN 250 mg/day (n=21) Allocated to Placebo (n=21)
Baseline
Dropout (n=0) Dropout (n=0)
Week 6
Week 12
Dropout (n=0)Deviation from the protocol (n=11)
Dropout (n=0)Deviation from the protocol (n=11)
Completing the study (n=20)

Placebo NMN
-0.02
0.00
0.02
0.04
0.06
0.08Δ
NM
N(μ
mol
)
Placebo
-0.006
-0.004
-0.002
0.000
0.002
0.004
0.006
ΔN
A (μ
mol
)
p=0.393b
Placebo NMN
0.4
0.6
0.8
1.0
1.2
ΔN
AD+
(μm
ol)
p=0.0000108b***
Placebo NMN
-8
-7
-6
-5
-4
-3
-2
ΔN
AM (μ
mol
)
p=0.249a
Placebo NMN
0
1
2
3
4
5
ΔN
AMN
(μm
ol)
p=0.000725b***
p=0.0232b*
Placebo NMN
0.000
0.002
0.004
0.006
0.008
0.010
0.012
ΔN
AR (μ
mol
)
p=0.000325b***
Placebo NMN
0.00
0.01
0.02
0.03
0.04
ΔN
R (μ
mol
) p=0.0117a*
A B
C D
E F
G
NMN
Figure 2
Figure 2 Chronic oral NMN administration increases whole blood NAD+ and related metabolite levels.(A-G) Changes in whole blood NAD+ and NAD+ metabolite levels; NMN (A), NAD+ (B), NR (C), NAMN (D), NAR (E), NA (F), and NAM (G) after 12 weeks of placebo (n=10) or NMN (n=10) supplementation.a. Inter-group comparisons were made using an unpaired t-test.b. Inter-group comparisons were made using Mann-Whitney U test.*P<0.05; **P<0.01; ***P<0.001

Figure 3
NMN 250mg/day 0 week NMN 250mg/day 12 weeksB
Placebo 0 week Placebo 12 weeks
PlaceboMean±SD (n)
NMNMean±SD (n)
Between groups
p-value
CT L/S ratio
Baseline 1.16±0.12 (21) 1.13±0.13 (21) 0.430c
Week 12 1.18±0.08 (10) 1.17±0.15 (10) 0.631d
Change fromBaseline to Week 12
0.03±0.05 (10) 0.02±0.04 (10) 0.651c
Visceral fat by CT (m2)
Baseline 123.0±32.0 (21) 124.4±38.7 (21) 0.842d
Week 12 126.3±36.7 (10) 120.1±46.4 (10) 0.744c
Change fromBaseline to Week 12
0.0±11.6 (10) -9.2±19.7 (10) 0.234e
Fat Mass by InBody (%) p= 0.442a, p=0.700b
Baseline 26.7±3.9 (21) 25.7±3.8 (21) 0.424c
Week 6 26.7±4.1 (21) 26.0±3.5 (21) 0.543c
Week 12 26.5±4.8 (10) 24.9±2.5 (10) 0.342c
Change fromBaseline to Week 6
0.0±1.8 (21) 0.3±1.2 (21) 0.750e
Change fromBaseline to Week 12
-0.2±1.3 (10) -0.2±2.4 (10) 0.991c
PlaceboMean±SD (n)
NMNMean±SD (n)
Between groupp-value
PlaceboMean±SD (n)
NMNMean±SD (n)
Between groupp-value
HbA1c (%) FBG (mg/dL)
Baseline 5.82±0.29 (21) 5.90±0.53 (21) 0.761d Baseline 95.7±10.2 (21) 101.0±11.6 (21) 0.332d
Week 12 5.69±0.30 (10) 5.88±0.56 (10) 0.647d Week 12 97.2±8.95 (10) 101.4±11.1 (10) 0.365c
Change fromBaseline to Week 12
-0.05±0.09 (10) 0.03±0.13 (10) 0.0861e Change fromBaseline to Week 12
2.8±7.5 (10) 2.4±7.3 (10) 0.921e
HOMA-β HOMA-IR
Baseline 46.9±17.7 (21) 45.7±16.9 (21) 0.821d Baseline 1.32±0.83 (21) 1.67±1.57 (21) 0.481d
Week 12 45.1±16.8 (10) 43.1±16.1 (10) 0.791c Week 12 1.11±0.32 (10) 1.26±0.49 (10) 0.448c
Change fromBaseline to Week 12
-0.6±15.7 (10) 1.3±16.0 (10) 0.992e Change fromBaseline to Week 12
0.03±0.43 (10) -0.09±0.55 (10) 0.812e
Glucose AUC Insulin AUC
Baseline 19362.1±2467.4 (21) 20804.3±5426.4 (21) 0.633d Baseline 4889.3±1941.3 (21) 4761.4±1875.8 (21) 0.829d
Week 12 18706.5±2279.3 (10) 19299.0±4790.6 (10) 0.728c Week 12 5508.0±2639.8 (10) 4389.0±1582.7 (10) 0.326d
Change fromBaseline to Week 12
687.0±1989.7 (10) -859.5±2092.9 (10) 0.201e Change fromBaseline to Week 12
1057.5±2215.9 (10) -94.5±845.4 (10) 0.142e
C-peptide AUC
Baseline 704.9±140.1 (21) 694.7±180.0 (21) 0.840c
Week 12 772.2±170.2 (10) 694.2±153.5 (10) 0.296c
Change fromBaseline to Week 12
117.6±199.9 (10) 41.9±88.2 (10) 0.244e
C
Figure 3 NMN supplementation does not affect metabolic parameters.
(A) A representative single CT slice of the navel level of an NMN or placebo group participant at the 0- or 12-visit to
calculate the area of visceral fat; the red region is visceral fat and the blue region is subcutaneous fat. (B) The
effect of NMN on CT L/S ratio, visceral fat area calculated from CT slices, and fat mass (lrb%) measured using the
BIA method. (C) The effect of NMN on HbA1c, FBG, HOMA-β, HOMA-IR, glucose AUC, insulin AUC, and C-peptide
AUC. The AUC was calculated from the result of 75 g OGTT.
a. Treatment was compared using a mixed model analysis. The p-value denotes the interaction.
b. Treatment was compared using MMRM. The p-value denotes interaction.
c. Inter-group comparisons were made using an unpaired t-test (no adjustment for baseline).
d. Inter-group comparisons were made using the Mann-Whitney U test (no adjustment for baseline).
e. Inter-group comparisons were made using ANCOVA for adjusting the baseline.
*P<0.05; **P<0.01; ***P<0.001
A
C

Supplementary Files
This is a list of supplementary �les associated with this preprint. Click to download.
SupplementalFigure3.pdf
ResearchProtcolEnglishversion16208848682.pdf