validation of adult omni perceived exertion …d-scholarship.pitt.edu/7509/1/rjmays_etd2009.pdf ·...
TRANSCRIPT

VALIDATION OF ADULT OMNI PERCEIVED EXERTION SCALES FOR ELLIPTICAL ERGOMETRY
by
Ryan J. Mays
BS Exercise Science, University of Tennessee at Chattanooga, 2004
MS Health and Human Performance, University of Tennessee at Chattanooga, 2006
Submitted to the Graduate Faculty of
School of Education in partial fulfillment
of the requirements for the degree of
Doctor of Philosophy
i
University of Pittsburgh
2009

UNIVERSITY OF PITTSBURGH
HEALTH AND PHYSICAL ACTIVITY
This dissertation was presented
by
Ryan J. Mays
It was defended on
April 16th, 2009
and approved by
Fredric L. Goss, Associate Professor, Health and Physical Activity
Robert J. Robertson, Professor, Health and Physical Activity
Elizabeth F. Nagle-Stilley, Assistant Professor, Health and Physical Activity
Kevin H. Kim, Assistant Professor, Psychology in Education
Mark A. Schafer, Assistant Professor, Physical Education and Recreation
Dissertation Director: Fredric L. Goss, Associate Professor, Health and Physical Activity
ii

Copyright © by Ryan J. Mays
2009
iii
Validation of Adult OMNI Perceived Exertion Scales for Elliptical Ergometry
Ryan J. Mays, PhD
University of Pittsburgh, 2009
iv
PURPOSE: The purpose of this project was to examine concurrent and construct validity of two
newly developed Adult OMNI Elliptical Ergometry ratings of perceived exertion (RPE) Scales.
METHODS: Fifty-nine sedentary to recreationally active, college-aged volunteers (males, n =
30; age = 21.3 + 3.3 yrs and females, n = 29; 22.3 + 3.5 yrs) participated in this study. A single
observation, cross-sectional perceptual estimation trial was employed with subjects exercising to
volitional fatigue on an elliptical ergometer. Oxygen consumption (VO2), heart rate (HR) and
RPE-Overall Body (O), Legs (L) and Chest/Breathing (C) were recorded each stage from the
Borg 15 Category Scale and two different OMNI RPE scale formats. One scale maintained the
original format of the OMNI Picture System of Perceived Exertion. The second scale modified
verbal, numerical and pictorial descriptors at the low end of the response range. Concurrent
validity was established by correlating RPE-O, L and C from each scale with VO2 and HR
obtained from each test stage during the estimation trial. Construct validity was established by
correlating RPE-O, L and C from the Adult OMNI Elliptical Ergometry Scales with RPE-O, L
and C from the Borg Scale. RESULTS: Correlation analyses indicated the relation between
RPE-O, L and C from each OMNI RPE Scale distributed as a positive linear function of both
VO2 (males, r = .941 - .951 and females, r = .930 - .946) and HR (males, r = .950 - .960 and
females, r = .963 - .966). A strong, positive relation was also exhibited between differentiated
and undifferentiated RPE from the Adult OMNI Elliptical Ergometry Scales and the Borg 15

v
Category Scale (males, r = .961 - .972 and females, r = .973 - .977). CONCLUSION:
Concurrent and construct validity were established for both formats of the Adult OMNI Elliptical
Ergometry Scale during partial weight bearing exercise. Either scale can be used to estimate
RPE during elliptical ergometer exercise in health-fitness settings. However, because of the
potential use of RPE in caloric expenditure indices and prediction models, the modified scale
depicting the “rest” pictorial may be more practical.
Keywords: concurrent and construct validity, RPE

vi
Table of Contents PREFACE ..................................................................................................................................... xi
1.0 INTRODUCTION AND RATIONALE ..................................................................... 1
1.1 INTRODUCTION ............................................................................................... 1
1.2 RATIONALE ....................................................................................................... 7
1.3 RESEARCH AIMS .............................................................................................. 8
1.4 RESEARCH OBJECTIVES ............................................................................... 9
2.0 LITERATURE REVIEW .......................................................................................... 10
2.1 DEVELOPMENT OF PERCEIVED EXERTION SCALING ..................... 10
2.1.1 Psychophysics and ratio scaling ................................................................. 10
2.1.2 Category scaling .......................................................................................... 11
2.1.3 Effort Continua ........................................................................................... 13
2.1.4 Range Model ................................................................................................ 14
2.1.5 Physiological mediators .............................................................................. 15
2.1.6 Undifferentiated and differentiated RPE ................................................. 16
2.2 PERCEIVED EXERTION SCALES ............................................................... 18
2.2.1 Children’s scales of perceived exertion ..................................................... 18
2.2.2 Children OMNI scales of perceived exertion ........................................... 28
2.2.3 Adult OMNI scales of perceived exertion ................................................. 36
2.3 ELLIPTICAL ERGOMETRY ......................................................................... 41
2.4 PERCEIVED EXERTION AND ELLIPTICAL ERGOMETRY ................ 43
2.5 CONCLUSIONS ................................................................................................ 45
3.0 METHODS ................................................................................................................. 46
3.1 SUBJECTS ......................................................................................................... 46
3.2 RECRUITMENT PROCEDURES .................................................................. 47
3.3 EXPERIMENTAL DESIGN ............................................................................ 48
3.3.1 Pre-test instructions .................................................................................... 48

vii
3.3.2 Pre-test assessments .................................................................................... 48
3.3.3 Estimation trial ............................................................................................ 48
3.3.4 OMNI RPE .................................................................................................. 51
3.4 STATISTICAL ANALYSES ............................................................................ 54
4.0 RESULTS ................................................................................................................... 56
4.1 SUBJECTS ......................................................................................................... 56
4.2 CONCURRENT VALIDITY ............................................................................ 57
4.3 CONSTRUCT VALIDITY ............................................................................... 59
4.4 FREQUENCY DATA ........................................................................................ 61
5.0 DISCUSSION ............................................................................................................. 63
5.1 CONCURRENT AND CONSTRUCT VALIDITY ........................................ 63
5.2 ORIGINAL FORMAT VS. MODIFIED FORMAT ...................................... 66
5.3 FUTURE RESEARCH ...................................................................................... 69
5.4 CONCLUSIONS ................................................................................................ 73
APPENDIX A. VERBAL CONSENT FORM .......................................................................... 75
APPENDIX B. EXPLANATION OF STUDY AND PHONE INTERVIEW ........................ 76
APPENDIX C. INFORMED CONSENT ................................................................................. 78
APPENDIX D. PHYSICAL ACTIVITY READINESS QUESTIONNAIRE ....................... 88
APPENDIX E. MEDICAL HISTORY QUESTIONNAIRE .................................................. 89
APPENDIX F. GODIN LEISURE-TIME EXERCISE QUESTIONNAIRE ........................ 90
APPENDIX G. BAECKE PHYSICAL ACTIVITY QUESTIONNAIRE ............................. 91
APPENDIX H. BORG 15 CATEGORY SCALE ORIENTATION ....................................... 92
APPENDIX I. ORIGINAL FORMAT OMNI RPE SCALE ORIENTATION .................... 94
APPENDIX J. MODIFIED FORMAT OMNI RPE SCALE ORIENTATION .................... 95
APPENDIX K. ELLIPTICAL ERGOMETER GXT INSTRUCTIONS .............................. 96
BIBLIOGRAPHY ....................................................................................................................... 97

viii
LIST OF TABLES
Table 1. Physiological mediators of perceived exertion ......................................................... 16
Table 2. EE estimation protocol - Male .................................................................................... 49
Table 3. EE estimation protocol - Female ................................................................................ 49
Table 4. Subject characteristics ................................................................................................ 57
Table 5. Relation between physiological variables and OMNI RPE ..................................... 59
Table 6. Relation between Borg RPE and OMNI RPE .......................................................... 60
ix
LIST OF FIGURES
Figure 1. Effort Continua Model of perceived exertion ......................................................... 14
Figure 2. Borg’s Range Model for category scales of perceived exertion ............................. 15
Figure 3. Borg Scale with stick figures .................................................................................... 19
Figure 4. Children’s Effort Rating Table (CERT) ................................................................. 20
Figure 5. Rating of Perceived Exertion adapted for Children............................................... 21
Figure 6. Cart and Effort Load Rating Scale (CALER) ........................................................ 23
Figure 7. Bug and Bag Effort (BABE) Scale ........................................................................... 24
Figure 8. Pictorial Children’s Effort Rating Table (PCERT) ............................................... 26
Figure 9. Curvilinear perceived exertion scale ........................................................................ 28
Figure 10. Children’s OMNI Cycle Scale ................................................................................ 29
Figure 11. Children’s OMNI Walk/Run Scale ........................................................................ 31
Figure 12. Children’s OMNI Resistance Exercise Scale ........................................................ 34
Figure 13. Children’s OMNI Step Scale: Male pictorials ..................................................... 35
Figure 14. Children’s OMNI Step Scale: Female pictorials ................................................. 35
Figure 15. Adult OMNI Resistance Exercise Scale ................................................................. 38
Figure 16. Adult OMNI Cycle Scale ......................................................................................... 39
Figure 17. Adult OMNI Walk/Run Scale ................................................................................ 41
Figure 18. Borg 15 Category Scale ........................................................................................... 52
Figure 19. Original format - Adult OMNI RPE Elliptical Ergometry Scale ....................... 53
x
Figure 20. Modified format - Adult OMNI RPE Elliptical Ergometry Scale ...................... 53
Figure 21. Testing Session Model ............................................................................................. 54
Figure 22. Frequency distribution of low perceptual responses - Male ................................ 61
Figure 23. Frequency distribution of low perceptual responses - Female ............................ 62
xi
PREFACE I would like to first thank the following members of my dissertation committee:
• Dr. Goss – Thank you for your time and effort in this project as well as the past several years. Your guidance has been instrumental in my development as a student and professional.
• Dr. Robertson, Dr. Nagle-Stilly, Dr. Kim and Dr. Schafer – Your help and support in this project have been invaluable. Thank you for your advice and guidance through this process.
DEDICATION
I dedicate this dissertation to my family. Each of you has supported me the past several years in your own unique way:
• Jen and Becca – No matter what direction I go or how far away life takes me, I will always be your bratty brother. I hope I make you proud.
• Mom – Your kind hearted nature and uplifting spirit have never left my side. You have been my guiding light. I hope my success keeps your smile shining down upon me from heaven always.
• Dad – I wouldn’t be where I am today without you. I have worked diligently to keep my eye on the prize. My success in this project would not have been possible without your advice and support.

1
1.0 INTRODUCTION AND RATIONALE
1.1 INTRODUCTION Regular physical activity has long been regarded as an important component of a healthy
lifestyle. Exercise in various modes and settings has been shown to be inversely related to
mortality, primarily due to a reduction in death from cardiovascular or respiratory causes
(Paffenbarger et al., 1986). Despite this evidence and the public's apparent acceptance of the
importance of physical activity, millions of Americans remain essentially sedentary
(Paffenbarger et al., 1986). Individualized prescription of optimal exercise intensities is
important for health enhancement and reduction in morbidity and mortality. The prescription of
exercise intensity assumes that a predetermined level of total body oxygen uptake (VO2) is
achieved during the stimulus portion of each training session, producing a physiological overload
that improves aerobic fitness (Robertson, 2001b). If an individual exercises below the minimal
threshold intensity, the stimulus necessary for significant cardiorespiratory, health, and fitness
benefits may not be achieved. Performing aerobic exercise at intensities greater than the
prescribed intensity may increase the risk of injury, complicate medical conditions and may
adversely affect exercise adherence.
Ratings of perceived exertion (RPE) are commonly used as part of an individualized
exercise prescription to define the cardiorespiratory training zone and to regulate exercise
2
intensity (Noble & Robertson, 1996). RPE is defined as the subjective intensity of effort, strain,
discomfort and/or fatigue that is experienced during physical exercise (Noble & Robertson,
1996). RPE can be assessed with category scales that provide a perceptual measure of exercise
intensity. RPE have a wide application for regulating exercise intensity, as the use of exertional
perceptions may lessen the reliance on heart rate (HR) palpation which often is difficult for many
individuals and eliminates the need to purchase costly HR monitors. The standard deviation
(SD) associated with age-predicted maximal HR (HRmax) is 11 beats·min-1 of true HRmax
(Londeree & Moeschberger, 1982). Therefore, exercise prescriptions that are based on age-
predicted HRmax may fall outside of the optimal training intensities, lessening the effectiveness of
the intervention. In addition, HR can be influenced by caffeine, ambient temperature and
medications (e.g., beta-blockers). RPE may be independent of these factors.
The original RPE scale was developed by Gunnar Borg in the 1950’s (Borg, 1961). This
seminal exertional metric consisted of a 21 point rating scale with numerical and verbal
categories. While validity of the scale was questioned due to its non-linearity with HR, it was
the focus of his first published article examining RPE. The RPE scale developed by Borg in the
1970’s, the Borg 15 Category RPE Scale, also consists of numerical and verbal categories and
has been widely used in both normal and special population cohorts (Borg, 1971). This scale
was developed to solve the problem of non-linearity between RPE and both HR and power
output (Noble & Robertson, 1996). However, this perceptual scaling metric includes only
numbers (i.e., 6-20) and verbal descriptors (i.e., no exertion at all to maximal exertion) and
therefore lends itself to cognitive limitations in rating exertion. Thus, Borg’s original RPE scales
have been modified during the past 5 decades, and new scales have been developed using the
same scaling principles and range model originally proposed by Borg.

3
The OMNI RPE Scale is a recent development in the perceived exertion knowledge base.
The original OMNI scale was developed for use in children of mixed gender and race (Robertson
et al., 2000). This investigation demonstrated the Children’s OMNI RPE scale to be a valid
metric for assessing perceptions of exertion during cycle ergometer exercise in children while
improving upon the methodological and semantic limitations of previous RPE scales (Robertson
et al., 2000). OMNI RPE scales enable subjects to fine tune their ability to self-regulate exercise
intensity, as it has numerical, verbal and exercise specific pictorial descriptors. Numbers on the
OMNI scale range from 0-10; this numerical range is commonly used to evaluate aspects of our
daily lives, making the scale easy to understand and use (Robertson et al., 2004). The
“exertional meaning” of each pictorial descriptor is consonant with its corresponding verbal
descriptor (Robertson et al., 2000). Additionally, the term OMNI is short for omnibus which
suggests applicability to a wide range of clients and physical activity settings (Robertson, 2004).
Therefore, a strong point of the OMNI scale is its ability to assess exertional perceptions of
various population cohorts engaged in dynamic exercise modes including walking/running,
stepping, cycling and resistance exercise with interchanging pictorial formats for the specific
exercise mode (Lagally & Robertson, 2006; Robertson et al., 2005b; Robertson et al., 2004;
Robertson et al., 2003; Utter et al., 2006; Utter et al., 2004; Utter et al., 2002). There are few
studies that show evidence of cross-modal application of OMNI RPE Scales (Pfeiffer et al.,
2002; Robertson et al., 2005b) thus providing the rationale for the development of OMNI scales
that differ in the pictorial descriptors corresponding to the appropriate exercise mode.
In recent years, the elliptical ergometer (EE) has become a popular exercise mode in
health-fitness settings. Usage rates of the EE have increased 429.5% from 1998-2007, with over
7 million individuals utilizing elliptical ergometry for physical activity purposes (ASD, 2007).

4
Additionally, it is estimated that individuals age 18-34 yrs comprise 42% of the total usage
(ASD, 2007). The EE is a weight bearing modality that does not place as great a stress on joints
and muscles as other weight bearing modes. Lu and colleagues (2007) demonstrated that the EE
resulted in lower ground reaction forces compared to treadmill (TM) walking and running. Due
to the lower stress placed on the body, the EE may provide a safe alternative to the TM in
individuals with orthopedic limitations. Several studies have shown that the EE is an effective
modality for assessing functional aerobic capacity in clinical and health-fitness settings (Cook et
al., 2004; Crommett et al., 1999; Egana & Donne, 2004).
An important application of the OMNI Perceived Exertion Scale is to use the perceptual
responses to monitor the progression of graded exercise tests (GXT) in clinical and health-fitness
settings (Utter et al., 2004). In this context, subjects estimate the level of exertion experienced at
discrete intervals throughout a GXT. RPE is a valuable adjunct to such physiological measures
as HR and VO2 in guiding the progression of a GXT; the increment in RPE from one test stage to
the next can be used to estimate the rate of progress toward the test end point (Noble &
Robertson, 1996). Due to interindividual variability, peak physiological and clinical responses
are not always sufficiently sensitive criteria to use in terminating a GXT. However, terminal
RPE can be used to aid in establishing an end point of exercise (Noble & Robertson, 1996). This
application of RPE estimated during progressively incremented exercise tests aids technicians in
preparing for test termination. This important feature of RPE scaling complements objective
physiological measures and is a valuable marker for a safe exercise session termination.
However, for this feature of RPE scaling to be used, valid and reliable scaling metrics must be
developed.
5
For a newly developed RPE scale to be considered a valid metric for use in clinical and
health-fitness settings, response validity must be established. Evidence of response validity is
typically provided by concurrent and construct validity. Concurrent validity is established by the
concomitant increase in perceptions of exertion and physiological variables such as HR and VO2.
Concurrent validation paradigms have been used to establish a number of different scaling
metrics for various exercise settings, modes and population cohorts (Borg, 1962; Borg, 1973;
Borg, 1982; Robertson et al., 2005b; Robertson et al., 2004; Utter et al., 2004; Williams et al.,
1994). In particular, the OMNI scale validation studies clearly demonstrated that the concurrent
variables have a strong positive relationship to the criterion variables (Robertson et al., 2000;
Robertson et al., 2004; Robertson et al., 2003; Utter et al., 2002).
Construct validity is established by a strong positive correlation between a criterion and
conditional metric. Typically, construct validation of OMNI scales for use in clinical and health-
fitness settings has been demonstrated in previous investigations using the Borg 15 Category
Scale (Lagally & Robertson, 2006; Robertson et al., 2004; Utter et al., 2004). However,
Robertson et al. (2005) developed and validated the Children’s OMNI Step Scale using the
Children’s OMNI Cycle Scale as the criterion metric. This study was able to show that the
OMNI RPE scale is a robust tool for measuring perceptions of exertion.
RPE can be anatomically differentiated to the involved body regions (e.g., arms, legs, and
chest) and can also be assessed as an undifferentiated signal representing exertional perceptions
associated with the overall body (Robertson & Noble, 1997). Differentiated RPE distinguishes
between anatomically regionalized perceptual signals, whereas the undifferentiated RPE serves
as a global indicator of general exertion (Noble & Robertson, 1996; Robertson et al., 2004). An
important application of categorical RPE scaling is its precision in distinguishing between an

6
anatomically regionalized perceptual signal and a total body signal when both assessments are
made at approximately the same time within a defined exercise period (Robertson et al., 2003).
Intensity of the peripheral signal arising from the involved limbs is generally considered more
intense than the respiratory-metabolic signal (e.g., chest/breathing) during exercise. Using the
Borg 15 Category Scale, Green and colleagues (2004) demonstrated that during EE exercise,
RPE associated with the legs were more intense than during TM exercise. This finding confirms
that differential exertional signals provide a more precise definition of the physiological and/or
symptomatic processes that shape the perceptual context during exercise (Noble & Robertson,
1996). Because exercise prescriptions vary according to the individual and mode of exercise
being performed, differentiated perceptual signals that are anatomically regionalized to involved
musculature can be used in generating exercise prescriptions and regulation of exercise sessions
(Noble & Robertson, 1996). Thus, it is important for both differentiated and undifferentiated
responses to be validated when constructing a new RPE scale.
While OMNI RPE scales have been proven to be valid and reliable metrics to monitor
and regulate exercise intensity, an application weakness is evident, particularly at the lower
response zone of the scale (e.g., 0-3). It is not uncommon for subjects to respond with an RPE of
“0” during low intensity exercise as the corresponding verbal descriptor is “extremely easy”. For
example, when an RPE of “0” is used in prediction models to estimate VO2peak, “extremely easy”
can be interpreted differently by subjects. A subject who responds with an RPE of “0” would
have a predicted VO2peak that could potentially be higher compared to their actual VO2peak. This
is in contrast to an individual that responds with an RPE of “1” or “2”; they would have a lower
predicted VO2peak but potentially a higher measured VO2peak. The linearity of RPE, HR, and VO2
may differ between subjects because of the initial stages of a GXT. In addition, Weary-Smith

7
(2007) developed a Physical Activity Index (PAI) using RPE to measure the total activity load
(i.e., volume of exercise x intensity of exercise) and associated kcal expenditure during varying
TM intensities. The PAI was calculated as the product of pedometer step count and RPE
estimated during TM walking. This index score was then used as the predictor variable in a
model that estimated kcal expenditure for walking exercise. For this prediction model to be
accurate, the RPE given by the subject must be “1” or greater. For example, if a “0” is given by
the subject, an index score of 0 will be calculated. When placed into a regression model the “0”
will estimate kcal expenditure at an inaccurately low level. Additionally, Borg modified the
original 6-20 category scale at the low response zones (Borg, 1985). The artificial “zero” or
starting point, “6”, was changed to “no exertion at all”. In the older version of the scale there
was no verbal expression after the first number (Borg, 1971). Instead the first expression was
“very, very light” and appeared after the number “7”. Thus, the newly developed OMNI RPE
scales should control for this inherent limitation in previously validated scales. In order to
address this limitation of the OMNI RPE scales, minor adjustments should be made to either the
numerical, verbal, and/or pictorial descriptors of the low response zones (OMNI RPE = 0-3).
1.2 RATIONALE Elliptical ergometry has become a popular exercise mode in clinical and health-fitness settings
within the past decade. Currently, an OMNI RPE scale has not been developed for use during
elliptical ergometry. In order to expand the broad-based application of the OMNI scale, it is
important to establish an elliptical ergometry format for both adult males and females.
8
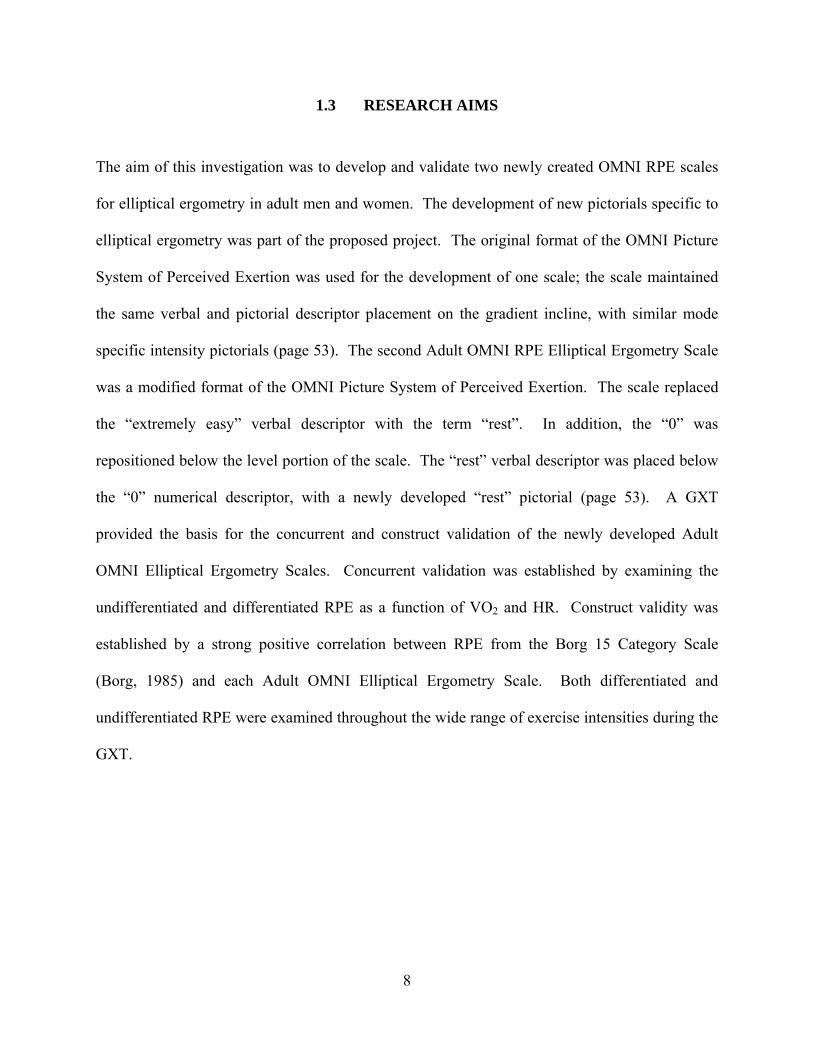
1.3 RESEARCH AIMS
The aim of this investigation was to develop and validate two newly created OMNI RPE scales
for elliptical ergometry in adult men and women. The development of new pictorials specific to
elliptical ergometry was part of the proposed project. The original format of the OMNI Picture
System of Perceived Exertion was used for the development of one scale; the scale maintained
the same verbal and pictorial descriptor placement on the gradient incline, with similar mode
specific intensity pictorials (page 53). The second Adult OMNI RPE Elliptical Ergometry Scale
was a modified format of the OMNI Picture System of Perceived Exertion. The scale replaced
the “extremely easy” verbal descriptor with the term “rest”. In addition, the “0” was
repositioned below the level portion of the scale. The “rest” verbal descriptor was placed below
the “0” numerical descriptor, with a newly developed “rest” pictorial (page 53). A GXT
provided the basis for the concurrent and construct validation of the newly developed Adult
OMNI Elliptical Ergometry Scales. Concurrent validation was established by examining the
undifferentiated and differentiated RPE as a function of VO2 and HR. Construct validity was
established by a strong positive correlation between RPE from the Borg 15 Category Scale
(Borg, 1985) and each Adult OMNI Elliptical Ergometry Scale. Both differentiated and
undifferentiated RPE were examined throughout the wide range of exercise intensities during the
GXT.

9
1.4 RESEARCH OBJECTIVES The research objectives of this investigation were to establish concurrent and construct validity
in men and women for an Adult OMNI RPE Elliptical Ergometry Scale using the original format
of the OMNI Picture System of Perceived Exertion and for a modified format Adult OMNI
Elliptical Ergometry Scale of Perceived Exertion. Specifically the relation between RPE-O, L
and C from the Adult OMNI Elliptical Ergometry Scales and VO2 and HR were examined in
order to establish concurrent validity. Additionally, the relation between RPE-O, L and C from
the Adult OMNI RPE Elliptical Ergometry Scales and RPE-O, L and C from the Borg 15
Category Scale were examined in order to establish construct validity.

10
2.0 LITERATURE REVIEW
2.1 DEVELOPMENT OF PERCEIVED EXERTION SCALING
2.1.1 Psychophysics and ratio scaling Psychophysics is the study of sensation and stimulus when both are measured in quantities
(Marks, 1974). Classic psychophysical studies were concerned with detecting the presence of a
sensory stimulus or change in that stimulus (Noble & Robertson, 1996). The early work of E.H.
Weber and G.T. Fechner focused on the determination of a physical stimulus and not specifically
perceived exertion. The classic view of psychophysics was that the direct measurement of
perception was not needed and not possible. This is an important concept to examine in the
development of perceived exertion. It was recognized that better methods were needed to
measure sensory processes, thus scaling methods began to be developed that were able to
examine the sensory response rather than the stimulus. Thus, the development of modern
psychophysics focused on scale sensation or the use of numbers to differentiate among objects or
events (Noble & Robertson, 1996). In the 1950’s and 1960’s, psychophysicist S.S. Stevens was
a strong proponent of ratio scaling methods to measure perceptual intensities (Stevens, 1971).
This method of measuring perceptual intensities focuses on the concept of magnitude estimation,
or the presentation of stimuli of varying intensities with the subjects then being asked to assign

11
numbers depending on how intensely they were perceived (Borg, 1982). It was thought that
ratio/magnitude estimation methods (commonly used in physics and physiology) would provide
the best means to measure subjective levels of exertion (Borg, 1982).
In ratio/magnitude estimation, an individual estimates how many times greater the
exertion is perceived compared to a standard exercise intensity (Noble & Robertson, 1996). The
estimated perceived exertion is then expressed as a multiple of the numeric standard. According
to Robertson and Noble (1997) this method of scaling can be used for 1) a comparison of
perceptual responses between various perceptual perturbations in which the physiological
reference for comparison falls on an exponential curve and 2) to determine how the perception of
exertion grows as a function of physiological responses that change exponentially with
increasing exercise intensity. However, these properties limit the use of ratio scaling methods in
clinical and health-fitness settings.
2.1.2 Category scaling Borg began developing methods of quantifying subjective symptoms during activity by
examining subjective feelings and their relation to objective findings (Borg, 1982). However,
Borg realized that in order to make interindividual comparisons a category scale must be
developed as opposed to the psychophysical ratio scaling methods. Category scaling employs a
number and verbal descriptor format, partitioning the sensory response continuum into equal
intervals (Robertson & Noble, 1997). Thus, an application strength of category scaling is that
direct interindividual comparisons can be made because individuals respond in an absolute
manner (Borg, 1982). For example, if someone responds with a perceived exertion of “easy”, it

12
can be concluded that their level of exertion would be lighter than someone responding with
“hard”. Borg (1982) has also stated that ratio scaling does not allow for this comparison because
of its relative nature:
“One subject may rate a 1-pound weight a "10" and a 2-pound weight "25," while another
may assign "4" and "10" to the same weights. However, the subject assigning the "25"
rating to the 2-pound weight does not mean that he perceives it to be heavier than the
subject who has rated it "10."
Because ratio scaling follows a positively accelerating curve utilizing a power function relative
to a standard of work output, it is limited in its use. Thus, the concept of interindividual
comparisons was the basis for the development of the 21 point rating scale, Borg’s first
published article in perceived exertion (Borg, 1961). This scale proved not to be linearly related
to pulse rate and power output, and as such its validity was questioned (Noble & Robertson,
1996).
In 1971, Borg developed the 15 Category Scale, commonly called the Borg Scale, to
solve the problem of non-linearity between perceptual ratings and both HR and power output that
was observed with the 21 point rating scale (Borg, 1971). His basis for using a range of numbers
from 6-20 was that the numbers when multiplied by 10, could predict HR from RPE. The
predictive properties of the scale were proven inadequate, as HR is dependent on a number of
factors (e.g., age, gender, clinical status, medications); however, the Borg 15 Category Scale
proved to be linearly related to HR and is widely used in clinical and health-fitness settings.
In order to develop a scale with perceptions of exertion that increase linearly with
physiological variables such as HR and VO2, quantitative semantics must be employed.
Quantitative semantics refers to the quantitative relation between the meaning of words and

13
verbal descriptors (Noble & Robertson, 1996). Borg constructed his initial category scales such
that categories were separated by equal intervals while spanning the full perceptual/physiological
continuum. As previously mentioned, the curvilinear nature of the 21 point rating scale was in
part due to the number range, but also the verbal descriptors. The 21 point rating scale employed
verbal descriptors such as “rather light” and “neither light nor laborious” (Borg, 1961). These
terms are comparable to each other, although it was intended for them to be semantically
different and not overlap. Thus, the verbal descriptors and range of numbers were modified in
the 15 Category Scale in order to be semantically different throughout the full range of
perceptual exertion (Borg, 1971).
2.1.3 Effort Continua The theoretical rationale underlying the applications of RPE are based on the functional
interdependence of perceptual and physiological responses during exercise (Robertson, 2004).
The three main effort continua are physiological, perceptual and performance (Robertson,
2001a). Figure 1 depicts the relationship between the stimulus and effort continua. As a
stimulus is introduced and the intensity of exercise performance increases, there is a
corresponding and interdependent change in both perceptual and physiological responses (Borg,
1998; Robertson, 2004). This linkage indicates physiological and perceptual responses can
provide the same information concerning the intensity of the exercise performance.

Figure 1. Effort Continua Model of perceived exertion (Borg, 1998; Robertson, 2004)
2.1.4 Range Model Borg’s Range Model describes the change in RPE as exercise intensity increases from low to
high levels (Figure 2) (Borg, 1998). There are a number of assumptions of the range model: 1)
for any given exercise range between rest and maximum, there is a corresponding and equal RPE
range and 2) for all individuals, both the perceptual range and the intensity of the perceptual
signals at the low and high ends of the stimulus range are equal (Borg, 1998; Robertson &
Noble, 1997). Thus, as exercise intensity increases from low to high, a corresponding and equal
increase of effort occurs. The application of this model strengthens the principle for comparison
of individuals of varying age, fitness and gender. At the same relative percentage of intensity,
RPE will be similar between high and low fit individuals even though the absolute power output
will be greater in the high fit individual. The application of the range model can then be applied
to anchoring the perception of exertion at high and low levels of exercise intensity. The
responses to varying exercise intensities, regardless of physiological, psychological and physical
14

attributes, are then established at a relative percentage within the individual’s response range
(Ljunggren & Dornic, 1989).
Figure 2. Borg’s Range Model for category scales of perceived exertion (Borg, 1998; Noble & Robertson, 1996)
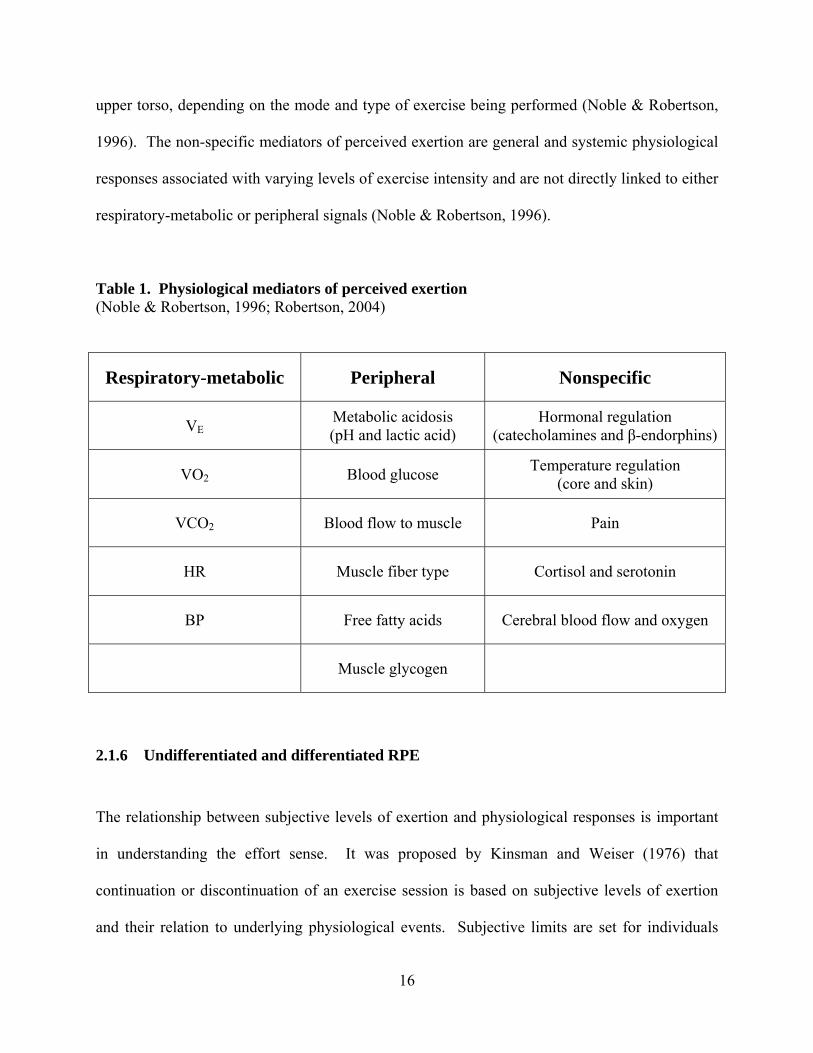
2.1.5 Physiological mediators There are a number of physiological factors that influence RPE during exercise. It is important
to have an understanding of these underlying mediators as the application of RPE in health-
fitness settings relies on the concomitant increase in several objectively measured physiological
variables. The physiological factors that influence perceived exertion can be classified as 1)
respiratory-metabolic, 2) peripheral and 3) non-specific (Table 1) (Noble & Robertson, 1996;
Robertson, 2004). Pulmonary ventilation (VE), VO2, carbon dioxide production (VCO2), HR,
and blood pressure (BP) influence the respiratory-metabolic drive during dynamic exercise. It is
the ventilatory drive particularly that mediates respiratory-metabolic drive. Skeletal muscle
contraction and factors associated with altered energy production provide peripheral input to the
exertional milieu. These mediators are regionalized to exercising muscles in the limbs, trunk or
15
16
upper torso, depending on the mode and type of exercise being performed (Noble & Robertson,
1996). The non-specific mediators of perceived exertion are general and systemic physiological
responses associated with varying levels of exercise intensity and are not directly linked to either
respiratory-metabolic or peripheral signals (Noble & Robertson, 1996).
Table 1. Physiological mediators of perceived exertion (Noble & Robertson, 1996; Robertson, 2004)
Respiratory-metabolic Peripheral Nonspecific
VE Metabolic acidosis (pH and lactic acid)
Hormonal regulation (catecholamines and β-endorphins)
VO2 Blood glucose Temperature regulation (core and skin)
VCO2 Blood flow to muscle Pain
HR Muscle fiber type Cortisol and serotonin
BP Free fatty acids Cerebral blood flow and oxygen
Muscle glycogen
2.1.6 Undifferentiated and differentiated RPE The relationship between subjective levels of exertion and physiological responses is important
in understanding the effort sense. It was proposed by Kinsman and Weiser (1976) that
continuation or discontinuation of an exercise session is based on subjective levels of exertion
and their relation to underlying physiological events. Subjective limits are set for individuals

17
while exercising based on symptoms of fatigue involving skeletal muscle and cardiorespiratory
muscles. Thus, the Kinsman-Weiser model linked global subjective sensations of fatigue with
underlying physiological mediators. While this model was important, it did not include the
concept of regionalized or differentiated RPE. Pandolf and colleagues (1975) proposed the
addition of differentiated perceptual responses; responses included regional skeletal muscle
ratings and a central or cardio-pulmonary rating. These differentiated RPE were first used
during a physical conditioning program using leg weights in middle-aged males. Subjects
performed TM and cycle exercise with differentiated ratings being measured in conjunction with
the overall or general rating. For cycling exercise, the local muscular factors were dictating
exertional perception, while the central factors were greater during TM walking (Pandolf et al.,
1975). It was concluded that the exertional sensations for a particular mode were dominated by
one differentiated rating, while the other was deemphasized. In addition, there are a number of
studies demonstrating that RPE-L are greater than RPE-O and RPE-C during cycle exercise
(Cafarelli et al., 1977; Ekblom et al., 1975; Garcin et al., 1998; Mahon et al., 1998; Pandolf,
1982; Pandolf et al., 1975; Robertson et al., 1979). Using the Borg 15 Category Scale, Green
and colleagues (2003) demonstrated that RPE-L was greater during cycling than TM walking at
the respiratory compensation threshold. Clearly, the involved muscle group is perceived as more
intense, demonstrating the peripheral physiological mediators are dominant during cycling.

18
2.2 PERCEIVED EXERTION SCALES
2.2.1 Children’s scales of perceived exertion Children typically do not have the vocabulary or the cognitive ability to understand verbal
descriptors used in adult formatted scales (Bar-Or, 1977; Miyashita et al., 1986; Robertson et al.,
2000; Williams et al., 1994). Thus, there have been a number of investigations that have
attempted to establish valid RPE scales for children (Eston & Parfitt, 2006; Eston et al., 2000;
Eston et al., 1994; Eston et al., 2001; Groslambert et al., 2001; Nystad et al., 1989; Williams et
al., 1994; Yelling et al., 2002). Nystad and colleagues (1989) examined perceptions of exertion
in male and female asthmatic children age 7-16 yrs. The children rated their perceived exertion
3-5 times during a physical education lesson using a modified Borg 15 Category Scale (Figure
3). The verbal descriptors of the Borg Scale were replaced by stick figure pictorials depicting
increasing levels of exercise intensity. The results indicated that the children had difficulty using
the modified Borg Scale to assess their exercise intensity. On average, children rated the
exercise intensity as 15 or greater 55% of the time, although their HR was less than 150 beats ·
min-1 80% of the time. While the authors suggested that asthmatic children may rate their
perceived exertion higher than normal children, this article was the first step in creating a valid
RPE metric using illustrations to fine tune the perceptual response.

Figure 3. Borg Scale with stick figures (Nystad et al., 1989) Eston et al. (1994) and Williams et al. (1994) developed the Children’s Effort Rating
Table (CERT) to examine perceived effort during “response” and “production” exercise
protocols (Figure 4). The scale was reduced to a 1-10 numerical format and verbal descriptors
were used that were more common to a child’s vocabulary. Children age 6-9 yrs estimated effort
during an incremental stepping exercise protocol. Investigators added weight to a backpack to
increase the intensity of the stepping exercise. Additionally, children produced exercise
intensities at effort ratings of 5 and 7 during stepping exercise. Investigators added or removed
weight from the backpack until children perceived effort ratings of 5 and 7. The investigators
commented that the HR at the time of “rating” during the initial estimation trial matched the
conceptual model; HR, power output and exertion rating increased linearly. While there was
evidence of linearity in the initial CERT studies, it has been discussed that scale sensitivity is
reduced for physiological variables in the upper range of exercise intensities (Lamb & Eston,
19

20
1997a; Lamb & Eston, 1997b). Also, during the production bout, the children were unable to
self-regulate their effort. This finding raises questions about the validity of the CERT scale.
Additionally, Borg (1998) has stated that “…this is the first and only study of CERT and only a
very rough description of the scale construction is given (the selection of verbal anchors and
their positions on the scale is unclear)…”
1 Very, Very Easy 2 Very Easy
3 Easy
4 Just Feeling a Strain
5 Starting to Get Hard
6 Getting Quite Hard
7 Hard
8 Very Hard
9 Very, Very Hard
10 So Hard I am Going to Stop Figure 4. Children’s Effort Rating Table (CERT) (Williams et al., 1994) Groslambert and colleagues (2001) evaluated the Rating of Perceived Exertion adapted
for Children scale. Subjects included children (5.5 + 1.0 yrs) who could not read (Figure 5). The
investigators removed the verbal descriptors from the Borg 15 Category Scale (Borg, 1971) and
placed 7 cartoon like pictorials of a man becoming progressively fatigued along the numerical

range of 6-20. During two separate maximal running field tests, RPE was estimated at low,
moderate and high intensities. Intraclass correlation coefficients (ICC) ranged from .67-.77 for
the first two and last three stages of the two trials. However, there were low ICC (.26-.42) at the
moderate intensity stages between the two trials. The authors state that the low ICC observed for
the intermediate stages may have been the result of the children being distracted by emotional or
environmental factors. However, this finding suggests the illustrations may not be semantically
different throughout the full range of exercise intensities.
Figure 5. Rating of Perceived Exertion adapted for Children (Groslambert et al., 2001)
21

22
It is important to include numbers, understandable verbal descriptors and illustrations
when developing children RPE scales. With regard to illustrations, it is important to include
meaningful child like pictures along with developmentally appropriate verbal descriptors in order
for children to have a greater understanding of the effort continuum (Noble & Robertson, 1996).
The pictures help to fine tune their ability to rate perceived exertion. Eston and colleagues
(2000) developed the Cart and Effort Load Rating Scale (CALER) in order to establish a scaling
metric that included numbers, understandable verbal descriptors and illustrations (Figure 6). The
scale depicts a child on a cycle pulling a cart that is progressively loaded with bricks, with the
number of bricks on the cart corresponding to the numbers on the scale. Initially, investigators
examined the test-retest reliability of the scale. The CALER scale was found to have ICC
ranging from .76-.97 for effort production at RPE of 2, 5 and 8 for a series of 4 separate trials
(Eston et al., 2000). However, only recently has the concurrent validity of this scale been
examined. In a study by Barkley and colleagues (2008) RPE derived from the CALER scale
increased as a function of VO2 and HR (r = .88, r = .92) in male and female children ~9 yrs of
age. The CALER scale also demonstrated a positive relationship with the OMNI Cycle Scale
which served as the criterion metric. However, the CALER scale does have a limitation in that
the illustrations do not ascend a gradient incline (e.g., a hill).

Figure 6. Cart and Effort Load Rating Scale (CALER) (Eston et al., 2000) Eston and colleagues (2001) developed a pictorial scale that included a popular cartoon
character as the illustration. The Bug and Bag Effort (BABE) rating scale (Figure 7) is similar to
the CALER scale developed by Eston et al. (2000); however the BABE rating scale depicts a
cartoon bug with a backpack performing stepping exercise. The initial validation of the scale
utilized children age 7-10 yrs. Eighteen children were randomly assigned to one of three groups
using the following scales: 1) CALER, 2) CERT and 3) BABE. Children performed three
separate stepping exercise trials at self-regulated intensities of 3, 5 and 8. Investigators added
weight to a backpack as instructed by the children until the target RPE was reached. Test-retest
reliability was established across the trials for the BABE scale (Trial 1-2: .81; Trial 2-3: .87).
Parfitt et al. (2007) examined the reliability of effort production in children aged 7-11
yrs. Children were randomly placed into two groups (Group 1: CALER scale; Group 2: BABE
scale) and performed six separate discontinuous effort production protocols at RPE of 3, 5 and 8
for cycle (3 trials) and stepping (3 trials) exercise, with each trial separated by 1 week. Overall
ICC of HR for the CALER scale group ranged from .74-.83 through all production bouts and
both modes of exercise. Children using the BABE scale demonstrated an overall ICC of .84
through all production bouts and both modes of exercise. While the BABE scale focuses on
23

stepping exercise, investigators examining the scale believe that it may have intermodal
applications and may be more popular among children than the CALER scale (Parfitt et al.,
2007). However, similar to the CALER scale, the BABE scale does not depict a linear gradient
increase in effort. Additionally, while the BABE scale may be popular with children familiar
with the cartoon illustration, the question remains whether this finding is valid in children who
would be unfamiliar with the character.
Figure 7. Bug and Bag Effort (BABE) Scale (Eston et al., 2001) A pictorial format of the CERT, the Pictorial CERT (PCERT) depicted in Figure 8, was
developed by Yelling and colleagues (2002) using the same numerical and verbal descriptors as
the original non-pictorial CERT developed by Williams et al. (1994). One hundred four children
in two different age groups (12.1 + .3 and 15.3 + .2 yrs) were recruited. Initially subjects took
part in a series of lessons ranging from light to vigorous activities. Children were asked to
reflect upon their perceived breathlessness, degree of muscular ache or pain, and changes in body
temperature. After each lesson, children were presented with a series of illustrations depicting 5
different effort levels. They were then asked to place the pictorials on the 1-10 stepping scale,
24

25
thus developing the PCERT. Forty-eight of the original 104 children then performed two Phases
of exercise testing. Phase I consisted of five, three min, intermittent estimation graded stepping
bouts, with the initial bout being a warm-up. Phase II consisted of children producing PCERT
levels of 3, 5, 7 and 9. Children were able to discriminate between intensities during the Phase I
exercise intensities; however, correlation coefficients between HR and PCERT scores evidenced
mixed results (age 11-12 yrs: males, r = .20 - .43 and females, r = .36 - .66; age 14-15 yrs: males,
r = .26 - .52 and females, r = .66 - .87). Significant correlations were found at all exercise levels
in both female cohorts but only at the first exercise level in males age 14-15 yrs. These low
correlation coefficients between HR and PCERT scores question its validity to measure
perceptions of exertion across a wide-range of exercise intensities.
Marinov and colleagues (2008) examined the reliability and concurrent and construct
validity of the PCERT and Borg CR-10 scale (1982) in fifty male and female children (10.4 + .5
yrs). Subjects performed three incremental TM tests. The first two trials (Trial 1 and Trial 2)
were separated by 2 weeks, with the third trial (Trial 3) taking place three yrs later. Children
utilized the PCERT scale or CR-10 scale for Trial 1 or Trial 2 in alternating fashion, with Trial 3
requiring children to rate perceptions of exertion using both scales. ICC were better for the
PCERT scale between Trials 1 and 2 (r = .77) compared to the Borg CR-10 scale (r = .54). The
relationship between PCERT scores and RPE derived from the Borg CR-10 scale demonstrated
moderate to strong correlations for Trial 1 and 2 (r = .64) and Trial 3 (r = .84). Additionally,
correlations for VO2, HR and VE for all three trials using PCERT scores for all participants (r =
.61 - .88) was higher than CR-10 values (r = .51 - .71). The long term repeatability was better
for the PCERT than the Borg CR-10 scale. Also, the PCERT resulted in stronger correlations
with various physiological variables than the Borg CR-10 scale. The findings are not surprising,

as the Borg CR-10 scale is limited in use. Children of a certain age are unable to understand
Borg perceived exertion scales (Wilson & Jones, 1991). Additionally, the Borg CR-10 scale has
category and ratio properties. Noble et al. (1983) demonstrated that the CR-10 scale was
adequate for measuring sensations associated with curvilinear physiological responses, not those
that increase linearly such as VO2 and HR. When comparing perception of effort responses with
VO2 and HR, it would be expected that a category scale, such as the PCERT would evidence
better correlation coefficients with these physiological variables when compared to the Borg CR-
10 scale.
Figure 8. Pictorial Children’s Effort Rating Table (PCERT) (Yelling et al., 2002) Eston and Parfitt (2006) proposed a new direction regarding pictorial scaling. The
Curvilinear Scale (Figure 9) is based on the notion that children will perceive an increasingly
26

27
steeper hill as more difficult to ascend. The initial experiment exploring the validity of this scale
included children age 8-11 yrs. Children were asked to place sitting and walking illustrations on
progressively increasing gradients. The experimental trial consisted of a self-regulated exercise
paradigm, with children exercising at RPE of 2, 5 and 8 over six separate trials. The ICC for
production bouts across the six trials at target RPE of 2, 5 and 8 were .71, .75 and .76,
respectively. This finding shows some promise for the use of this scale for regulating exercise
intensity in children. However, there were a number of limitations in this study. First, subjects
performed the production bouts continuously and in ascending order, thus anticipation bias may
have been introduced, as the target production bouts were not counterbalanced. Second, the
authors make reference to ventilation as a respiratory-metabolic physiological mediator of RPE
and that because ventilation increases in a curvilinear fashion, so to should the ratings using the
curvilinear scale. However, there are a number of other physiological mediators of perceived
exertion (e.g., VO2) that increase linearly and may influence perception of effort. Finally, the
gender of the subjects was not discussed, thus the validity of the scale regarding each gender is
unknown.
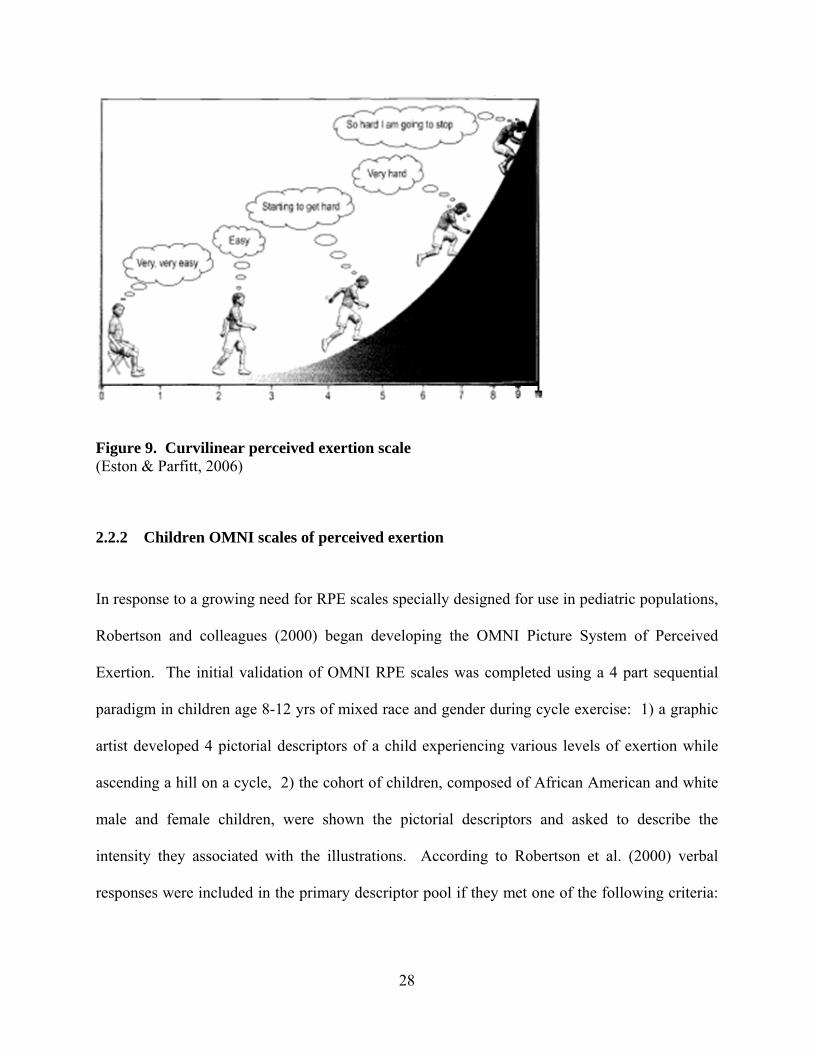
Figure 9. Curvilinear perceived exertion scale (Eston & Parfitt, 2006)
2.2.2 Children OMNI scales of perceived exertion In response to a growing need for RPE scales specially designed for use in pediatric populations,
Robertson and colleagues (2000) began developing the OMNI Picture System of Perceived
Exertion. The initial validation of OMNI RPE scales was completed using a 4 part sequential
paradigm in children age 8-12 yrs of mixed race and gender during cycle exercise: 1) a graphic
artist developed 4 pictorial descriptors of a child experiencing various levels of exertion while
ascending a hill on a cycle, 2) the cohort of children, composed of African American and white
male and female children, were shown the pictorial descriptors and asked to describe the
intensity they associated with the illustrations. According to Robertson et al. (2000) verbal
responses were included in the primary descriptor pool if they met one of the following criteria:
28

a) described effort or exertion, b) pertained to intensity of the exercise/work, and c) described
either signs or symptoms of exertional comfort/discomfort. 3) Semantic differential analysis as
explained by Borg’s earlier work (1961) was used to select verbal descriptors that were
discretely different in exertional properties. According to Noble and Robertson (1996), this was
a major strength of Borg’s scales because the scales do not just rank sensation categories, but
also satisfy the equal interval criterion of category scales. The word “Tired” was given by the
children the most frequently, with the word light given 0 times. Robertson and colleagues
(2000) believed this to be a strong point of the Children’s OMNI Cycle Scale (Figure 10), as the
Borg 15 Category Scale uses the word light. Thus, verbal descriptors that children can associate
with exertion were integrated into the scale. 4) Using semantic differential analysis, the four
pictorials associated with the OMNI scale were placed along an ascending scale, above the
numbers with a corresponding verbal descriptor. This established a verbal-visual
correspondence in exertional properties (Robertson et al., 2000).
Figure 10. Children’s OMNI Cycle Scale (Robertson et al., 2000)
29

30
A submaximal estimation trial was then administered with children exercising at power
outputs of 25, 50, 75 and 100 Watts. Regression analysis indicated that for the combined sample
of subjects, RPE-O, L and C distributed as a positive linear function of both VO2 (r = .85 - .94)
and HR (r = .87 - .93) thus establishing concurrent validity. The linearity of RPE responses as an
applied validation criterion is parallel to the basic tenants of Borg’s Effort Continua Model. The
investigation demonstrated a positive linear relation between the Children’s OMNI Cycle Scale
RPE responses and selected physiological variables. This finding is consistent with the
application outcomes underlying Borg’s Range Model. Additionally, when cohorts were
examined separately by race and gender, significant correlations were observed for OMNI RPE-
O, L and C with the physiological variables of VO2 (female African American: r = .85 - .94;
male African American: r = .89 - .93; female white: r = .87 - .92; male white: r = .90 - .94) and
HR (female African American: r = .88 - .94; male African American: r = .90 - .92; female white:
r =.87 - .90; male white: r = .87 - .92). These are important findings, as the use of the Children’s
OMNI Cycle Scale is valid for children age 8-12 yrs regardless of gender, race or fitness level.
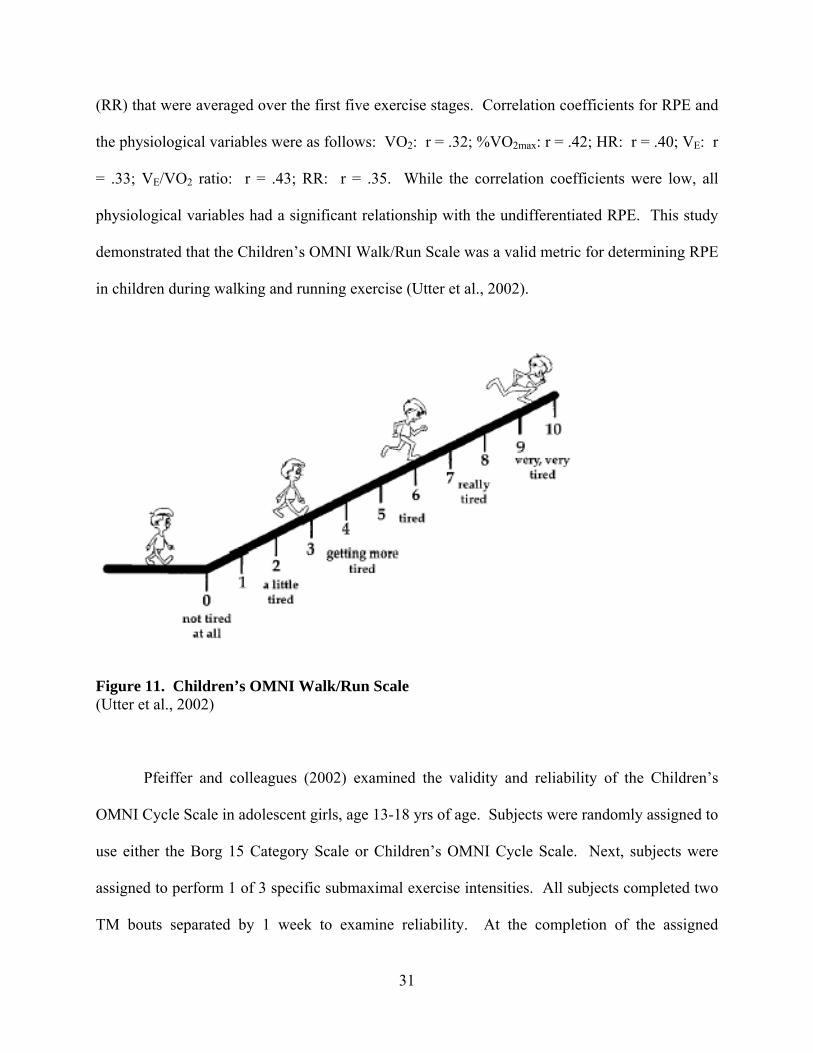
A unique aspect of the OMNI Picture System of Perceived Exertion is the use of
interchangeable pictures. Utter and colleagues (2002) developed a pictorial version of the OMNI
scale for walking and running exercise (Figure 11). This scale utilized the same category scale
properties of the Children’s OMNI Cycle Scale; however, the pictorials were modified to
represent children at varying levels of intensity while walking and running up a hill/incline. The
paradigm examined male and female children age 6-13 yrs during a perceptual estimation
protocol using a TM. Investigators examined correlations between undifferentiated RPE ratings
and selected physiological variables (VO2, %VO2max, HR, VE, VE/VO2 ratio and respiratory rate
(RR) that were averaged over the first five exercise stages. Correlation coefficients for RPE and
the physiological variables were as follows: VO2: r = .32; %VO2max: r = .42; HR: r = .40; VE: r
= .33; VE/VO2 ratio: r = .43; RR: r = .35. While the correlation coefficients were low, all
physiological variables had a significant relationship with the undifferentiated RPE. This study
demonstrated that the Children’s OMNI Walk/Run Scale was a valid metric for determining RPE
in children during walking and running exercise (Utter et al., 2002).
Figure 11. Children’s OMNI Walk/Run Scale (Utter et al., 2002) Pfeiffer and colleagues (2002) examined the validity and reliability of the Children’s
OMNI Cycle Scale in adolescent girls, age 13-18 yrs of age. Subjects were randomly assigned to
use either the Borg 15 Category Scale or Children’s OMNI Cycle Scale. Next, subjects were
assigned to perform 1 of 3 specific submaximal exercise intensities. All subjects completed two
TM bouts separated by 1 week to examine reliability. At the completion of the assigned
31
32
submaximal stage during the second TM session, subjects continued incrementally to fatigue.
The OMNI scale provided the best reliability with ICC of r = .95 compared to Borg Scale ICC of
r = .78. Additionally, the OMNI scale demonstrated a stronger relationship with physiological
variables, with coefficients of r = .86 for %HRmax and r = .89 for %VO2max compared to r = .66
and r = .70 for the Borg Scale. The authors indicate the Children’s OMNI Cycle Scale is a valid
and reliable metric for measuring perceptions of exertion in adolescent girls. This was the first
article to examine cross-modal use of OMNI RPE scales. The authors stated that the Borg Scale
may be more universal due to the absence of pictures; however, the OMNI scale may be more
valid and reliable in the population of subjects tested if the Children’s OMNI Walk/Run Scale
had been used because it shows exercise mode specific pictures (Pfeiffer et al., 2002).
Roemmich et al. (2006) examined the concurrent and construct validity of the PCERT
and the Children’s OMNI Walk/Run Scale during submaximal TM exercise in male and female
children (11.2 + 1.6 yrs and 11.1 + 1.4 yrs). A perceptual estimation paradigm was employed
with five, three min submaximal exercise stages (Stage 1: 56.4 m·min-1; Stage 2: 69.6 m·min-1;
Stage 3: 85.8 m·min-1; Stage 4: 99.2 m·min-1 and 2.5% grade; Stage 5: 99.2 m·min-1 and 5.0%
grade). To assess construct validity, subject’s perceptions of effort were converted to a
percentage of the maximal score for each scale. Next, correlation coefficients were calculated
between the OMNI and PCERT percentage scores at each TM stage and average correlation
coefficients for all subjects was determined. A strong correlation (r = .92) was demonstrated
between scales, providing evidence of construct validity. Additionally, concurrent validity was
established for both the PCERT and the Children’s OMNI Walk/Run Scale for HR (r = .89 and r
= .92) and VO2 (r = .90 and r = .92). While there were no differences in PCERT scores and
OMNI RPE throughout the submaximal exercise test, Children OMNI Walk/Run responses

33
yielded slightly higher correlation coefficients. This may be due to the additional perceptual fine
tuning associated with the mode specific pictorials of the OMNI scale.
A study by Robertson et al. (2005a) continued to build upon the mode-specific exercise
pictorials of the Children’s OMNI scale. This investigation examined the concurrent validity of
the Children’s OMNI Resistance Exercise Scale (Figure 12). The study was similar to the study
examining concurrent validity of the Adult OMNI Resistance Exercise Scale (Robertson et al.,
2003). The children’s study involved an initial orientation trial followed by subjects performing
one set of single arm biceps curl (BC) and single leg knee extension (KE) during each of three
experimental trials performed on separate days. Perceptions of exertion were assessed for RPE-
O and active muscle (AM). Linear regression analyses indicated positive linear regression
coefficients for males between total volume of weight lifted (WTtot) and RPE-O (males: BC: r =
.80, KE: r = .88; females: BC: r = .87; KE: r = .80) and RPE-AM (males: BC: r = .81, KE: r =
.75; females: BC: r = .88, KE: r = .72). Their finding established concurrent validity, as the
differentiated and undifferentiated RPE increased as a function of volume loading resistance
trials. Additionally, Robertson and colleagues (2005a) established that both male and female
subjects were able to differentiate perceptions of exertion between RPE-O and RPE-AM. RPE-
AM was significantly higher than RPE-O when averaged over the three sets for both BC and KE
exercise. Clearly, this study strengthened the applicability of the OMNI Picture System of
Perceived Exertion as it examined an entirely different mode of exercise, resistance training.

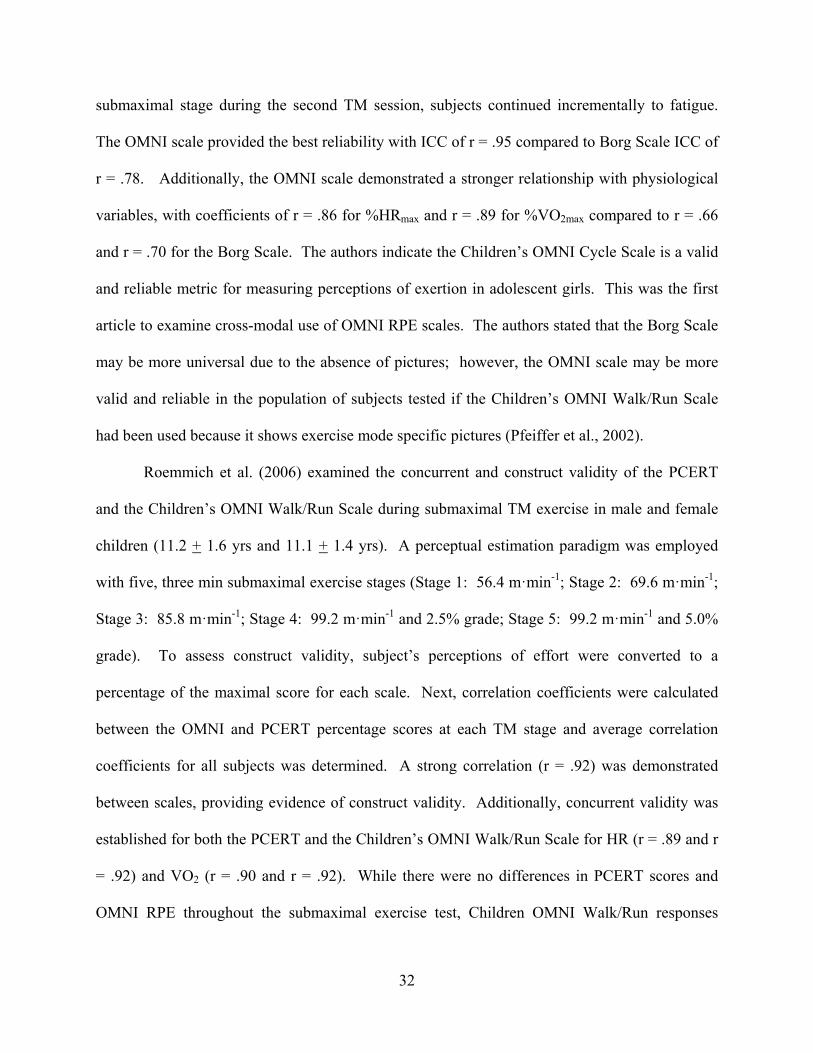
Figure 12. Children’s OMNI Resistance Exercise Scale (Robertson et al., 2005a) Previous Children’s OMNI Scale investigations utilized a variety of paradigms to
establish validity. An investigation by Robertson and colleagues (2005b) was the first to
combine concurrent and construct validity of RPE-O, L and C for an aerobic exercise modality in
children. The Children’s OMNI Step Scale was validated by examining the relation of
differentiated and undifferentiated RPE responses with the criterion variables of VO2 and HR.
Correlation analyses established a positive linear relationship between VO2 (r = .87 - .94) and
HR (r = .81 - .89) for RPE-O, L and C for both male and female cohorts. Construct validity was
based upon the relation between RPE obtained from the criterion metric (Children’s OMNI
Cycle Scale) and the conditional metric (Children’s OMNI Step Scale) when RPE was obtained
from mode specific protocols. Validity coefficients ranged from r = .93 - .95 for RPE-O, L and
C. This study also demonstrated that RPE-O, L and C were not different for males (Figure 13)
and females (Figure 14) when gender pictorials were used of the same or opposite gender. This
34
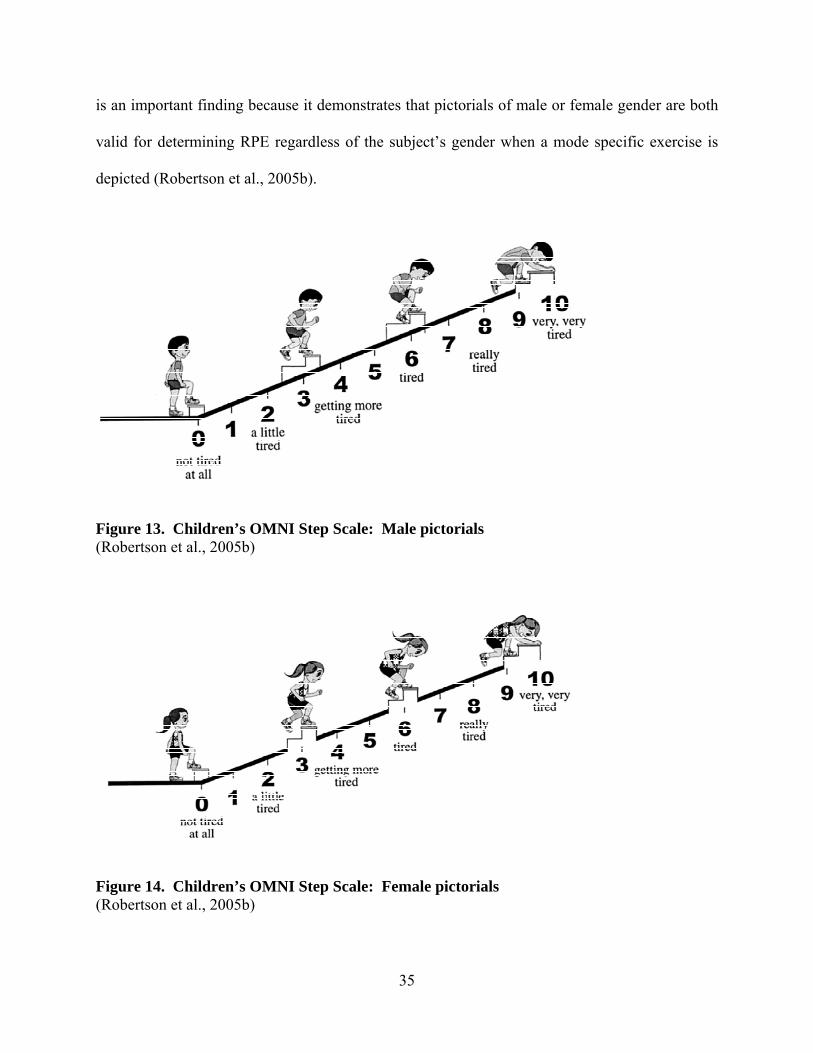
is an important finding because it demonstrates that pictorials of male or female gender are both
valid for determining RPE regardless of the subject’s gender when a mode specific exercise is
depicted (Robertson et al., 2005b).
35
Figure 13. Children’s OMNI Step Scale: Male pictorials (Robertson et al., 2005b)
Figure 14. Children’s OMNI Step Scale: Female pictorials (Robertson et al., 2005b)

36
2.2.3 Adult OMNI scales of perceived exertion A substantial body of research literature exists supporting the inclusion of illustrations to fine
tune children’s perceptions of exertion. However, including pictorials for adult subjects is a
relatively new approach to perceived exertion scaling. Robertson and colleagues (2003)
developed the Adult OMNI Resistance Exercise Scale (Figure 15), the first OMNI Picture
System of Perceived Exertion for adult subjects. The scale has several similarities to the
Children’s OMNI Cycle Scale, most notably the same placement of verbal, numerical and
pictorial descriptors. However, the scale depicts an adult “weightlifter” exercising with a
progressively loaded barbell throughout the response range. Additionally, the verbal descriptors
are appropriate for adult subjects (e.g., extremely easy, extremely hard).
The initial validation of the Adult OMNI Resistance Exercise Scale examined concurrent
validity, employing a cross-sectional, perceptual estimation design in forty, adult male and
female recreational weight trainers (21.55 + 2.06 and 21.35 + 3.67 yrs). Subjects initially
performed an orientation trial followed by the assessment of one repetition maximum (1-RM) for
bicep curls (BC) and knee extension (KE). Three experimental trials were then conducted on
separate days. Subjects performed one set of submaximal (i.e., 65% of 1-RM) BC and KE
during each session with different repetitions being performed each session (i.e., 4, 8 and 12).
Perceptions of exertion were assessed for RPE-AM following the end of the concentric phase of
the middle and final repetition and RPE-O at the end of the final repetition. Positive linear
regression coefficients were observed between RPE measures and WTtot for both male and
female subjects ranging from r = .79 to .91. Additionally, blood lactate and RPE-AM for the
final repetition were significantly correlated during BC exercise (r = .87) for combined male and

37
female subjects. This finding established concurrent validity, as the RPE increased as a function
of the volume of weight lifted and blood lactate. These are important findings for the practical
application of the OMNI Resistance Scale for prescription and self-regulation of resistance
exercise programs (Robertson et al., 2003).
Lagally and colleagues (2006) examined the construct validity of the Adult OMNI
Resistance Exercise Scale in forty moderately trained, recreationally active male and female
subjects (22.3 + 2.6 and 21.4 + 2.3 yrs). Using a cross-sectional, perceptual estimation
paradigm, subjects performed an initial orientation trial of the KE exercise with 1-RM also being
determined. Following the orientation trial, the experimental trial consisted of subjects
performing 1 repetition at submaximal percentages (i.e., 40, 50, 60, 70, 80 and 90%) of their
respective 1-RM. RPE-AM and RPE-O were rated by subjects after each repetition using the
Borg 15 Category Scale and the Adult OMNI Resistance Exercise Scale. For both male and
female subjects, correlation coefficients ranged from r = .94 - .97 for RPE-AM and RPE-O. This
finding indicates that the two perceived exertion scales provide similar information regarding
perceived exertion (Lagally & Robertson, 2006).
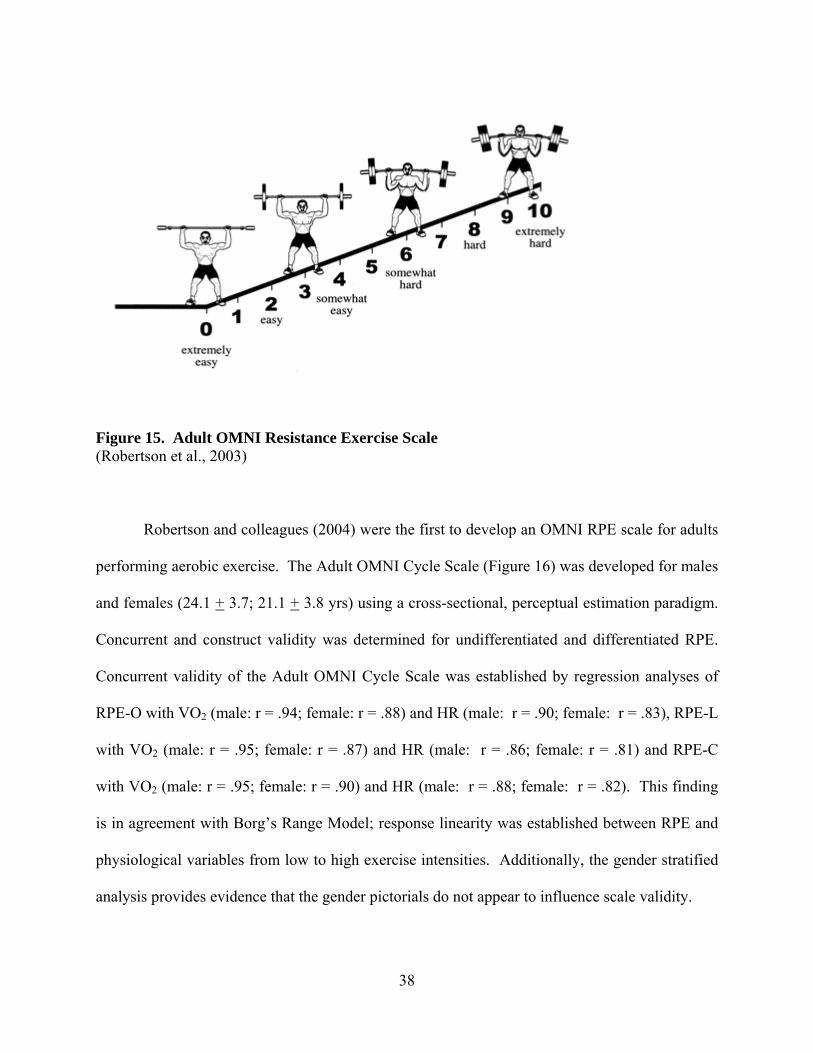
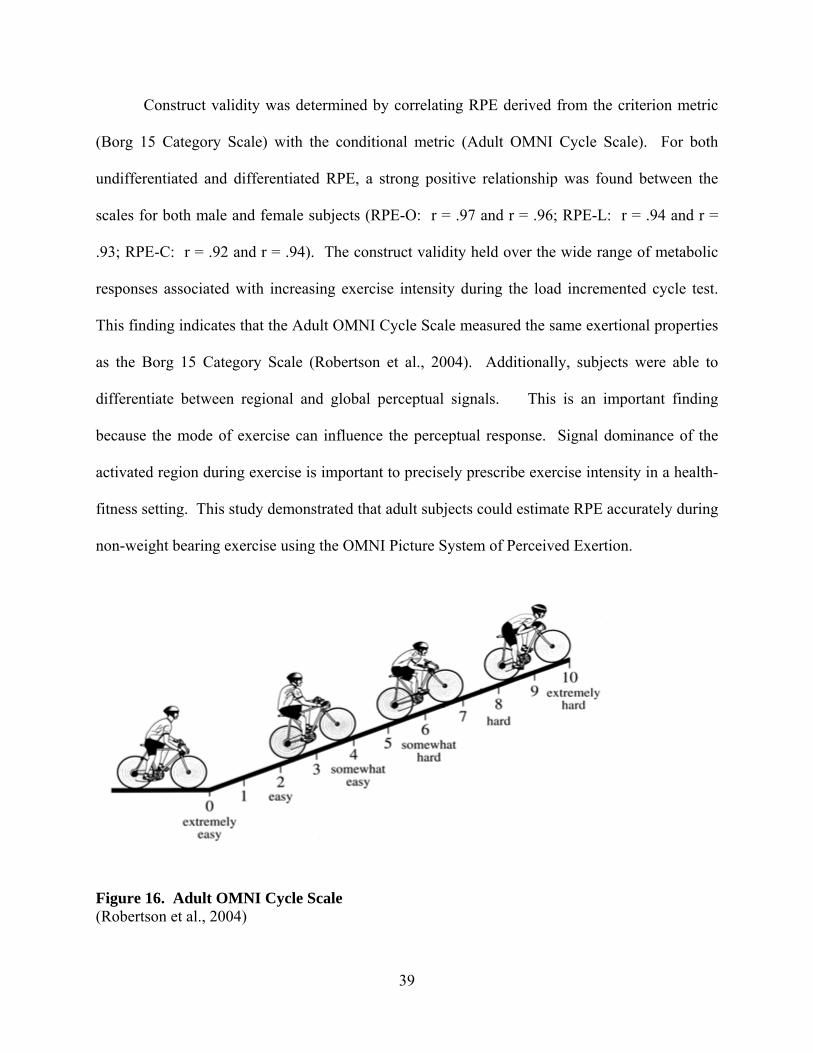
Figure 15. Adult OMNI Resistance Exercise Scale (Robertson et al., 2003) Robertson and colleagues (2004) were the first to develop an OMNI RPE scale for adults
performing aerobic exercise. The Adult OMNI Cycle Scale (Figure 16) was developed for males
and females (24.1 + 3.7; 21.1 + 3.8 yrs) using a cross-sectional, perceptual estimation paradigm.
Concurrent and construct validity was determined for undifferentiated and differentiated RPE.
Concurrent validity of the Adult OMNI Cycle Scale was established by regression analyses of
RPE-O with VO2 (male: r = .94; female: r = .88) and HR (male: r = .90; female: r = .83), RPE-L
with VO2 (male: r = .95; female: r = .87) and HR (male: r = .86; female: r = .81) and RPE-C
with VO2 (male: r = .95; female: r = .90) and HR (male: r = .88; female: r = .82). This finding
is in agreement with Borg’s Range Model; response linearity was established between RPE and
physiological variables from low to high exercise intensities. Additionally, the gender stratified
analysis provides evidence that the gender pictorials do not appear to influence scale validity.
38
Construct validity was determined by correlating RPE derived from the criterion metric
(Borg 15 Category Scale) with the conditional metric (Adult OMNI Cycle Scale). For both
undifferentiated and differentiated RPE, a strong positive relationship was found between the
scales for both male and female subjects (RPE-O: r = .97 and r = .96; RPE-L: r = .94 and r =
.93; RPE-C: r = .92 and r = .94). The construct validity held over the wide range of metabolic
responses associated with increasing exercise intensity during the load incremented cycle test.
This finding indicates that the Adult OMNI Cycle Scale measured the same exertional properties
as the Borg 15 Category Scale (Robertson et al., 2004). Additionally, subjects were able to
differentiate between regional and global perceptual signals. This is an important finding
because the mode of exercise can influence the perceptual response. Signal dominance of the
activated region during exercise is important to precisely prescribe exercise intensity in a health-
fitness setting. This study demonstrated that adult subjects could estimate RPE accurately during
non-weight bearing exercise using the OMNI Picture System of Perceived Exertion.
Figure 16. Adult OMNI Cycle Scale (Robertson et al., 2004)
39

40
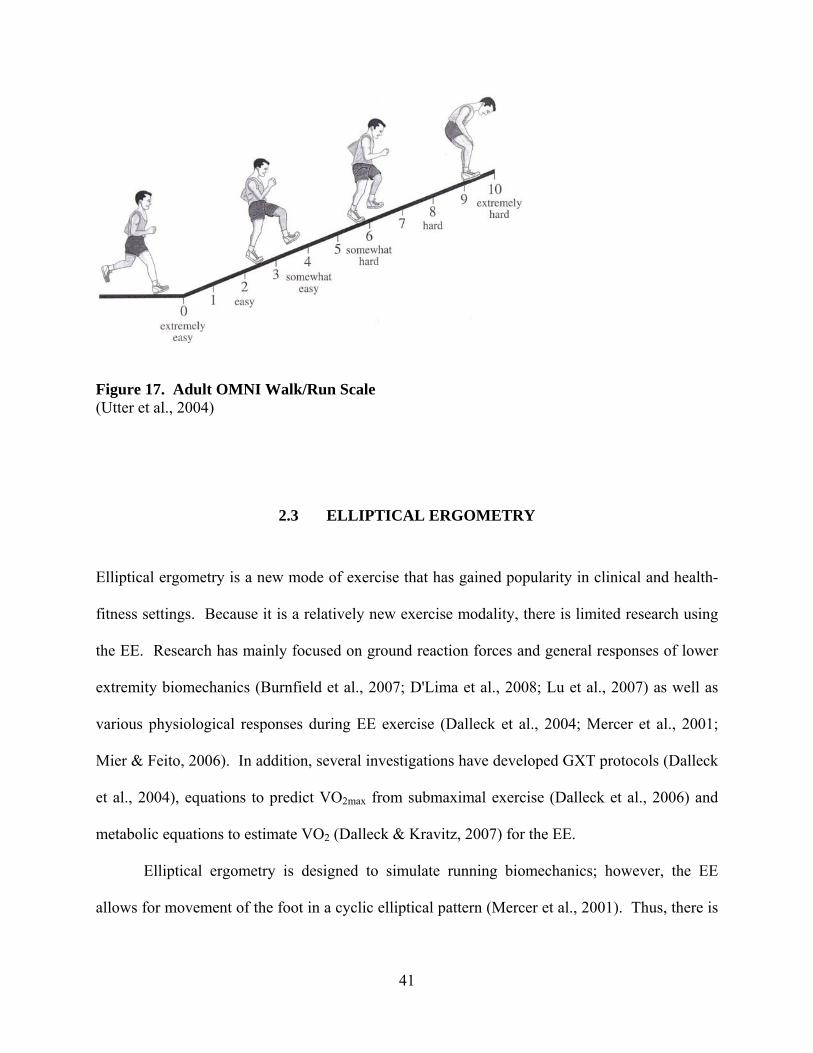
Utter and colleagues (2004) examined the validity of the Adult OMNI Walk/Run Scale
during TM exercise. Similar to the study by Robertson et al. (2004), a perceptual estimation
paradigm was employed for males and females (18-36 yrs) during an incremental TM GXT to
determine concurrent and construct validity. Concurrent validity examined the relationship
between undifferentiated RPE and physiological variables of % VO2max, VE, HR, RR, and RER.
Regression analyses indicated for both males and females, RPE-O from the Adult OMNI
Walk/Run Scale distributed as a positive linear function with % VO2max (r2 = .74 and r2 = .72),
VE (r2 = .61 and r2 = .63), HR (r2 = .57 and r2 = .70), RR (r2 = .48 and r2 = .45) and RER (r2 = .67
and r2 = .77). The linearity of the physiological and perceptual measures is consistent with
Borg’s Effort Continua and Range Models.
Construct validity was also established by the positive relation between RPE derived
from the Adult OMNI Walk/Run Scale and the Borg 15 Category Scale. For males and females,
r values of .96 indicated that the Adult OMNI Walk/Run Scale measured the same properties of
an exertional percept as the Borg 15 Category Scale (Utter et al., 2004). This study indicated
that for a weight bearing aerobic modality, adult subjects were able to estimate RPE using the
OMNI Picture System of Perceived Exertion.
41
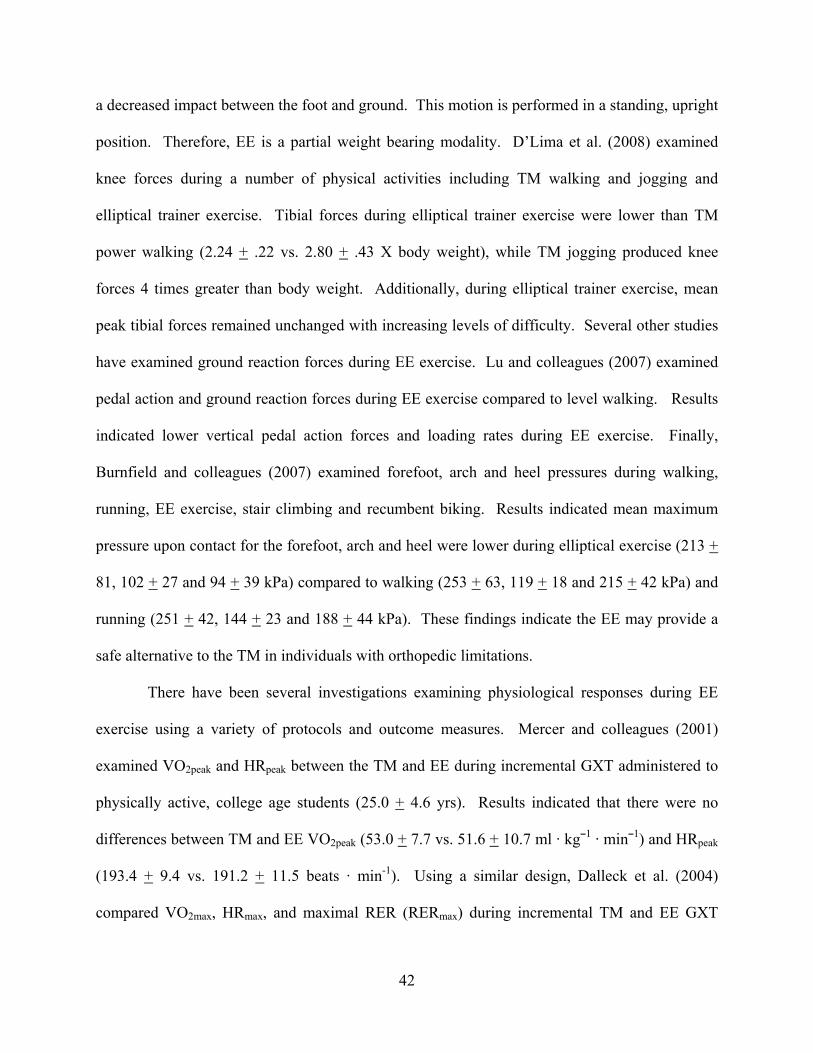
Figure 17. Adult OMNI Walk/Run Scale (Utter et al., 2004)
2.3 ELLIPTICAL ERGOMETRY Elliptical ergometry is a new mode of exercise that has gained popularity in clinical and health-
fitness settings. Because it is a relatively new exercise modality, there is limited research using
the EE. Research has mainly focused on ground reaction forces and general responses of lower
extremity biomechanics (Burnfield et al., 2007; D'Lima et al., 2008; Lu et al., 2007) as well as
various physiological responses during EE exercise (Dalleck et al., 2004; Mercer et al., 2001;
Mier & Feito, 2006). In addition, several investigations have developed GXT protocols (Dalleck
et al., 2004), equations to predict VO2max from submaximal exercise (Dalleck et al., 2006) and
metabolic equations to estimate VO2 (Dalleck & Kravitz, 2007) for the EE.
Elliptical ergometry is designed to simulate running biomechanics; however, the EE
allows for movement of the foot in a cyclic elliptical pattern (Mercer et al., 2001). Thus, there is
42
a decreased impact between the foot and ground. This motion is performed in a standing, upright
position. Therefore, EE is a partial weight bearing modality. D’Lima et al. (2008) examined
knee forces during a number of physical activities including TM walking and jogging and
elliptical trainer exercise. Tibial forces during elliptical trainer exercise were lower than TM
power walking (2.24 + .22 vs. 2.80 + .43 X body weight), while TM jogging produced knee
forces 4 times greater than body weight. Additionally, during elliptical trainer exercise, mean
peak tibial forces remained unchanged with increasing levels of difficulty. Several other studies
have examined ground reaction forces during EE exercise. Lu and colleagues (2007) examined
pedal action and ground reaction forces during EE exercise compared to level walking. Results
indicated lower vertical pedal action forces and loading rates during EE exercise. Finally,
Burnfield and colleagues (2007) examined forefoot, arch and heel pressures during walking,
running, EE exercise, stair climbing and recumbent biking. Results indicated mean maximum
pressure upon contact for the forefoot, arch and heel were lower during elliptical exercise (213 +
81, 102 + 27 and 94 + 39 kPa) compared to walking (253 + 63, 119 + 18 and 215 + 42 kPa) and
running (251 + 42, 144 + 23 and 188 + 44 kPa). These findings indicate the EE may provide a
safe alternative to the TM in individuals with orthopedic limitations.
There have been several investigations examining physiological responses during EE
exercise using a variety of protocols and outcome measures. Mercer and colleagues (2001)
examined VO2peak and HRpeak between the TM and EE during incremental GXT administered to
physically active, college age students (25.0 + 4.6 yrs). Results indicated that there were no
differences between TM and EE VO2peak (53.0 + 7.7 vs. 51.6 + 10.7 ml · kg¯1 · min¯1) and HRpeak
(193.4 + 9.4 vs. 191.2 + 11.5 beats · min-1). Using a similar design, Dalleck et al. (2004)
compared VO2max, HRmax, and maximal RER (RERmax) during incremental TM and EE GXT

43
conducted on twenty, college aged (29.5 + 7.1 yrs) recreationally active subjects. There were no
significant differences between the TM and EE for VO2max (47.9 + 6.8 vs. 47.3 + 6.4 ml · kg¯1 ·
min¯1), HRmax (185.7 + 7.7 vs. 184.4 + 8.8 beats · min-1), and RERmax (1.22 + .10 vs. 1.25 + .09).
Another aim of the Dalleck et al. (2004) study was to develop EE, gender and fitness level
specific protocols. Using the gender and fitness level specific progressively incremented EE
protocols for VO2max assessment, protocol duration was not different between the TM and EE
(11.56 + 1.60 vs. 12.17 + 1.40 min).
2.4 PERCEIVED EXERTION AND ELLIPTICAL ERGOMETRY There have been several investigations that have employed estimation-production paradigms
using the EE in a variety of cohorts (Batte et al., 2003; Green et al., 2004; Sweitzer et al., 2002).
Sweitzer et al. (2002) compared physiological responses at RPE of 10 and 14 from the Borg 15
Category Scale between the TM and EE for CAD patients (63.6 + 9.6 yrs). Results indicated that
VO2 (12.6 + 2.2 vs. 11.2 + 3.4 ml · kg¯1 · min¯1), HR (110.0 + 19.0 vs. 98.0 + 23.0 beats · min-1),
and VE (27.9 + 7.1 vs. 23.6 + 9.6 L· min¯1) were significantly greater during elliptical ergometry
than the TM at a target RPE of 10. For production trials at the target RPE of 14, there were also
significant differences between the EE and TM for HR (127.0 + 13.0 vs. 115.0 + 19 beats · min-
1), VE (40.7 + 7.16 vs. 33.3 + 8.85 L· min¯1), systolic BP (176.0 + 21.0 vs. 166.0 + 19.0 mmHg)
and diastolic BP (75.0 + 10 vs. 69.0 + 7.0 mmHg). These findings indicated that EE exercise
elicited greater cardiopulmonary responses than TM exercise during production bouts at target
RPE of 10 and 14 (Sweitzer et al., 2002).

44
While the study by Sweitzer and colleagues (2002) was one of the first to examine RPE
during EE exercise, congruence of physiological variables between estimation and production
bouts was not established. Batte et al. (2003) compared VO2 and HR responses during an initial
incremental GXT with a production bout at RPE-O of 6 from the Borg CR-10 scale in twenty
physically active subjects (25.3 + 3.4 yrs). The production bout was 15 min in duration with
steady state VO2 and HR values being converted to a percentage of VO2peak and HRpeak attained
from the initial GXT. Relative percentages of VO2 and HR at RPE of 6 were compared between
the two trials. At an RPE of 6 during the production bout, VO2 was 75.2 + 12.9% of the
response from the initial GXT. Additionally, HR during steady state exercise was 91.0 + 6.1 %
of the initial GXT. Results indicated that subjects had higher physiological responses during the
production bout compared to the relative percent intensity from the initial trial. A limitation of
the study was that the Borg CR-10 scale was used rather than a true category scale, such as the
Borg 15 Category Scale.
Green and colleagues (2004) examined RPE-O, L and C using the Borg 15 Category
Scale during TM and EE exercise using an estimation and production paradigm. Twenty two
subjects (21.9 + 2.1 yrs) completed 3 exercise trials: 1) an incremental estimation trial on a TM,
2) an incremental estimation trial using the EE and 3) an EE production bout. Differentiated and
undifferentiated RPE were recorded during each min of the incremental estimation trials. Steady
state was determined at Stage 3 for the TM and EE incremental estimation trials. During the
production bout, subjects were instructed to produce the RPE-O achieved during Stage 3 of the
TM bout. Results indicated no significant differences between the TM and EE estimation trials
for RPE-O and RPE-C (TM: 11.2 + 2.2 and 11.0 + 2.4; EE: 11.9 + 3.2 and 11.7 + 3.2) at the
steady state exercise intensities achieved during Stage 3. In addition, there were no significant

45
differences between HR for TM estimation (163.0 + 16.6 beats · min-1), EE estimation (161.0+
14.7 beats · min-1) and EE production (159 + 20.0 beats · min-1) trials. However, RPE-L was
significantly higher for the EE estimation trial (12.5 + 3.1) compared to TM estimation trial (11.2
+ 2.4). The differentiated perceptual signals, therefore, appear to be mode-specific. The use of
cross-modal applications of RPE is limited; however, if specific scales are validated for
differentiated and undifferentiated responses, mode-specific exercise prescriptions can be
developed.
2.5 CONCLUSIONS The use of RPE has been proven to be a valid metric for use in clinical and health-fitness
settings. The EE is a relatively new and popular exercise mode. RPE research using this mode
of exercise is limited. There have not been previous investigations validating an RPE scale for
elliptical ergometry. Therefore, the primary purpose of this investigation was to develop and
validate mode specific elliptical ergometry OMNI RPE scales examining both differentiated and
undifferentiated perceptual responses throughout a wide range of EE exercise intensities.

46
3.0 METHODS
3.1 SUBJECTS Sixty college-aged (18-34 yrs) males (n = 30) and females (n = 30) were recruited for this
investigation. Subjects were clinically healthy and sedentary to recreationally active (≤160
min·week-1 of activity). Screening of potential subjects was conducted prior to inclusion in the
study to determine risk stratification. Individuals were excluded from the study for the
following:
1. Stratified as “moderate” or “high” risk, according to the ACSM (2006)
2. Answered yes to any of the questions from the Physical Activity Readiness Questionnaire
(PAR-Q)
3. Currently pregnant
4. Orthopedic, cardiovascular or metabolic disorders
5. Pacemakers or automatic implantable defibrillators
6. Current smokers
7. Prior knowledge of RPE
8. Physical activity level >160 min·week-1
9. Past participation in collegiate or professional athletics
47
3.2 RECRUITMENT PROCEDURES Subjects were recruited from the University of Pittsburgh and surrounding regions. The
following procedures were used for recruitment:
1. Advertisements in university newspapers (e.g., Pitt News)
2. Flyers posted throughout the University of Pittsburgh campus
3. Flyers distributed to Basic Instruction classes (e.g., Weight Training, Personal Fitness)
Individuals interested in the study were contacted by the primary investigator by phone or email.
A tentative agreement (Appendix A) to participate in the investigation was provided by the
potential subjects during a phone interview prior to explanation of study details. After
explanation of the nature, risk and potential benefits of the study (Appendix B), all eligible
subjects were scheduled for the testing session. Upon arrival in the Human Energy Research Lab
(HERL) for the scheduled appointment, subjects signed a written informed consent form
(Appendix C) and completed the PAR-Q (Appendix D) and medical history questionnaire
(Appendix E). Additionally, subjects completed the Godin Leisure-Time Exercise Questionnaire
(Godin & Shephard, 1985) (Appendix F) and Baecke Physical Activity Questionnaire (Appendix
G) (Baecke et al., 1982). Subjects who met the criteria for study eligibility and volunteered for
participation then began pre-exercise assessments and testing.

48
3.3 EXPERIMENTAL DESIGN
3.3.1 Pre-test instructions Subjects were instructed to avoid food, tobacco, and caffeine for at least 3 hours prior to the
testing session as well as to refrain from alcohol for at least 24 hours prior to testing (ACSM,
2006). Subjects were also instructed to be adequately hydrated and to not engage in exercise or
strenuous physical activity for 24 hours prior to testing (ACSM, 2006). Subjects were also
instructed to wear exercise clothing, consisting of shorts, T-shirt and athletic shoes.
3.3.2 Pre-test assessments Height was assessed on a Detecto D-439 medical scale with attached stadiometer (Detecto
Scales, Inc., Webb City, MO). Measures were taken with the shoes removed. Height was
recorded to the nearest .5 cm. Weight and body composition were assessed using a Tanita body
fat analyzer (Tanita Corporation of America, Inc. Skokie, IL). Measures were taken with shoes
and socks removed. Weight was recorded to the nearest .5 kg. The % body fat estimates from
the “standard” mode were recorded.
3.3.3 Estimation trial The current investigation consisted of a single observation, cross-sectional perceptual estimation
paradigm. The trial consisted of an incremental GXT on the EE (estimation trial). The Precor
EFX 546 Elliptical Cross-Trainer (Precor, Inc., Woodinville, WA) was used for the EE GXT
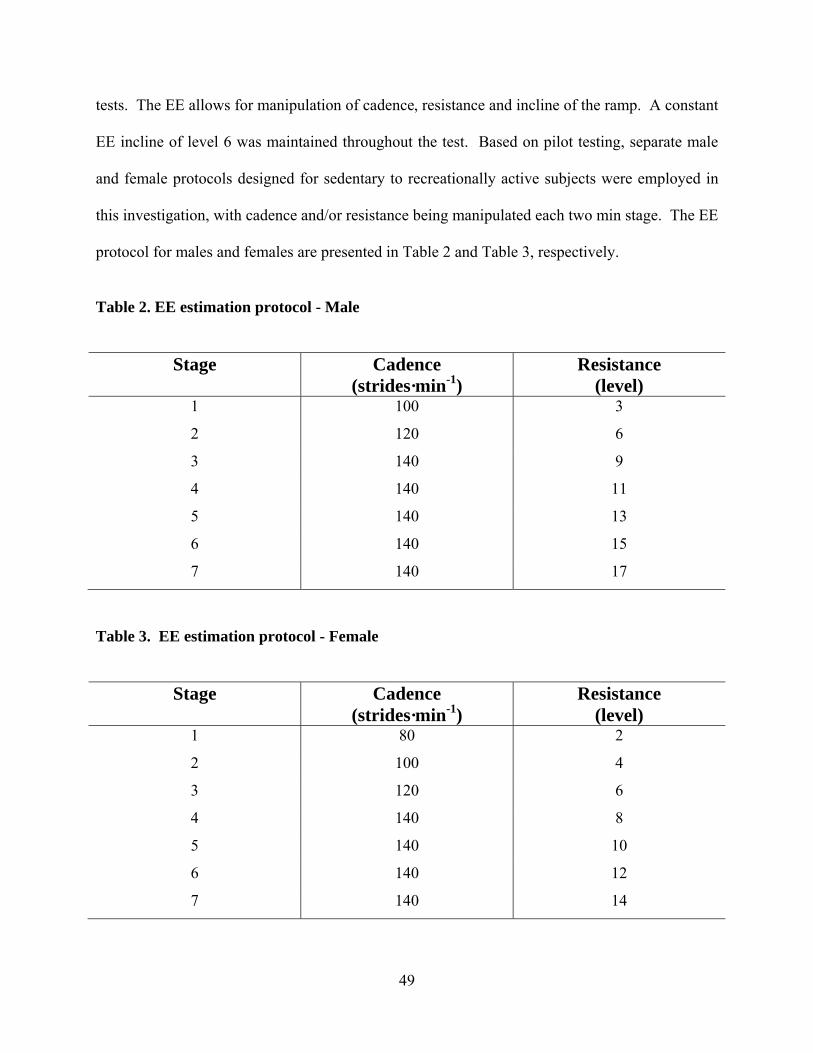
49
tests. The EE allows for manipulation of cadence, resistance and incline of the ramp. A constant
EE incline of level 6 was maintained throughout the test. Based on pilot testing, separate male
and female protocols designed for sedentary to recreationally active subjects were employed in
this investigation, with cadence and/or resistance being manipulated each two min stage. The EE
protocol for males and females are presented in Table 2 and Table 3, respectively.
Table 2. EE estimation protocol - Male
Stage Cadence (strides·min-1)
Resistance (level)
1 100 3
2 120 6
3 140 9
4 140 11
5 140 13
6 140 15
7 140 17
Table 3. EE estimation protocol - Female
Stage Cadence (strides·min-1)
Resistance (level)
1 80 2
2 100 4
3 120 6
4 140 8
5 140 10
6 140 12
7 140 14
50
Subjects maintained cadence by using a metronome (Franz Mfg. Co. Inc., Model XB-
700, New Haven, CO) and the digital display on the EE. The test continued until subjects could
no longer continue due to fatigue or were unable to maintain cadence within 20 strides·min-1 of
the target for 10 consecutive sec. Holding onto the hand rails for support was not permitted,
unless stability was lost and subjects needed to regain their balance. Additionally, subjects could
place their hands in a neutral position with the back of the hands against the side rails of the EE
to maintain balance if needed.
An open circuit respiratory-metabolic system (Parvo Medics, Salt Lake City, UT) was
used to measure absolute (l · min¯1) and relative (ml · kg¯1 · min¯1 STPD) VO2 in 15 sec intervals.
The last two VO2 measurements of each stage were averaged and used in data analyses. A
standard respiratory valve (Rudolph, Model 2700, Kansas City MO) with an adult mouthpiece
was used for all respiratory metabolic measurements. The respiratory-metabolic system was
calibrated before each estimation trial according to the manufacturer’s specifications. A wireless
Polar Monitoring System (Polar Electro, Kempele, Finland) was used to measure HR (beats ·
min-1) each stage. The HR measurement at the end of each stage throughout the estimation trial
was used in data analyses. A transmitter belt was fitted to the subject’s chest, just below the
pectoralis major. A Polar wristwatch was attached to the EE and provided the HR readings.
Total strides from EE digital displays and a pedometer (Hip Pedometer HJ-150, Omron
Healthcare Inc., Bannockburn, IL) were measured at 1:50 of each test stage.
51
3.3.4 OMNI RPE Undifferentiated and differentiated RPE were measured at min 1 of each 2 min stage during the
estimation trial using the Borg 15 Category Scale (Figure 18), the original OMNI Picture System
of Perceived Exertion format for one Adult OMNI RPE Elliptical Ergometry Scale (Figure 19)
and the modified format Adult OMNI RPE Elliptical Ergometry Scale (Figure 20). The order of
RPE measures from the three scales were in counterbalanced order. Additionally, the order that
subjects estimated undifferentiated and differentiated RPE was counterbalanced. Prior to the
start of the estimation trial, definitions for RPE, standard instructions and anchoring procedures
for the Borg 15 Category Scale (Appendix H), the Adult OMNI RPE Elliptical Ergometry Scale
using the original format (Appendix I) and the modified format Adult OMNI RPE Elliptical
Ergometry Scale (Appendix J) were read to subjects. Elliptical ergometer GXT instructions
(Appendix K) were also read to subjects prior to the GXT. The order of instructions and
anchoring procedures for the 3 scales were presented in a counterbalanced order. The
investigator began the session by reading the following definition of RPE: “The perception of
physical exertion is defined as the subjective intensity of effort, strain, discomfort, and/or fatigue
that you feel during exercise” (Noble & Robertson, 1996). Memory anchoring was employed to
establish low and high anchors. This strategy links the subject’s memory of exertion with low
and high exercise intensities. Instructions and anchoring procedures varied for each scale, as the
format for each is different. Each set of instructions identified the low and high verbal,
numerical and/or pictorial descriptors in order to link the subject’s memory of intensity with the
corresponding descriptors. RPE-O, RPE-L and RPE-C were then estimated at 1:00 of each 2:00
min stage during the maximal exercise test, with the 3 scales in full view throughout the GXT. A

mouthpiece was used to direct expired air to the gas analyzers; therefore subjects were unable to
provide a verbal estimate of RPE, thus they responded by pointing to the RPE scales displayed in
front of them. The investigator verbally confirmed each RPE measure. Figure 21 depicts the
flow of the testing session.
Figure 18. Borg 15 Category Scale (Borg, 1985)
52

Figure 19. Original format - Adult OMNI RPE Elliptical Ergometry Scale
Figure 20. Modified format - Adult OMNI RPE Elliptical Ergometry Scale
53

Informed Consent
PAR-Q
Medical History
Physical Activity Questionnaires
Anthropometry
RPE Scale Instructions
Graded Exercise Test
Testing Session
45 –
60
min
Figure 21. Testing Session Model
3.4 STATISTICAL ANALYSES A concurrent validation paradigm employs a two variable scheme: (a) criterion (i.e., stimulus)
variable, and (b) concurrent (i.e., response) variable (Utter et al., 2004). Concurrent validation of
the newly developed OMNI RPE Scales for elliptical ergometry examined the criterion variables
of VO2 and HR, with RPE serving as response variables. The independent variables for this
project were VO2 (i.e., average of last two VO2 measures of each stage) and HR, with RPE being
the dependent variable at each test stage. The relationship between the independent and
dependent variables were examined using correlation analyses accounting for clustering
throughout the wide range of exercise intensities from the GXT. Data were screened for
univariate and multivariate outliers between RPE and each of the physiological variables.
Correlation analyses accounting for clustering were also used to determine the relationship
54

55
between RPE determined from the Elliptical Ergometry Scales and the Borg 15 Category Scale.
A separate analysis was conducted for each new Elliptical Ergometry Scale. Additionally, a
separate analysis was conducted for men and women in the present investigation. This
established gender specific validity in sedentary to recreationally active college-aged males and
females, as has been previously reported in other OMNI RPE validation studies (Robertson et al.,
2004; Utter et al., 2004). Thus, it was expected that positive correlations would be observed for
the separate male and female cohorts, thus providing concurrent and construct validation of the
OMNI RPE Elliptical Ergometry Scales. Data were also examined to determine the number of
subjects that estimated their perceived exertion as “0” from the new OMNI RPE scales and “6”
from the Borg 15 Category scale in the first stage of the GXT. Tests of marginal homogeneity
were performed with McNemar’s test to determine differences between frequency data
responses. Significance was set at α = .05. Statistical analyses were performed with the
Statistical Package for the Social Sciences, Version 16.0 (SPSS Inc., Chicago, IL).

56
4.0 RESULTS The purpose of this investigation was to develop and validate two OMNI RPE scales for use
during elliptical ergometry in adult men and women. Subjects performed a GXT on an elliptical
ergometer. Oxygen uptake, HR and differentiated and undifferentiated RPE were determined
during each test stage. In order to establish concurrent validity of the newly developed OMNI
RPE scales, correlation analyses were performed between RPE and absolute (l · min¯1) and
relative (ml · kg¯1 · min¯1) VO2 as well as HR. Separate correlation analyses were performed on
the differentiated and undifferentiated RPE obtained from each new scale. In addition, separate
correlation analyses were conducted on data from the male and female subjects to establish
gender specific concurrent validity. In order to establish construct validity of the newly
developed OMNI RPE scales, correlation analyses were performed between RPE-O from the
Borg 15 Category Scale with RPE-O from the Elliptical Ergometry Scales. The same analyses
were used for RPE-L and C to establish construct validity for differentiated perceptual responses.
These analyses were also performed separately for each new RPE scale and gender.
4.1 SUBJECTS Sixty college-aged (18-34 yrs) males (n = 30) and females (n = 30) were recruited for this
investigation. It was determined from scatterplots between physiological variables and RPE for

57
each test stage that one female subject was a perceptual outlier and was excluded from data
analyses. Subject characteristics are presented in Table 4.
Table 4. Subject characteristics
Males (n = 30)
Females (n = 29)
Age (yrs) 21.3 + 3.3 22.3 + 3.5
Height (cm) 178.5 + 8.0 166.2 + 7.1
Weight (kg) 73.6 + 9.2 62.9 + 7.9
Body fat (%) 14.2 + 3.4 26.3 + 5.5
VO2peak (l · min¯1) 3.1 + 0.6 2.3 + 0.4
VO2peak (ml · kg¯1 · min¯1) 42.6 + 6.8 37.4 + 5.4
Data are means + SD.
4.2 CONCURRENT VALIDITY A primary research objective of this investigation was to establish concurrent validity of two
newly developed Adult OMNI RPE Elliptical Ergometry Scales. The “original format” scale
maintained the same verbal and pictorial descriptor placement on a gradient incline as the
original OMNI Picture System of Perceived Exertion. However, the new scale included mode
specific intensity pictorials. The second Adult OMNI RPE Elliptical Ergometry Scale (i.e.,
modified format) was a new version of the OMNI Picture System of Perceived Exertion that
included the verbal descriptor “rest”. The relation between RPE-O, L and C from the original

58
and modified format of the Adult OMNI Elliptical Ergometry Scale and VO2 and HR were
examined separately throughout a wide range of exercise intensities to establish concurrent
validity. The correlations were examined within-subjects accounting for clustering (i.e., nested
structure – observations nested within subjects) for both male and female subjects. The analysis
demonstrated a very strong relation (males, r = .944 - .951 and females, r = .930 - .946) between
RPE-O, L and C from the original format Adult OMNI Elliptical Ergometry Scale with absolute
and relative VO2. RPE-O, L and C from the modified format Adult OMNI Elliptical Ergometry
Scale also exhibited a very strong (males, r = .941 - .947 and females, r = .931 - .945) relation
with absolute and relative VO2. Additionally, a very strong positive linear relation was exhibited
between RPE-O, L and C from the original format scale with HR (males, r = .955 - .960 and
females, r = .963 - .966). RPE-O, L and C from the modified format scale also demonstrated a
very strong relation with HR (males, r = .950 - .953 and females, r = .967 - .965). Results of
correlational analyses are presented in Table 5.

59
Table 5. Relation between physiological variables and OMNI RPE
Gender Criterion RPE Original Format
r*
Modified Format
r*
Males VO2 (l · min¯1) O .946 .942 L .945 .946 C .951 .942 VO2 (ml · kg¯1 · min¯1) O .944 .942 L .947 .947 C .949 .941 HR (beats · min¯1) O .955 .951 L .960 .953 C .959 .950
Females VO2 (l · min¯1) O .946 .945 L .932 .933 C .943 .938 VO2 (ml · kg¯1 · min¯1) O .942 .941 L .930 .931 C .939 .936 HR (beats · min¯1) O .965 .965 L .966 .965 C .963 .957
*ps < .001
4.3 CONSTRUCT VALIDITY Another primary objective of this investigation was to establish construct validity of the newly
developed OMNI RPE scales for use during elliptical ergometry exercise. The Borg 15 Category

60
Scale was used as the criterion metric, with the original format and modified format Adult OMNI
RPE Elliptical Ergometry Scales as the conditional metrics. The relation between RPE-O, L and
C from the original and modified format of the Adult OMNI RPE Elliptical Ergometry Scale and
RPE-O, L and C from the Borg 15 Category Scale were examined throughout a wide range of
exercise intensities. The within-subjects correlations accounting for clustering indicated the
relation of RPE-O, L and C between the Borg 15 Category Scale and the original format Adult
OMNI RPE Elliptical Ergometry Scale were very strong (males, r = .963 - .972 and females, r =
.975 - .977). The analysis also indicated the relation between RPE-O, L and C from the Borg 15
Category Scale and the modified format Adult OMNI RPE Elliptical Ergometry Scale were very
strong (males, r = .961 - .971 and females, r = .973). Results of the correlational analyses are
presented in Table 6.
Table 6. Relation between Borg RPE and OMNI RPE
Gender Borg RPE OMNI RPE Original Format
r*
Modified Format
r*
Males O O .963 .961
L L .972 .971
C C .965 .968
Females O O .976 .973
L L .977 .973
C C .975 .973
*ps < .001

4.4 FREQUENCY DATA Figure 22 and Figure 23 depict frequency data for the subjects that responded with a “0” from
the OMNI RPE scales and a “6” from the Borg 15 Category Scale during the first stage of the
GXT for both males and females, respectively. Both the differentiated and undifferentiated RPE
are presented in the figures. There were no differences among responses of “0” for the new
OMNI RPE scales and “6” on the Borg Scale for RPE-O, L and C for both males and females, ps
> .05.
0
1
2
3
4
5
6
Borg Scale Original Format Modified Format
Freq
uenc
y of
"0"
and
"6" R
PE re
spon
ses
Overall Legs Chest/Breathing
Figure 22. Frequency distribution of low perceptual responses - Male
61

0
1
2
3
4
5
6
7
8
9
Borg Scale Original Format Modified Format
Freq
uenc
y of
"0"
and
"6" R
PE re
spon
ses
Overall Legs Chest/Breathing
Figure 23. Frequency distribution of low perceptual responses - Female
62

63
5.0 DISCUSSION The primary purpose of this investigation was to establish concurrent and construct validity of an
Adult OMNI RPE Elliptical Ergometry Scale using the original format of the OMNI Picture
System of Perceived Exertion and for a modified format of the Adult OMNI RPE Elliptical
Ergometry Scale of Perceived Exertion for men and women. The relation between RPE-O, L
and C from the Adult OMNI RPE Elliptical Ergometry Scales and VO2 and HR were examined
to establish concurrent validity. The relation between RPE-O, L and C from the Adult OMNI
RPE Elliptical Ergometry Scales and RPE-O, L and C from the Borg 15 Category Scale were
examined to establish construct validity. To date, no investigations have examined the validity
of a modified scale format of the OMNI Picture System of Perceived Exertion in adult males and
females. Additionally, there have been no investigations examining the validity of OMNI RPE
scales for use in partial weight bearing exercise.
5.1 CONCURRENT AND CONSTRUCT VALIDITY Concurrent validation paradigms have been used extensively in the development of the OMNI
Picture System of Perceived Exertion for children and adults (Robertson et al., 2005a; Robertson
et al., 2005b; Robertson et al., 2000; Robertson et al., 2004; Robertson et al., 2003; Roemmich et
al., 2006; Utter et al., 2004; Utter et al., 2002). Thus, it was expected that as VO2 and HR
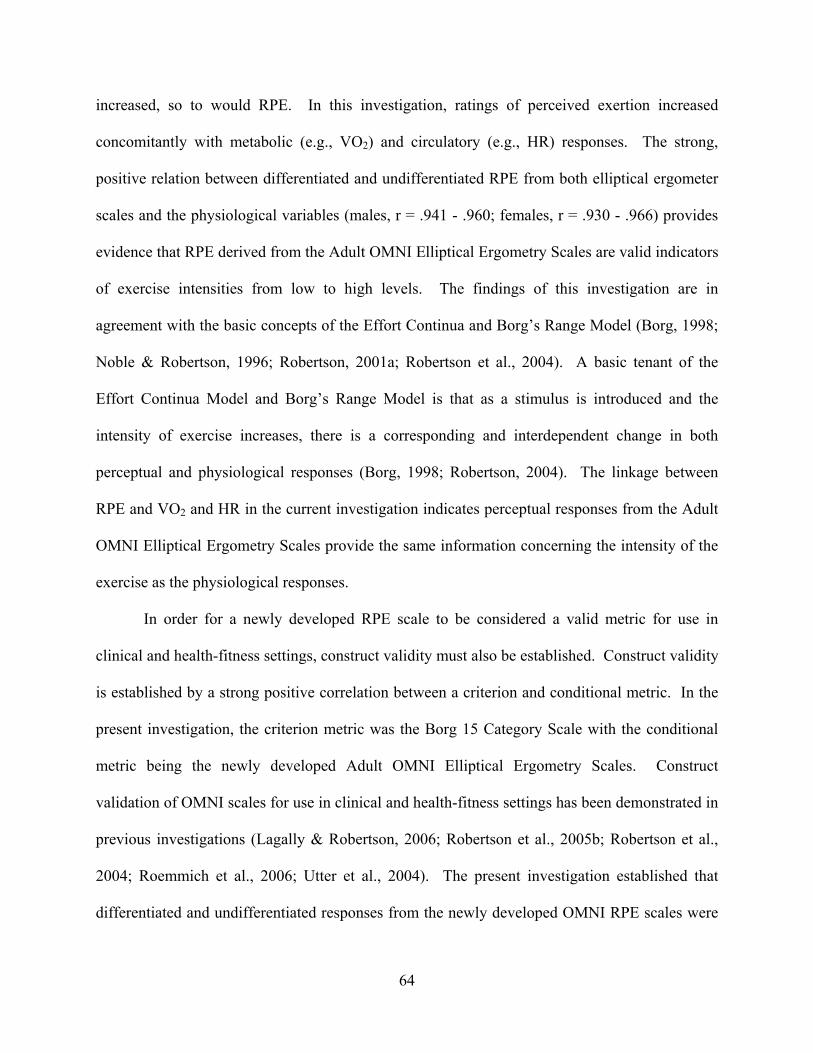
64
increased, so to would RPE. In this investigation, ratings of perceived exertion increased
concomitantly with metabolic (e.g., VO2) and circulatory (e.g., HR) responses. The strong,
positive relation between differentiated and undifferentiated RPE from both elliptical ergometer
scales and the physiological variables (males, r = .941 - .960; females, r = .930 - .966) provides
evidence that RPE derived from the Adult OMNI Elliptical Ergometry Scales are valid indicators
of exercise intensities from low to high levels. The findings of this investigation are in
agreement with the basic concepts of the Effort Continua and Borg’s Range Model (Borg, 1998;
Noble & Robertson, 1996; Robertson, 2001a; Robertson et al., 2004). A basic tenant of the
Effort Continua Model and Borg’s Range Model is that as a stimulus is introduced and the
intensity of exercise increases, there is a corresponding and interdependent change in both
perceptual and physiological responses (Borg, 1998; Robertson, 2004). The linkage between
RPE and VO2 and HR in the current investigation indicates perceptual responses from the Adult
OMNI Elliptical Ergometry Scales provide the same information concerning the intensity of the
exercise as the physiological responses.
In order for a newly developed RPE scale to be considered a valid metric for use in
clinical and health-fitness settings, construct validity must also be established. Construct validity
is established by a strong positive correlation between a criterion and conditional metric. In the
present investigation, the criterion metric was the Borg 15 Category Scale with the conditional
metric being the newly developed Adult OMNI Elliptical Ergometry Scales. Construct
validation of OMNI scales for use in clinical and health-fitness settings has been demonstrated in
previous investigations (Lagally & Robertson, 2006; Robertson et al., 2005b; Robertson et al.,
2004; Roemmich et al., 2006; Utter et al., 2004). The present investigation established that
differentiated and undifferentiated responses from the newly developed OMNI RPE scales were

65
strongly related to differentiated and undifferentiated responses from the Borg 15 Category Scale
(males, r = .961 - .972; females, r = .973 - .977). Thus, the newly developed OMNI RPE scales
measured the same properties of the exertional precept as the Borg 15 Category Scale.
This investigation established gender specific validity indicating that the scales can be
used for sedentary to recreationally active, college age males and females. These responses are
similar to previous investigations that examined gender stratified analyses in various exercise
modalities (Lagally & Robertson, 2006; Pfeiffer et al., 2002; Robertson et al., 2005a; Robertson
et al., 2005b; Robertson et al., 2000; Robertson et al., 2004; Robertson et al., 2003; Utter et al.,
2004; Utter et al., 2002). These findings are critical for the establishment of valid metrics for use
in males and females for a specific exercise modality. Additionally, the current investigation
used male pictorial descriptors. Similar correlational values were observed for male and female
subjects; thus the use of male pictorial descriptors did not differentially influence the validity of
the newly developed scales.
Concurrent validity was established for differentiated and undifferentiated perceptual
responses separately for each of the newly developed OMNI RPE scales used in this
investigation. The positive linear relation between RPE-O and VO2 ml · kg¯1 · min¯1 (males, r =
.942 - .944; females, r = .941 - .942), VO2 l · min¯1(males, r = .942 - .946 - .951; females, r =
.945 - .946) and HR beats · min¯1 (males, r = .951 - .955; females, r = .965) demonstrated that the
global perceptions of effort were valid throughout the wide range of exercise intensities.
Additionally, the relation between RPE-L and RPE-C with VO2 ml · kg¯1 · min¯1 (males, r = .947
and r = .941 - .949; females, r = .930 - .931 and r = .936 - .939), VO2 l · min¯1 (males, r = .945 -
.946 and r = .942 - .951), and HR beats · min¯1 (males, r = .953 - .960 and r = .950 - .959;
females, r = .965 - .966 and r = .957 - .963) distributed as a positive linear function from low to

66
high levels of exercise. This demonstrates that RPE from the newly developed Adult OMNI
Elliptical Ergometry Scales are valid indicators of global, regional skeletal muscle and central
and/or cardio-pulmonary exertional perceptions. The response validity demonstrated in the
current investigation is in agreement with previous OMNI RPE concurrent validation studies
examining differentiated and undifferentiated RPE (Lagally & Robertson, 2006; Robertson et al.,
2005a; Robertson et al., 2005b; Robertson et al., 2000; Robertson et al., 2004; Robertson et al.,
2003). Construct validity of the current investigation examined the relation between
undifferentiated RPE-O derived from the Adult OMNI Elliptical Ergometry scales (conditional)
and RPE-O from the Borg 15 Category Scale (criterion). The strong positive relation (males, r =
.961 - .963; females, r = .973 - .976) between RPE-O from the Adult OMNI Elliptical Ergometry
Scales with the Borg 15 Category Scale demonstrated that the newly developed scales measure
the same global perceptual constructs as the Borg Scale. Additionally, the relation between
differentiated perceptual responses between the criterion and conditional metrics (males, RPE-L:
r = .971 - .971 and RPE-C: r = .965 - .968; females, RPE-L: r = .973 - .977, RPE-C: r = .973 -
.975) demonstrated that RPE defined to a specific region of the body is essentially the same
regardless of the scale.
5.2 ORIGINAL FORMAT VS. MODIFIED FORMAT The present investigation was the first to examine validity of different OMNI RPE scale formats
developed for a partial weight bearing modality (Figure 19 and Figure 20). Both scales
maintained the category scale properties of the OMNI Picture System of Perceived Exertion.
The original format of the OMNI Picture System of Perceived Exertion was used for the
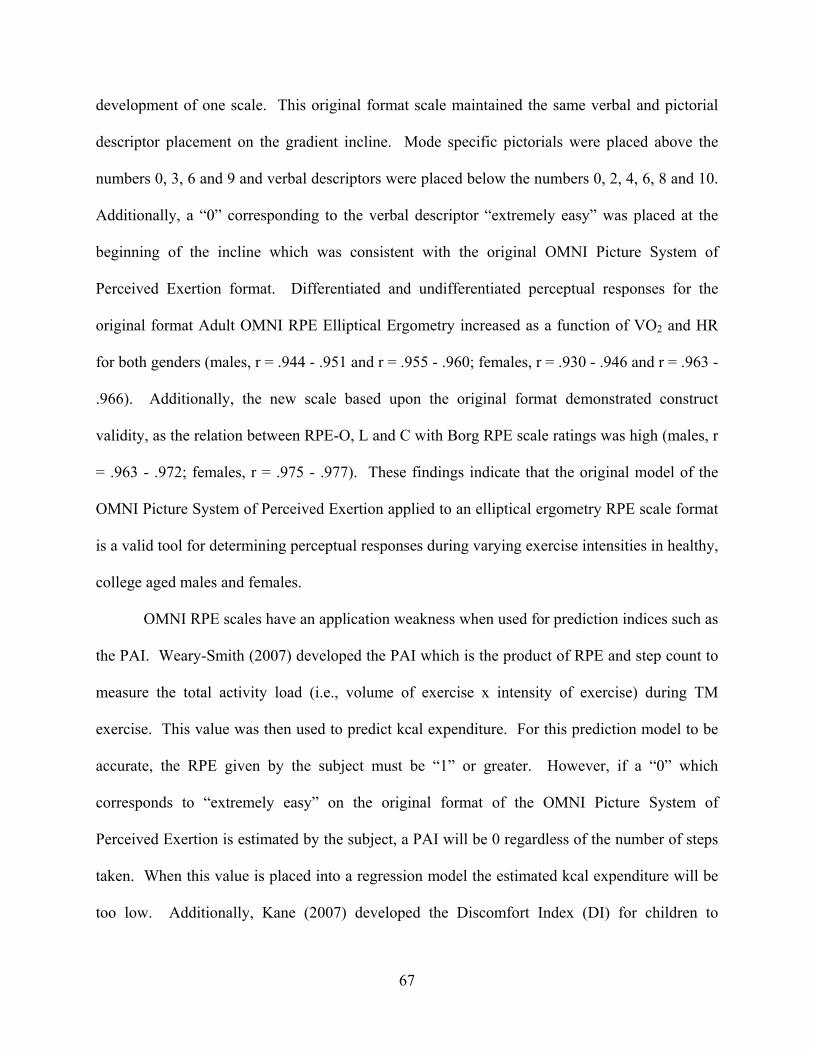
67
development of one scale. This original format scale maintained the same verbal and pictorial
descriptor placement on the gradient incline. Mode specific pictorials were placed above the
numbers 0, 3, 6 and 9 and verbal descriptors were placed below the numbers 0, 2, 4, 6, 8 and 10.
Additionally, a “0” corresponding to the verbal descriptor “extremely easy” was placed at the
beginning of the incline which was consistent with the original OMNI Picture System of
Perceived Exertion format. Differentiated and undifferentiated perceptual responses for the
original format Adult OMNI RPE Elliptical Ergometry increased as a function of VO2 and HR
for both genders (males, r = .944 - .951 and r = .955 - .960; females, r = .930 - .946 and r = .963 -
.966). Additionally, the new scale based upon the original format demonstrated construct
validity, as the relation between RPE-O, L and C with Borg RPE scale ratings was high (males, r
= .963 - .972; females, r = .975 - .977). These findings indicate that the original model of the
OMNI Picture System of Perceived Exertion applied to an elliptical ergometry RPE scale format
is a valid tool for determining perceptual responses during varying exercise intensities in healthy,
college aged males and females.
OMNI RPE scales have an application weakness when used for prediction indices such as
the PAI. Weary-Smith (2007) developed the PAI which is the product of RPE and step count to
measure the total activity load (i.e., volume of exercise x intensity of exercise) during TM
exercise. This value was then used to predict kcal expenditure. For this prediction model to be
accurate, the RPE given by the subject must be “1” or greater. However, if a “0” which
corresponds to “extremely easy” on the original format of the OMNI Picture System of
Perceived Exertion is estimated by the subject, a PAI will be 0 regardless of the number of steps
taken. When this value is placed into a regression model the estimated kcal expenditure will be
too low. Additionally, Kane (2007) developed the Discomfort Index (DI) for children to

68
determine the discomfort associated with exercise. The DI was the product of RPE and leg
muscle hurt. Similar to the PAI, if an RPE of “0” is given by the subject, an inaccurately low DI
value will result. Thus, the rationale for developing a modified version of the OMNI Picture
System of Perceived Exertion was its potential use in prediction indices such as the PAI and the
Exercise Discomfort Index. The modified format Adult OMNI RPE Elliptical Ergometry Scale
replaced the “extremely easy” verbal descriptor with the term “rest”. It was thought that there
could be interindividual differences when interpreting “extremely easy” levels of exertion at the
lower end of the response range. For example, a healthy young adult male or female who is
resting and not performing exercise or physical activity could interpret the intensity as
“extremely easy” since “rest” is not an option. However, when exercising at a low level intensity
(e.g., first stage of an exercise test, walking at a slow pace) the same individual could interpret
the intensity as “extremely easy”, and rate their exertion as “0”. Thus, physiological variables
such as VO2, HR and caloric expenditure would be higher than resting values, but “0” could be
the perceptual response given by the subject at rest and during exercise. When used in prediction
models such as the PAI, inaccurate predictions of caloric expenditure would occur. The “0” was
also repositioned below the level portion of the scale. The verbal descriptor “rest” was placed
below the “0” numerical descriptor, with a newly developed “rest” pictorial. Additionally, the
instructions for the scale were changed from the original OMNI RPE format instructions to the
following: ”Please look at the person at the bottom of the hill who is at rest. You should feel like
this person now when you are not exercising. In this case, your rating should be the number 0.”
The strong relation between the physiological (i.e., VO2 and HR) and perceptual variables
throughout the wide range of exercise intensities (males, r = .941 - .947 and r = .950 - .953;
females, r = .931 - .945 and r = .957 - .965) indicated that the changes to the low response zone

69
of the scale did not affect concurrent validity. Additionally, the modified format scale
demonstrated construct validity, as the relation between RPE-O, L and C with Borg RPE scale
ratings was high (males, r = .961 - .971; females, r = .973).
It should also be noted that Borg modified the original 6-20 category scale at the low
response zones (Borg, 1985). The artificial “zero” or starting point, “6”, was changed to “no
exertion at all”. In the older version of the scale there was no verbal expression after the first
number (Borg, 1971). Instead the first verbal descriptor was “very, very light” and appeared
after the number “7”. The changes to the modified format OMNI RPE Elliptical Ergometry
Scale were similar to the modifications Borg (1998) made to the Borg 15 Category Scale. The
frequency of subjects responding with a “6” and “0” for differentiated and undifferentiated
perceived exertion did not differ for the Borg Scale (2 males; 4 females) and the modified format
OMNI RPE scale (2 males; 3-4 females) when compared to the original format OMNI RPE scale
(3-5 males; 5-8 females). However, these findings suggest that there may be intra and
interindividual interpretations of the “extremely easy” verbal descriptor. Several subjects did
interpret the first stage of the GXT as “rest” and “no exertion at all”; however, the majority of
subjects were able to estimate the level of exertion associated with low levels of exercise (e.g.,
first stage of GXT) as being “1” or greater.
5.3 FUTURE RESEARCH Previous research examining RPE scaling specific to partial weight bearing exercise is limited.
As such this was the primary focus in the current investigation. Additionally, changes to the
OMNI Picture System of Perceived Exertion formats were examined. Based on the present

70
results, the following areas should be examined to further expand the perceived exertion
knowledge base:
1. A number of investigations have determined RPE to be a valid tool for regulating
intensity using various exercise modalities and population cohorts (Ceci & Hassmen,
1991; Dunbar et al., 1992; Eston et al., 1987; Groslambert et al., 2005; Kang et al., 1998;
Kang et al., 2003; Marriott & Lamb, 1996; Robertson et al., 2002). Self-regulation of
exercise intensity using RPE during elliptical exercise should be a next step in examining
the use of the Adult OMNI RPE Elliptical Ergometry Scales in health-fitness settings.
2. A potential improvement on standard estimation-production paradigms is the concept of
teleoanticipation. Teleoanticipation employs cognitive feedback and additional practice
trials to reduce the error in self-regulated exercise intensity. Future investigations should
examine the use of teleoanticipation to improve the accuracy in self-regulating exercise
intensities based on submaximal RPE during elliptical ergometry.
3. Based on pilot testing, the current investigation used separate, gender specific GXT
protocols for the estimation trial. To date, only one study has been published with a
primary purpose of developing a GXT protocol for elliptical ergometry (Dalleck et al.,
2004); however, the previously developed protocol was not used for the current study as
the duration of each stage (i.e. increased intensity in 1 min increments) was not long
enough for the measurement of RPE. Future studies should focus on developing valid
and reliable GXT protocols for elliptical ergometry using longer stage duration times
(e.g. 3 min stages).

71
4. There may be an advantage in using elliptical ergometry for patients with orthopedic
limitations. Future studies should examine the newly developed Adult OMNI Elliptical
Ergometry Scales to determine if signal dominance is greater in these individuals.
Additionally, studies should examine if rehabilitation time and/or comorbid conditions
influence the validity and reliability of the newly developed scales in these population
cohorts.
5. The current investigation used a Precor EFX 546 Elliptical Cross-Trainer (Precor, Inc.,
Woodinville, WA) for the estimation trial. There are a number of commercially available
elliptical ergometers currently used in health-fitness settings which may have different
gait cycles and stride lengths. Additionally, several models make use of arms and legs
while exercising. Thus, future investigations should examine RPE responses using
different elliptical ergometer models.
6. There have been few studies examining cross-modal application of OMNI RPE scales
(Pfeiffer et al., 2002; Robertson, 2001b). Future studies should examine intermodal
applications of OMNI RPE scales developed for weight bearing, non-weight bearing and
partial weight bearing exercise modalities.
7. The present experimental paradigm examined different formats of the OMNI Picture
System of Perceived Exertion by adjusting the low end of the response zone. Future
studies should develop new strategies for educating and anchoring subjects when using

72
OMNI RPE scales, particularly at the low end of the response zone. Additionally, future
studies should examine the validity of different scale formats across the entire response
range (e.g., 10 vs. 11 categories, placement and number of verbal and pictorial
descriptors).
8. The present study utilized a cross-sectional, within-subjects design for validation of the
two newly developed OMNI RPE scales. Future investigations should employ several
groups (e.g. between-subjects design) when validating multiple scales to eliminate
potential bias introduced from multiple RPE measurements during a GXT.
9. To date, only one study has examined the reliability of RPE using OMNI RPE scales
(Pfeiffer et al., 2002). Future investigations should examine test-retest reliability of
OMNI RPE scales to establish the consistency and repeatability of RPE measured during
exercise and physical activity.
10. The present investigation did not employ semantic differential analysis for the modified
format OMNI RPE scale as it was deemed equal interval criterion of category scales
would be satisfied with the “rest” verbal descriptor at the low end of the scale. Future
development of OMNI RPE scales should employ semantic differential analysis when
modifying the original format of the OMNI Picture System of Perceived Exertion.
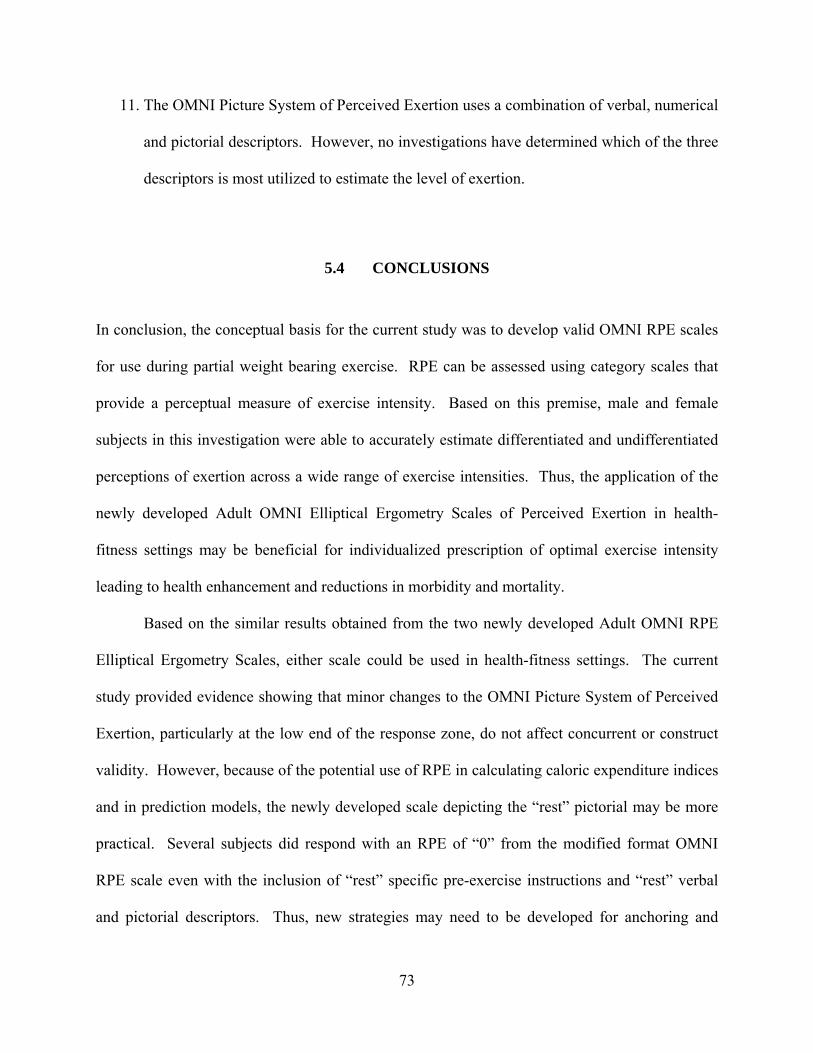
73
11. The OMNI Picture System of Perceived Exertion uses a combination of verbal, numerical
and pictorial descriptors. However, no investigations have determined which of the three
descriptors is most utilized to estimate the level of exertion.
5.4 CONCLUSIONS In conclusion, the conceptual basis for the current study was to develop valid OMNI RPE scales
for use during partial weight bearing exercise. RPE can be assessed using category scales that
provide a perceptual measure of exercise intensity. Based on this premise, male and female
subjects in this investigation were able to accurately estimate differentiated and undifferentiated
perceptions of exertion across a wide range of exercise intensities. Thus, the application of the
newly developed Adult OMNI Elliptical Ergometry Scales of Perceived Exertion in health-
fitness settings may be beneficial for individualized prescription of optimal exercise intensity
leading to health enhancement and reductions in morbidity and mortality.
Based on the similar results obtained from the two newly developed Adult OMNI RPE
Elliptical Ergometry Scales, either scale could be used in health-fitness settings. The current
study provided evidence showing that minor changes to the OMNI Picture System of Perceived
Exertion, particularly at the low end of the response zone, do not affect concurrent or construct
validity. However, because of the potential use of RPE in calculating caloric expenditure indices
and in prediction models, the newly developed scale depicting the “rest” pictorial may be more
practical. Several subjects did respond with an RPE of “0” from the modified format OMNI
RPE scale even with the inclusion of “rest” specific pre-exercise instructions and “rest” verbal
and pictorial descriptors. Thus, new strategies may need to be developed for anchoring and

74
educating subjects prior to using OMNI RPE scales with “0” as the first numerical descriptor.
OMNI RPE scales may need to be developed using an exercise only 10 numerical category
format (i.e. 1-10 response range without “rest” verbal and pictorial descriptors). The findings
from the present investigation are important for improving upon the methodological and
semantic limitations of RPE scales.

APPENDIX A
Verbal Consent Form University of Pittsburgh
It is important that you read this page in order to give the participant an understanding of what is required of them and their right as a participant to refuse to participate at any time. Before we get started with the phone interview I want to give you an overview of what we will be doing. Then I will start by asking you questions about your current health status as it relates to physical activity or exercise. This should take only a few minutes. Your participation is completely voluntary. You may refuse to answer any question I might ask and all of your responses are completely confidential. Your name is never associated with the results of the study. All findings of this research will be reported only in summary form so that no individuals can be identified. Once we have completed the phone interview, I am going to schedule you for your exercise session. Do I have your consent to begin the interview? Verbal Consent Agreement Participant gives verbal permission to conduct phone interview: Yes ___ No ___ Verbal Consent was given to: ______________________________ (Print Name) ______________________________ (Signature) ______________________________ (Date)
75

76
APPENDIX B
Explanation of Study and Phone Interview – Nature, Risks and Benefits -This study will be conducted on an elliptical exercise machine. The exercise test will begin at a low level of intensity and increase in intensity every 2 minutes. This will continue until you can no longer continue do to fatigue or inability to maintain a predetermined cadence on the elliptical exercise machine. -I want to briefly discuss with you the risks associated with this study. Abnormal responses, such as excessive rises in blood pressure, mental confusion, shortness of breath, chest pain, heart attack, and death, to maximal aerobic exercise tests in young healthy adults are rare, occurring in less than 1% of people (less than 1 out of 100 people tested). Some common risks, occurring in 1% to 25% of people (1 to 25 out of 100 people tested), of maximal exercise testing include: heavy breathing, dizziness, muscle fatigue, headache, and overall fatigue. -The benefits of this test include a detailed report of your body fat% and aerobic fitness level. You will also receive $40 upon completion of the testing session. If you are interested in participating in this study, I would like to ask you a few questions to determine if you appear to be eligible:
1. Do you have any orthopedic, cardiovascular and/or metabolic conditions? yes______no______ Comments:___________________________________________
2. Have you smoked in the last 6 months? yes______no______Comments:___________________________________________
3. How many minutes of aerobic exercise do you complete in a given week?
yes______no______Comments:___________________________________________
4. Have you participated in collegiate or professional athletics? yes______no______Comments:___________________________________________ Do you have any questions?
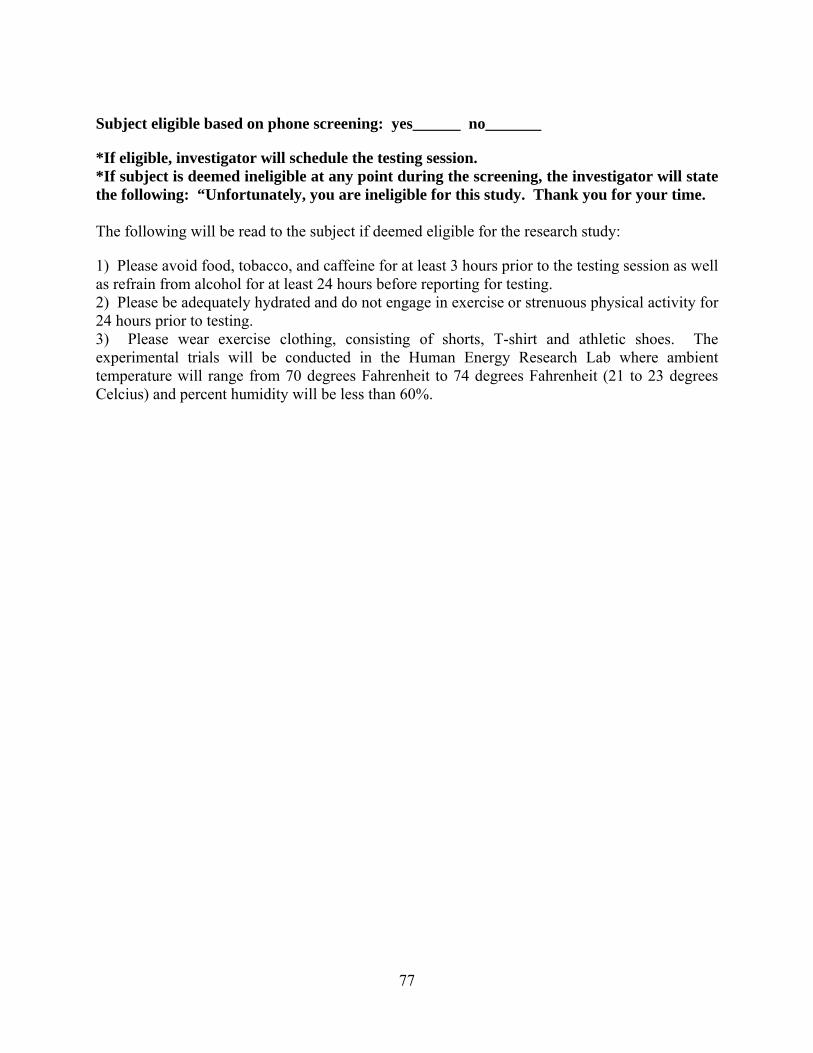
77
Subject eligible based on phone screening: yes______ no_______
*If eligible, investigator will schedule the testing session. *If subject is deemed ineligible at any point during the screening, the investigator will state the following: “Unfortunately, you are ineligible for this study. Thank you for your time. The following will be read to the subject if deemed eligible for the research study:
1) Please avoid food, tobacco, and caffeine for at least 3 hours prior to the testing session as well as refrain from alcohol for at least 24 hours before reporting for testing. 2) Please be adequately hydrated and do not engage in exercise or strenuous physical activity for 24 hours prior to testing. 3) Please wear exercise clothing, consisting of shorts, T-shirt and athletic shoes. The experimental trials will be conducted in the Human Energy Research Lab where ambient temperature will range from 70 degrees Fahrenheit to 74 degrees Fahrenheit (21 to 23 degrees Celcius) and percent humidity will be less than 60%.

Participant’s Initials
UUnniivveerrssiittyy OOff PPiittttssbbuurrgghh IInnssttiittuuttiioonnaall RReevviieeww BBooaarrdd
AApppprroovvaall DDaattee:: 1111//1144//22000088 RReenneewwaall DDaattee:: 1111//33//22000099
IIRRBB ##:: PPRROO0088009900554444
78
APPENDIX C
INFORMED CONSENT TITLE: Validation of Adult OMNI Perceived Exertion Scales for Elliptical Ergometry PRINCIPAL INVESTIGATOR: Ryan J. Mays, MS, CHFS, CSCS University of Pittsburgh
Department of Health and Physical Activity A149B Trees Hall Pittsburgh, PA 15261 Phone: (412) 648-8251 Fax: (412) 648-7092
Email: [email protected] CO-INVESTIGATORS: Fredric L. Goss, PhD
University of Pittsburgh Department of Health and Physical Activity
Associate Professor and Co-Director, Center for Exercise and Health-Fitness Research 113 Trees Hall Pittsburgh, PA 15261 Phone: (412) 648-8259 Fax: (412) 648-7092 Email: [email protected]

Participant’s Initials
UUnniivveerrssiittyy OOff PPiittttssbbuurrgghh IInnssttiittuuttiioonnaall RReevviieeww BBooaarrdd
AApppprroovvaall DDaattee:: 1111//1144//22000088 RReenneewwaall DDaattee:: 1111//33//22000099
IIRRBB ##:: PPRROO0088009900554444
79
Robert J. Robertson, PhD University of Pittsburgh Department of Health and Physical Activity Professor and Co-Director, Center for Exercise and Health-Fitness Research 107 Trees Hall Pittsburgh, PA 15261 Phone: (412) 648-8251 Fax: (412) 648-7092 Email: [email protected] Elizabeth F. Nagle-Stilly, PhD University of Pittsburgh Department of Health and Physical Activity Assistant Professor 149 Trees Hall Pittsburgh, PA 15261 Phone: (412) 648-826 Fax: (412) 648-7092 Email: [email protected]
Kevin H. Kim, PhD University of Pittsburgh Department of Psychology in Education Assistant Professor 5918 Wesley Posvar Hall Pittsburgh, PA 15260 Phone: (412) 624-7272 Email: [email protected] Mark A. Schafer, PhD Western Kentucky University Department of Physical Education and Recreation Assistant Professor 1906 College Heights Blvd #11089 Bowling Green, KY 42101 Phone: 270-745-5857 Fax: 270-535-9645 Email: [email protected]
SOURCE OF SUPPORT: School of Education Alumni Doctoral Fellowship, School of Education Student Research Grant Why is this research being done? Feelings of effort, also known as ratings of perceived exertion (RPE), are commonly used as part of an individualized exercise prescription to define the intensity training zone and to regulate exercise intensity. A common scale used to measure RPE is the Borg 15 category scale. However, this scale includes only numbers and verbal descriptors (e.g., 6-20, no exertion at all to maximal exertion) and therefore lends itself to limitations in rating exertion. The OMNI Picture System of Perceived Exertion is a recent advancement in the field of perceived exertion. These scales fine tune the individual’s ability to regulate their exercise intensity, as it has numerical, verbal and exercise specific pictorial descriptors. Numbers on the OMNI scale range from 0-10; this numerical range is commonly used to evaluate aspects of our daily lives, making the scale easy to understand. Elliptical ergometry has become a popular exercise mode in clinical and health-fitness settings within the past decade. Thus, in order to expand the broad-based application of the OMNI scale, an elliptical ergometry format for both adult males and females is needed.

Participant’s Initials
UUnniivveerrssiittyy OOff PPiittttssbbuurrgghh IInnssttiittuuttiioonnaall RReevviieeww BBooaarrdd
AApppprroovvaall DDaattee:: 1111//1144//22000088 RReenneewwaall DDaattee:: 1111//33//22000099
IIRRBB ##:: PPRROO0088009900554444
80
Who is being asked to take part in this research study? Sixty healthy male and female subjects of normal body weight, age 18-34 years and participate in less than or equal to 160 minutes of aerobic exercise per week are being invited to take part in this research study. If you have a muscle or bone, heart disease, prior heart attack, blockages of arteries in legs, lung disease, and diabetes mellitus (high/low blood sugar) and/or if you are knowingly pregnant or you are a current smoker, you will not be eligible to participate in this research study. What procedures will be performed for research purposes? If you decide to take part in this research study, you will complete a 45-60 minute testing session. The testing session will consist of exercise on an elliptical ergometer to obtain your maximal aerobic fitness (VO2max). Figure 1 depicts the flow of the testing session and is shown on page 4. To minimize risks associated with maximal aerobic exercise testing, you will be asked to complete a Physical Activity Readiness Questionnaire (PAR-Q) and a medical history form which asks questions about your current health status.
If an abnormal response occurs during exercise, the test will be immediately stopped and you will be given proper medical attention. Emergency equipment will be on site for all testing procedures and staff personnel are certified in CPR and First Aid by the American Heart Association. If you have an abnormal response to the test, you will be told of the findings and will be encouraged to contact your primary care clinician.

Testing Session Informed Consent
PAR-Q
Medical History
Physical Activity Questionnaires
Anthropometry
RPE Scale Instructions
Graded Exercise Test
45 –
60
min
Figure 1. Testing session model All procedures will take place at the Center for Exercise and Health-Fitness Research located in Trees Hall at the University of Pittsburgh. The testing session will include the following procedures administered by the principal investigator who is an American College of Sports Medicine Certified Health Fitness Instructor® and a National Strength and Conditioning Association Certified Strength and Conditioning Specialist® from the Department of Health and Physical Activity at the University of Pittsburgh:
Experimental Procedures:
1. Before starting the study protocol, you will complete a medical history form and a physical activity readiness questionnaire (PAR-Q). Both forms will take less than five minutes to complete. Additionally, you will complete two physical activity questionnaires.
2. Your blood pressure will be assessed pre and post exercise testing. 3. Your height will be measured using a standard physicians’ scale. 4. Body weight and body composition will be assessed using a Tanita bioelectrical
impedance analyzer (BIA) scale. The BIA is a non-invasive pain-free procedure for assessing body composition in which a low-grade electrical impulse is transmitted through the body. The resistance to current flow through tissues reflects the relative amount of fat present. You will remove your shoes and socks and stand on the scale for approximately 10 seconds to obtain body composition assessment on the Tanita scale.
Participant’s Initials
UUnniivveerrssiittyy OOff PPiittttssbbuurrgghh IInnssttiittuuttiioonnaall RReevviieeww BBooaarrdd
AApppprroovvaall DDaattee:: 1111//1144//22000088 RReenneewwaall DDaattee:: 1111//33//22000099
IIRRBB ##:: PPRROO0088009900554444
81

Participant’s Initials
UUnniivveerrssiittyy OOff PPiittttssbbuurrgghh IInnssttiittuuttiioonnaall RReevviieeww BBooaarrdd
AApppprroovvaall DDaattee:: 1111//1144//22000088 RReenneewwaall DDaattee:: 1111//33//22000099
IIRRBB ##:: PPRROO0088009900554444
82
During the body composition measurement there may be a potential for the hair on your arms and legs to stand up.
5. Prior to the exercise session, you will receive standard instructions on OMNI RPE scaling procedures for three separate RPE scales. The investigator will first read you the following definition of RPE: “The perception of physical exertion is defined as the subjective intensity of effort, strain, discomfort, and/or fatigue that you feel during exercise”. You will then be read 3 sets of instructions from a script on how to use the OMNI RPE scales during the exercise session.
6. A heart rate monitor will be placed around your chest and secured in place with an elastic strap. A rubber mouthpiece, connected to a headset, will be placed in your mouth during the elliptical exercise to determine the amount of oxygen that you use during exercise. A clip will be attached to your nose to insure that all the air that you breathe comes in and out through your mouth. Some individuals become anxious when fitted with the nose clip and mouthpiece. If this occurs, please inform the technician performing the test and the test will be stopped. Your heart rate and the amount of oxygen that your body uses will be measured during the elliptical exercise.
7. If you do not have any conditions that would limit your ability to exercise, you will complete the testing session to measure your aerobic fitness (VO2max). The aerobic fitness test will be administered on an elliptical ergometer. The resistance and/or cadence will increase every 2 minutes and you will be encouraged to continue until fatigued. However, you may stop the test at any time for any reason. Additionally, the investigator will measure your heart rate, RPE for your overall body, legs and chest/breathing from the 3 RPE scales every stage. The investigator will also measure your stride and step count via the digital displays and pedometer attached to your hip.
The experimental trial will be conducted in the Human Energy Research Laboratory (HERL) where the temperature will range from 70 degrees Fahrenheit to 74 degrees Fahrenheit and humidity will be less than 60%.
What are the possible risks, side effects, and discomforts of this research study? Risks of the exercise test Abnormal responses, such as excessive rises in blood pressure, mental confusion, shortness of breath, chest pain, heart attack, and death, to maximal aerobic exercise tests in young healthy adults are rare, occurring in less than 1% of people (less than 1 out of 100 people tested). However, some common risks, occurring in 1% to 25% of people (1 to 25 out of 100 people tested), of maximal exercise testing include; heavy breathing, dizziness, muscle fatigue, headache, and overall fatigue. As with any experimental procedure, there may be adverse events or side effects that are currently unknown, and certain of these unknown risks could be permanent, severe or life-threatening.

Participant’s Initials
UUnniivveerrssiittyy OOff PPiittttssbbuurrgghh IInnssttiittuuttiioonnaall RReevviieeww BBooaarrdd
AApppprroovvaall DDaattee:: 1111//1144//22000088 RReenneewwaall DDaattee:: 1111//33//22000099
IIRRBB ##:: PPRROO0088009900554444
83
Risks of the study monitors Risk associated with study monitors (e.g., heart rate monitor, mouthpiece, etc.) include redness, irritation, and chafing. Dryness of the mouth and throat may occur due to the mouthpiece. Risk of breach of confidentiality That is, in very rare cases, people not associated with this research study may inadvertently see your identifiable research results. We will do everything in our power to prevent this from happening by keeping all research records in locked files, and identify all specimens and medical information by a research record number, rather than by your name or social security number. The codebook containing your name and number will be kept secure by the Study Coordinator/Investigator. What are possible benefits from taking part in this study? You will likely receive no direct benefit from taking part in this research study. However, you will receive information regarding your aerobic fitness level, percent body fat and the importance of promoting cardiovascular health. If I agree to take part in this research study, will I be told of any new risks that may be found during the course of the study? You will be promptly notified if, during the conduct of this research study, any new information develops which may cause you to change your mind about continuing to participate. Will my insurance provider or I be charged for the costs of any procedures performed as part of this research study? Neither you, nor your insurance provider, will be charged for the costs of any procedures performed for the purpose of this research study. Will I be paid if I take part in this research study? You will be paid $40.00 upon completion of the testing session. Who will pay if I am injured as a result of taking part in this study? University of Pittsburgh researchers and their associates who provide services at UPMC recognize the importance of your voluntary participation in their research studies. These individuals and their staffs will make reasonable efforts to minimize, control, and treat any injuries that may arise as a result of this research. If you believe that you are injured as a result of the research procedures being performed, please contact immediately the Principal Investigator or one of the Co-Investigators listed on the first page of this form.

Participant’s Initials
UUnniivveerrssiittyy OOff PPiittttssbbuurrgghh IInnssttiittuuttiioonnaall RReevviieeww BBooaarrdd
AApppprroovvaall DDaattee:: 1111//1144//22000088 RReenneewwaall DDaattee:: 1111//33//22000099
IIRRBB ##:: PPRROO0088009900554444
84
Emergency medical treatment for injuries solely and directly related to your participation in this research study will be provided to you by the hospitals of the UPMC. It is possible that the UPMC may bill your insurance provider for the costs of this emergency treatment, but none of these costs will be charged directly to you. If your research-related injury requires medical care beyond this emergency treatment, you will be responsible for the cost of this follow-up unless otherwise specifically stated below. There is no plan for monetary compensation. You do not, however, waive any legal rights by signing this form. Who will know about my participation in this research study? Any information about you obtained from this research will be kept as confidential (private) as possible. All records related to your involvement in this research study will be stored in a locked file cabinet. Your identity on these records will be indicated by a case number rather than by your name, and the information linking these case numbers with your identity will be kept separate from the research records. You will not be identified by name in any publication of the research results. Will this research study involve the use or disclosure of my identifiable medical information? This research study will not involve the use or disclosure of any identifiable medical information. Who will have access to identifiable information related to my participation in this research study? In addition to the investigators listed on the first page of this authorization (consent) form and their research staff, the following individuals will or may have access to identifiable information related to your participation in this research study:
• Authorized representatives of the University of Pittsburgh Research Conduct and Compliance Office may review your identifiable research information for the purpose of monitoring the appropriate conduct of this research study.
• In unusual cases, the investigators may be required to release identifiable information related to your participation in this research study in response to an order from a court of law. If the investigators learn that you or someone with whom you are involved is in serious danger or potential harm, they will need to inform, as required by Pennsylvania law, the appropriate agencies.

Participant’s Initials
UUnniivveerrssiittyy OOff PPiittttssbbuurrgghh IInnssttiittuuttiioonnaall RReevviieeww BBooaarrdd
AApppprroovvaall DDaattee:: 1111//1144//22000088 RReenneewwaall DDaattee:: 1111//33//22000099
IIRRBB ##:: PPRROO0088009900554444
85
• Authorized people sponsoring this research study, because they need to make sure that the information collected is correct, accurate, and complete, and to determine the results of this research study.
• Authorized representatives of the UPMC hospitals or other affiliated health care providers may have access to identifiable information related to your participation in this research study for the purpose of (1) fulfilling orders, made by the investigators, for hospital and health care services (e.g., laboratory tests, diagnostic procedures) associated with research study participation; (2) addressing correct payment for tests and procedures ordered by the investigators; and/or (3) for internal hospital operations (e.g., quality assurance).
For how long will the investigators be permitted to use and disclose identifiable information related to my participation in this research study? The investigators may continue to use and disclose, for the purposes described above, identifiable information related to your participation in this research study for a minimum of five years after final reporting or publication of a project. Is my participation in this research study voluntary? Your participation in this research study, to include the use and disclosure of your identifiable information for the purposes described above, is completely voluntary. (Note, however, that if you do not provide your consent for the use and disclosure of your identifiable information for the purposes described above, you will not be allowed, in general, to participate in this research study). Whether or not you provide your consent for participation in this research study will have no affect on your current or future relationship with the University of Pittsburgh. Whether or not you provide your current medical information for participation in this research study will have no effect on your current or future medical care at a UPMC hospital or affiliated health care provider or your current or future relationship with a health care insurance provider. May I withdraw, at a future date, my consent for participation in this research study? You may withdraw, at any time, your consent for participation in this research study, to include the use and disclosure of your identifiable information for the purposes described above. Any identifiable research information recorded for, or resulting from, your participation in this research study prior to the date that you formally withdrew your consent may continue to be used and disclosed by the investigators for the purposes described above.
To formally withdraw your consent for participation in this research study you should provide a written and dated notice of this decision to the principal investigator of this research study at the address listed on the first page of this form.

Participant’s Initials
UUnniivveerrssiittyy OOff PPiittttssbbuurrgghh IInnssttiittuuttiioonnaall RReevviieeww BBooaarrdd
AApppprroovvaall DDaattee:: 1111//1144//22000088 RReenneewwaall DDaattee:: 1111//33//22000099
IIRRBB ##:: PPRROO0088009900554444
86
Your decision to withdraw your consent for participation in this research study will have no effect on your current or future relationship with the University of Pittsburgh. Your decision to withdraw your consent for participation in this research study will have no effect on your current of future medical care at a UPMC hospital or affiliated health care provider or your current or your future relationship with a health care insurance provider. If I agree to take part in this research study, can I be removed from the study without my consent?
It is possible that you may be removed from the research study by the researchers to protect your safety or if you are unable or unwilling to complete the research protocol.
Participant’s Initials
UUnniivveerrssiittyy OOff PPiittttssbbuurrgghh IInnssttiittuuttiioonnaall RReevviieeww BBooaarrdd
AApppprroovvaall DDaattee:: 1111//1144//22000088 RReenneewwaall DDaattee:: 1111//33//22000099
IIRRBB ##:: PPRROO0088009900554444
87
************************************************************************ VOLUNTARY CONSENT All of the above has been explained to me and all of my questions have been answered. I understand that any future questions I have about this research study during the course of this study, and that such future questions will be answered by the investigators listed on the first page of this consent document at the telephone numbers given. Any questions I have about my rights as a research subject will be answered by the Human Subject Protection Advocate of the IRB Office, University of Pittsburgh (1-866-212-2668). By signing this form, I agree to participate in this research study. Participant’s Signature Printed Name of Participant Date CERTIFICATION OF INFORMED CONSENT “I certify that I have explained the nature and purpose of this research study to the above-named individual, and I have discussed the potential benefits, and possible risks associated with participation. Any questions the individual has about this study have been answered, and we will always be available to address future questions as they arise.” Printed Name of Person Obtaining Consent Role in Research Study Signature of Person Obtaining Consent Date

APPENDIX D
ID # Physical Activity Readiness Questionnaire
University of Pittsburgh Center for Exercise and Health-Fitness Research
1. Has your doctor ever said that you have a heart condition and that you should only do
physical activity recommended by a doctor?
No ___ Yes ___ If yes, specify: _____________________________
2. Do you feel pain in your chest when you do physical activity?
No ___ Yes ___ If yes, specify: _____________________________
3. In the past month, have you had chest pain when you were not doing physical activity?
No ___ Yes ___ If yes, specify: _____________________________
4. Do you lose your balance because of dizziness or do you ever lose consciousness?
No ___ Yes ___ If yes, specify: _____________________________
5. Do you have a bone or joint problem that could be made worse by a change in your physical activity?
No ___ Yes ___ If yes, specify: _____________________________
6. Is your doctor currently prescribing drugs (for example, water pills) for a blood pressure
or heart condition?
No ___ Yes ___ If yes, specify: _____________________________ 7. Do you know of any other reason why you should not do physical activity?
No ___ Yes ___ If yes, specify: _____________________________
88

APPENDIX E
ID #
MEDICAL HISTORY QUESTIONNAIRE University of Pittsburgh
Center for Exercise and Health-Fitness Research
89
YES NO
_____ _____ _____ _____ _____ _____ _____ _____ _____ _____ _____ _____ _____ _____ _____ _____ _____ _____ _____ _____ _____ _____ _____ _____ _____ _____ _____ _____ _____ _____ _____ _____ _____ _____ _____ _____ _____ _____
1. History of heart problems, chest pain, or stroke? 2. Increased blood pressure? 3. Any chronic illness or condition? 4. Difficulty with physical exercise? 5. Advice from a physician not to exercise? 6. Recent surgery? (Last 12 months) 7. Pregnancy? (Now or within the last 3 months) 8. History of breathing or lung problems? 9. Muscle, joint, back disorder, or any previous injury still
affecting you? 10. Diabetes or thyroid conditions? 11. Cigarette smoking habit? 12. Increased blood cholesterol? 13. History of heart problems in your immediate family? 14. Hernia or any condition that may be aggravated by lifting
weights? 15. Do you have any condition limiting your movement? 16. Are you aware of being allergic to any drugs or insect bites? 17. Do you have asthma? 18. Do you have epilepsy, convulsions, or seizures of any kind? 19. Do you follow any specific diet?
Please explain in detail any “YES” answers: Family History Has any member of you family had any of those listed above?
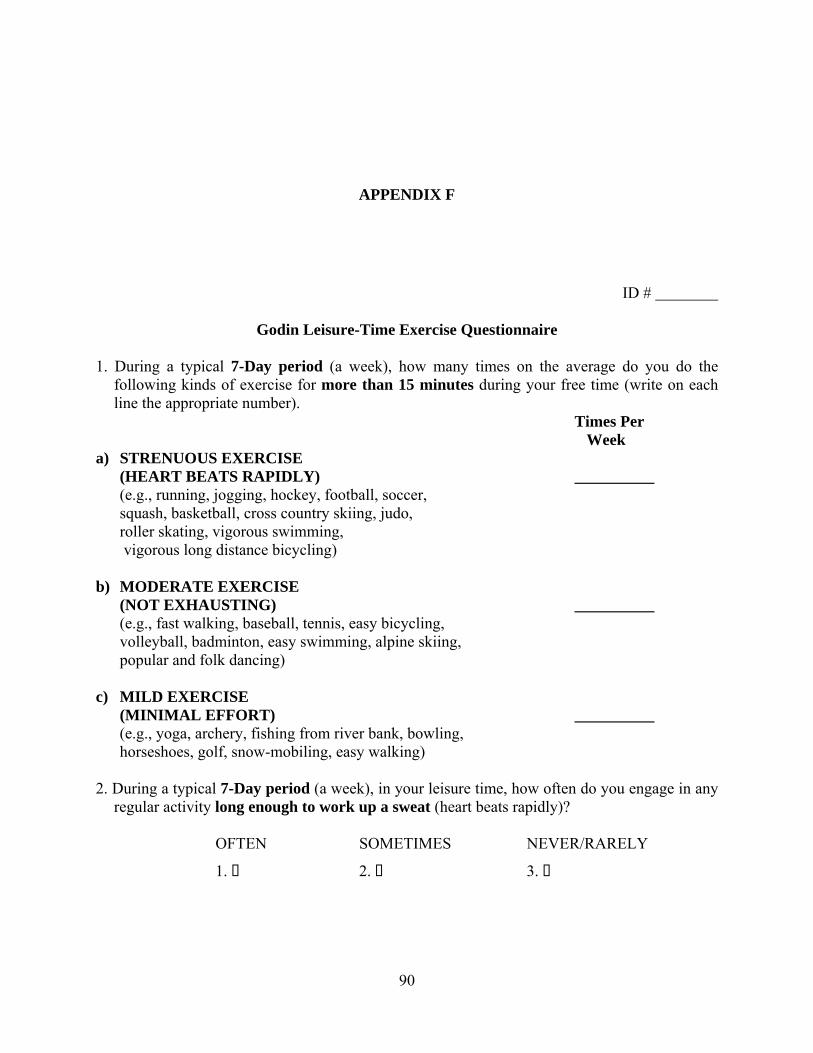
APPENDIX F
ID #
Godin Leisure-Time Exercise Questionnaire 1. During a typical 7-Day period (a week), how many times on the average do you do the
following kinds of exercise for more than 15 minutes during your free time (write on each line the appropriate number).
Times Per Week a) STRENUOUS EXERCISE (HEART BEATS RAPIDLY) __________ (e.g., running, jogging, hockey, football, soccer, squash, basketball, cross country skiing, judo, roller skating, vigorous swimming, vigorous long distance bicycling) b) MODERATE EXERCISE (NOT EXHAUSTING) __________ (e.g., fast walking, baseball, tennis, easy bicycling, volleyball, badminton, easy swimming, alpine skiing, popular and folk dancing) c) MILD EXERCISE (MINIMAL EFFORT) __________ (e.g., yoga, archery, fishing from river bank, bowling, horseshoes, golf, snow-mobiling, easy walking) 2. During a typical 7-Day period (a week), in your leisure time, how often do you engage in any
regular activity long enough to work up a sweat (heart beats rapidly)? OFTEN SOMETIMES NEVER/RARELY
1. 2. 3.
90

APPENDIX G
ID #
Baecke Physical Activity Questionnaire
91

APPENDIX H
Borg 15 Category Scale Orientation Definition of RPE: We define exertion as the intensity of effort, strain, discomfort or fatigue that you feel during exercise. Instructions: While exercising on the elliptical ergometer, we want you to rate your perception of exertion, i.e., how heavy and strenuous the exercise feels to you. The perception of exertion depends mainly on the strain and fatigue in your muscles and on your feelings of breathlessness or aches in the chest. Look at this rating scale (show subject scale); we want you to use this scale from 6 to 20, where 6 means “no exertion at all” and 20 means “maximal exertion”. 9 corresponds to “very light” exercise. For a normal, healthy person it is like walking slowly at his or her own pace for some minutes. 13 on the scale is “somewhat hard” exercise, but it still feels OK to continue. 17 “very hard” is very strenuous. A healthy person can still go on, but he or she really has to push him- or herself. It feels very heavy, and the person is very tired. 19 on the scale is an extremely strenuous exercise level. For most people this is the most strenuous they have ever experienced. Try to appraise your feelings of exertion as honestly as possible, without thinking about what the actual physical load is. Don’t underestimate it, but don’t overestimate it ether. It’s your own feeling of effort and exertion that’s important, not how it compares to other people’s. What other people think is not important either. Look at the scale and the expressions and then give a number. We will ask you to point to the number that tells how your whole body feels, then to the number that tells how your legs feel, then to the number that tells how your chest and breathing feel. Any questions?
92

Ask the subject the following questions and instruct them to point to the appropriate number on the scale. 1. Rate your feelings of exertion right now. 2. Rate your feelings of exertion when you are exercising at a moderate intensity on the elliptical ergometer. 3. Rate your feelings of exertion when you exercised as hard as you can remember.
93

APPENDIX I
Original Format OMNI RPE Scale Orientation
Definition of RPE:
We define exertion as the intensity of effort, strain, discomfort or fatigue that you feel during exercise.
Instructions:
We would like you to exercise on an elliptical ergometer. Please use the numbers on this scale to tell us how your body feels when you are exercising. Please look at the person at the bottom of the hill who is just starting to exercise (point to the left-hand picture). If you feel like this person when you are exercising, the exertion will be extremely easy. In this case, your rating should be the number 0. Now look at the person who is exhausted at the top of the hill (point to the right-hand picture). If you feel like this person when exercising, the exertion will be extremely hard. In this case, your rating should be the number 10. If your exertion feels somewhere between extremely easy (0) and extremely hard (10), then give a number between 0 and 10.
We will ask you to point to the number that tells how your whole body feels, then to the number that tells how your legs feel, then to the number that tells how your chest and breathing feel. There is no right or wrong answer. Use both the pictures and the words to help you select a number. Use any of the numbers to tell how you feel when you are exercising.
Ask the subject the following questions and instruct them to point to the appropriate number on the scale.
1. Rate your feelings of exertion right now. 2. Rate your feelings of exertion when you are exercising at a moderate intensity on the elliptical ergometer. 3. Rate your feelings of exertion when you exercised as hard as you can remember.
94

APPENDIX J
Modified Format OMNI RPE Scale Orientation
Definition of RPE:
We define exertion as the intensity of effort, strain, discomfort or fatigue that you feel during exercise.
Instructions:
We would like you to exercise on an elliptical ergometer. Please use the numbers on this scale to tell us how your body feels when you are exercising. Please look at the person at the bottom of the hill who is at rest (point to the left-hand picture). You should feel like this person now when you are not exercising. In this case, your rating should be the number 0. Now look at the person who is exhausted at the top of the hill (point to the right-hand picture). If you feel like this person when exercising, the exertion will be extremely hard. In this case, your rating should be the number 10. If your exertion feels somewhere between rest (0) and extremely hard (10), then give a number between 0 and 10.
We will ask you to point to the number that tells how your whole body feels, then to the number that tells how your legs feel, then to the number that tells how your chest and breathing feel. There is no right or wrong answer. Use both the pictures and the words to help you select a number. Use any of the numbers to tell how you feel when you are exercising.
Ask the subject the following questions and instruct them to point to the appropriate number on the scale.
1. Rate your feelings of exertion right now. 2. Rate your feelings of exertion when you are exercising at a moderate intensity on the elliptical ergometer. 3. Rate your feelings of exertion when you exercised as hard as you can remember.
95

APPENDIX K
Elliptical Ergometer GXT Instructions
1. “Today we ask you to rate your perception of physical exertion during a maximal elliptical ergometer test. Remember, the perception of physical exertion is defined as the subjective intensity of effort, strain, discomfort and/or fatigue that you feel during exercise.”
2. With all three RPE scales in clear view of the subject, read the following instructions:
“You will exercise on the elliptical ergometer for as long as you can. Every 2 minutes the resistance and/or the cadence on the elliptical ergometer will increase. Please maintain the stride rate instructed by the investigator. Use the beat of the metronome and the digital display on the elliptical ergometer to help keep the proper rate throughout the test. You will not be allowed to hold onto the handrails during the test; however, you may grab the handrails to regain balance. Additionally, you may place the back of your hands against the handrails to maintain balance. At the end of each stage we will ask you to rate your feelings of exertion in your legs, for your chest and breathing, and for your overall body from all three scales. Please point to the number on the scales that represents each separate feeling of exertion. Please give us a maximal effort at the end of the test. When you cannot continue or cannot maintain the proper stride rate for 10 consecutive seconds, the test will be terminated.
Do you have any questions?”
3. Instruct the subject to begin exercising. After recording RPE at minute 1 of each stage, collect total strides from elliptical digital displays and pedometer step count at 1:50 of each test stage.
REMEMBER: Subject should be unaware of the power output.
96

BIBLIOGRAPHY ACSM. (2006). ACSM's Guidelines for Exercise Testing and Prescription (7th ed.). Baltimore,
MD: Lippincott Williams and Wilkins.
ASD. (2007). American Sports Data, Inc. SuperStudy® of Sports Participation (Vol. 1). New York.
Baecke, J. A., Burema, J., & Frijters, J. E. (1982). A short questionnaire for the measurement of habitual physical activity in epidemiological studies. American Journal of Clinical Nutrition, 36(5), 936-942.
Bar-Or, O. (1977). Age related changes in exercise prescription. In G. Borg (Ed.), Physical Work and Effort (pp. 101-102). Oxford, UK: Pergamon.
Barkley, J. E., & Roemmich, J. N. (2008). Validity of the CALER and OMNI-bike ratings of perceived exertion. Medicine and Science in Sports and Exercise, 40(4), 760-766.
Batte, A. L., Darling, J., Evans, J., Lance, L. M., Olson, E. I., & Pincivero, D. M. (2003). Physiologic response to a prescribed rating of perceived exertion on an elliptical fitness cross-trainer. Journal of Sports Medicine and Physical Fitness, 43(3), 300-305.
Borg, G. (1961). Perceived Exertion in relation to physical work load and pulse-rate. Kungliga Fysiografiska Sallskapets i Lund Forhandlingar, 31, 117-125.
Borg, G. (1962). A simple rating scale for use in physical work tests. Kungliga Fysiografiska Sallskapets i Lund Forhandlingar, 32, 7-15.
Borg, G. (1971). The perception of physical performance. In R. J. Shepard (Ed.), Frontiers in Fitness. Springfield, IL: Charles C. Thomas.
Borg, G. (1985). An introduction to Borg's RPE-scale. Ithaca, NY: Mouvement.
97

Borg, G. (1998). Borg's perceived exertion and pain scales. Champaign, IL: Human Kinetics.
Borg, G. A. (1973). Perceived exertion: a note on "history" and methods. Medicine and Science in Sports and Exercise, 5(2), 90-93.
Borg, G. A. (1982). Psychophysical bases of perceived exertion. Medicine and Science in Sports and Exercise, 14(5), 377-381.
Burnfield, J. M., Jorde, A. G., Augustin, T. R., Augustin, T. A., & Bashford, G. R. (2007). Variations in plantar pressure variables across five cardiovascular exercises. Medicine and Science in Sports and Exercise, 39(11), 2012-2020.
Cafarelli, E., Cain, W. S., & Stevens, J. C. (1977). Effort of dynamic exercise: influence of load, duration, and task. Ergonomics, 20(2), 147-158.
Ceci, R., & Hassmen, P. (1991). Self-monitored exercise at three different RPE intensities in treadmill vs field running. Medicine and Science in Sports and Exercise, 23(6), 732-738.
Cook, C., Heelan, K., & Krueger, R. (2004). Comparison of energy expenditure on the treadmill vs. the elliptical machine at a self-selected intensity. Medicine and Science in Sports and Exercise, 31(5), S249.
Crommett, A., Kravitz, L., Wongsathikun, J., & Kemerly, T. (1999). Comparison of metabolic and subjective response of three modalities in college-age subjects. Medicine and Science in Sports and Exercise, 31(5), S677.
D'Lima, D. D., Steklov, N., Patil, S., & Colwell, C. W., Jr. (2008). The Mark Coventry Award: In Vivo Knee Forces During Recreation and Exercise After Knee Arthroplasty. Clinical Orthopaedics and Related Research.
Dalleck, L. C., & Kravitz, L. (2007). Development of a metabolic equation for elliptical crosstrainer exercise. Perceptual and Motor Skills, 104(3 Pt 1), 725-732.
Dalleck, L. C., Kravitz, L., & Robergs, R. A. (2004). Maximal exercise testing using the elliptical cross-trainer and treadmill. Journal of Exercise Physiology online, 7(3), 94-101.
98

Dalleck, L. C., Kravitz, L., & Robergs, R. A. (2006). Development of a submaximal test to predict elliptical cross-trainer VO2max. Journal of Strength and Conditioning Research, 20(2), 278-283.
Dunbar, C. C., Robertson, R. J., Baun, R., Blandin, M. F., Metz, K., Burdett, R., & Goss, F. L. (1992). The validity of regulating exercise intensity by ratings of perceived exertion. Medicine and Science in Sports and Exercise, 24(1), 94-99.
Egana, M., & Donne, B. (2004). Physiological changes following a 12 week gym based stair-climbing, elliptical trainer and treadmill running program in females. Journal of Sports Medicine and Physical Fitness, 44(2), 141-146.
Ekblom, B., Lovgren, O., Alderin, M., Fridstrom, M., & Satterstrom, G. (1975). Effect of short-term physical training on patients with rheumatoid arthritis I. Scandinavian Journal of Rheumatology, 4(2), 80-86.
Eston, R., & Parfitt, G. (2006). Effort Perception. In N. Armstrong (Ed.), Paediatric (pp. 275-298). London, UK: Elsevier.
Eston, R., Parfitt, G., Campbell, L., & Lamb, K. L. (2000). Reliability of effort perception for regulating exercise intensity in children using the Cart and Load Effort Rating (CALER) scale. Pediatric Exercise Science, 12, 388-397.
Eston, R. G., Davies, B. L., & Williams, J. G. (1987). Use of perceived effort ratings to control exercise intensity in young healthy adults. European Journal of Applied Physiology and Occupational Physiology, 56(2), 222-224.
Eston, R. G., Lamb, K. L., Bain, A., Williams, A. M., & Williams, J. G. (1994). Validity of a perceived exertion scale for children: a pilot study. Perceptual and Motor Skills, 78(2), 691-697.
Eston, R. G., Parfitt, G., & Shepard, P. (2001). Effort perception in children: implications for validity and reliability. In A. Papaionnou, M. Goudas & Y. Theodorakis (Eds.), Proceedings of 10th World Congress of Sport Psychology (Vol. 5, pp. 104-106). Skiathos, Greece.
Garcin, M., Vautier, J. F., Vandewalle, H., Wolff, M., & Monod, H. (1998). Ratings of perceived exertion (RPE) during cycling exercises at constant power output. Ergonomics, 41(10), 1500-1509.
99
Godin, G., & Shephard, R. J. (1985). A simple method to assess exercise behavior in the community. Canadian Journal of Applied Sports Sciences, 10(3), 141-146.
Green, J. M., Crews, T. R., Bosak, A. M., & Peveler, W. W. (2003). Overall and differentiated ratings of perceived exertion at the respiratory compensation threshold: effects of gender and mode. European Journal of Applied Physiology, 89(5), 445-450.
Green, J. M., Crews, T. R., Pritchett, R. C., Mathfield, C., & Hall, L. (2004). Heart rate and ratings of perceived exertion during treadmill and elliptical exercise training. Perceptual and Motor Skills, 98(1), 340-348.
Groslambert, A., Hintzy, F., Hoffman, M., Dugue, B., & Rouillon, J. (2001). Validation of a Rating Scale of Perceived Exertion in Young Children. International Journal of Sports Medicine, 22, 116-119.
Groslambert, A., Monnier Benoit, P., Grange, C. C., & Rouillon, J. D. (2005). Self-regulated running using perceived exertion in children. Journal of Sports Medicine and Physical Fitness, 45(1), 20-25.
Kane, I. (2007). Predicted and actual exercise discomfort, self-efficacy and enjoyment in middle school children: a match-mismatch paradigm. Doctoral Dissertation, University of Pittsburgh, Pittsburgh, PA.
Kang, J., Chaloupka, E. C., Mastrangelo, M. A., Donnelly, M. S., Martz, W. P., & Robertson, R. J. (1998). Regulating exercise intensity using ratings of perceived exertion during arm and leg ergometry. European Journal of Applied Physiology and Occupational Physiology, 78(3), 241-246.
Kang, J., Hoffman, J. R., Walker, H., Chaloupka, E. C., & Utter, A. C. (2003). Regulating intensity using perceived exertion during extended exercise periods. European Journal of Applied Physiology, 89(5), 475-482.
Kinsman, R., & Weiser, P. (1976). Subjective symptomatology during work and fatigue. In E. Simonson & P. Weises (Eds.), Psychological Aspects of Fatigue (pp. 336-405). Springfield, IL: Charles C Thomas.
Lagally, K. M., & Robertson, R. J. (2006). Construct validity of the OMNI resistance exercise scale. Journal of Strength and Conditioning Research, 20(2), 252-256.
100

Lamb, K. L., & Eston, R. (1997a). Measurement of effort perception time for a new approach. In J. Welsman, N. Armstrong & B. Kirby (Eds.), Children and Exercise XIX (Vol. 2, pp. 11-23). Exeter, UK: Washington Singer Press.
Lamb, K. L., & Eston, R. G. (1997b). Effort perception in children. Sports Medicine, 23(3), 139-148.
Ljunggren, G., & Dornic, S. (1989). Psychophysics in action. Berlin: Springer-Verlag.
Londeree, B., & Moeschberger, M. L. (1982). Effect of age and other factors on maximal heart rate. Research Quarterly for Exercise and Sport, 53, 297-304.
Lu, T. W., Chien, H. L., & Chen, H. L. (2007). Joint loading in the lower extremities during elliptical exercise. Medicine and Science in Sports and Exercise, 39(9), 1651-1658.
Mahon, A. D., Gay, J. A., & Stolen, K. Q. (1998). Differentiated ratings of perceived exertion at ventilatory threshold in children and adults. European Journal of Applied Physiology and Occupational Physiology, 78(2), 115-120.
Marinov, B., Mandadjieva, S., & Kostianev, S. (2008). Pictorial and verbal category-ratio scales for effort estimation in children. Child: Care, Health and Development, 34(1), 35-43.
Marks, L. E. (1974). Sensory processes: The new psychophysics. New York: Academic Press.
Marriott, H. E., & Lamb, K. L. (1996). The use of ratings of perceived exertion for regulating exercise levels in rowing ergometry. European Journal of Applied Physiology and Occupational Physiology, 72(3), 267-271.
Mercer, J., Dufek, J., & Bates, B. (2001). Analysis of peak oxygen consumption and heart rate during elliptical and treadmill exercise. Journal of Sport Rehabilitation, 10, 48-56.
Mier, C. M., & Feito, Y. (2006). Metabolic cost of stride rate, resistance, and combined use of arms and legs on the elliptical trainer. Research Quarterly for Exercise and Sport, 77(4), 507-513.
Miyashita, M., Onodera, K., & Tabata, J. (1986). How Borg's RPE scale has been applied to Japanese. In G. Borg & D. Ottoson (Eds.), The Perception of Exertion in Physical Work (pp. 27-34). London: Macmillan.
101
Noble, B. J., Borg, G. A., Jacobs, I., Ceci, R., & Kaiser, P. (1983). A category-ratio perceived exertion scale: relationship to blood and muscle lactates and heart rate. Medicine and Science in Sports and Exercise, 15(6), 523-528.
Noble, B. J., & Robertson, R. J. (1996). Perceived Exertion. Champaign, IL: Human Kinetics.
Nystad, W., Oseid, S., & Mellbye, E. (1989). Physical education for asthmatic children: the relationship between changes in heart rate, perceived exertion, and motivation for participation. In E. Oseid & K. Carlson (Eds.), Children and Exercise (pp. 369-377). Champaign, IL: Human Kinetics.
Paffenbarger, R. S., Jr., Hyde, R. T., Wing, A. L., & Hsieh, C. C. (1986). Physical activity, all-cause mortality, and longevity of college alumni. New England Journal of Medicine, 314(10), 605-613.
Pandolf, K. B. (1982). Differentiated ratings of perceived exertion during physical exercise. Medicine and Science in Sports and Exercise, 14(5), 397-405.
Pandolf, K. B., Burse, R. L., & Goldman, R. F. (1975). Differentiated ratings of perceived exertion during physical conditioning of older individuals using leg-weight loading. Perceptual and Motor Skills, 40(2), 563-574.
Parfitt, G., Shepard, P., & Eston, R. (2007). Reliability of effort production using the Children's CALER and BABE perceived exertion scales. Journal of Exercise Science and Fitness, 5(1), 49-55.
Pfeiffer, K. A., Pivarnik, J. M., Womack, C. J., Reeves, M. J., & Malina, R. M. (2002). Reliability and validity of the Borg and OMNI rating of perceived exertion scales in adolescent girls. Medicine and Science in Sports and Exercise, 34(12), 2057-2061.
Robertson, R. J. (2001a). Development of the perceived exertion knowledge base: An interdisciplinary process. International Journal of Sport Psychology, 32, 189-196.
Robertson, R. J. (2001b). Exercise testing and prescription using RPE as a criterion variable. International Journal of Sport Psychology, 32, 177-188.
Robertson, R. J. (2004). Perceived Exertion for Practitioners: Rating Effort with the OMNI Picture System. Champaign, IL: Human Kinetics.
102

Robertson, R. J., Gillespie, R. L., McCarthy, J., & Rose, K. D. (1979). Differentiated perceptions of exertion: part I. mode of integration of regional signals. Perceptual and Motor Skills, 49(3), 683-689.
Robertson, R. J., Goss, F. L., Andreacci, J. L., Dube, J. J., Rutkowski, J. J., Frazee, K. M., Aaron, D. J., Metz, K. F., Kowallis, R. A., & Snee, B. M. (2005a). Validation of the Children's OMNI-Resistance Exercise Scale of perceived exertion. Medicine and Science in Sports and Exercise, 37(5), 819-826.
Robertson, R. J., Goss, F. L., Andreacci, J. L., Dube, J. J., Rutkowski, J. J., Snee, B. M., Kowallis, R. A., Crawford, K., Aaron, D. J., & Metz, K. F. (2005b). Validation of the children's OMNI RPE scale for stepping exercise. Medicine and Science in Sports and Exercise, 37(2), 290-298.
Robertson, R. J., Goss, F. L., Bell, J. A., Dixon, C. B., Gallagher, K. I., Lagally, K. M., Timmer, J. M., Abt, K. L., Gallagher, J. D., & Thompkins, T. (2002). Self-regulated cycling using the Children's OMNI Scale of Perceived Exertion. Medicine and Science in Sports and Exercise, 34(7), 1168-1175.
Robertson, R. J., Goss, F. L., Boer, N. F., Peoples, J. A., Foreman, A. J., Dabayebeh, I. M., Millich, N. B., Balasekaran, G., Riechman, S. E., Gallagher, J. D., & Thompkins, T. (2000). Children's OMNI scale of perceived exertion: mixed gender and race validation. Medicine and Science in Sports and Exercise, 32(2), 452-458.
Robertson, R. J., Goss, F. L., Dube, J., Rutkowski, J., Dupain, M., Brennan, C., & Andreacci, J. (2004). Validation of the adult OMNI scale of perceived exertion for cycle ergometer exercise. Medicine and Science in Sports and Exercise, 36(1), 102-108.
Robertson, R. J., Goss, F. L., Rutkowski, J., Lenz, B., Dixon, C., Timmer, J., Frazee, K., Dube, J., & Andreacci, J. (2003). Concurrent validation of the OMNI perceived exertion scale for resistance exercise. Medicine and Science in Sports and Exercise, 35(2), 333-341.
Robertson, R. J., & Noble, B. J. (1997). Perception of physical exertion: methods, mediators, and applications. Exercise and Sport Sciences Reviews, 25, 407-452.
Roemmich, J. N., Barkley, J. E., Epstein, L. H., Lobarinas, C. L., White, T. M., & Foster, J. H. (2006). Validity of PCERT and OMNI walk/run ratings of perceived exertion. Medicine and Science in Sports and Exercise, 38(5), 1014-1019.
103

104
Stevens, S. S. (1971). Issues in psychophysical measurement. Psychological Review, 78, 426-450.
Sweitzer, M. L., Kravitz, L., Weingart, H. M., Dalleck, L. C., Chitwood, L. F., & Dahl, E. (2002). The cardiopulmonary responses of elliptical cross-training versus treadmill walking in CAD patients. Journal of Exercise Physiology online, 5(4), 11-15.
Utter, A. C., Kang, J., Nieman, D. C., Dumke, C. L., & McAnulty, S. R. (2006). Validation of Omni scale of perceived exertion during prolonged cycling. Medicine and Science in Sports and Exercise, 38(4), 780-786.
Utter, A. C., Robertson, R. J., Green, J. M., Suminski, R. R., McAnulty, S. R., & Nieman, D. C. (2004). Validation of the Adult OMNI Scale of perceived exertion for walking/running exercise. Medicine and Science in Sports and Exercise, 36(10), 1776-1780.
Utter, A. C., Robertson, R. J., Nieman, D. C., & Kang, J. (2002). Children's OMNI Scale of Perceived Exertion: walking/running evaluation. Medicine and Science in Sports and Exercise, 34(1), 139-144.
Weary-Smith, K. A. (2007). Validation of the Physical Activity Index (PAI) as a measure of total activity load and total kilocalorie expenditure during submaximal treadmill walking. Doctoral Dissertation, University of Pittsburgh, Pittsburgh, PA.
Williams, J. G., Eston, R., & Furlong, B. (1994). CERT: a perceived exertion scale for young children. Perceptual and Motor Skills, 79(3 Pt 2), 1451-1458.
Wilson, R. C., & Jones, P. W. (1991). Long-term reproducibility of Borg scale estimates of breathlessness during exercise. Clinical Science (London), 80(4), 309-312.
Yelling, M., Lamb, K. L., & Swaine, I. (2002). Validity of a pictorial perceived exertion scale for effort estimation and effort production during stepping exercise in adolescent children. European Physical Education Review, 8, 157-175.