validated isocratic/gradient rp-hplc for simultaneous ... · regression analysis ... api's but...
TRANSCRIPT
Citation: Palled PJ, Dushyanth Reddy V, Mannor VS, et al. Validated Isocratic/Gradient RP-HPLC for Simultaneous Estimation of
Paracetamol Ibuprofen and Caffeine in Marketed Formulations Using Diclofenac as Internal Standard. Anal Chem Ind J. 2017;17(1):116.
© 2017 Trade Science Inc. 1
Validated Isocratic/Gradient RP-HPLC for Simultaneous Estimation of
Paracetamol Ibuprofen and Caffeine in Marketed Formulations Using
Diclofenac as Internal Standard
Palled PJ, Dushyanth Reddy V*, Mannor VS and Bharat Chowdary
Department of Pharmaceutical Chemistry, KLE's University College of Pharmacy, KLE University Belagavi 590001, India
*Corresponding author: Dushyanth Reddy V, Department of Pharmaceutical Chemistry, KLE's University College of
Pharmacy, KLE University, Belagavi 590001, India, Tel: 08312471399; E-mail: [email protected]
Received: October 16, 2016; Accepted: January 16, 2017; Published: January 22, 2017
Introduction
Paracetamol (Acetaminophen) is chemically N-(4-hydroxyphenyl) acetamide is a crystalline solid is a sparingly soluble
compound which is classified under antipyretic analgesics. Drugs Classified under this class possess analgesic and antipyretic
activity but lacks anti-inflammatory effects indicated for use in patients who are sensitive to aspirin with usual adult dosage
325 mcg to 650 mcg dose greater than 2.6 g/day are not advisable for prolonged treatment owing to its hepatotoxicity.
Antipyretic effect of acetaminophen affords to the inhibition of endogenous leukocytic pyrogens released from cells upon
external stimuli or upon activation with exogenous pyrogen. acetaminophen possesses analgesic activity in arthritis and
musculoskeletal disorders.
Abstract
Objective: To develop a validated RP-HPLC method for simultaneous estimation of Paracetamol Ibuprofen and Caffeine.
Methods: The HPLC instrument used was Shimadzu LC-20AD with reverse phase ODS-Hypersil-C18 (250 mm × 4.6 mm, 5 µm)
column using Acetonitrile:water (90:10) pH adjusted to 2.8 as mobile phase. The flow rate was maintained at 0.3 ml/min and UV
detection was carried at 203 nm.
Results: The method was validated for linearity, accuracy, precision, specificity, robustness and ruggedness according to ICH
guidelines. The retention time for Paracetamol, Ibuprofen and Caffeine was found to be 9.7, 12.66 and 10.48 respectively. The
regression analysis showed good linearity over the concentration range of 1.25 µg/ml to 20 µg/ml for paracetamol, 0.625 µg/ml to 10
µg/ml for Ibuprofen and 0.625 µg/ml to 10 µg/ml for Caffeine. The recovery studies of the method gave good results in the range of
99.89% to 100.48% with less than 2% of RSD.
Conclusion: The method was found to be suitable for the analysis of marketed formulation in presence of other excipients.
Keywords: Paracetamol; HPLC; Chromatography; Ibuprofen; Anti-inflammatory
www.tsijournals.com | January-2017
2
Acetaminophen is available in various formulations say suppositories, tablets, capsules, granules and solutions. Ibuprofen is
chemically 2-(4-isobutylphenyl) propionic acid is a crystalline solid is a sparingly soluble compound. It is classified as Non-
Steroidal anti-inflammatory drug it was the first NSAID approved after Indomethacin. First NSAID to become over the
counter (OTC) drugs. It is marketed as racemic mixture even its biological response owed almost evidently with S-(+)
isomer. Ibuprofen is more potent than aspirin but less effective than indomethacin. Ibuprofen produces moderate levels of
gastric irritation [1]. ibuprofen is indicated in patients suffering with rheumatoid arthritis, osteoarthritis, fever and
dysmenorrhea. Caffeine is chemically 1,3,7-trimethyl-1H-purine-2,6(3H,7H)-dione acetamide is a crystalline solid is a
sparingly soluble compound which is chemically methyl xanthines naturally occur in coffee (coffee Arabica) which is
generally termed as stimulant and as a bronchodilator. caffeine is generally added to other OTC analgesic and stimulants.
Methodology
1. UV Profiling of API's
2. HPLC Method Development
a. Isocratic
b. Gradient
3. Selection of Internal Standard
4. Assay Methodology for Quantification of API's
Chromatography
Ultraviolet spectroscopy (absorption spectroscopy) is one of the most widely used technique for quantification of organic and
inorganic molecules. Chromatography is a technique for separation of organic molecules. Hyphenated instrumentation
technique say (HPLC-UV/LC-MS/LC-NMR) is a technique to reconcile output abnormalities of one instrument with input
abnormalities of other instruments. Lower edge or conventional instruments say UV/Fluorescence/IR serve as detectors in
high end or Hyphenated instrumentation technique say (HPLC-UV/LC-MS/LC-NMR). High Performance Liquid
Chromatography is a technique of separation of molecules (in µg-ng/mL) in shorter time. Various literature reported HPLC
methods are available for simultaneous estimation of paracetamol and ibuprofen either alone or in combination with other
API's but very few direct HPLC method for simultaneous estimation of paracetamol, ibuprofen and caffeine according our
knowledge. We employ a criteria of standard addition method for inclusion of internal standard in quantification of API's.
UV profiling of API's
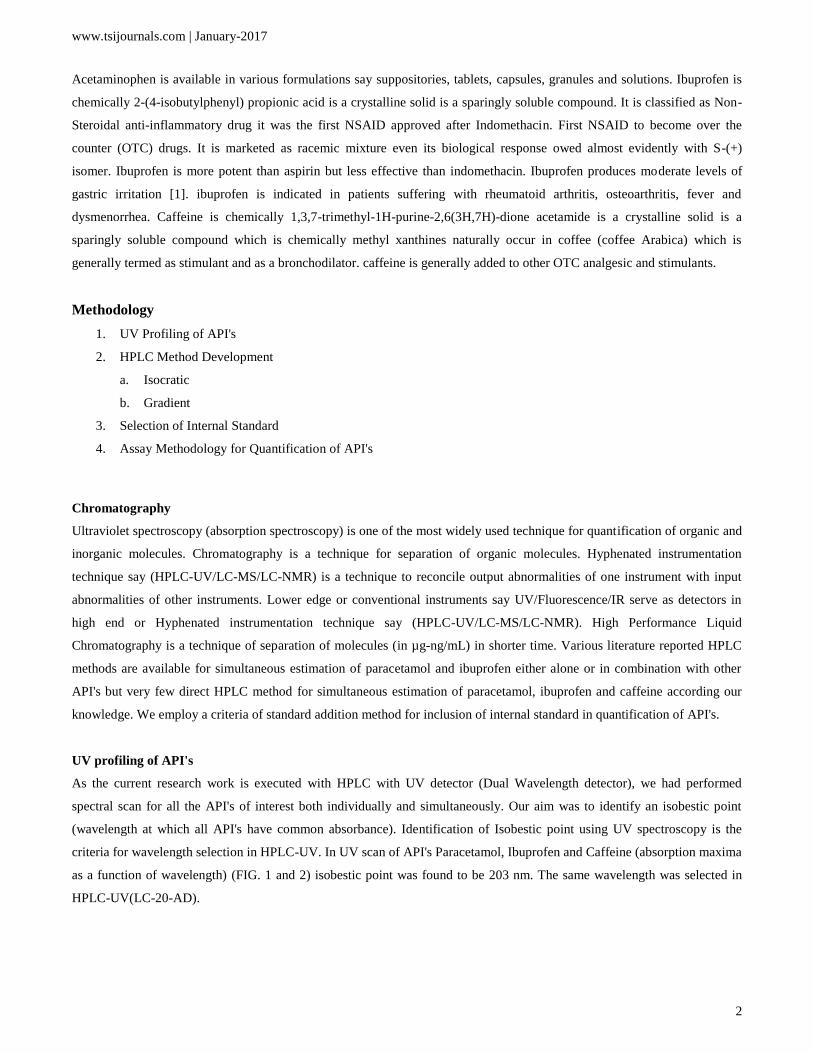
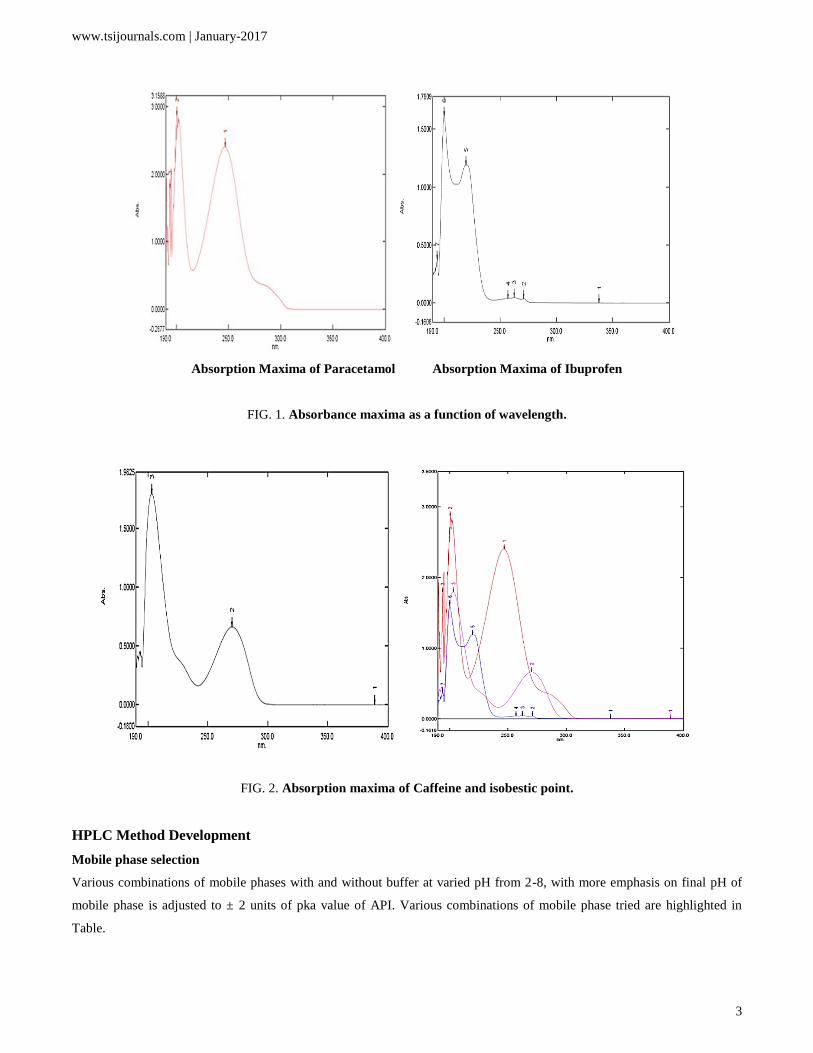
As the current research work is executed with HPLC with UV detector (Dual Wavelength detector), we had performed
spectral scan for all the API's of interest both individually and simultaneously. Our aim was to identify an isobestic point
(wavelength at which all API's have common absorbance). Identification of Isobestic point using UV spectroscopy is the
criteria for wavelength selection in HPLC-UV. In UV scan of API's Paracetamol, Ibuprofen and Caffeine (absorption maxima
as a function of wavelength) (FIG. 1 and 2) isobestic point was found to be 203 nm. The same wavelength was selected in
HPLC-UV(LC-20-AD).
www.tsijournals.com | January-2017
3
Absorption Maxima of Paracetamol Absorption Maxima of Ibuprofen
FIG. 1. Absorbance maxima as a function of wavelength.
FIG. 2. Absorption maxima of Caffeine and isobestic point.
HPLC Method Development
Mobile phase selection
Various combinations of mobile phases with and without buffer at varied pH from 2-8, with more emphasis on final pH of
mobile phase is adjusted to ± 2 units of pka value of API. Various combinations of mobile phase tried are highlighted in
Table.

www.tsijournals.com | January-2017
4
Column or stationary phase selection
Various stationary phases (columns) have been screened for current research, the best fit column with respect to tailing
factors and theoretical plates, eventually ODS Hypersil C18 was selected for analysis.
Materials, reagents and chemicals
Paracetamol, Ibuprofen and Caffeine pure drug was obtained as gift sample from Sun Pharma Sparc Research Centre
Vadodara. The other chemicals like methanol, acetonitrile and milli-Q waters were procured from Milli pore water system
available at BSRC. The tablet dosage forms imol plus procured from local market [2].
Instrumentation
UV instrument consist of Shimadzu UV, PH meter, Milli pore water purification system. The HPLC system consist of
Shimadzu LC 20AD, Hamilton injector of 20 µl capacity and detected by SPD-20A UV detector with LC-Solutions software.
The stationary phase used is reverse phase ODS-Hypersil-C18.
Chromatographic conditions
The mobile phase consists of Acetonitrile:water (90:10) pH adjusted to 2.8, all the solvents used in analysis are filtered
through 0.45 µ Sartorius filter paper, degassed by ultra-sonication for 10 min. The flow rate was maintained at 0.3 ml/min.
Aliquots of the samples (20 µl) (injection volume) were injected and the total run was kept at 20 min. the chromatogram was
monitored at 203 nm.
Standard solutions and Calibration curves
The standard stock solutions of the drug was prepared by dissolving 10 mg pure drug in 100 ml of mobile phase. Serial
dilutions were made from stock solutions using acetonitrile.
Sample preparation
Ten tablets of Paracetamol, Ibuprofen and Caffeine were weighed and grinded into fine powder in mortar and pestle. A mass
of powder equivalent to 100 mg of Paracetamol, Ibuprofen and Caffeine was accurately weighed and transferred to a
volumetric flask containing acetonitrile. The resultant solution was sonicated for 5 min and filtered through nylon filter and
the volume was made up to 100 ml using acetonitrile. serial dilutions were made from the stock solution of formulation, and
were analyzed for their recovery studies [3].
Method validation
The method was validated according to the ICH guidelines for the following parameters.
Linearity and sensitivity
Standard solutions of Paracetamol, Ibuprofen and Caffeine was prepared in the concentration range of 5 µg/ml to 25 µg/ml.
Then 20 µl of each solution were injected in triplicate on to the column and the chromatogram was developed using above
mobile phase Acetonitrile:water (90:10) pH adjusted to 2.8 ratio. The RF values were plotted against the corresponding
concentration to obtain the calibration graph. The LOD and LOQ were calculated based on the equation: LOD=3.3 × A/B and
www.tsijournals.com | January-2017
5
LOQ=10 × A/B. Where, A is SD of peak areas of the drugs taken as a measure of noise and B is the slope of corresponding
calibration curve FIG. 3-5.
Precision
The interday and intraday precision studies were conducted by using three different concentrations of the standard (initial,
medium and final concentrations) in triplicate in a day and on three consecutive days.
Accuracy
The accuracy of the method was examined by performing recovery studies in triplicate using standard addition method (50%,
100% and 150%). Accurately known amount of sample was added to a known amount of pre-analyzed tablet powder and was
analyzed (TABLE 1).
Robustness
Robustness of the method was determined by introducing small changes in the mobile phase composition, change in flow rate
and detection wavelength. During initial stages of development of method, the method was subjected to small changes and
the effect of small changes in method on the detection of Paracetamol, Ibuprofen and Caffeine with respect to peak shape, RT
values and stability were studied (TABLE 2-5).
Results and Discussion
Optimization of the RP-HPLC method
Various solvent systems were evaluated to obtain better chromatogram. Initially, methanol, HPLC grade water, acetate
buffer, acetonitrile and phosphate buffer were tried in different ratios [4]. But the resolution was not satisfactory. Finally, the
mobile phase consisting of Acetonitrile:water (90:10) pH adjusted to 2.8 found to be optimum.
Linearity and sensitivity
The linearity was evaluated by determining six working standard solutions containing 5 µg/ml to 25 µg/ml of Paracetamol,
Ibuprofen and Caffeine in triplicate with good correlation coefficient in the concentration range. (r=0.989). The LOD and
LOQ was found to be 0.0532 µg/ml and 2.344 µg/ml respectively (FIG. 5-8).
Assay
The amount of Paracetamol, Ibuprofen and Caffeine present per tablet was calculated by comparing the peak area, with that
of the internal standard.
Selection and role of internal standard
Conventional quantification techniques carry an error, to minimize the error in analysis, recovery and quantification of API
was done with respect to internal standard method. criteria for selection of internal standard; structurally similar compounds
have similar retention times, diclofenac is used as internal standard [5]. The conventional quantification technique (using
linearity and regression is obsolete and carry certain amount of random error. Internal standard analysis always carry standard
amount of determinate error throughout the analysis.
www.tsijournals.com | January-2017
6
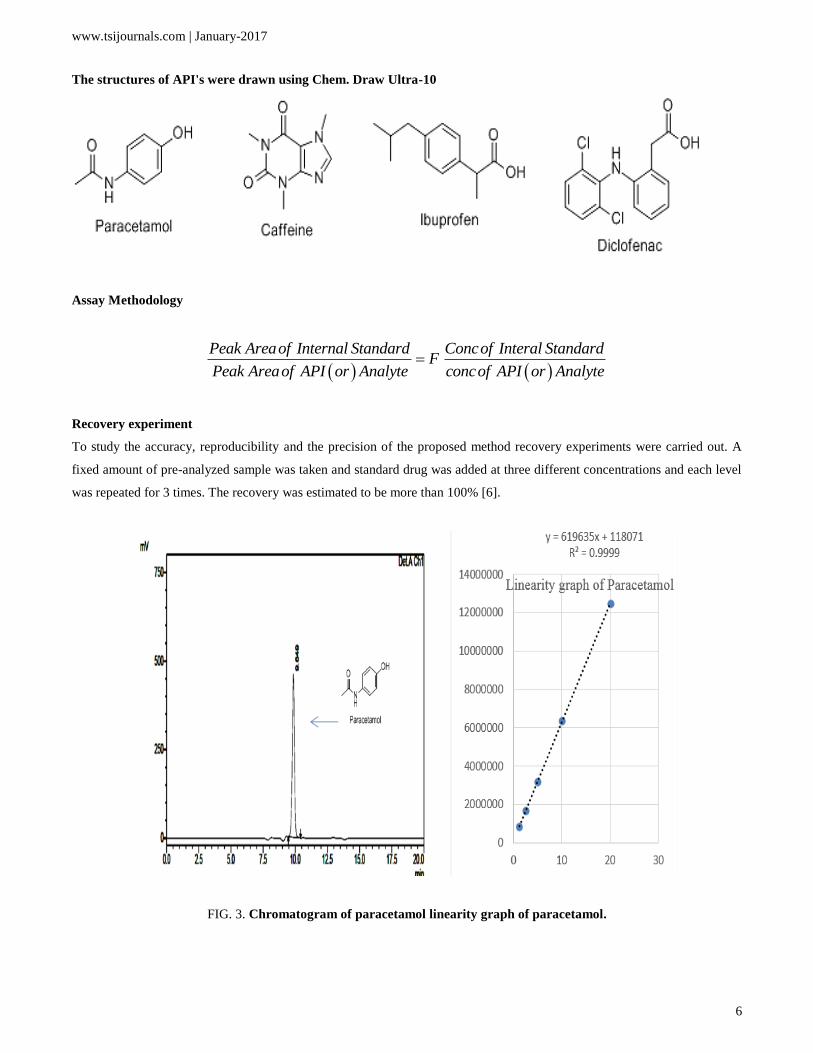
The structures of API's were drawn using Chem. Draw Ultra-10
Assay Methodology
Peak Areaof Internal Standard Concof Interal StandardF
Peak Areaof API or Analyte concof API or Analyte
Recovery experiment
To study the accuracy, reproducibility and the precision of the proposed method recovery experiments were carried out. A
fixed amount of pre-analyzed sample was taken and standard drug was added at three different concentrations and each level
was repeated for 3 times. The recovery was estimated to be more than 100% [6].
FIG. 3. Chromatogram of paracetamol linearity graph of paracetamol.

www.tsijournals.com | January-2017
7
FIG. 4. Chromatogram of Ibuprofen linearity graph of Ibuprofen.
FIG. 5. Chromatogram of Caffeine linearity graph of Caffeine.
FIG. 6. Chromatogram without Baseline Correction with Baseline Correction.

www.tsijournals.com | January-2017
8
FIG. 7. Chromatogram without internal standard Chromatogram with internal standard.
FIG. 8. Chromatogram of Standard Assay Chromatogram of Assay of Formulation.
TABLE 1. Linearity parameters for calibration curve.
Parameter Paracetamol Ibuprofen Caffeine
Retention time (Rt) 9.7 12.66 10.48
Linearity range (µg/ml) 1.25 µg/ml to 20 µg/ml 0.625 µg/ml to 10 µg/ml 0.625 µg/ml to 10 µg/ml
Regression equation y=61963x + 11807 y=31198x +77914 y=59842x +42403

www.tsijournals.com | January-2017
9
Limit of detection (µg/ml) 0.28481225 0.187937934 0.264438458
Limit of quantification (µg/ml) 0.94937417 0.626459779 0.881461526
Regression coefficient (r2) 0.999 0.999 0.999
TABLE 1a. Accuracy.
Paracetamol Caffeine Ibuprofen
Peak Area Conc. RSD Peak Area Conc. RSD Peak Area Conc. RSD
888147 1.25 0.69258 783034 1.25 0.442707 470798 1.25 0.692588
1659642 2.5 0.53228 1527003 2.5 0.69224431 869036.667 2.5 0.53228782
3197167 5 0.36195 3035632 5 0.709403 1645744 5 0.361959
n=3
TABLE 1b. Precision.
S.no Intra Day Precession Inter day precession
Paracetamol Ibuprofen Caffeine Paracetamol Ibuprofen Caffeine
1 6385180 3189497 5990397 6385180 3189497 5990397
2 6394967 3179829 6011626 6394967 3179829 6011626
3 6498615 3218876 6057253 6498615 3218876 6057253
4 6401950 3184222 6014400 6400632 3186556 5960127
5 6342337 3204056 5944931 6366615 3256463 5917302
6 6400594 3223011 5978122 6394706 3199781 5987988
AVG 6403941 3199915.167 5999455 6406786 3205167 5987449
SD 51392.4 18266.60881 38005.54 46554.44 28573.27 47187.29
RSD 0.802512 0.570846659 0.633483 0.726643 0.891475 0.788103
n=3
TABLE 2. Robustness study for Paracetamol.
Mobile
Phase
Flow Theoretical plates Tailing factor
AVG STDEV RSD AVG STDEV RSD
90 : 10 0.5 12323.978 56.20974539 0.456100663 0.93933333 0.00305505 0.325236032
90 : 10 0.7 9067.419667 78.84922682 0.869588369 0.888 0.00953939 1.074255857
88 : 12 0.5 15478.77167 135.7386882 0.876934495 0.99166666 0.00709459 0.715421736
88 : 12 0.7 11609.59933 154.6095267 1.331738695 1.021 0.00754983 0.739454891
92 : 08 0.5 5950.82 40.23684315 0.67615628 0 0 0

www.tsijournals.com | January-2017
10
92 : 08 0.7 4445.731 49.73684297 1.118755115 0 0 0
TABLE 3. Robustness parameters of Ibuprofen.
Mobile
Phase
Flow Theoretical plates Tailing factor
AVG STDEV AVG STDEV
90 : 10 0.5 12864.37067 116.9338918 90 : 10 0.5 12864.37067 116.9338918
90 : 10 0.7 11470.76967 130.9244533 90 : 10 0.7 11470.76967 130.9244533
88 : 12 0.5 14257.88433 209.0422122 88 : 12 0.5 14257.88433 209.0422122
88 : 12 0.7 12586.42633 104.8210764 88 : 12 0.7 12586.42633 104.8210764
92 : 08 0.5 12718.54433 71.83204801 92 : 08 0.5 12718.54433 71.83204801
92 : 08 0.7 11747.39667 135.0314692 92 : 08 0.7 11747.39667 135.0314692
TABLE 4. Robustness parameters of Caffeine.
Mobile
Phase
Flow Theoretical plates Tailing factor
AVG STDEV RSD AVG STDEV RSD
90 : 10 0.5 15841.41867 104.1076266 0.657186258 1.31 0.007549834 0.576323239
90 : 10 0.7 12461.14467 201.2005414 1.614623269 1.361 0.02433105 1.787733293
88 : 12 0.5 16618.58767 209.3578273 1.259781105 1.2573 0.011590226 0.921810109
88 : 12 0.7 13637.39533 201.6091045 1.478354918 1.324 0.012529964 0.94637191
92 : 08 0.5 14483.07133 84.91817942 0.58632715 0 0 0
92 : 08 0.7 12089.129 67.05188783 0.554646144 0 0 0
TABLE 5. Ruggedness.
Ruggedness study for Paracetamol Ruggedness study for
Ibuprofen
Ruggedness study for
Caffeine
S.NO Analysit-1 Analyst-2 Analyst-1 Analyst-2 Analyst-1 Analyst-2
1 Peak area 3208599 3240878 1641232 1686064 3051201 3020092
2 Peak area 3193454 3148553 1652496 1699056 3044639 3116484
3 Peak area 3189449 3238949 1643503 1681409 3011056 3097548
AVG 3197167 3209460 1645744 1688843 3035632 3078041
STDEV 10100.61 52755.83 5956.917 9145.834 21534.85 51070.9
RSD 0.315924 1.64376 0.361959 0.541544 0.709403 1.659201

www.tsijournals.com | January-2017
11
Validated gradient RP-HPLC method for estimation of Paracetamol, Caffeine and Ibuprofen
Stationary phase: C18 250 mm × 4.6 mm, 5 μ, Inertsil ODS 3V.
Mobile phase A: 6.8 gm of KH2PO4 in 1L Milli-Q water pH adjusted to 3 with Orthophosphoric acid
Mobile phase B: Filtered and degassed Acetonitrile (HPLC grade).
Detector: UV at wavelength 230 nm.
Flow rate: 1 mL/min (Run Time 30mins)
Injection volume: 20 μl
Mode: Gradient
Elution order: Paracetamol, Caffeine and Ibuprofen.
Retention time: Paracetamol,Caffeine and Ibuprofen is 6, 8 and 17 min (TABLE 6), FIG. 9 and 10.
FIG. 9. HPLC (Gradient) Chromatogram of paracetamol, Ibuprofen and Caffeine.
FIG. 10. HPLC (Isocratic) chromatogram of Paracetamol, Ibuprofen and Caffeine.
www.tsijournals.com | January-2017
12
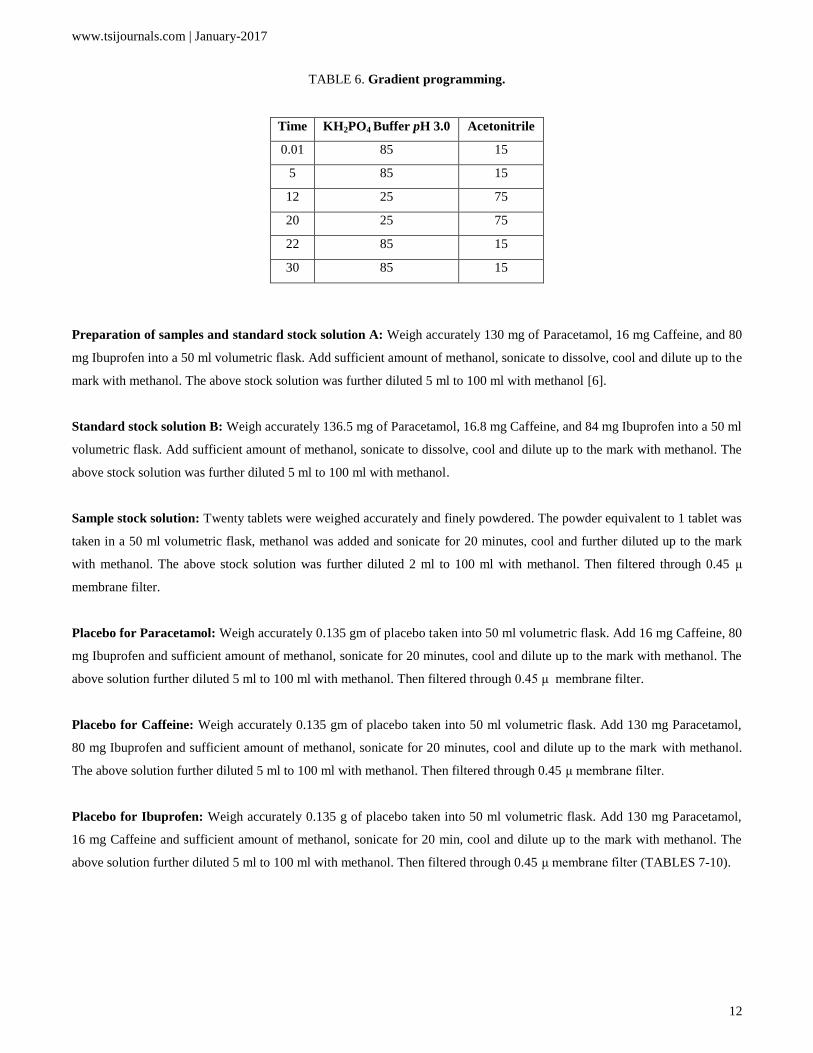
TABLE 6. Gradient programming.
Time KH2PO4 Buffer pH 3.0 Acetonitrile
0.01 85 15
5 85 15
12 25 75
20 25 75
22 85 15
30 85 15
Preparation of samples and standard stock solution A: Weigh accurately 130 mg of Paracetamol, 16 mg Caffeine, and 80
mg Ibuprofen into a 50 ml volumetric flask. Add sufficient amount of methanol, sonicate to dissolve, cool and dilute up to the
mark with methanol. The above stock solution was further diluted 5 ml to 100 ml with methanol [6].
Standard stock solution B: Weigh accurately 136.5 mg of Paracetamol, 16.8 mg Caffeine, and 84 mg Ibuprofen into a 50 ml
volumetric flask. Add sufficient amount of methanol, sonicate to dissolve, cool and dilute up to the mark with methanol. The
above stock solution was further diluted 5 ml to 100 ml with methanol.
Sample stock solution: Twenty tablets were weighed accurately and finely powdered. The powder equivalent to 1 tablet was
taken in a 50 ml volumetric flask, methanol was added and sonicate for 20 minutes, cool and further diluted up to the mark
with methanol. The above stock solution was further diluted 2 ml to 100 ml with methanol. Then filtered through 0.45 μ
membrane filter.
Placebo for Paracetamol: Weigh accurately 0.135 gm of placebo taken into 50 ml volumetric flask. Add 16 mg Caffeine, 80
mg Ibuprofen and sufficient amount of methanol, sonicate for 20 minutes, cool and dilute up to the mark with methanol. The
above solution further diluted 5 ml to 100 ml with methanol. Then filtered through 0.45 μ membrane filter.
Placebo for Caffeine: Weigh accurately 0.135 gm of placebo taken into 50 ml volumetric flask. Add 130 mg Paracetamol,
80 mg Ibuprofen and sufficient amount of methanol, sonicate for 20 minutes, cool and dilute up to the mark with methanol.
The above solution further diluted 5 ml to 100 ml with methanol. Then filtered through 0.45 μ membrane filter.
Placebo for Ibuprofen: Weigh accurately 0.135 g of placebo taken into 50 ml volumetric flask. Add 130 mg Paracetamol,
16 mg Caffeine and sufficient amount of methanol, sonicate for 20 min, cool and dilute up to the mark with methanol. The
above solution further diluted 5 ml to 100 ml with methanol. Then filtered through 0.45 μ membrane filter (TABLES 7-10).

www.tsijournals.com | January-2017
13
TABLE 7. Data of specificity test for Paracetamol.
Sample
Name Peak area
Paracetamol
Retention
time
Area
Caffeine
Retention
time
Peak area
of
Ibuprofen
Retention
time
Similarity factor
Paracetamol/Ibu
profen/Caffeine
STD A 7557233 6.32 564849 8.54 2016114 17.58
STD A 7580906 6.31 566807 8.53 2020175 17.57
STD A 7588646 6.31 567043 8.52 2022898 17.57
STD A 7587502 6.31 567267 8.52 2021357 17.57
STD A 7584143 6.30 566700 8.49 2019249 17.57
STD A 75944237 6.30 567367 8.49 2021417 17.56
STD B 7568881 6.31 565933 8.50 2016610 17.56 0.98
RSD 0.17% 0.11% 0.16% 0.22% 0.12% 0.03%
TABLE 8. System Suitability.
Parameter Acceptance Paracetamol Caffeine Ibuprofen
Theoretical Plates NLT 2000 7771 10581 135129
Tailing Factor NMT 2 1.0 1.1 1.1
Capacity Factor NLT 2 1.5 2.4 6.0
Similarity Factor 0.98 to 1.02 0.98 0.98 0.98
%RSD of STD A for Area NMT 2 0.17% 0.16% 0.12%
%RSD of STD A for RT NMT 2 0.11% 0.22% 0.03%
%RSD of STD for Area NMT 2 0.17% 0.18% 0.20%
%RSD of STD for Retention time NMT 2 0.11% 0.22% 0.04%
The given method is specific.
TABLE 9. Repeatability of Paracetamol Ibuprofen and Caffeine.
Sample
Name
Paracetamol Caffeine Ibuprofen
Area Amount
mg/tab
% Label
Claim
Area Amount
mg/tab
% Labe
l Claim
Area Amount
mg/tab
% Label
Claim
1 7402044 318.8 98.1 5502
72
39.4 98.6 2019414 200.1 100.1
2 7424325 319.8 98.4 5522
23
39.6 99.0 2026164 200.8 100.4
3 7437356 320.5 98.6 5531
73
39.7 99.2 2028301 201.1 100.6

www.tsijournals.com | January-2017
14
4 7485967 322.8 99.3 5541
84
39.8 99.4 2033877 201.8 100.9
5 7550710 325.6 100.2 5580
13
40.1 100.1 2042587 202.7 101.4
6 7552770 325.2 100.1 5576
24
40 99.9 2042212 202.3 101.2
SD 2.881 0.886 0.229 0.573 0.972 0.486
% RSD 0.89 0.89 0.58 0.58 0.48 0.48
TABLE 10. Summary of repeatability.
Parameter Acceptance Paracetamol Caffeine Ibuprofen
%RSD of Assay NMT 2 0.89 0.58 0.48
Similarity Factor 0.98 to 1.02 0.98 0.98 0.98
Linearity
Standard solution (50% Level): Weigh accurately 32.50 mg of Paracetamol, 4.02 mg Caffeine, and 21.0 mg Ibuprofen into
a 50 ml volumetric flask. Add sufficient amount of methanol, sonicate to dissolve, cool and dilute up to the mark with
methanol. The above stock solution was further diluted 2 ml to 100 ml with methanol.
Standard solution (60% Level): Weigh accurately 39.3 mg of Paracetamol, 4.83 mg Caffeine, and 25.5 mg Ibuprofen into a
50 ml volumetric flask. Add sufficient amount of methanol, sonicate to dissolve, cool and dilute up to the mark with
methanol. The above stock solution was further diluted 2 ml to 100 ml with methanol.
Standard solution (80% Level): Weigh accurately 52.80 mg of Paracetamol, 46.42 mg Caffeine, and 34.1 mg Ibuprofen
into a 50 ml volumetric flask. Add sufficient amount of methanol, sonicate to dissolve, cool and dilute up to the mark with
methanol. The above stock solution was further diluted 2 ml to 100 ml with methanol.
Standard solution (100% Level): Weigh accurately 64.90 mg of Paracetamol, 8.06 mg Caffeine, and 40.5 mg Ibuprofen
into a 50 ml volumetric flask. Add sufficient amount of methanol, sonicate to dissolve, cool and dilute up to the mark with
methanol. The above stock solution was further diluted 2 ml to 100 ml with methanol.
Standard solution (120% Level): Weigh accurately 77.30 mg of Paracetamol, 9.62 mg Caffeine, and 48.5 mg Ibuprofen
into a 50 ml volumetric flask. Add sufficient amount of methanol, sonicate to dissolve, cool and dilute up to the mark with
methanol. The above stock solution was further diluted 2 ml to 100 ml with methanol.
www.tsijournals.com | January-2017
15
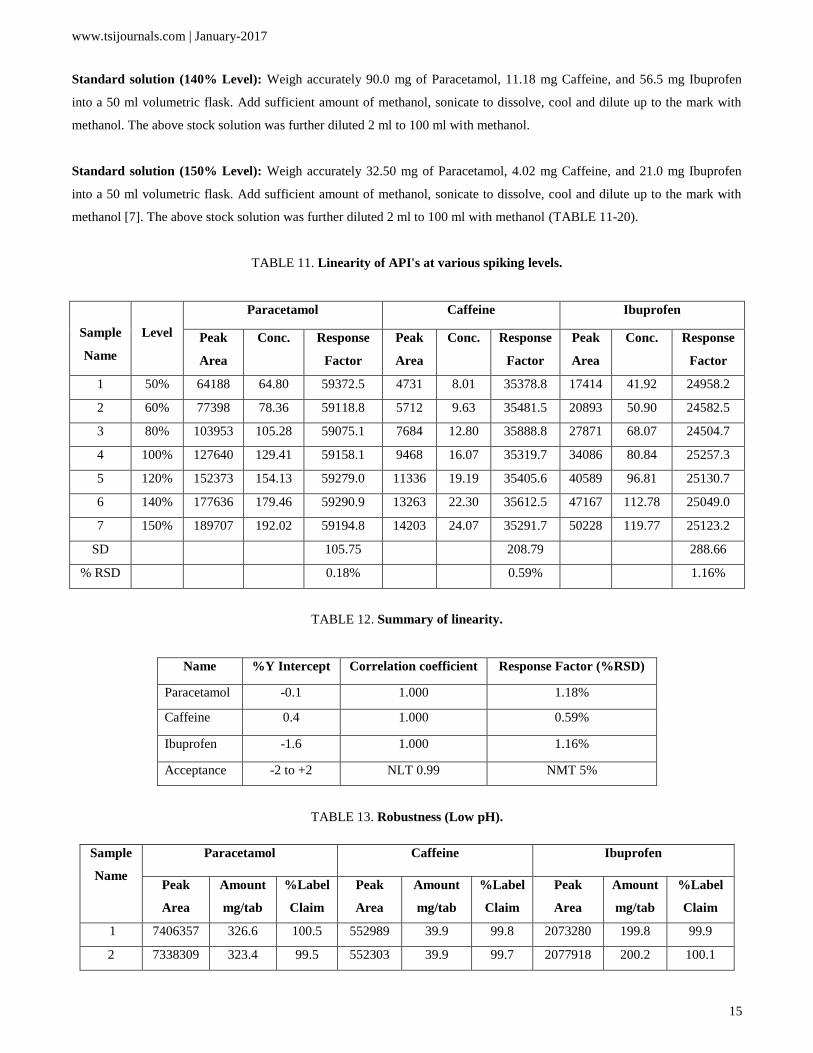
Standard solution (140% Level): Weigh accurately 90.0 mg of Paracetamol, 11.18 mg Caffeine, and 56.5 mg Ibuprofen
into a 50 ml volumetric flask. Add sufficient amount of methanol, sonicate to dissolve, cool and dilute up to the mark with
methanol. The above stock solution was further diluted 2 ml to 100 ml with methanol.
Standard solution (150% Level): Weigh accurately 32.50 mg of Paracetamol, 4.02 mg Caffeine, and 21.0 mg Ibuprofen
into a 50 ml volumetric flask. Add sufficient amount of methanol, sonicate to dissolve, cool and dilute up to the mark with
methanol [7]. The above stock solution was further diluted 2 ml to 100 ml with methanol (TABLE 11-20).
TABLE 11. Linearity of API's at various spiking levels.
Sample
Name
Level
Paracetamol Caffeine Ibuprofen
Peak
Area
Conc.
Response
Factor
Peak
Area
Conc.
Response
Factor
Peak
Area
Conc.
Response
Factor
1 50% 64188 64.80 59372.5 4731 8.01 35378.8 17414 41.92 24958.2
2 60% 77398 78.36 59118.8 5712 9.63 35481.5 20893 50.90 24582.5
3 80% 103953 105.28 59075.1 7684 12.80 35888.8 27871 68.07 24504.7
4 100% 127640 129.41 59158.1 9468 16.07 35319.7 34086 80.84 25257.3
5 120% 152373 154.13 59279.0 11336 19.19 35405.6 40589 96.81 25130.7
6 140% 177636 179.46 59290.9 13263 22.30 35612.5 47167 112.78 25049.0
7 150% 189707 192.02 59194.8 14203 24.07 35291.7 50228 119.77 25123.2
SD 105.75 208.79 288.66
% RSD 0.18% 0.59% 1.16%
TABLE 12. Summary of linearity.
Name %Y Intercept Correlation coefficient Response Factor (%RSD)
Paracetamol -0.1 1.000 1.18%
Caffeine 0.4 1.000 0.59%
Ibuprofen -1.6 1.000 1.16%
Acceptance -2 to +2 NLT 0.99 NMT 5%
TABLE 13. Robustness (Low pH).
Sample
Name
Paracetamol Caffeine Ibuprofen
Peak
Area
Amount
mg/tab
%Label
Claim
Peak
Area
Amount
mg/tab
%Label
Claim
Peak
Area
Amount
mg/tab
%Label
Claim
1 7406357 326.6 100.5 552989 39.9 99.8 2073280 199.8 99.9
2 7338309 323.4 99.5 552303 39.9 99.7 2077918 200.2 100.1
www.tsijournals.com | January-2017
16
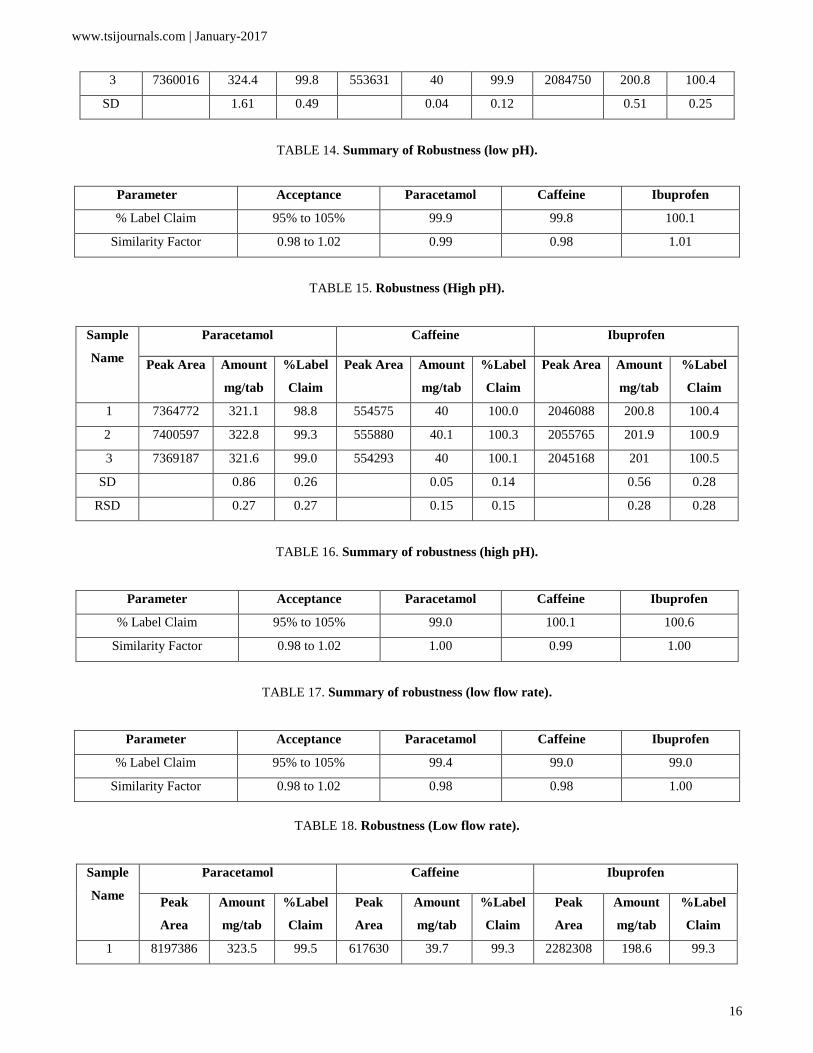
3 7360016 324.4 99.8 553631 40 99.9 2084750 200.8 100.4
SD 1.61 0.49 0.04 0.12 0.51 0.25
TABLE 14. Summary of Robustness (low pH).
Parameter Acceptance Paracetamol Caffeine Ibuprofen
% Label Claim 95% to 105% 99.9 99.8 100.1
Similarity Factor 0.98 to 1.02 0.99 0.98 1.01
TABLE 15. Robustness (High pH).
Sample
Name
Paracetamol Caffeine Ibuprofen
Peak Area Amount
mg/tab
%Label
Claim
Peak Area Amount
mg/tab
%Label
Claim
Peak Area Amount
mg/tab
%Label
Claim
1 7364772 321.1 98.8 554575 40 100.0 2046088 200.8 100.4
2 7400597 322.8 99.3 555880 40.1 100.3 2055765 201.9 100.9
3 7369187 321.6 99.0 554293 40 100.1 2045168 201 100.5
SD 0.86 0.26 0.05 0.14 0.56 0.28
RSD 0.27 0.27 0.15 0.15 0.28 0.28
TABLE 16. Summary of robustness (high pH).
Parameter Acceptance Paracetamol Caffeine Ibuprofen
% Label Claim 95% to 105% 99.0 100.1 100.6
Similarity Factor 0.98 to 1.02 1.00 0.99 1.00
TABLE 17. Summary of robustness (low flow rate).
Parameter Acceptance Paracetamol Caffeine Ibuprofen
% Label Claim 95% to 105% 99.4 99.0 99.0
Similarity Factor 0.98 to 1.02 0.98 0.98 1.00
TABLE 18. Robustness (Low flow rate).
Sample
Name
Paracetamol Caffeine Ibuprofen
Peak
Area
Amount
mg/tab
%Label
Claim
Peak
Area
Amount
mg/tab
%Label
Claim
Peak
Area
Amount
mg/tab
%Label
Claim
1 8197386 323.5 99.5 617630 39.7 99.3 2282308 198.6 99.3
www.tsijournals.com | January-2017
17
2 8172205 322.2 99.1 615123 39.5 98.8 2273102 197.6 98.8
3 8184580 323 99.4 615999 39.6 99.0 2275068 197.9 99.0
SD 0.66 0.20 0.10 0.25 0.50 0.25
RSD 0.20 0.20 0.25 0.25 0.26 0.26
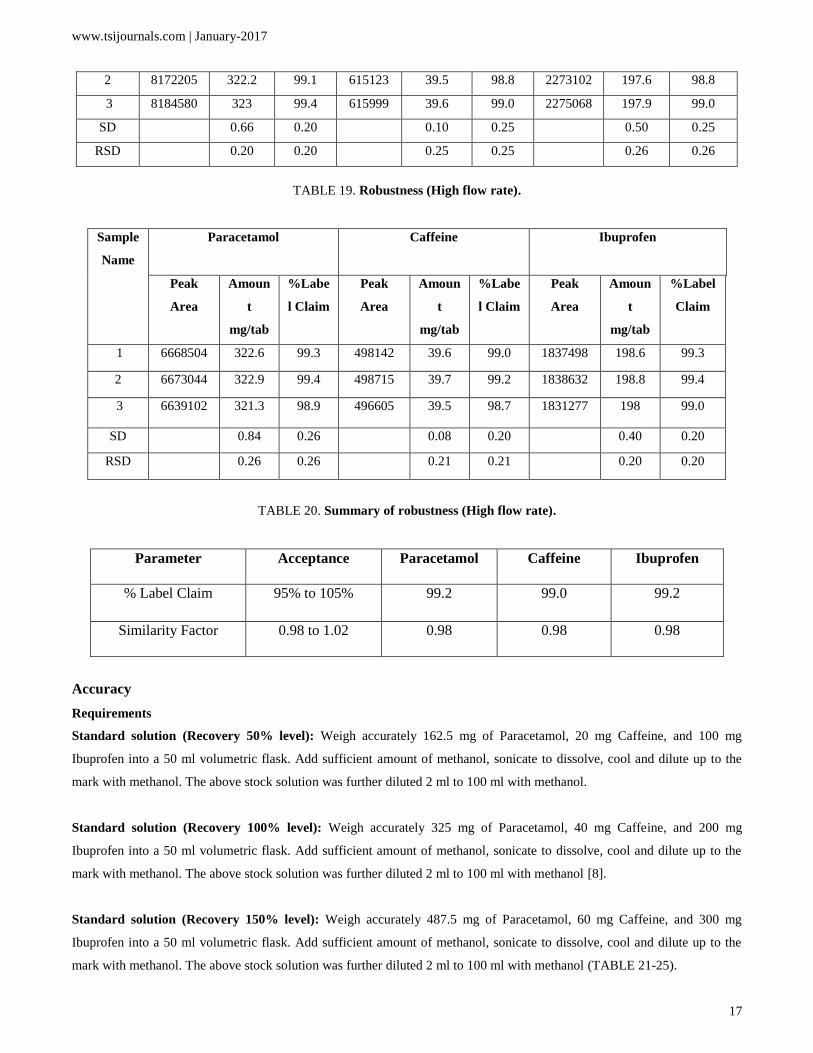
TABLE 19. Robustness (High flow rate).
Sample
Name
Paracetamol Caffeine Ibuprofen
Peak
Area
Amoun
t
mg/tab
%Labe
l Claim
Peak
Area
Amoun
t
mg/tab
%Labe
l Claim
Peak
Area
Amoun
t
mg/tab
%Label
Claim
1 6668504 322.6 99.3 498142 39.6 99.0 1837498 198.6 99.3
2 6673044 322.9 99.4 498715 39.7 99.2 1838632 198.8 99.4
3 6639102 321.3 98.9 496605 39.5 98.7 1831277 198 99.0
SD 0.84 0.26 0.08 0.20 0.40 0.20
RSD 0.26 0.26 0.21 0.21 0.20 0.20
TABLE 20. Summary of robustness (High flow rate).
Parameter Acceptance Paracetamol Caffeine Ibuprofen
% Label Claim 95% to 105% 99.2 99.0 99.2
Similarity Factor 0.98 to 1.02 0.98 0.98 0.98
Accuracy
Requirements
Standard solution (Recovery 50% level): Weigh accurately 162.5 mg of Paracetamol, 20 mg Caffeine, and 100 mg
Ibuprofen into a 50 ml volumetric flask. Add sufficient amount of methanol, sonicate to dissolve, cool and dilute up to the
mark with methanol. The above stock solution was further diluted 2 ml to 100 ml with methanol.
Standard solution (Recovery 100% level): Weigh accurately 325 mg of Paracetamol, 40 mg Caffeine, and 200 mg
Ibuprofen into a 50 ml volumetric flask. Add sufficient amount of methanol, sonicate to dissolve, cool and dilute up to the
mark with methanol. The above stock solution was further diluted 2 ml to 100 ml with methanol [8].
Standard solution (Recovery 150% level): Weigh accurately 487.5 mg of Paracetamol, 60 mg Caffeine, and 300 mg
Ibuprofen into a 50 ml volumetric flask. Add sufficient amount of methanol, sonicate to dissolve, cool and dilute up to the
mark with methanol. The above stock solution was further diluted 2 ml to 100 ml with methanol (TABLE 21-25).

www.tsijournals.com | January-2017
18
TABLE 21. Recovery table of Paracetamol, Caffeine and Ibuprofen.
Level
Paracetamol Caffeine Ibuprofen
Peak Area Amount
mg/tab
%Label
Claim
Peak
Area
Amoun
t
mg/tab
%Label
Claim
Peak
Area
Amoun
t
mg/tab
%Label
Claim
50% 3816748 101 0.22 288181 103 0.73 1050819 101 0.12
100% 7573648 99 0.14 562381 100 0.31 2035228 101 0.08
150% 11261934 99 0.03 839915 100 0.15 2991330 99 0.17
TABLE 22. Summary of accuracy.
Parameter Acceptance Criteria Paracetamol Caffeine Ibuprofen
Recovery 50% 98% to 102% 101 103 101
Recovery 100% 98% to 102% 99 100 101
Recovery 150% 98% to 102% 99 100 99
%RSD of Recovery NMT 2 0.03 0.15 0.17
Similarity Factor 0.98 to 1.02 1.00 0.99 1.00
TABLE 23. Intermediate Precision Data for Paracetamol, Ibuprofen and caffeine.
Sample
Name
Paracetamol Caffeine Ibuprofen
Peak
Area
Conc.
Response
Factor
Peak
Area
Conc.
Response
Factor
Peak
Area
Conc.
Response
Factor
1 6960251 320.8 98.7 544569 39.7 99.2 544569 39.7 99.2
2 7113910 323.7 99.6 550444 39.6 99.0 550444 39.6 99.0
3 6944705 319.3 98.2 543543 39.5 98.8 543543 39.5 98.8
4 7138815 324.8 99.9 552295 39.7 99.3 552295 39.7 99.3
5 7117815 323.8 99.6 550579 39.6 99.0 550579 39.6 99.0
6 6931597 319 98.2 543636 39.6 98.9 543636 39.6 98.9
SD 2.51 0.77 0.07 0.19 0.07 0.19
% RSD 0.78 0.78 0.20 0.20 0.20 0.20
TABLE 24. Summary of intermediate precision (Ruggedness).
Parameter Acceptance Paracetamol Caffeine Ibuprofen

www.tsijournals.com | January-2017
19
%RSD of Assay NMT 2 0.78 0.20 0.18
% Variation NMT2 0.1 0.3 1.5
Similarity Factor 0.98 to 1.02 0.98 0.99 1.00
TABLE 25. Solution stability of Paracetamol Ibuprofen and Caffeine.
Paracetamol
Caffeine
Ibuprofen
Area mg/tab %
Label
Claim
%
relative
differ
Area mg/tab %
Label
Claim
%
relative
differ
Area Amount
mg/tab
%Lab
el
Claim
%
relative
differ
0 7411567 322.6 99.3 0.0 553845 39.4 98.6 0.0 2052065 201.2 100.6 0.0
2 7436506 323.7 99.6 0.3 555885 39.6 99.0 0.4 2069954 202.9 101.5 0.9
4 7434897 323.6 99.6 0.3 555679 39.6 98.9 0.3 2067476 202.7 101.3 0.8
8 7445787 324.1 99.7 0.5 556076 39.6 99.0 0.4 2067943 202.7 101.4 0.8
12 7446004 324.1 99.7 0.5 556104 39.6 99.0 0.4 2063880 202.3 101.2 0.6
16 7419306 322.9 99.4 0.1 554280 39.5 98.7 0.1 2058591 201.8 100.9 0.3
20 7386753 321.5 98.9 0.3 552865 39.4 98.4 0.2 2055739 201.5 100.8 0.2
24 7461670 324.7 99.9 0.7 556740 39.7 99.1 0.5 2063585 202.3 101.1 0.6
Orthogonal analysis
API's from other sources need to be characterized by conventional as well as orthogonal testing's as described in ICH Q6B
[9]. Additional testing should include parameters or method to determine the suitability of the reference material not
necessarily captured by the drug substance (e.g., more extensively in tracing related substance impurities).
Conclusion
The switch over of two different methods say Isocratic/gradient analysis for the same sample ensured greater resolution of
analyte of interest in comparison with isocratic in gradient mode, and there is no relative substance impurities detected by
variation in the method confirming the purity of the samples and the method is validated according to ICH 21 CFR guidelines
and the method is robust in both isocratic and gradient mode.
References
1. Ali NW, Hegazy MA, Abdelkawy M, et al. Simultaneous determination of methocarbamol and its related substance
(guaifenesin) in 2 ternary mixtures with ibuprofen and diclofenac potassium by RP-HPLC method. J Liq
Chromatogr Relat Technol. 2012;2229-42.
2. Elkady EF, Fouad MA. Two liquid chromatographic methods for the simultaneous determination of ibuprofen and
methocarbamol or chlorzoxazone in the presence of their degradation products. J Liq Chromatogr Relat Technol.
2012;882-95.
www.tsijournals.com | January-2017
20
3. Gul S, Sultana N, Arayne MS, et al. New method for optimization and simultaneous determination of sparfloxacin
and non-steroidal anti-inflammatory drugs: Its in-vitro application. Am J Analyt Chem. 2012;328-37.
4. Harde M, Wankhede S, Chaudhari P. Development of validated UV spectrophotometric method for simultaneous
estimation of ibuprofen, paracetamol and caffeine in the bulk drug and marketed formulation. World J Pharm Res.
2015;1428-36.
5. Haritha P, Sreenivasa Rao B, Sunandamma Y. Method development and validation for simultaneous determination
of Paracetamol and Ketoprofen by RPHPLC Technique. Int J Appl Biol Pharm. 2014;110-22.
6. Liu J. Determination of 4-isobutyl acetophenone in ibuprofen injections by HPLC. 2012;672-73.
7. N Bassanese D. Protocolsfor finding themostorthogonal dimensions for two dimensional high performance liquid ch
romatography. Talanta. 2015;402-8.
8. Rajavel P. Method develop. Asian J. 2013;8-17.
9. Tuani YT, Nartey VK, Akanji O, et al. Simultaneous quantification of Paracetamol and Ibuprofen in fixed dose
combination using RP-HPLC with UV detection. IJPCR. 2014;7-15.