valgrind - people.ds.cam.ac.ukpeople.ds.cam.ac.uk/pmb39/valgrind.pdf · without arti cially...
TRANSCRIPT
Valgrind
Philip Blakely
Laboratory for Scientific Computing, University of Cambridge
Philip Blakely (LSC) Valgrind 1 / 21
Part I
Valgrind
Philip Blakely (LSC) Valgrind 2 / 21

Valgrind
http://valgrind.org/
Pronunciation: The ”Val” as in the word ”value”. The ”grind” ispronounced with a short ’i’ – ie. ”grinned” (rhymes with ”tinned”)rather than ”grined” (rhymes with ”find”).
Origin: Valgrind is the name of the main entrance to Valhalla.
Valgrind is an emulator, supporting a wide range of modernprocessors.
It contains a number of tools from memory usage (amount,uninitialised data) to performance.
Philip Blakely (LSC) Valgrind 3 / 21
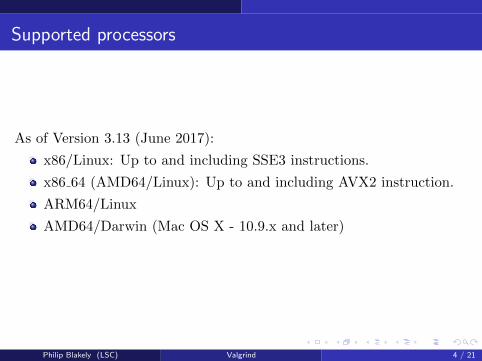
Supported processors
As of Version 3.13 (June 2017):
x86/Linux: Up to and including SSE3 instructions.
x86 64 (AMD64/Linux): Up to and including AVX2 instruction.
ARM64/Linux
AMD64/Darwin (Mac OS X - 10.9.x and later)
Philip Blakely (LSC) Valgrind 4 / 21
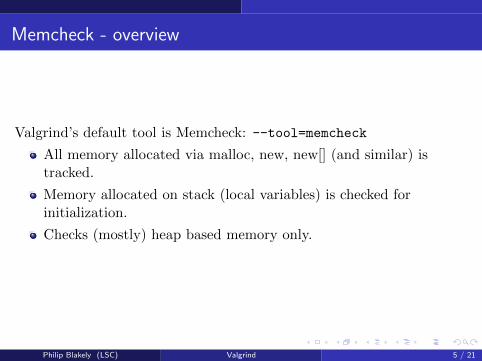
Memcheck - overview
Valgrind’s default tool is Memcheck: --tool=memcheck
All memory allocated via malloc, new, new[] (and similar) istracked.
Memory allocated on stack (local variables) is checked forinitialization.
Checks (mostly) heap based memory only.
Philip Blakely (LSC) Valgrind 5 / 21
Memcheck
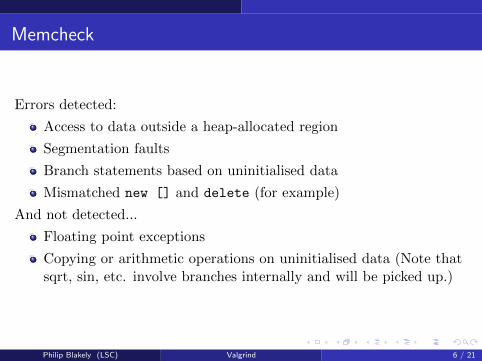
Errors detected:
Access to data outside a heap-allocated region
Segmentation faults
Branch statements based on uninitialised data
Mismatched new [] and delete (for example)
And not detected...
Floating point exceptions
Copying or arithmetic operations on uninitialised data (Note thatsqrt, sin, etc. involve branches internally and will be picked up.)
Philip Blakely (LSC) Valgrind 6 / 21

Memcheck - Example
valgrind ./UninitData
Invalid write of size n
Conditional jump depends on uninitialised value
Add --track-origins=yes
Philip Blakely (LSC) Valgrind 7 / 21
Memcheck - Run-time macros
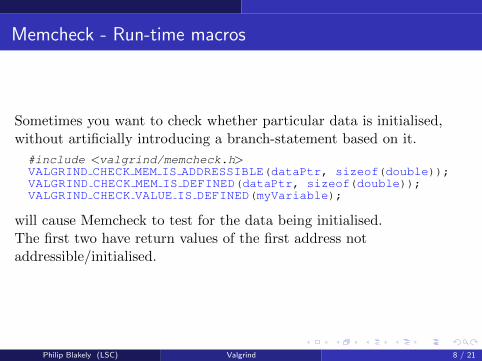
Sometimes you want to check whether particular data is initialised,without artificially introducing a branch-statement based on it.
#include <valgrind/memcheck.h>VALGRIND CHECK MEM IS ADDRESSIBLE(dataPtr, sizeof(double));VALGRIND CHECK MEM IS DEFINED(dataPtr, sizeof(double));VALGRIND CHECK VALUE IS DEFINED(myVariable);
will cause Memcheck to test for the data being initialised.The first two have return values of the first address notaddressible/initialised.
Philip Blakely (LSC) Valgrind 8 / 21
Memcheck - Attaching a debugger
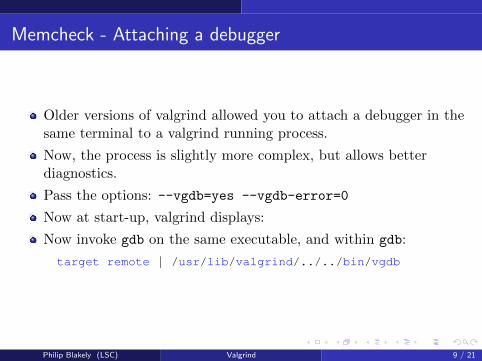
Older versions of valgrind allowed you to attach a debugger in thesame terminal to a valgrind running process.
Now, the process is slightly more complex, but allows betterdiagnostics.
Pass the options: --vgdb=yes --vgdb-error=0
Now at start-up, valgrind displays:
Now invoke gdb on the same executable, and within gdb:
target remote | /usr/lib/valgrind/../../bin/vgdb
Philip Blakely (LSC) Valgrind 9 / 21
Memcheck - checking memory status
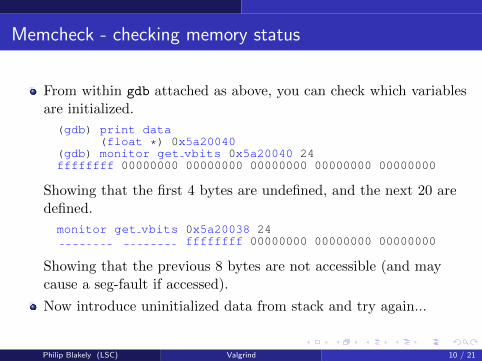
From within gdb attached as above, you can check which variablesare initialized.
(gdb) print data(float *) 0x5a20040
(gdb) monitor get vbits 0x5a20040 24ffffffff 00000000 00000000 00000000 00000000 00000000
Showing that the first 4 bytes are undefined, and the next 20 aredefined.
monitor get vbits 0x5a20038 24ffffffff 00000000 00000000 00000000
Showing that the previous 8 bytes are not accessible (and maycause a seg-fault if accessed).
Now introduce uninitialized data from stack and try again...
Philip Blakely (LSC) Valgrind 10 / 21
Leak checking
The option --leak-check=yes will generate a list of all memorynot freed using free / delete at the end of the program.
Use your judgement as to whether this is important or not; if amemory allocation is only done once (and leaks), it may notmatter.
There are different levels of memory loss:
Definitely lost: No pointers to the data exist at program exit.Still reachable: A pointer to the leaked memory can be found viaanother pointer from non-lost memoryIndirectly lost: A pointer to the leaked memory can only be foundfrom otherwise lost memory.Possibly lost: A pointer offset from the originally allocated datastart has been found, i.e. it may be possible to recover the originalpointer and free the memory.
Example: valgrind --leak-check=full DataLeak
Philip Blakely (LSC) Valgrind 11 / 21

Suppressions
All valgrind errors can be suppressed.
This may be useful for ignoring errors from libraries over whichyou have no control.
Use the --gen-suppressions option to write a suppressions file.
Philip Blakely (LSC) Valgrind 12 / 21
SGCheck
SGCheck aims to do what Memcheck does, only for stack-basedarrays.
It does this heuristically, assuming that instructions accessing aparticular array should always access that array.
Thus, a loop that attempts to access out-of-bounds of an array:
int a[10];for(int i=0 ; i <= 10 ; i++) a[i] = i;
will be caught.
Some false positives may arise, though.
See valgrind --tool=exp-sgcheck ./SGDemo
However, I haven’t used this tool much; most data in HPCapplications is on the heap.
Philip Blakely (LSC) Valgrind 13 / 21

Massif - overview
Massif periodically takes a snapshot of live heap-allocatedmemory: its size and point of allocation.
It can therefore pick up on memory leaks that are cleaned up atprogram exit (via destructor or similar).
To run using Massif:
valgrind −−tool=massif ./MassifDemo
and post-process with:
ms print massif.out.12345 > massif.out.12345.pp
Philip Blakely (LSC) Valgrind 14 / 21
Massif snapshot frequency
The frequency of snapshots is heuristically defined, but Massif willtry to capture memory-use peaks.
Typically, it will take between 50 and 100 snapshots over anyprogram.
Detailed snapshots with complete stack-traces of the provenance ofall memory allocated are only taken occasionally. Use--detailed-freq=1 for more of these.
Philip Blakely (LSC) Valgrind 15 / 21
Callgrind
Callgrind profiles code according to numbers of instructions used,and estimation of branch prediction and cache use
valgrind --tool=callgrind ./md demo
Visualise using kcachegrind, at source-line and instruction level
Caveats: The cache and branch predicition may not beparticularly realistic.
Philip Blakely (LSC) Valgrind 16 / 21

Helgrind
Thread error detector.
Detects potential deadlocks and data-races with pthreads
Pthreads not advisable for HPC development; use MPI orOpenMP.
Philip Blakely (LSC) Valgrind 17 / 21

DRD
Data-Race Detector.
Able to detect data-races and other conflicts within threadedprograms.
Some OpenMP errors may be detectable with this tool.
Philip Blakely (LSC) Valgrind 18 / 21

DHat
Dynamic heap analysis tool.
Analyses how much data is used out of dynamically allocatedarrays and how long blocks are allocated for.
Useful for detecting:
Arrays which are sparsely used (reconsider data-layout)Code lines which allocate short-lived blocks of memory (reuseexisting heap memory, change algorithm, or consider a memorypool)Code-lines which allocate blocks of memory that do not leak, butexist for a long time within the code (may well be intentional, butcan suggest regions that are almost memory-leak-like).
Philip Blakely (LSC) Valgrind 19 / 21
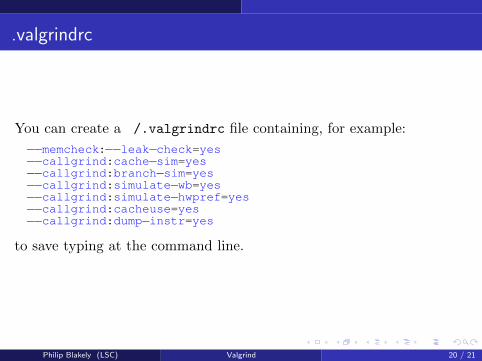
.valgrindrc
You can create a /.valgrindrc file containing, for example:
−−memcheck:−−leak−check=yes−−callgrind:cache−sim=yes−−callgrind:branch−sim=yes−−callgrind:simulate−wb=yes−−callgrind:simulate−hwpref=yes−−callgrind:cacheuse=yes−−callgrind:dump−instr=yes
to save typing at the command line.
Philip Blakely (LSC) Valgrind 20 / 21
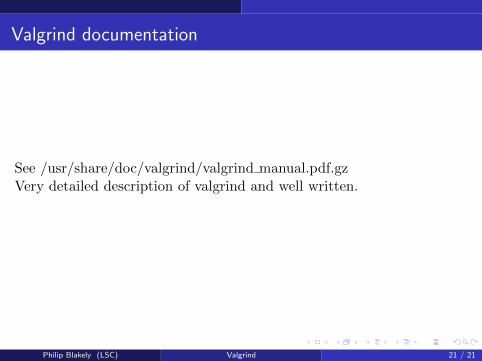
Valgrind documentation
See /usr/share/doc/valgrind/valgrind manual.pdf.gzVery detailed description of valgrind and well written.
Philip Blakely (LSC) Valgrind 21 / 21