dynamic memory analysis with valgrind tools, esxi version · dynamic memory analysis with valgrind...
TRANSCRIPT
Dynamic Memory Analysis withValgrind Tools, ESXi Version
VMware ESXi 6.7
Document Version 1.0
VMware, Inc.3401 Hillview Ave.Palo Alto, CA 94304www.vmware.com
2 VMware, Inc.
Dynamic Memory Analysis with Valgrind Tools, ESXi Version
You can find the most up-to-date technical documentation on the VMware Web site at:
http://www.vmware.com/support/
The VMware Web site also provides the latest product updates.
If you have comments about this documentation, submit your feedback to:
Copyright © 2011–2016 VMware, Inc. All rights reserved. This product is protected by U.S. and international copyright and intellectual property laws. VMware products are covered by one or more patents listed at http://www.vmware.com/go/patents.
VMware, the VMware “boxes” logo and design, Virtual SMP, VMotion, vCenter, and vCenter Server are registered trademarks or trademarks of VMware, Inc. in the United States and/or other jurisdictions. All other marks and names mentioned herein may be trademarks of their respective companies.

VMware, Inc. 3
Contents
About This Book 5Revision History 5Intended Audience 5VMware Technical Publications Glossary 5Document Feedback 5Technical Support and Education Resources 6
Installing and Using the Valgrind Tools, ESXi Version 7Overview: What are the Valgrind Tools, ESXi Version? 7
[R]Valgrind Tools 7
Installing the Valgrind Tools, ESXi Version 7
Requirements 7
Installation Procedure 8
[T]If You Have a Local Disk 8
[T]If You Do Not Have a Local Disk 8
Configuring Valgrind Tools, ESXi Version 9
Basic Configuration: Turning on the /proc File System 9
[T]Configuring for sfcbd 9
Using the Valgrind Tools, ESXi Version: Examples 9
Getting the Version and Build 9
Running memcheck on the List (ls) Command 10
Running memcheck on sfcbd 10
Running Tools Other Than memcheck 10
Running Helper Perl Scripts 11
[TS]Troubleshooting 11
[TS]Running Valgrind Tools, ESXi Version (Through ssh) on a Heavy Memory Consuming Program 11
[TS]Client Core Dump 12
Getting Additional Information About Using the Valgrind Tools, ESXi Version 12
Index 13

Dynamic Memory Analysis with Valgrind Tools, ESXi Version
4 VMware, Inc.
VMware, Inc. 5
This book, Dynamic Memory Analysis with Valgrind Tools, ESXi Version, provides information about using the
Valgrind Tools, ESXi Version, for memory debugging, memory leak detection, and cache and heap profiling.
Revision HistoryThis guide is revised with each release of the product or when necessary. A revised version can contain minor
or major changes. The following table summarizes the significant changes in each version of this guide.
Intended AudienceThis guide assumes that the reader has a working familiarity with the following:
ESXi – The conceptual underpinnings and actual functions of ESXi
Linux Kernel development– Specifically, knowledge of kernel modules on the Linux platform
SUSE Linux Enterprise Server 11 – General working knowledge
VMware Technical Publications GlossaryVMware Technical Publications provides a glossary of terms that might be unfamiliar to you. For definitions
of terms as they are used in VMware technical documentation go to http://www.vmware.com/support/pubs.
Document FeedbackVMware welcomes your suggestions for improving our documentation. If you have comments, send your
feedback to:
About This Book
NOTE The information in this book, and any use of the words “Valgrind” or “Valgrind tools” or Valgrind
toolset” applies only to the Valgrind Tools, ESXi Version.
Table 1. Revision History
Revision Description
Document Version 1.0 The first version of the Dynamic Memory Analysis with Valgrind Tools, ESXi Version.
Dynamic Memory Analysis with Valgrind Tools, ESXi Version
6 VMware, Inc.
Technical Support and Education ResourcesThe following sections describe the technical support resources available to you. If you have any additional
questions, please contact your partner representative.
Self-Service Support
Use the VMware Technology Network (VMTN) for self‐help tools and technical information:
Product information – http://www.vmware.com/products/
Technology information – http://www.vmware.com/vcommunity/technology
Documentation – http://www.vmware.com/support/pubs
VMTN Knowledge Base – http://kb.vmware.com
Discussion forums – http://www.vmware.com/community
User groups – http://www.vmware.com/vcommunity/usergroups.html
For more information about the VMware Technology Network, go to http://www.vmtn.net.
Online and Telephone Support
To use online support to submit technical support requests, view your product and contract information, and
register your products, go to http://www.vmware.com/support.
Support Offerings
To find out how VMware support offerings can help meet your business needs, go to
http://www.vmware.com/support/services.
VMware Professional Services
VMware Education Services courses offer extensive hands‐on labs, case study examples, and course materials
designed to be used as on‐the‐job reference tools. Courses are available onsite, in the classroom, and live
online. For onsite pilot programs and implementation best practices, VMware Consulting Services provides
offerings to help you assess, plan, build, and manage your virtual environment. To access information about
education classes, certification programs, and consulting services, go to http://www.vmware.com/services.
VMware, Inc. 7
Overview: What are the Valgrind Tools, ESXi Version?Valgrind Tools, ESXi Version 1.0 is an ESXi porting of Valgrind 3.7.0, a GPL (GNU General Public License)
licensed tool suite. It works with ESXi 5.5 and later versions. This suite comprises a number of tools for
memory debugging, memory leak detection, and cache and heap profiling.
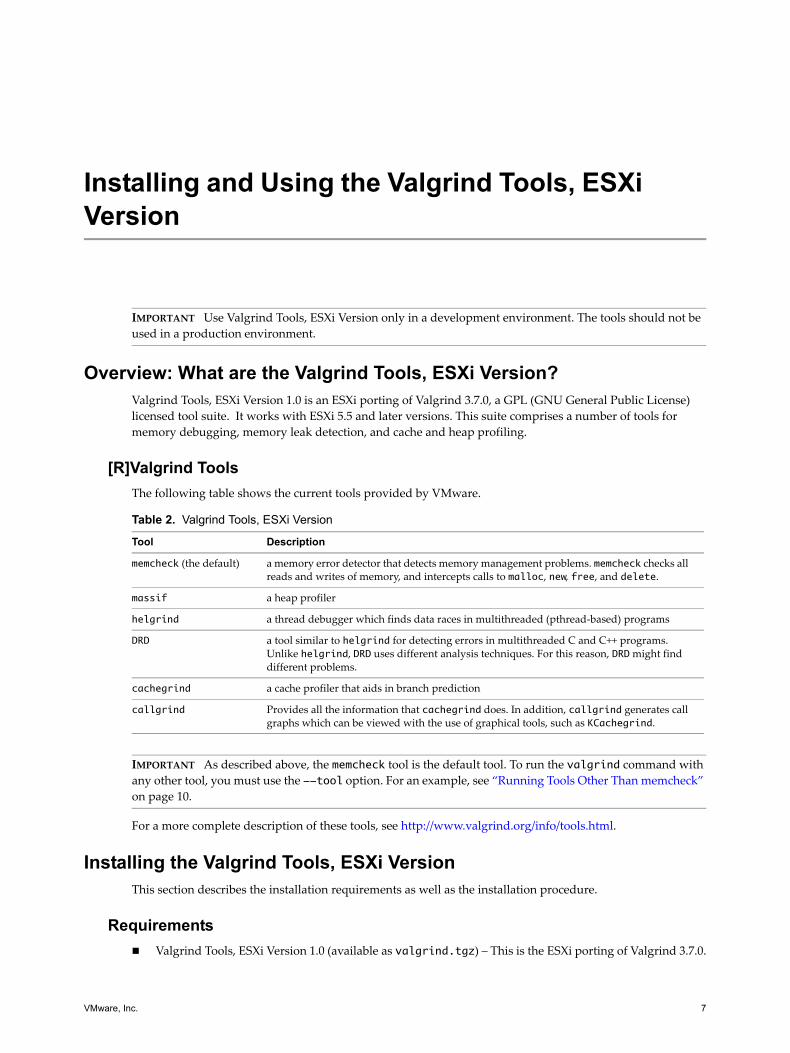
[R]Valgrind Tools
The following table shows the current tools provided by VMware.
For a more complete description of these tools, see http://www.valgrind.org/info/tools.html.
Installing the Valgrind Tools, ESXi VersionThis section describes the installation requirements as well as the installation procedure.
Requirements
Valgrind Tools, ESXi Version 1.0 (available as valgrind.tgz) – This is the ESXi porting of Valgrind 3.7.0.
Installing and Using the Valgrind Tools, ESXi Version
IMPORTANT Use Valgrind Tools, ESXi Version only in a development environment. The tools should not be
used in a production environment.
Table 2. Valgrind Tools, ESXi Version
Tool Description
memcheck (the default) a memory error detector that detects memory management problems. memcheck checks all reads and writes of memory, and intercepts calls to malloc, new, free, and delete.
massif a heap profiler
helgrind a thread debugger which finds data races in multithreaded (pthread‐based) programs
DRD a tool similar to helgrind for detecting errors in multithreaded C and C++ programs. Unlike helgrind, DRD uses different analysis techniques. For this reason, DRD might find different problems.
cachegrind a cache profiler that aids in branch prediction
callgrind Provides all the information that cachegrind does. In addition, callgrind generates call graphs which can be viewed with the use of graphical tools, such as KCachegrind.
IMPORTANT As described above, the memcheck tool is the default tool. To run the valgrind command with
any other tool, you must use the --tool option. For an example, see “Running Tools Other Than memcheck”
on page 10.
Dynamic Memory Analysis with Valgrind Tools, ESXi Version
8 VMware, Inc.
244 MB of free space (see “[T]If You Do Not Have a Local Disk” on page 8 for information about adding
memory)
KCachegrind (or some other graphical tool) – for seeing graphical representations of callgrind results.
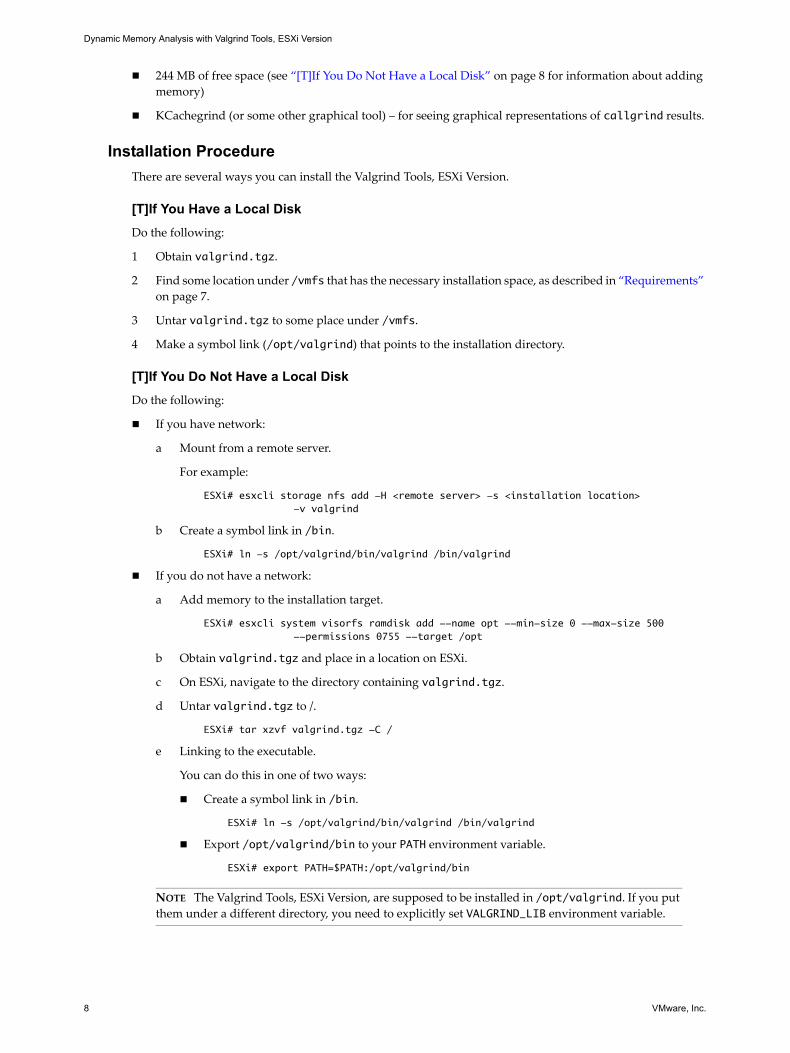
Installation Procedure
There are several ways you can install the Valgrind Tools, ESXi Version.
[T]If You Have a Local Disk
Do the following:
1 Obtain valgrind.tgz.
2 Find some location under /vmfs that has the necessary installation space, as described in “Requirements”
on page 7.
3 Untar valgrind.tgz to some place under /vmfs.
4 Make a symbol link (/opt/valgrind) that points to the installation directory.
[T]If You Do Not Have a Local Disk
Do the following:
If you have network:
a Mount from a remote server.
For example:
ESXi# esxcli storage nfs add -H <remote server> -s <installation location> -v valgrind
b Create a symbol link in /bin.
ESXi# ln -s /opt/valgrind/bin/valgrind /bin/valgrind
If you do not have a network:
a Add memory to the installation target.
ESXi# esxcli system visorfs ramdisk add --name opt --min-size 0 --max-size 500 --permissions 0755 --target /opt
b Obtain valgrind.tgz and place in a location on ESXi.
c On ESXi, navigate to the directory containing valgrind.tgz.
d Untar valgrind.tgz to /.
ESXi# tar xzvf valgrind.tgz -C /
e Linking to the executable.
You can do this in one of two ways:
Create a symbol link in /bin.
ESXi# ln -s /opt/valgrind/bin/valgrind /bin/valgrind
Export /opt/valgrind/bin to your PATH environment variable.
ESXi# export PATH=$PATH:/opt/valgrind/bin
NOTE The Valgrind Tools, ESXi Version, are supposed to be installed in /opt/valgrind. If you put them under a different directory, you need to explicitly set VALGRIND_LIB environment variable.
VMware, Inc. 9
Installing and Using the Valgrind Tools, ESXi Version
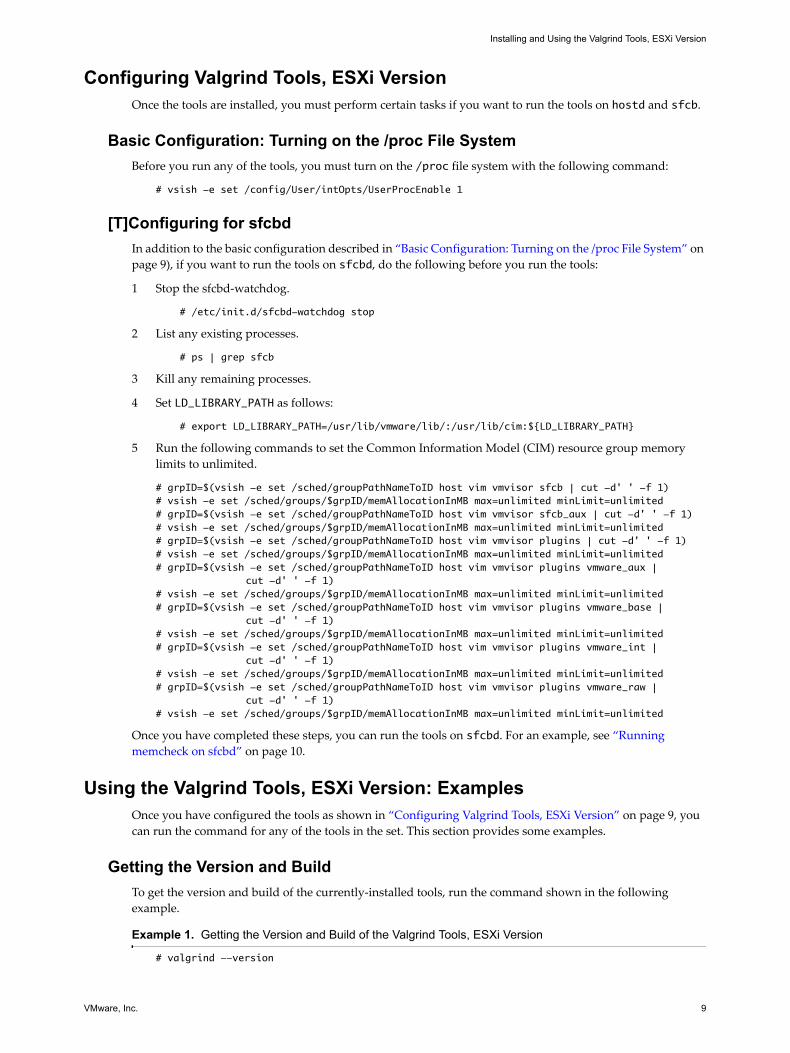
Configuring Valgrind Tools, ESXi VersionOnce the tools are installed, you must perform certain tasks if you want to run the tools on hostd and sfcb.
Basic Configuration: Turning on the /proc File System
Before you run any of the tools, you must turn on the /proc file system with the following command:
# vsish -e set /config/User/intOpts/UserProcEnable 1
[T]Configuring for sfcbd
In addition to the basic configuration described in “Basic Configuration: Turning on the /proc File System” on
page 9), if you want to run the tools on sfcbd, do the following before you run the tools:
1 Stop the sfcbd‐watchdog.
# /etc/init.d/sfcbd-watchdog stop
2 List any existing processes.
# ps | grep sfcb
3 Kill any remaining processes.
4 Set LD_LIBRARY_PATH as follows:
# export LD_LIBRARY_PATH=/usr/lib/vmware/lib/:/usr/lib/cim:${LD_LIBRARY_PATH}
5 Run the following commands to set the Common Information Model (CIM) resource group memory
limits to unlimited.
# grpID=$(vsish -e set /sched/groupPathNameToID host vim vmvisor sfcb | cut -d' ' -f 1)# vsish -e set /sched/groups/$grpID/memAllocationInMB max=unlimited minLimit=unlimited# grpID=$(vsish -e set /sched/groupPathNameToID host vim vmvisor sfcb_aux | cut -d' ' -f 1)# vsish -e set /sched/groups/$grpID/memAllocationInMB max=unlimited minLimit=unlimited# grpID=$(vsish -e set /sched/groupPathNameToID host vim vmvisor plugins | cut -d' ' -f 1)# vsish -e set /sched/groups/$grpID/memAllocationInMB max=unlimited minLimit=unlimited# grpID=$(vsish -e set /sched/groupPathNameToID host vim vmvisor plugins vmware_aux |
cut -d' ' -f 1)# vsish -e set /sched/groups/$grpID/memAllocationInMB max=unlimited minLimit=unlimited# grpID=$(vsish -e set /sched/groupPathNameToID host vim vmvisor plugins vmware_base |
cut -d' ' -f 1)# vsish -e set /sched/groups/$grpID/memAllocationInMB max=unlimited minLimit=unlimited# grpID=$(vsish -e set /sched/groupPathNameToID host vim vmvisor plugins vmware_int |
cut -d' ' -f 1)# vsish -e set /sched/groups/$grpID/memAllocationInMB max=unlimited minLimit=unlimited# grpID=$(vsish -e set /sched/groupPathNameToID host vim vmvisor plugins vmware_raw |
cut -d' ' -f 1)# vsish -e set /sched/groups/$grpID/memAllocationInMB max=unlimited minLimit=unlimited
Once you have completed these steps, you can run the tools on sfcbd. For an example, see “Running
memcheck on sfcbd” on page 10.
Using the Valgrind Tools, ESXi Version: ExamplesOnce you have configured the tools as shown in “Configuring Valgrind Tools, ESXi Version” on page 9, you
can run the command for any of the tools in the set. This section provides some examples.
Getting the Version and Build
To get the version and build of the currently‐installed tools, run the command shown in the following
example.
Example 1. Getting the Version and Build of the Valgrind Tools, ESXi Version
# valgrind --version
Dynamic Memory Analysis with Valgrind Tools, ESXi Version
10 VMware, Inc.
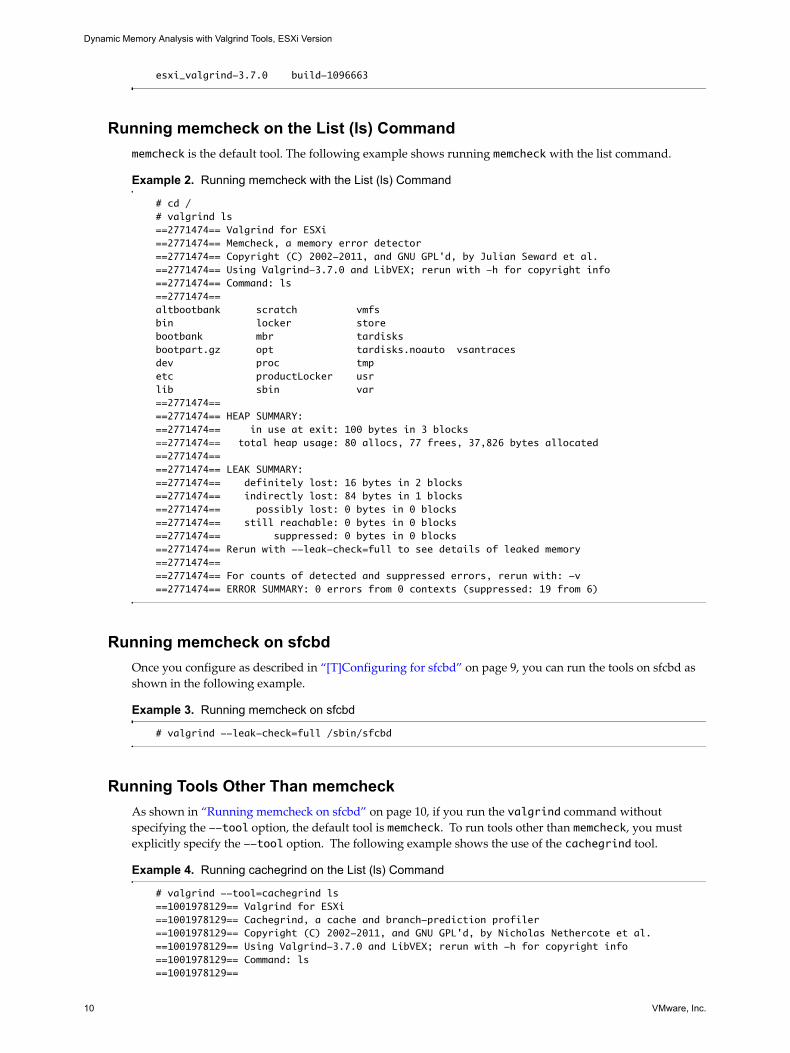
esxi_valgrind-3.7.0 build-1096663
Running memcheck on the List (ls) Command
memcheck is the default tool. The following example shows running memcheck with the list command.
Example 2. Running memcheck with the List (ls) Command
# cd /# valgrind ls==2771474== Valgrind for ESXi==2771474== Memcheck, a memory error detector==2771474== Copyright (C) 2002-2011, and GNU GPL'd, by Julian Seward et al.==2771474== Using Valgrind-3.7.0 and LibVEX; rerun with -h for copyright info==2771474== Command: ls==2771474== altbootbank scratch vmfsbin locker storebootbank mbr tardisksbootpart.gz opt tardisks.noauto vsantracesdev proc tmpetc productLocker usrlib sbin var==2771474== ==2771474== HEAP SUMMARY:==2771474== in use at exit: 100 bytes in 3 blocks==2771474== total heap usage: 80 allocs, 77 frees, 37,826 bytes allocated==2771474== ==2771474== LEAK SUMMARY:==2771474== definitely lost: 16 bytes in 2 blocks==2771474== indirectly lost: 84 bytes in 1 blocks==2771474== possibly lost: 0 bytes in 0 blocks==2771474== still reachable: 0 bytes in 0 blocks==2771474== suppressed: 0 bytes in 0 blocks==2771474== Rerun with --leak-check=full to see details of leaked memory==2771474== ==2771474== For counts of detected and suppressed errors, rerun with: -v==2771474== ERROR SUMMARY: 0 errors from 0 contexts (suppressed: 19 from 6)
Running memcheck on sfcbd
Once you configure as described in “[T]Configuring for sfcbd” on page 9, you can run the tools on sfcbd as
shown in the following example.
Example 3. Running memcheck on sfcbd
# valgrind --leak-check=full /sbin/sfcbd
Running Tools Other Than memcheck
As shown in “Running memcheck on sfcbd” on page 10, if you run the valgrind command without
specifying the --tool option, the default tool is memcheck. To run tools other than memcheck, you must
explicitly specify the --tool option. The following example shows the use of the cachegrind tool.
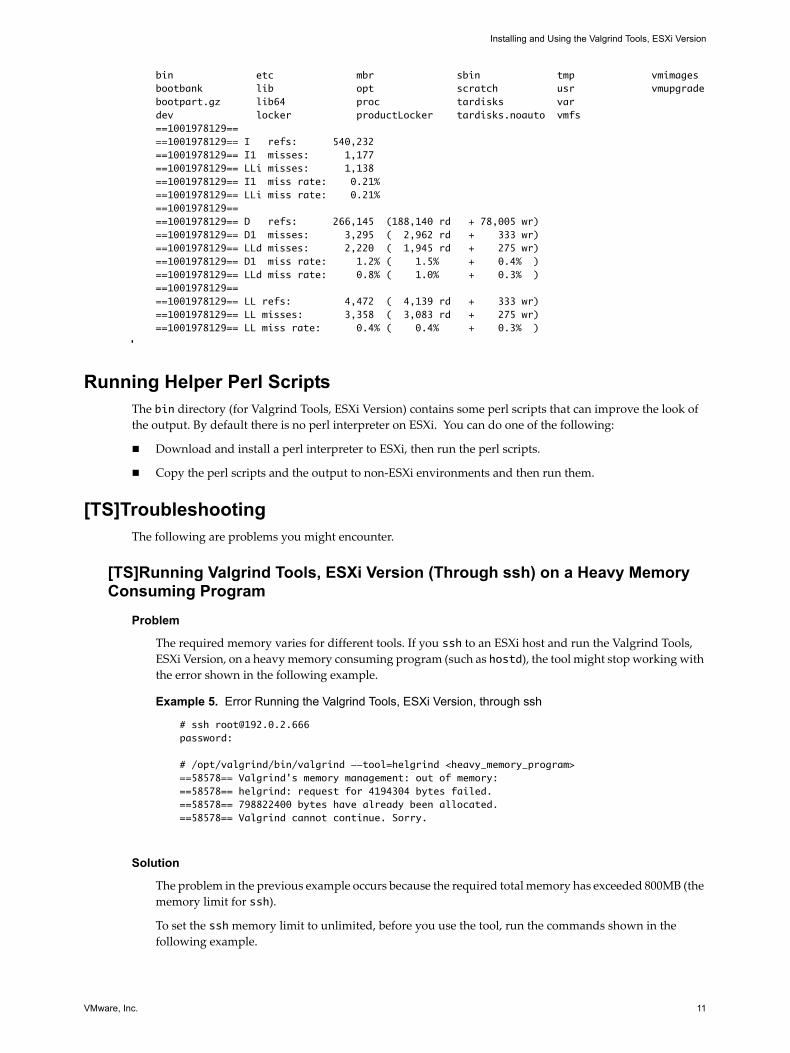
Example 4. Running cachegrind on the List (ls) Command
# valgrind --tool=cachegrind ls==1001978129== Valgrind for ESXi==1001978129== Cachegrind, a cache and branch-prediction profiler==1001978129== Copyright (C) 2002-2011, and GNU GPL'd, by Nicholas Nethercote et al.==1001978129== Using Valgrind-3.7.0 and LibVEX; rerun with -h for copyright info==1001978129== Command: ls==1001978129==
VMware, Inc. 11
Installing and Using the Valgrind Tools, ESXi Version
bin etc mbr sbin tmp vmimagesbootbank lib opt scratch usr vmupgradebootpart.gz lib64 proc tardisks vardev locker productLocker tardisks.noauto vmfs==1001978129====1001978129== I refs: 540,232==1001978129== I1 misses: 1,177==1001978129== LLi misses: 1,138==1001978129== I1 miss rate: 0.21%==1001978129== LLi miss rate: 0.21%==1001978129====1001978129== D refs: 266,145 (188,140 rd + 78,005 wr)==1001978129== D1 misses: 3,295 ( 2,962 rd + 333 wr)==1001978129== LLd misses: 2,220 ( 1,945 rd + 275 wr)==1001978129== D1 miss rate: 1.2% ( 1.5% + 0.4% )==1001978129== LLd miss rate: 0.8% ( 1.0% + 0.3% )==1001978129====1001978129== LL refs: 4,472 ( 4,139 rd + 333 wr)==1001978129== LL misses: 3,358 ( 3,083 rd + 275 wr)==1001978129== LL miss rate: 0.4% ( 0.4% + 0.3% )
Running Helper Perl ScriptsThe bin directory (for Valgrind Tools, ESXi Version) contains some perl scripts that can improve the look of
the output. By default there is no perl interpreter on ESXi. You can do one of the following:
Download and install a perl interpreter to ESXi, then run the perl scripts.
Copy the perl scripts and the output to non‐ESXi environments and then run them.
[TS]TroubleshootingThe following are problems you might encounter.
[TS]Running Valgrind Tools, ESXi Version (Through ssh) on a Heavy Memory Consuming Program
Problem
The required memory varies for different tools. If you ssh to an ESXi host and run the Valgrind Tools, ESXi Version, on a heavy memory consuming program (such as hostd), the tool might stop working with
the error shown in the following example.
Example 5. Error Running the Valgrind Tools, ESXi Version, through ssh
# ssh [email protected]:
# /opt/valgrind/bin/valgrind --tool=helgrind <heavy_memory_program>==58578== Valgrind's memory management: out of memory:==58578== helgrind: request for 4194304 bytes failed.==58578== 798822400 bytes have already been allocated.==58578== Valgrind cannot continue. Sorry.
Solution
The problem in the previous example occurs because the required total memory has exceeded 800MB (the
memory limit for ssh).
To set the ssh memory limit to unlimited, before you use the tool, run the commands shown in the
following example.
Dynamic Memory Analysis with Valgrind Tools, ESXi Version
12 VMware, Inc.
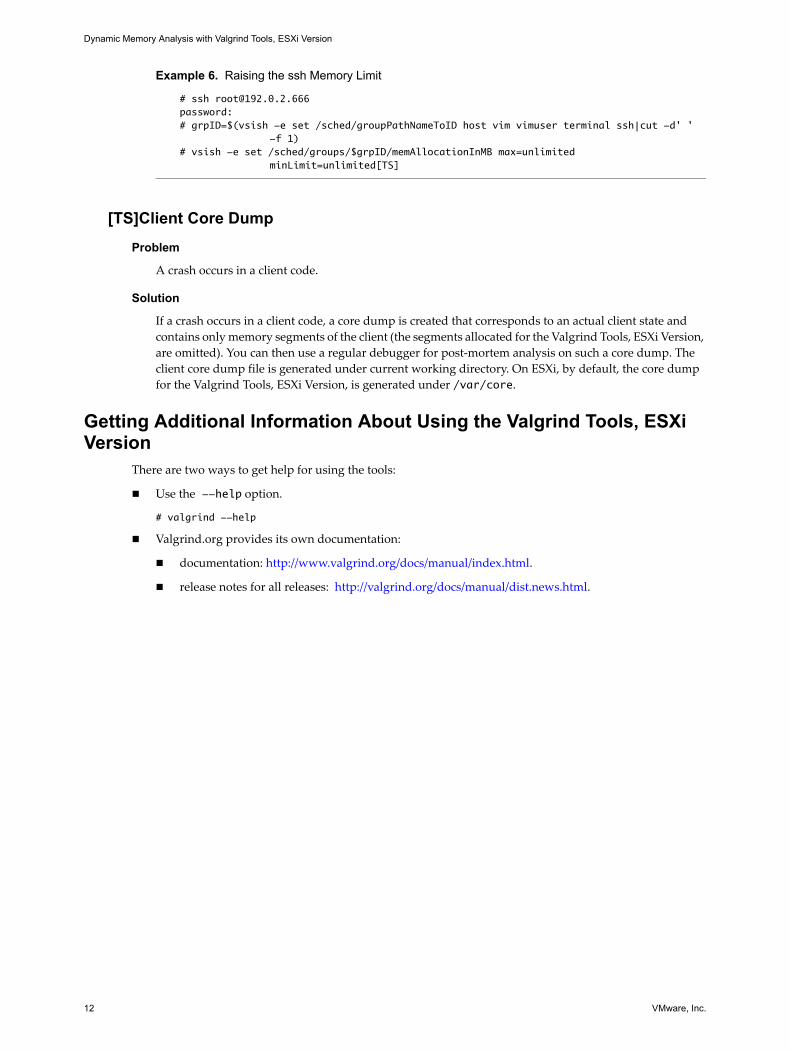
Example 6. Raising the ssh Memory Limit
# ssh [email protected]:# grpID=$(vsish -e set /sched/groupPathNameToID host vim vimuser terminal ssh|cut -d' '
-f 1)# vsish -e set /sched/groups/$grpID/memAllocationInMB max=unlimited
minLimit=unlimited[TS]
[TS]Client Core Dump
Problem
A crash occurs in a client code.
Solution
If a crash occurs in a client code, a core dump is created that corresponds to an actual client state and
contains only memory segments of the client (the segments allocated for the Valgrind Tools, ESXi Version,
are omitted). You can then use a regular debugger for post‐mortem analysis on such a core dump. The
client core dump file is generated under current working directory. On ESXi, by default, the core dump
for the Valgrind Tools, ESXi Version, is generated under /var/core.
Getting Additional Information About Using the Valgrind Tools, ESXi Version
There are two ways to get help for using the tools:
Use the --help option.
# valgrind --help
Valgrind.org provides its own documentation:
documentation: http://www.valgrind.org/docs/manual/index.html.
release notes for all releases: http://valgrind.org/docs/manual/dist.news.html.
VMware, Inc. 13
Index
Bbranch prediction 7
build
displaying the build number 9
CC and C++ programs, detecting errors in 7
cachegrind
description 7
relation to callgrind 7
call graphs
generated by callgrind 7
callgrind
description 7
relation to cachegrind 7
client code
and crashing 12
client core dump
location 12
problem and solution 12
Common Information Model (CIM)
resource group memory, setting 9
configuration
basic configuration 9
sfcbd 9
DDRD
description 7
Eexamples
displaying version and build 9
memcheck 10
running memcheck on sfcbd 10
Ggraphical tools
and viewing callgrind results 8
Hhelgrind
description 7
running on heavy memory consuming programs (through ssh) 11
helper perl scripts 11
Iinstallation
from a network 8
not from a network 8
on local disk 8
requirements 7
installation target
adding memory to 8
KKCachegrind
and callgrind 7
and viewing callgrind results 8
knowledge base, accessing 6
LLD_LIBRARY_PATH 9
local disk
installation 8
ls command
running memcheck on (example) 10
Mmassif
description 7
memcheck
description 7
example, running on ls command 10
running on sfcbd 10
memory error detection 7
memory limit
raising ssh memory limit 12
memory requirements 8
multithreaded (pthread-based) programs 7
Pperl scripts 11
/proc file system, turning on 9
pthread-based programs 7
Rremote server
mounting from 8
resource group memory, CIM
setting to unlimited 9
Dynamic Memory Analysis with Valgrind Tools, ESXi Version
14 VMware, Inc.
Ssfcbd
configuring sfcbd 9
running memcheck on (example) 10
ssh
raising the memory limit 12
Ttechnical support resources 6
thread debugger 7
troubleshooting
client core dump 12
valgrind and heavy memory programs 11
Uuser groups, accessing 6
VValgrind Tools, ESXi Version
additional information 12
and client core dump 12
basic configuration 9
build, getting 9
configuring for sfcbd 9
examples 9
improving output look 11
installation requirements 7
installing on a local disk 8
mounting from a remote server 8
non-network installation 8
overview 7
running on heavy memory consuming programs (through ssh) 11
version, getting 9
version
displaying the version 9
VMTN knowledge base 6
VMware community forums, accessing 6