vale’s performance in 3q21
TRANSCRIPT

Vale’s iron ore briquettes
VALE’S PERFORMANCE
IN 3Q21

www.vale.com
Investor Relations DepartmentIvan FadelAndré WernerMariana RochaSamir Bassil
Conference call and webcast on Friday, October 29th
- Portuguese (non-translated) at 10:00 a.m. Brasilia time
- English at noon Brasilia time (11:00 a.m. New York time, 4:00p.m. London time).
Brazil: (55 11) 4090-1621 or 4210-1803USA: (1 412) 717-9627 or toll free (1 844) 204-8942U.K.: (44 20) 3795-9972Access code: VALE
Except where otherwise indicated, the operational and financial information in this release is based on the consolidated figures in accordance with IFRS. Ourquarterly financial statements are reviewed by the company’s independent auditors. The main subsidiaries that are consolidated are the following: CompanhiaPortuária da Baía de Sepetiba, Mineração Corumbaense Reunida S.A., Minerações Brasileiras Reunidas S.A. PT Vale Indonesia Tbk, Salobo Metais S.A, ValeHoldings B.V., Vale Canada Limited, Vale International S.A., Vale Manganês S.A., Vale Malaysia Minerals Sdn. Bhd., Vale Moçambique S.A., Vale Nouvelle-Calédonie SAS, Vale Oman Pelletizing Company LLC and Vale Oman Distribution Center LLC.This press release may include statements about Vale's current expectations about future events or results (forward-looking statements). Many of those forward-looking statements can be identified by the use of forward-looking words such as "anticipate," "believe," "could," "expect," "should," "plan," "intend," "estimate"“will” and "potential," among others. All forward-looking statements involve various risks and uncertainties. Vale cannot guarantee that these statements will provecorrect. These risks and uncertainties include, among others, factors related to: (a) the countries where Vale operates, especially Brazil and Canada; (b) theglobal economy; (c) the capital markets; (d) the mining and metals prices and their dependence on global industrial production, which is cyclical by nature; and(e) global competition in the markets in which Vale operates. Vale cautions you that actual results may differ materially from the plans, objectives, expectations,estimates and intentions expressed in this presentation. Vale undertakes no obligation to publicly update or revise any forward-looking statement, whether as aresult of new information or future events or for any other reason. To obtain further information on factors that may lead to results different from those forecast byVale, please consult the reports that Vale files with the U.S. Securities and Exchange Commission (SEC), the Brazilian Comissão de Valores Mobiliários (CVM)and, in particular, the factors discussed under “Forward-Looking Statements” and “Risk Factors” in Vale’s annual report on Form 20-F.Cautionary Note to U.S. Investors – Vale currently complies with SEC Industry Guide 7 in its reporting of mineral reserves in SEC filings. SEC Industry Guide 7permits mining companies, in their filings with the SEC, to disclose only those mineral deposits that a company can economically and legally extract or produce.We present certain information in this report that are not based upon information or documentation of a qualified person (as defined in Subpart 1300 of RegulationS-K). The stated production target is based on the company's current expectations of future results or events and should not be solely relied upon by investorswhen making investment decisions. Further evaluation work and appropriate studies are required to establish sufficient confidence that this target will be met.Investors should consider closely the disclosure in our Annual Report on Form 20-F, which may be obtained from us, from our website or athttp://http://us.sec.gov/edgar.shtml.The information contained in this press release includes financial measures that are not prepared in accordance with IFRS. These non-IFRS measures differfrom the most directly comparable measures determined under IFRS, but we have not presented a reconciliation to the most directly comparable IFRS measures,because the non-IFRS measures are forward-looking, and a reconciliation cannot be prepared without unreasonable effort.

3
Vale’s 3Q21 performance
Rio de Janeiro, October 28th, 2021 – “In this third quarter, our iron ore production was close to 90million tons, with meaningful progress in the operational resumption of the Vargem GrandeComplex. We continue to work towards improving operational reliability, especially in the BaseMetals business. Our cash generation remains robust, surpassing last quarter by 18%, a pacethat allowed the payment of historic dividends in 2021. We now announce a new buybackprogram, which demonstrates our confidence in Vale's potential. By maintaining our value-over-volume strategy and optimizing costs, we will continue to create and share value with ourshareholders.”, commented Eduardo Bartolomeo, Chief Executive Officer.
In 3Q21, Vale reported a proforma adjusted EBITDA of US$ 7.109 billion, US$ 4.130 billionlower than 2Q21, mainly due to lower revenues in Ferrous Minerals and Base Metals business,following the lower iron ore realized prices and the lower nickel byproducts revenues, the laterimpacted by the labor disruption in Sudbury. Cash generation in the quarter reached US$ 7.765billion, US$ 1.238 billion higher than 2Q21.
Reparation of Brumadinho
The compensation and reparation currently reach over 11,400 people through individual andlabor indemnification agreements, with a total of R$ 2.7 billion committed, out of which R$ 2.5already paid1.
We are also evolving and working with the authorities on the implementation of the IntegralReparation Agreement. Up to September, we paid R$ 3.9 billion in relation to our commitments,such as the water safety program and the first instalments in the urban mobility andreinforcement of public service programs. For 4Q21 we expect to pay approximately R$ 9.2billion, out of which R$ 4.4 billion related to the income transfer program.
For further details on the reparation progress, an overview of ongoing works and projects, andthe terms of the Integral Reparation Agreement, please visit www.vale.com/esg.
Advancements in the ESG agenda
In September, we relinquished all our mineral rights in Indigenous Lands in Brazil, whichincludes applications for exploration permits and mining concessions. Between 2020 and 2021,Vale relinquished 104 mining processes interfering with Indigenous Lands in Brazil.
We believe that mining activities in Indigenous Lands in Brazil can only be carried out throughFree, Prior and Informed Consent (FPIC) of the indigenous people themselves.
In 3Q21, we also made concrete progress in our Climate Agenda.
In July, the first large ore carrier equipped with rotor sails arrived at the Tubarão port.The system will allow an energy efficiency increase of up to 8% per vessel per year.
1 Includes agreements signed by affected people, including those pending court verifications, and paid and payable amounts as ofOctober 21, 2021.

4
In August, the first ore carrier with air-lubrication technology, which we estimate couldreduce fuel consumption by around 5 to 8%, arrived at Ponta da Madeira port, and weannounced our partnership with Ternium to develop solutions to decarbonize the steelindustry.
In September, we announced the iron ore briquette, a new product, developed by thecompany over almost 20 years, which is able to reduce by up to 10%2 of thegreenhouse gases (GHG) emissions in the steel production (Vale’s scope 3) and is80% less intensive than pelletizing process (Vale’s scope 1 and 2).
Increasing transparency about Vale's resilience to climate change risks and opportunities andalso further detailing our climate-related commitments, Vale released in October 2021 itsClimate Change Report, which followed guidelines provided by the Task Force on Climate-Related Financial Disclosures (TCFD).
In the Diversity & Inclusion front, the company also released a dedicated report on the subject,which introduces our initiatives and progress, challenges and opportunities in this long journey.
We invite you to access both reports, as well as further information on our ESG initiatives andpractices, at www.vale.com/esg.
Capacity resumption and value-over-volume in iron ore
We remain committed to our capacity resumption plan, which is associated with eliminatingrestrictions, optimizing costs and focusing on margin preservation. In this sense, in 3Q21, wehad some significant achievements:
In the Vargem Grande complex, we started the Maravilhas III dam operation and thelong-distance conveyor belt commissioning. At the end of commissioning, an increaseof 6 Mtpy is expected in the production capacity of the site.
In the Fábrica site, we reached full capacity after the resumption of beneficiation plantsin 2Q21.
In the Mariana complex, we received the Regional Superintendence of Labor (SRT)authorization to resume regular operation of the Vitória a Minas Railroad (EFVM) onthe Fábrica Nova branch, improving the logistics of the production from the Timbopebaplant.
An essential feature of our value chain is the capacity to adapt our production and sales strategyaccording to market conditions, therefore prioritizing value over volume. We actively takemarket opportunities to manage our portfolio of products, logistics and inventories, supplyingclients under any market condition. Such is the case of the high-silica low-margin products,which we will reduce its offer by 4Mt for the fourth quarter this year after the strong pricecorrection that happened in 3Q21, adjusting for the softer demand we are seeing for thisproduct. If this scenario persists, we should also reduce the offer of low-margin products in2022 by around 12-15 Mt.
For additional information on Vale’s production in 3Q21, please see our Production and Salesreport published on October 19, 2021 here.
2 Iron ore briquettes can replace sinter and thus allow a reduction of over 10% in carbon emissions in the BF-BOF steelmaking route.

5
An eventful quarter in Base Metals
In August, Vale has concluded a new five-year collective bargaining agreement with the UnitedSteelworkers Local 6500, ending the labor disruption that began in June and affectedproduction in Sudbury of nickel and its byproducts and of which impacts we will discuss in thisreport.
In September, we had an incident in the shaft of Totten mine, Sudbury, while moving miningequipment, rendering it inoperant. The rescue team safely brought to the surface the thirty-nineunderground employees through a system of secondary ladders as part of the emergency plansand procedures. The scoop bucket that blocked the shaft has been removed and we continuewith the investigation of the incident. Production is currently halted at the site.
In October, a fire partially affected the conveyor belt at Salobo mine, with no injuries and noenvironmental damage. Operation and production at the site have resumed after being haltedfor 18 days.
Also, in October, Onça Puma mine operation was halted for a total of 13 days, following thesuspension of the operating license by the Environmental and Sustainability office of the ParáState (Secretaria de Estado de Meio Ambiente e Sustentabilidade, SEMAS). Vale resumed theactivities at the Onça Puma nickel mine after the reestablishment of the operating license,following a decision by the Minister President of the Superior Court of Justice to suspend theeffects of previous decision rendered in the process.
Sharing value creation
Cash generation in 3Q21 reached US$ 7.765 billion, US$ 1.238 billion higher than 2Q21,following the collection of the accounts receivable built in the record proforma EBITDA of 2Q21.
In September, we distributed a dividend of approximately US$ 7.4 billion based on the resultsof the first half of 2021. Considering the dividends distributed in March and June, US$ 13.5billion has been returned directly to shareholders.
In continuity with the concluding 270 million shares buyback, the Board of Directors approveda new share buyback program of up to 200 million shares, equivalent to 4.1% of the currentlyoutstanding shares of the company. The new program reflects the confidence of the company'smanagement in Vale's potential to create and share value in a consistent way.
6
Vale’s performance 3Q21
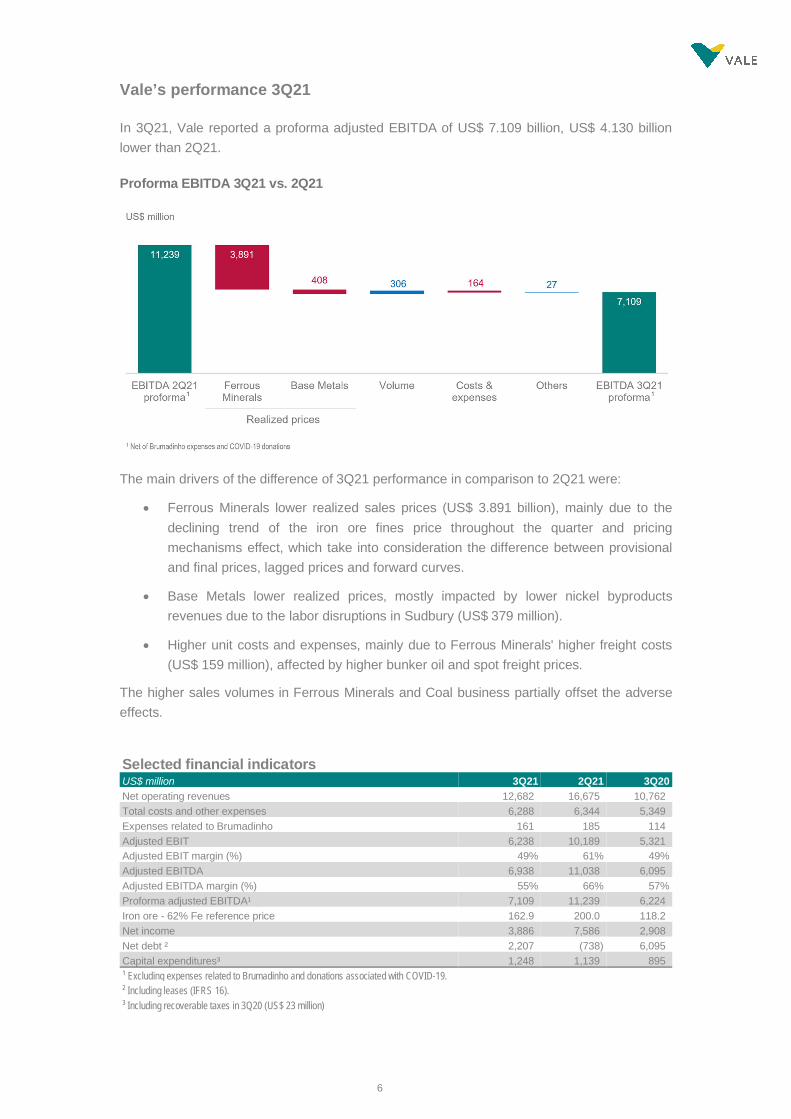
In 3Q21, Vale reported a proforma adjusted EBITDA of US$ 7.109 billion, US$ 4.130 billionlower than 2Q21.
Proforma EBITDA 3Q21 vs. 2Q21
The main drivers of the difference of 3Q21 performance in comparison to 2Q21 were:
Ferrous Minerals lower realized sales prices (US$ 3.891 billion), mainly due to thedeclining trend of the iron ore fines price throughout the quarter and pricingmechanisms effect, which take into consideration the difference between provisionaland final prices, lagged prices and forward curves.
Base Metals lower realized prices, mostly impacted by lower nickel byproductsrevenues due to the labor disruptions in Sudbury (US$ 379 million).
Higher unit costs and expenses, mainly due to Ferrous Minerals' higher freight costs(US$ 159 million), affected by higher bunker oil and spot freight prices.
The higher sales volumes in Ferrous Minerals and Coal business partially offset the adverseeffects.
Selected financial indicatorsUS$ million 3Q21 2Q21 3Q20Net operating revenues 12,682 16,675 10,762Total costs and other expenses 6,288 6,344 5,349Expenses related to Brumadinho 161 185 114Adjusted EBIT 6,238 10,189 5,321Adjusted EBIT margin (%) 49% 61% 49%Adjusted EBITDA 6,938 11,038 6,095Adjusted EBITDA margin (%) 55% 66% 57%Proforma adjusted EBITDA¹ 7,109 11,239 6,224Iron ore - 62% Fe reference price 162.9 200.0 118.2Net income 3,886 7,586 2,908Net debt ² 2,207 (738) 6,095Capital expenditures³ 1,248 1,139 895¹ Excluding expenses related to Brumadinho and donations associated with COVID-19.² Including leases (IFRS 16).³ Including recoverable taxes in 3Q20 (US$ 23 million)

7
US$ million 9M21 9M20 %Net operating revenues 42,002 25,249 66%Total costs and other expenses 17,621 15,068 17%Expenses related to Brumadinho 461 403 14%Adjusted EBIT 24,046 9,952 142%Adjusted EBIT margin (%) 57% 39% 18%Adjusted EBITDA 26,326 12,348 113%Adjusted EBITDA margin (%) 63% 49% 14%Proforma adjusted EBITDA¹ 26,815 12,851 109%Net income 17,018 4,142 311%Capital expenditures² 3,396 2,986 14%¹ Excluding expenses related to Brumadinho and donations associated with COVID-19.² Does not includes Boston Metal investment of US$ 6 million in 9M21 and includes recoverable taxes in 9M20 (US$ 23 million)
Net income was US$ 3.886 billion in 3Q21, US$ 3.700 billion lower than 2Q21, primarily due tolower proforma EBITDA and the full impairment of the investment in Coal business.
Total CAPEX for 3Q21 amounted to US$ 1.248 billion, US$ 109 million higher than in 2Q21,explained by the growth of investments in Salobo III and Serra Sul 120 Mtpy projects asplanned, the higher sustaining investments to increase safety factor of Torto dam project, andhigher expenditures in Coal business.
We ended the quarter with gross debt and leases at US$ 13.585 billion, slightly lower than2Q21. Net debt totaled US$ 2.207 billion in the same period, US$ 2.945 billion higher than2Q21, with expanded net debt following at US$ 13.881 billion.
Performance of business segments in 3Q21
Ferrous Minerals EBITDA of US$ 6.730 billion in 3Q21
Ferrous Minerals EBITDA was US$ 6.730 billion, US$ 3.949 billion lower than 2Q21, mainlydriven by 31% lower iron ore fines realized prices, but still the highest EBITDA for a thirdquarter since 2012.
Vale’s average CFR reference price was US$ 142.5/t, down US$ 59.5/t vs. 2Q21, due tosharply lower 62% Fe reference price and strong negative effect from provisional prices inthe current quarter and from the previous quarter, partially offset by the positive impact oflagged priced sales.
Sales of high-silica iron ore products still pressured Vale’s average quality premiums, whichwe expect to improve in 4Q21, following the reduction of this kind of product sales sinceSeptember due to weaker demand.
Iron ore fines and pellets EBITDA breakeven cost was US$ 49.9/t, US$ 5.4/t higher than2Q21, resulting from (i) US$ 2.5/t higher freight costs, (ii) US$ 1.9/t lower quality and pelletsadjustments, and (iii) US$ 0.5/t higher C1 costs.
We expect C1 costs ex-third-party purchases to decrease US$ 1.5/t in 4Q21 vs. 2Q21.

8
Base Metals EBITDA was US$ 505 million in 3Q21, US$ 361 million lower than 2Q21
Nickel business EBITDA was US$ 99 million in 3Q21, down US$ 331 million vs. 2Q21,mainly due to the labor disruptions in Sudbury, resulting in lower nickel sales volumes andbyproducts credits, primarily copper, PGMs and precious metals.
Copper business EBITDA was US$ 406 million in 3Q21, down US$ 30 million vs. 2Q21,mostly related to the impact of provisional price adjustments on the realized price, whichwas partially offset by higher sales volumes in South Atlantic.
Coal business EBITDA was US$ 32 million in 3Q21, US$ 196 million higher than 2Q21
Adjusted EBITDA improved significantly, reaching US$ 43 million in September, afterimproving but still negative EBITDA in July and August. The better result was mainly drivenby higher net revenues, following higher realized prices and sales volumes.
9
Market overview
Iron Ore
Iron ore 62% Fe reference price averaged US$ 162.9/dmt in 3Q21, 19% lower than 2Q21, but
27% higher than 3Q20. Along 3Q21, steel production cuts in China impacted iron ore demand
and prices retreated from high levels achieved along 2Q21. As a result of lower demand and
constant supply, iron ore stocks at China’s ports increased weighting pressure over iron ore
prices.
MB65% index averaged US$ 190.4/dmt in 3Q21, 18% lower than 2Q21 but 32% higher than
3Q20. Despite the decrease in prices, the spread between the MB65% and the 62% iron orereference price recovered along the quarter closing September at around US$ 25/t. the increase
in coal/coke prices and the high steel margins supported the high-grade premiums.
China’s steel production totalled 73.75 Mt in September, achieving accumulated steel production
of 805.9 Mt in the 9M21, an increase of 2% vs. 9M20. On the macro side, China’s GDP growth
was 4.9% YoY in 3Q21 and accumulated GDP growth in 9M 2021 was 9.8% YoY mainly due to
the low base in 2020. Construction and manufacturing sectors recorded strong rebound in the
post-pandemic economic recovery of China since 2H 2020, yet downstream activities of bothsectors were negatively affected by energy consumption control policy and tight property policy
in September and 3Q21.
According to World Steel Association (WSA), ex-China steel production totalled 214 Mt in 3Q21,
13% higher YoY and -3.4% QoQ, achieving 655 Mt during the 9M21. All the major markets have
improved output compared to 2020, however, slightly below compared to pre-pandemic levels
(9M19). The exception is Brazil, with production of 27.2 Mt in 9M21, +9.6% compared to 24.8 Mt
in 9M19. EU28, JKT and USA are still slightly below at -1.5%, -2.6% and -2.6% when compared
to 9M19 levels, respectively.
Outlook
WSA, in its latest short-term outlook, forecasts that steel demand should grow by 4.5% YoY in
2021 and further 2.2% to 1,896.4Mt in 2022, guided by the progress on vaccinations across the
world and potential new variants being less damaging and disruptive compared to previous
waves. Other regions ex-China are expected to continue and strengthen their recovery
momentum following a reduction in supply chain bottlenecks, continued pent-up demand and
rising business and consumer confidence. However, downside risks such as rising inflation and
continued slow vaccination progress in developing countries besides deceleration in China, willbe pressuring output and potentially slowing down the economic recovery momentum.

10
Coal
Coking coal: The FOB Australia premium low vol (PLV) index averaged US$262.3/t in 3Q21,up significantly from the previous quarter by US$125.8/t. The index increased steadilythroughout the quarter on the back of limited supply from Australia, strong post-pandemicdemand and high CFR China prices, which rose from an average of $258.2/t in 2Q21 to $405.1/tin 3Q21. With China’s ban on Australian coal still in place, Chinese buyers continued to seekalternative supplies from Canada, USA, Russia and Mozambique. China’s domestic productionwas affected by safety checks and reduced to meet emissions goals; Mongolian supplycontinued to be hampered by multiple COVID-related border closures.
Outlook
China’s accelerating steel cuts should dampen coking coal demand. In addition, ongoingelectricity shortages across China may lead to downward economic pressure, triggering powerrationing in energy-intensive sectors. For example, demand for finished steel is will likely beaffected as manufacturers are forced to either slow or idle production to conserve electricity.Domestic coal supply should see some recovery as China’s supply crunch should soften,though it will take time as safety will remain a top focus for domestic mines. China’s ban onAustralian coking coal is expected to remain in place. For international supply, the market viewis that availability may improve somewhat in 4Q21.
Thermal coal: In the thermal coal market, Richards Bay 6000 kcal NAR price averaged US$138.7/t in 3Q21, 33% higher than the previous quarter. Thermal coal prices were at recordhighs; Richards Bay 6000 kcal NAR price was US$ 200.2/t on September 30, and Australia6000 kcal NAR and CIF Antwerp-Rotterdam-Amsterdam 6000 kcal NAR were also both aboveUS$ 200.0/t. Coal shortage has contributed to the power crisis in China, while the natural gasshortage in Europe led to a resurgence of coal-fired power generation. Hence, global buyersraced to restock coal and ensure their power supply for winter. Heavy rains in Indonesia andrailing issues for Atlantic miners limited seaborne coal supply. The spread between theAustralian mid-CV and high-CV grades remained wide at 40% by the end of the quarter, asChina continued to ban Australian coal imports.
Outlook
The market view is that thermal coal prices should trend higher in 4Q21, as demand continuesto firm towards the northern hemisphere winter but without a matching supply response likely.The threat of La Niña repeating during winter would offer further upside to prices as it wouldbring colder weather to Northeast Asia and Europe and at the same time bring wet weathersupply disruptions to major coal-producing regions.

11
Nickel
LME nickel prices averaged US$ 19,125/t in 3Q21, 10% higher quarter over quarter and 35%higher than 3Q20.
Total exchange inventories (LME and SHFE) decreased, closing at 162.4 kt at the end of 3Q21,down 32% in the quarter and 39% year over year. LME inventories stood at 157.1 kt at the endof 3Q21, a decrease of 75.4 kt in the quarter and 79.3 kt year over year. SHFE inventoriesdecreased by 0.8 kt in the quarter and 25.1 kt year over year.
Demand/Supply
Global sales of electric vehicles (EV) are on track to increase by 84% from 3Q20, led by robustgrowth in China and Europe. EV sales continue to gain market share as manufacturers prioritizeEV sales amidst a persistent semiconductor shortage impacting total vehicle productionglobally. Preliminary figures suggest a 17% decrease in total vehicle sales in 3Q21 from theprevious quarter reflecting the impact of the semiconductor shortage and lingering pandemic-related restrictions.
Global stainless-steel production increased 9% from 3Q20. Quarter over quarter, globalproduction decreased 4% as stainless mills in China were forced to cut output due to powershortages and emissions control policies. Nickel consumption in stainless was flat in the quarteras scrap usage decreased. Year over year, nickel consumption in stainless increased 16%.Visible Chinese stainless-steel inventories increased 10% from 3Q20 and decreased 19% from2Q21 as stainless-steel demand remained strong through the summer months.
The aerospace industry continues to recover with aircraft deliveries from Boeing and Airbus up23% from 3Q20. Quarter over quarter, deliveries were down 16% after a healthy secondquarter. Despite persistent air travel restrictions in regions such as China and Australia, globalcommercial flights finished 3Q21 at 83% of pre-COVID levels, up 12% from 2Q21.
Oil and gas prices have increased dramatically as the global energy industry is experiencingshortages. Brent crude oil prices increased 6% quarter over quarter in 3Q21, while Henry Hubnatural gas prices have increased 45% quarter over quarter in 3Q21. Global rig counts haveincreased 13% in the quarter and 38% when compared to 3Q20.
3Q21 nickel production increased 14% from 3Q20 and 5% from 2Q21, as Indonesian NPIsupply increase offset production issues at Nornickel and various FeNi operations. ChineseNPI production decreased 16% in 3Q21, compared to 3Q20, while Indonesian NPI productionincreased 46% over the same period. Quarter over quarter Chinese and Indonesian NPIproduction were up 4%. China’s dual energy controls cut NPI production in September andthreaten growth in 4Q21.
Outlook
Port closures in China, container shortages and decreased ore availability exacerbated supplydeficits in the quarter, with the market expected to be in a 63 kt deficit in 2021. Downside risksexist on the demand side in the fourth quarter due to power cuts at stainless-steel mills andbattery precursor producers. Indicators of a slowing Chinese economy and rising inflation poseadditional risks.

12
In the medium-term, the shift towards the electrification of the world economies will improvedemand with solid government incentives and penalty programs continuing to drive EV adoptionrates as countries commit to low emission targets. This growth potential should favor high nickelcontent batteries chemistry due to its higher energy density. The North American supply chainis particularly dependent on this market dynamic, as the commitment to green initiatives,including the development of the EV supply chain, is forcing manufacturers to look critically atthe sustainability of upstream suppliers. In the medium term, additions to NPI and HPAL supplyplanned in Indonesia may supply a large portion of the growth requirements for stainless steeland batteries. However, environmental concerns around the CO2 intensity of NPI and the pushfor geographical diversification of the battery supply chain could result in supply shortages inthe longer term.
Our long-term outlook for nickel remains very positive, driven by strong demand in the EV sectorwith the prevalence of nickel-rich batteries. Additionally, as countries continue to set aggressivedecarbonization goals, EV growth and the infrastructure needed to support them are crucial.Markets previously heavily impacted by the pandemic, such as aerospace, are expected toimprove with the success of the global COVID-19 vaccine rollout, while energy shortages inEurope and China are putting increased pressure on an expedited shift to renewable energy.In the long term, the global pursuit of net-zero emissions should positively impact nickel demandin the stainless steel, aerospace, automotive and energy markets.
Copper
LME copper prices averaged US$ 9,372/t in 3Q21, 3% lower quarter over quarter and 44%higher than 3Q20.
Total exchange inventories (LME, SHFE, and COMEX) decreased, closing at 314.3 kt at theend of 3Q21, down 23% in the quarter and 23% year over year. LME inventories stood at 219.5kt at the end of 3Q21, increasing 8.0 kt in the quarter and 53.9 kt year over year. SHFEinventories decreased by 110.3 kt in the quarter and 126.9 kt year over year. COMEXinventories increased by 0.1 kt in the quarter and decreased 21.2 kt year over year.
Demand/Supply
Global refined copper demand increased 5.5% in 3Q21 compared to 3Q20 and 0.3% quarterover quarter. Strength in the U.S. and India offset weakness in China. Global copper use inmachinery continues to increase while utilization in consumer goods and appliances has startedto slow led by decreases in China in 3Q21. However, it is expected that all end use sectors inChina will experience growth in 2021 when compared to 2020.
Global refined copper production increased 2.3% in 3Q21 compared to 3Q20 and 1.2% quarterover quarter. Supply concerns eased in the quarter with successful labor negotiations acrossmultiple mines on strike in Chile. However, pandemic-related supply disruptions are lingeringdue to workforce availability, and power outages are threatening copper production in the fourthquarter. Aggressive smelter maintenance programs and growth in concentrate supply haveresulted in spot treatment and refining charges (TC/RCs) to increase 87% in the quarter and18% from 3Q20.

13
Outlook
It is expected that the market will be in a 77 kt deficit in 2021, as surging power costs and theongoing pandemic leads to global supply disruptions. In the medium term, the acceleratedtransition towards copper-intensive sustainable energy will support copper demand.
Our long-term outlook for copper remains very positive. Copper has a solid long-term growthprofile driven by industrialization, construction, and the buildout of electrical networkinfrastructure. Governments globally have set ambitious decarbonization targets that, coupledwith falling costs of renewable energy and stimulus investments in the green economy, will pivottowards more copper-intensive uses in renewable energy and transportation projects related toEVs. Additionally, aluminum, one of the few potential substitutes in various copper applications,saw the largest price increase in the base metal complex in 2021, following increasing electricityprices and resulting power cuts at smelters. Should aluminum sustain current levels, there is alower incentive to move away from copper. On the supply side, growth continues to strugglegiven declining ore grades and the lack of significant discoveries. In the short term, It isexpected that the quality assets currently in development should meet the increasing demand.In the medium to long term, significantly more qua0lity assets are required to replace existingoperations ramping down or closing. Higher costs could defer investment, considering potentialincreases to taxes or royalties, logistical constraints, and lower ore grades, adding risk tolonger-dated supply growth from key greenfield projects.

14
Adjusted EBITDA
Adjusted EBITDAUS$ million 3Q21 2Q21 3Q20Net operating revenues 12,682 16,675 10,762COGS (5,836) (5,805) (4,816)SG&A (115) (133) (127)Research and development (136) (141) (105)Pre-operating and stoppage expenses (165) (191) (188)Expenses related to Brumadinho (161) (185) (114)Expenses related to COVID-19 donations (10) (16) (15)Other operational expenses (26) (58) (98)Dividends and interests on associates and JVs 5 43 22Adjusted EBIT 6,238 10,189 5,321Depreciation, amortization & depletion 700 849 774Adjusted EBITDA 6,938 11,038 6,095Proforma adjusted EBITDA¹ 7,109 11,239 6,224¹ Excluding expenses related to Brumadinho and COVID-19 donations.
Adjusted EBITDA by business areaUS$ million 3Q21 2Q21 3Q20Ferrous Minerals 6,730 10,679 5,856Base Metals 505 866 792Coal 32 (164) (213)Others (158) (142) (211)Brumadinho expenses (161) (185) (114)Expenses related to COVID-19 donations (10) (16) (15)Total 6,938 11,038 6,095
Net operating revenue by business areaUS$ million 3Q21 % 2Q21 % 3Q20 %Ferrous Minerals 10,678 84.2 14,297 85.7 8,684 80.7 Iron ore fines 8,530 67.3 12,200 73.2 7,357 68.4 ROM 17 0.1 14 0.1 5 0.0 Pellets 2,009 15.8 1,947 11.7 1,195 11.1 Manganese ore 18 0.1 29 0.2 37 0.3 Ferroalloys 27 0.2 23 0.1 14 0.1 Others 77 0.6 84 0.5 76 0.7Base Metals 1,574 12.4 2,180 13.1 1,806 16.8 Nickel 761 6.0 815 4.9 794 7.4 Copper 519 4.1 711 4.3 519 4.8 PGMs¹ -20 -0.2 169 1.0 155 1.4 Gold as by-product 166 1.3 163 1.0 218 2.0 Silver as by-product 5 0.0 13 0.1 13 0.1 Cobalt 31 0.2 24 0.1 19 0.2 Others² 112 0.9 285 1.7 88 0.8Coal³ 352 2.8 161 1.0 103 1.0 Metallurgical coal 222 1.8 99 0.6 76 0.7 Thermal coal 122 1.0 60 0.4 27 0.3Others 78 0.6 37 0.2 169 1.6Total 12,682 100.0 16,675 100.0 10,762 100.0¹ In 3Q21, PGMs revenue was impacted by negative provisional price adjustments along with lower sales volumes² Includes marketing activities³ Includes US$ 8 million of general cargo in 3Q21 and US$ 2 million in 2Q21

15
COGS by business segmentUS$ million 3Q21 % 2Q21 % 3Q20 %Ferrous Minerals 4,178 71.6 3,879 66.8 2,961 61.5Base Metals 1,187 20.3 1,459 25.1 1,230 25.5Coal 364 6.2 340 5.9 321 6.7Others 107 1.8 127 2.2 304 6.3Total COGS¹ 5,836 100.0 5,805 100.0 4,816 100.0Depreciation 653 800 726COGS, ex-depreciation 5,183 5,005 4,090
¹ COGS currency exposure in 3Q21 was as follows: 53.9% USD, 41.8% BRL, 4.1% CAD and 0.2% Other currencies.
Operating expensesUS$ million 3Q21 2Q21 3Q20SG&A ex-depreciation 104 123 118SG&A 115 133 127 Administrative 90 108 106 Personnel 29 52 50 Services 29 22 28 Depreciation 11 10 9 Others 21 24 19 Selling 25 25 21R&D 136 141 105Pre-operating and stoppage expenses 165 191 188 Depreciation 36 39 39Expenses related to Brumadinho 161 185 114
Incurred expenses 161 185 114Expenses related to COVID-19 donations 10 16 15Other operating expenses 26 58 98Total operating expenses 613 724 647 Depreciation 47 49 48Operating expenses ex-depreciation 566 675 599
Impact of Brumadinho provisions and expenses in 3Q21 – in USD
US$ millionProvisions
balance30jun21
EBITDAimpact Payments
FX andother
adjustments¹
Provisionsbalance30set21
Decharacterization 2,155 - (91) (207) 1.857
Integral Reparation Agreement 4,021 - (63) (6) 3.952
Other reparation² 470 - (27) (39) 404
Total Provisions 6,646 - (181) (252) 6.213
Incurred expenses 161 (161)
Total 161 (342)1 Includes foreign exchange, present value and other adjustments² Includes individual, labor and emergency indemnifications and tailing removal and containment works

16
In 3Q21, Vale paid US$ 342 million related to Brumadinho, including the Integral ReparationAgreement (US$ 63 million), decharacterization program (US$ 91 million), other requiredreparation (US$ 27 million) and incurred expenses (US$ 161 million). The aggregate amount ofthe provisions decreased to US$ 6.2 billion, mainly due to the provision payments (US$ 181million) and Brazilian real depreciation and inflation impact (US$ 252 million).
In local currency, the provision increased from R$ 33.2 billion in 2Q21 to R$ 33.8 billion in 3Q21,mainly due to inflation adjustments, as provided in the Integral Reparation Agreement, resultingin an impact of R$ 1.737 billion. This impact was partially offset by the payments of obligationsrelated to (i) decharacterization program (R$ 481 million), (ii) other required reparation (R$ 140million) and (iii) Integral Reparation Agreement (R$ 350 million).
Payments related to the Integral Reparation Agreement for Brumadinho Reparation started in2Q21, and Vale expects to disburse US$ 1.3 billion in 4Q21 concerning the agreement.
Impact of Brumadinho provisions and expenses since 2019
US$ millionEBITDAimpact
by 2020PaymentsBy 2020
PV & FXadjust
Provisionsbalance31dec20
EBITDAimpact
in 9M21Payments
9M21FX and otheradjustments²
9M21
Provisionsbalance30set21
Decharacterization 3,241 (451) (501) 2,289 - (254) (178) 1,857Agreements &donations¹ 8,056 (2,660) (821) 4,575 - (384) 165 4,356
Total Provisions 11,297 (3,111) (1,322) 6,864 - (638) (13) 6,213
Incurred expenses 1,240 (1240) (461) (461)
Others 122 -
Total 12,569 (4,351) (461) (1.099) (13)¹ Includes Integral Reparation Agreement, individual, labor and emergency indemnifications and tailing removal and containment works2 Includes foreign exchange, present value and other adjustments

17
Pre-operating and stoppage expenses breakdownUS$ million 3Q21 2Q21 3Q20Pre-operating and stoppage expenses 165 191 188Depreciation 36 39 39Pre-operating and stoppage expenses, ex-depreciation 129 152 149Brumadinho - stoppage expenses 52 66 111
Minas Centrais Complex (Brucutu and others) - 6 22Mariana Complex (Alegria, Timbopeba and others) - - 4Paraopeba Complex (Mutuca, Fábrica¹ and others) 25 32 52Vargem Grande Complex (Vargem Grande¹, Pico and others) 27 28 33
Tubarão pellet plants 6 7 7Ontario 53 59 -Others 18 20 31
¹ Including pelletizing plants.

18
Net incomeReconciliation of proforma EBITDA to net incomeUS$ million 3Q21 2Q21 3Q20EBITDA Proforma 7,109 11,239 6,224Brumadinho & COVID-19 donations (171) (201) (129)Depreciation, depletion & amortization (700) (849) (774)Dividends received (5) (43) (22)Impairment & disposal of non-current assets (2,390) (432) (298)Financial results (373) 350 (1,360)Equity results 56 (405) 61Income taxes 360 (2,073) (794)Net income 3,886 7,586 2,908
Main factors that affected net income for 3Q21 vs. 2Q21US$ million
2Q21 Net income 7,586
EBITDA proforma (4,130)
(i) Lower realized prices and higher freight costs onFerrous Minerals business
(ii) Lower byproducts revenues in Base Metals businessdue to labor disruptions in Sudbury, partially offset byhigher realized prices and sales volumes in Coal business
Brumadinho & COVID-19 donations 30 Depreciation, depletion &amortization 149
Dividends received 38 Dividends received from pelletizing plants in 2Q21
Impairment & disposal of non-currentassets (1,958) Impairment charges on Coal business
Financial results (723)
(i) Lower mark-to-market of the Participative stockholders’debentures
(ii) Gains in derivatives in 2Q21
Equity results 461(i) Positive result from CSI due to higher steel prices
(ii) Renova foundation provision in 2Q21
Income taxes 2,433
3Q21 Net income 3,886: difference between 3Q21 and 2Q21 figures
Financial resultsUS$ million 3Q21 2Q21 3Q20Financial expenses (136) (177) (1,215) Gross interest (157) (176) (208) Capitalization of interest 14 14 13 Shareholder debentures¹ 152 (278) (553) Others (128) 273 (457) Financial expenses (REFIS) (17) (10) (10)Financial income 91 86 69Derivatives¹ (458) 856 (187) Currency and interest rate swaps (472) 788 (145) Others (commodities, etc) 14 68 (42)Foreign Exchange 372 (390) (18)Monetary variation (242) (25) (9)Financial result, net (373) 350 (1,360)¹ The cash effect of the derivatives was a gain of US$ 22 million in 3Q21 and a gain of US$ 60 million in 2Q21.

19
CAPEX
Investments in 3Q21 totaled US$ 1.248 billion, comprising US$ 963 million in the maintenance ofoperations and US$ 285 million in project execution. Investments were 9.6% higher than in 2Q21,mainly due to: (i) increase of investments in Salobo III and Serra Sul 120 Mtpy projects asplanned; (ii) higher sustaining investments in the Ferrous Minerals business mainly as a result ofthe start-up of works to increase safety factor of Torto dam project; and (iii) higher expendituresin Coal business.
Project Execution and Sustaining by business areaUS$ million 3Q21 % 2Q21 % 3Q20 %Ferrous Minerals 724 58.0 648 56.9 461 51.5Base Metals 438 35.1 426 37.4 378 42.2Coal 49 3.9 36 3.2 27 3.0Energy and others 37 3.0 29 2.5 29 3.2Total 1,248 100.0 1,139 100.0 895 100.0
Project executionInvestments in project execution totaled US$ 285 million in 3Q21, US$ 75 million higher than2Q21, mainly due to higher investments in: (i) Salobo III project after the re-planning ofcontractors’ performance; (ii) Serra Sul 120 Mtpy with the hiring of contractors; and (iii) Sol doCerrado solar project by the acquisition of electromechanical materials.
Project execution by business areaUS$ million 3Q21 % 2Q21 % 3Q20 %Ferrous Minerals 136 47.7 113 53.8 40 36.4Base Metals 113 39.6 69 32.9 69 62.7Energy and others 36 12.6 28 13.3 1 0.9Total 285 100.0 210 100.0 110 100.0
Main project developments in 3Q21
The Northern System 240 Mtpy Project concluded the earthworks of the 5th productsstockyard and started constructing the railcar weigh scale of the 3rd loading silo.
Serra Sul 120 Mtpy progressed on hiring contractors and started the vegetation clearingof the previously licensed plant site areas.
The Capanema project started the civil works in the primary crusher area.
Salobo III project delivered the concreting of crushing silos and secondary crushing andsignificant advancements to electromechanical assembly.

20
Capital projects progress indicator3
Sustaining CAPEXInvestments in the maintenance of operations totaled US$ 963 million in 3Q21, US$ 34 millionhigher than in 2Q21, mainly due to: (i) higher sustaining investments in the Ferrous Mineralsbusiness mainly as a result of the start-up of works to increase safety factor of Torto dam project;and (ii) higher expenditures in Nacala Corridor in Coal business, which were partially offset bylower investments in Voisey’s Bay Mine Extension project, as planned in the investment program.
Sustaining capex by business areaUS$ million 3Q21 % 2Q21 % 3Q20 %Ferrous Minerals 588 61.1 535 57.6 421 53.6Base Metals 325 33.7 357 38.4 309 39.4
Nickel 290 30.1 325 35.0 283 36.1Copper 35 3.6 32 3.4 26 3.3
Coal 49 5.1 36 3.9 27 3.4Energy and others 1 0.1 1 0.1 28 3.6Total 963 100.0 929 100.0 785 100.0
Sustaining capex by type - 3Q21US$ million Ferrous
MineralsBase
Metals Coal Energyand others TOTAL
Enhancement of operations 242 139 36 1 418Replacement projects 40 138 5 - 183Filtration and dry stacking projects 130 - - - 130Dam management 6 4 - - 10Other investments in dams and waste dumps 47 3 - - 50Health and Safety 47 23 3 - 73Social investments and environmental protection 20 4 4 - 28Administrative & Others 56 13 1 - 71Total 588 325 49 1 963
3 Pre-operating expenses were not included in the estimated capex for the year, although included in the total estimated capexcolumn, in line with Vale’s Board of Directors approvals. Estimated capex for the year is only reviewed once a year.
Projects Capacity(per year)
Estimatedstart-up1
Executed capex(US$ million)
Estimated capex(US$ million)
Physicalprogress
(%)3Q21 Total 2021 Total
Ferrous Minerals ProjectNorthern System240 Mtpy 10 Mt 2H22 37 329 229 772 86%1
Capanema 18 Mt2 2H23 5 6 47 495 4%
Serra Sul 120 Mtpy3 20 Mt 2H24 50 76 168 1,502 3%
Base Metals ProjectSalobo III 30-40 kt 2H22 107 578 329 1,056 81%1 Considering mine-plant project front physical progress.2 Capanema project adds 14 Mtpy capacity in Timbopeba site expedition in its first years.3 The project consists of increasing the S11D mine-plant capacity by 20 Mtpy.

21
Main project developments in 3Q21
On the Gelado project, Vale completed the assembly of the screening distributors andstarted assembling the substation control panels. The Gelado project is expected to start-up in 2H22 with 5 Mtpy capacity in the first years, as it requires Usina 1 conversion to dryprocessing to achieve full capacity (9.7 Mtpy). The conversion is expected for 2025,increasing site’s mass recovery and productivity.
On the Voisey’s Bay Mine Extension project, construction activities continue on the newpowerhouses and on the backfill system required to support the ramp-up of undergroundproduction in 2022.
Replacement projects progress indicator
Projects Capacity(per year)
Estimatedstart-up
Executed capex(US$ million)
Estimated capex(US$ million)
Physicalprogress
(%)3Q21 Total 2021 Total
Gelado 9.7 Mt 2H22 24 247 100 428 85%
Voisey’s Bay MineExtension 45 kt 1H21 127 1,282 449 1,694 70%

22
Projects under evaluation and growth options
Projects Project scope / capacity Comments
Copper
Alemão 60ktpy Cu with high gold content as
byproduct Underground mine
Stage: FEL3 / Invest decision: 2023
South Hub life of mineextension (Cristalino)
80ktpy Replacement project. Maintain
Sossego plant operating at fullcapacity
Stage: FEL3 / Invest decision: 2023
South Hub Upside or life ofmine extension (Bacaba,Barão, Visconde and 118)
Bacaba: 60 - 70 ktpy Cu Open Pit mine Replacement or optionality to
increase production
Stage: FEL2 completed
118, Visconde and Barão: Satellite deposits being developed to
assess potential options to increaseproduction
Stage: FEL 1
North Hub 70-100ktpy Cu potential in North Hub Growth Project Stage: FEL 1
Salobo IV +30ktpy potential Growth project
Stage: FEL1
Victor 20ktpy Cu + 4ktpy Ni JV partnership under discussionStage: FEL2
Hu’u +250ktpy1 Cu potential + 200koz Au Underground block cave Growth Project
Stage: FEL2
Nickel
Onça Puma 2nd furnace +50 yrs LoM +12 - 15ktpy Ni Stage: FEL3 / Invest decision: 2022
Bahodopi 20-year mine saprolite ore RKEF FeNi smelter plant Production: 70ktpy Ni
Mine owned by PTVI, FeNi plant ownedthrough JVStage: FEL3 / Invest decision: 2021/2022
Pomalaa
30-year mine limonite and saproliteore
HPAL plant Production: 40ktpy1 Ni + 4ktpy Co as
byproduct
Mine owned by PTVI, HPAL plant ownedthrough JVStage: FEL3 / Invest decision: 2022
CCM PH 3&4 Replacement Underground mine Stage: FEL2
Thompson Mine ExtensionPH2
Life extension Underground mine Stage: FEL2
Iron ore
Serra Norte N1/N2 Replacement project of 50 Mtpy ofROM in Serra Norte.
Stage: FEL3 / Invest decision: 2022Start-up: 2026
New Steel plants Plants in Oman, Fábrica and
Fazendão Capacity: 17 Mtpy
Stage: FEL2 / Invest decision: 2022/2023Start-up: 2024/2026
Serra Leste expansion Growth project Project’s capacity under evaluation
Stage: FEL2 / Invest decision: 2022Start-up: 2025
S11C Expand Serra Sul to ore body CReplacement project. Stage: FEL2
Briquetting plants
3 plants under construction (7 Mtpycapacity)
5 other plants currently under analysis(FEL 1)
Stage: FEL1 / Invest decision: 2024/2026
1 Considering full equity in Sumbawa Timur Mining and based on initial studies arising from the ongoing prefeasibility study.

23
Free cash flow
In 3Q21, Vale had a strong Free Cash Flow from Operations of US$ 7.765 billion.
The quarter was marked by the positive impact of working capital variation, which was mainlydriven by a significant decrease in accounts receivable explained by the combined effect of (i)strong collection from elevated accrual sales volume and price registered in 2Q21; and (ii) loweraccrual sales volumes and price registered in 3Q21.
Consistent with our capital allocation strategy, Vale distributed US$ 7.391 billion to shareholdersand repurchased US$ 2.841 billion of its shares.
Free Cash Flow 3Q21

24
Debt
Gross debt totaled US$ 11.951 billion as of September 30, 2021, slightly lower than June 30,2021. Net debt position increased to US$ 2.207 billion in the same period, US$ 2.945 billion higherthan 2Q21, mainly due to the US$ 7.4 billion dividend payment in September and the US$ 2.8billion share buyback program in 3Q21, partially offset by the strong cash flow generation.
Expanded net debt increased to US$ 13.881 billion as of September 30, 2021, mainly due to theincrease mentioned above in net debt.
Average debt maturity was 8.8 years on September 30, 2021, and the average cost of debt, aftercurrency and interest rate swaps, was 4.62 % per annum, both in line with 2Q21.
Debt indicatorsUS$ million 3Q21 2Q21 3Q20Gross debt ¹ 11,951 12,154 13,444Lease (IFRS 16) 1,634 1,708 1,621Gross debt and leases 13,585 13,862 15,065Cash, cash equivalents and short-term investments 11,378 14,600 8,970Net debt 2,207 (738) 6,095Currency swaps² 786 357 1,161Refis 2,410 2,692 2,600Brumadinho provisions 6,213 6,646 3,124Samarco & Renova Foundation provisions 2,265 2,491 1,485Expanded net debt 13,881 11,448 14,465Total debt / adjusted LTM EBITDA (x) 0.4 0.5 0.8Net debt / adjusted LTM EBITDA (x) 0.07 (0.02) 0.44Adjusted LTM EBITDA / LTM gross interest (x) 41.1 37.4 19.4¹ Does not include leases (IFRS 16).² Includes interest rate swaps.

25
Performance of the business segments
Segment information ― 3Q21, as per footnote of financial statementsExpenses
US$ millionNet
operatingrevenues
Cost¹ SG&A andothers¹ R&D¹ Pre operating
& stoppage¹
Dividendsand interest
receivedfrom
associatesand JVs
AdjustedEBITDA
Ferrous Minerals 10,678 (3,785) (33) (55) (75) - 6,730 Iron ore fines 8,530 (3,064) (32) (53) (61) - 5,320 Pellets 2,009 (612) (2) (1) (10) - 1,384 Others ferrous 94 (76) - - - - 18 Mn & Alloys 45 (33) 1 (1) (4) - 8Base Metals 1,574 (1,024) 51 (43) (53) - 505 Nickel² 896 (782) 57 (20) (52) - 99 Copper³ 678 (242) (6) (23) (1) - 406Coal 352 (314) (5) (1) - - 32Others 78 (60) (143) (37) (1) 5 (158)Subtotal 12,682 (5,183) (130) (136) (129) 5 7,109Brumadinho impact - - (161) - - - (161)COVID-19 donations - - (10) - - - (10)Total 12,682 (5,183) (301) (136) (129) 5 6,938¹ Excluding depreciation, depletion and amortization.² Including copper, by-products from our nickel operations and marketing activities.³ Including by-products from our copper operations.

26
Ferrous Minerals
Ferrous Minerals adjusted EBITDA totaled US$ 6.730 billion, a 37% decrease vs. 2Q21, guidedby a sharp reduction of price index, but still the highest EBITDA result for a third quarter since2012. The adjusted EBITDA per ton for Ferrous Minerals, excluding Manganese and Ferroalloys,totaled US$ 88.6/t, a decrease of US$ 53.9/t compared to 2Q21.
Ferrous Minerals EBITDA variation – US$ million (3Q21 x 2Q21)
The share of premium products4 in total sales was 80% in 3Q21, in line with 2Q21.
Iron ore fines and pellets quality premiums reached US$ 6.6/t, US$ 1.8/t lower than in 2Q21, dueto (i) lower premiums paid to low alumina ores, as BRBF and IOCJ; and (ii) lower contributionfrom Pellets business as the 65/62% Fe index spread narrowed. The lower premiums werepartially offset by (i) higher Fe content premiums, despite the lower benchmark index, due to thelower sales of high-silica iron ore products; and (ii) higher contractual pellet premiums.
Iron ore fines and pellets quality premiumUS$/t 3Q21 2Q21 3Q20
Iron ore fines quality premium 1.9 3.0 3.7
Pellets weighted average contribution 4.6 5.4 0.9
Iron ore fines and pellets total quality premium 6.6 8.4 4.6
Share of premium products¹ (%) 80% 82% 83%
¹ Composed of pellets, Carajás (IOCJ), Brazilian Blend Fines (BRBF) and pellet feed.
Volume sold‘000 metric tons 3Q21 2Q21 3Q20Iron ore fines 67,304 66,740 65,607ROM 540 479 162Pellets 8,037 7,647 8,464Manganese ore 111 169 428Ferroalloys 16 15 15
4 Pellets, Carajás (IOCJ), Brazilian Blend Fines (BRBF) and pellet feed.

27
Net operating revenue by productUS$ million 3Q21 2Q21 3Q20Iron ore fines 8,530 12,200 7,357ROM 17 14 5Pellets 2,009 1,947 1,195Manganese & Ferroalloys 45 52 51Others 77 84 76Total 10,678 14,297 8,684
Iron ore fines (excluding Pellets and ROM)
Iron ore fines EBITDA variation – US$ million (3Q21 x 2Q21)
Revenues and sales volumes
Iron ore fines’ net revenues, excluding pellets and run of mine (ROM), were US$ 8,530 billion in3Q21 vs. US$ 12.200 billion in 2Q21, as a result of lower realized prices (US$ 3,786 billion),partially offset by higher sales volumes (US$ 116 million).
Sales volumes of iron ore fines totaled 67.3 Mt in 3Q21, and CFR sales totaled 53.3 Mt in 3Q21,representing 79% of total sales, both in line with 2Q21.
Pricing system breakdown (%)

28
Vale’s realized price CFR/FOB totaled US$ 126.7/t, a decrease of US$ 56.1/t compared with2Q21 mainly due to (i) lower 62% Fe reference price (US$ 37.1/t); (ii) a strong negative effectfrom provisional prices in the current quarter (US$ 16.7/t), as 33% of the sales volumes wereprovisionally set at US$ 117.7/t at the end of 3Q21 vs. the average benchmark price of US$162.9/t in the quarter; and (iii) pricing adjustments of provisional price sales set in the previousquarter (US$ 13.7/t), as the provisional price of US$ 206.9/t at the end of 2Q21 was significantlyhigher than of the average benchmark price. The positive impact of lagged priced sales of US$2.0/t, US$ 9.8/t higher than 2Q21, partially offset the adverse effects.
In 3Q21, sales of high-silica iron ore products still pressured Vale’s average quality premiums,which we expect to improve in 4Q21 as Vale has been reducing the sales of this kind of productsince September due to weaker demand.
Price realization iron ore fines – US$/t, 3Q21
Average pricesUS$/ metric ton 3Q21 2Q21 3Q20Iron ore - Metal Bulletin 65% index 190.4 232.9 129.2Iron ore - Metal Bulletin 62% low alumina index 164.7 202.1 118.7Iron ore - 62% Fe reference price 162.9 200.0 118.2Provisional price at the end of the quarter 117.7 206.9 119.8Iron ore fines Vale CFR reference (dmt) 142.5 202.0 123.1Iron ore fines Vale CFR/FOB realized price 126.7 182.8 112.1Pellets CFR/FOB (wmt) 249.9 254.7 141.2Manganese ore 163.9 171.8 85.3Ferroalloys 1,792.3 1,508.1 968.2

29
Costs
IRON ORE COGS - 2Q21 x 3Q21Variance drivers
US$ million 2Q21 Volume Exchange rate Others Totalvariation 3Q21
C1 cash costs 1,479 13 8 29 50 1,529
Freight 925 17 - 135 152 1,077
Distribution costs 80 1 - 1 2 82
Royalties & others 332 3 - 41 44 376
Total costs beforedepreciation andamortization
2,816 34 8 206 248 3,064
Depreciation 312 3 4 (31) (24) 287Total 3,128 37 11 175 224 3,351
Vale’s C1 cash cost ex-third-party purchases totaled US$ 18.1/t, increasing US$ 0.3/t from 2Q21as a result of (i) consumption of inventories with higher average production costs in 2Q21; (ii)higher service costs; and (iii) negative effect of foreign exchange, which were partially offset by(i) higher dilution of fixed cost as a result of production increase, particularly in the NorthernSystem; and (ii) lower demurrage cost with performance improvement at Ponta da MadeiraTerminal, after the maintenance carried out in 1H21.
As disclosed in 2Q21 Performance Report, Vale expects C1 costs ex-third-party purchases for4Q21 (vs. 2Q21) to decrease around US$ 1.5/t, mainly due to higher dilution of fixed costs andnormalization of demurrage costs.
Third-party purchases are usually priced with one month lag. As a result, despite the drop inaverage iron ore price in 3Q21, Vale’s average third-party purchase C1 cash cost increased fromUS$ 78.6/t in 2Q21 to US$ 81.9/t in 3Q21 as the 62% Fe benchmark index averaged US$ 195/tbetween June-August vs. US$ 184/t between March-May. In 4Q21, Vale expects a reduction ofthird-party purchase costs if prices persist at October’s levels.
C1 cash cost variation (excluding 3rd party purchases) – US$/t (3Q21 x 2Q21)

30
Vale's shipping strategy relies on securing a major part of its CFR sales with long-term contractsof affreightment to transport cargo in larger and more efficient vessels, as Valemaxes andGuaibamaxes, reducing the impact in a scenario of volatility in the freight market.
Vale's unit maritime freight cost was US$ 20.2/t in 3Q21, US$ 2.5/t higher than 2Q21, mainlyexplained by: (i) higher spot freight market and seasonally higher exposure to this market (±US$1.7/t), despite the significant increase in the spot freight market of approximately US$ 5,0/t in thisperiod; (ii) higher bunker fuel costs (±US$ 1.0/t).
In 4Q21, Vale does not expect to be impacted by the hike of spot freight market cost observed inOctober as: (i) part of Vale's spot vessels affreightment requirements were already contractedunder better conditions; and (ii) Vale should lower its supply of high-silica low-margin products byaround 4 Mt, therefore requiring fewer spot vessels affreightment.
Iron ore fines cash cost and freight3Q21 2Q21 3Q20
Costs (US$ million) Vale’s iron ore fines C1 cash cost (A) 1,529 1,479 977 Third-party purchase costs¹ (B) 397 378 209 Vale’s C1 cash cost ex-third-party volumes (C = A – B) 1.132 1.102 768Sales volumes (Mt) Volume sold (ex-ROM) (D) 67.3 66.7 65.6 Volume sold from third-party purchases (E) 4.8 4.8 4.1 Volume sold from own operations (F = D – E) 62.5 61.9 61.5Iron ore fines cash cost (ex-ROM, ex-royalties), FOB (US$ /t) Vale’s C1 cash cost ex-third-party purchase cost (C/F) 18.1 17.8 12.5 Average third-party purchase C1 cash cost (B/E) 81.9 78.6 50.8 Vale's iron ore cash cost (A/D) 22.7 22.2 14.9Freight Maritime freight costs (G) 1,077 925 840 % of CFR sales (H) 79% 78% 81% Volume CFR (Mt) (I = D x H) 53.3 52.3 53.5 Vale's iron ore unit freight cost (US$/t) (G/I) 20.2 17.7 15.7
¹ Includes logistics costs related to third-party purchases.
EXPENSES
Iron ore fines expenses, net of depreciation, amounted to US$ 146 million in 3Q21, US$ 32 millionlower than 2Q21, mainly due to (i) lower Brumadinho stoppage expenses (US$ 12 million); (ii)absence of the non-recurring expense of MBR incorporation (US$ 11 million), which impacted2Q21 results; and (iii) lower impact from clients’ claims (US$ 7 million).

31
Expenses - iron ore finesUS$ millions 3Q21 2Q21 3Q20Selling 19 17 13R&D 53 43 31Pre-operating and stoppage expenses 61 74 121
Brumadinho stoppage expenses 49 61 102 Others 12 13 19
Other expenses 13 44 38Total expenses 146 178 203
Iron ore pelletsAdjusted EBITDA for pellets was US$ 1.384 billion in 3Q21, only 4% lower than in 2Q21, despitethe lower 65%Fe price index (19% lower vs. 2Q21) and higher freight costs, which was offset byhigher volumes, the positive effect of lagged prices and higher contractual premiums.
Realized prices in 3Q21 averaged US$ 249.9/t, decreasing only US$ 4.8/t vs. 2Q21. The sharplylower 65% Fe price index was almost totally offset by the positive effect from pricing mechanisms,as pellet sales are predominantly linked to lagged prices (43% in 3Q21).
FOB pellets sales of 5.1 Mt in 3Q21, representing 63% of total pellets sales, were in line with2Q21. CFR pellets sales amounted to 2.9 Mt in 3Q21.
Costs totaled US$ 612 million (or US$ 694 million with depreciation charges) in 3Q21. Excludingthe impact of higher sales volumes of US$ 30 million, costs, considering FX variation, increasedby US$ 62 million when compared with 2Q21, mainly due to higher leasing costs, as a result ofhigher premiums, and higher freight costs.
Pellets - EBITDA3Q21 2Q21
US$million US$/wmt US$
million US$/wmt
Net revenues / Realized price 2,009 249.9 1,947 254.7Dividends received (Leased pelletizing plants) - - 22 2.9
Cash costs (Iron ore, leasing, freight, overhead, energy and other) (612) (76.1) (520) (68.0)
Pre-operational & stoppage expenses (10) (1.2) (13) (1.7)Expenses (Selling, R&D and other) (3) (0.4) 2 0.3EBITDA 1,384 172.2 1,438 188.0

32
Iron ore fines and pellets cash break-even5
Iron ore and pellets cash break-even landed in China¹US$/t 3Q21 2Q21 3Q20Vale's C1 cash cost ex-third-party purchase cost 18.1 17.8 12.5Third party purchases cost adjustments 4.6 4.4 2.4Vale's iron ore cash cost (ex-ROM, ex-royalties), FOB (US$ /t) 22.7 22.2 14.9Iron ore fines freight cost (ex-bunker oil hedge) 20.2 17.7 15.7Iron ore fines distribution cost 1.2 1.2 0.7Iron ore fines stoppage expenses² related to Brumadinho 0.7 0.9 1.6Iron ore fines expenses² & royalties 7.1 6.7 4.5Iron ore fines moisture adjustment 4.5 4.2 3.3Iron ore fines quality adjustment (1.9) (3.0) (3.7)Iron ore fines EBITDA break-even (US$/dmt) 54.6 49.9 37.0Iron ore fines pellet adjustment (4.6) (5.4) (0.9)Iron ore fines and pellets EBITDA break-even (US$/dmt) 49.9 44.5 36.1Iron ore fines sustaining investments 8.1 7.5 5.8Iron ore fines and pellets cash break-even landed in China (US$/dmt) 58.0 52.0 41.9
¹ Measured by unit cost + expenses + sustaining investment adjusted for quality² Net of depreciation and includes dividends received
Volume sold by destination – Iron ore and pellets‘000 metric tons 3Q21 2Q21 3Q20Americas 9,135 9,939 7,663 Brazil 7,666 7,633 5,639 Others 1,469 2,306 2,024Asia 60,020 56,381 60,833 China 47,350 45,142 50,448 Japan 7,337 6,054 5,314 Others 5,333 5,185 5,071Europe 4,722 6,215 3,104 Germany 1,096 825 468 France 625 1,539 591 Others 3,001 3,851 2,045Middle East 486 1,566 1,616Rest of the World 1,518 765 1,017Total 75,881 74,866 74,233
Selected financial indicators - Ferrous MineralsUS$ million 3Q21 2Q21 3Q20Net Revenues 10,678 14,297 8,684Costs¹ (3,785) (3,446) (2,599)Expenses¹ (33) (59) (53)Pre-operating and stoppage expenses¹ (75) (91) (146)R&D expenses (55) (44) (32)Dividends and interests on associates and JVs - 22 2Adjusted EBITDA 6,730 10,679 5,856Depreciation and amortization (412) (455) (403)Adjusted EBIT 6,318 10,224 5,453Adjusted EBIT margin (%) 59.2 71.5 62.8¹ Net of depreciation and amortization
5 Does not include the impact from the iron ore fines and pellets pricing system mechanism.

33
Selected financial indicators - Iron ore finesUS$ million 3Q21 2Q21 3Q20Adjusted EBITDA (US$ million) 5,320 9,206 5,090Volume Sold (Mt) 67.3 66.7 65.6Adjusted EBITDA (US$/t) 79 138 78
Selected financial indicators - PelletsUS$ million 3Q21 2Q21 3Q20Adjusted EBITDA (US$ million) 1,384 1,438 748Volume Sold (Mt) 8.0 7.6 8.5Adjusted EBITDA (US$/t) 172 188 88
Selected financial indicators - Ferrous ex Manganese and FerroalloysUS$ million 3Q21 2Q21 3Q20Adjusted EBITDA (US$ million) 6,722 10,671 5,861Volume Sold (Mt)¹ 75.9 74.9 74.2Adjusted EBITDA (US$/t) 89 143 79
¹ Volume including iron ore fines, pellets and ROM.

34
Base Metals
Base Metals adjusted EBITDA6 was US$ 505 million in 3Q21, US$ 361 million lower than 2Q21
The lower EBITDA in the quarter was mainly due to:
Effects of labor disruption at Sudbury on nickel sales volumes and nickel by-productscredits, primarily copper and PGM.
Lower copper realized prices, mainly due to provisional price adjustments.
These effects were partially offset by:
Higher nickel realized prices, mainly due to higher LME nickel prices. Higher copper sales volumes in South Atlantic, as a result of the production volume
increase in Sossego.
Base Metals EBITDA overview – 3Q21
US$ million NorthAtlantic
PTVI(site)
OnçaPuma Sossego Salobo Others
SubtotalBase
MetalsMarketingactivities
TotalBase
MetalsNet Revenues 611 271 87 248 430 (189) 1,458 116 1,574Costs (635) (145) (55) (83) (159) 165 (912) (112) (1,024)Selling and otherexpenses 55 - (2) (3) - 1 51 - 51
Pre-operating andstoppage expenses (51) - - - (1) (1) (53) - (53)
R&D (18) (1) - (8) - (16) (43) - (43)
EBITDA (38) 125 30 154 270 (40) 501 4 505
6 VNC site results are not reported as part of Base Metals results. Previous Base Metals results were restated to reflect this change.Results from VNC site are being accounted for as “Other” in the Segment Information.

35
Average pricesUS$/ metric ton 3Q21 2Q21 3Q20Nickel - LME 19,125 17,359 14,210Copper - LME 9,372 9,700 6,519Nickel - realized prices 18,211 17,183 15,824Copper - realized prices¹ 8,187 9,653 6,268Gold (US$/oz) 1,798 1,708 2,177Silver (US$/oz) 24.15 25.05 22.53Cobalt (US$/t) 56,859 43,039 55,876
¹Considers Salobo and Sossego operations.
Nickel operations
Nickel operations, excluding marketing activities – EBITDA by operation
US$ million 3Q21 2Q21 3Q20North Atlantic operation¹ (38) 317 294PTVI 125 72 85Onça Puma 30 35 1Others² (22) 5 32Total 95 429 412¹ Includes the operations in Canada and in the United Kingdom.² Includes the PTVI, intercompany sales eliminations, purchase of finished nickel. Hedge results have been relocated to each nickel businessoperation.
North Atlantic operations’ EBITDA was lower in 3Q21 as a result of the labor disruption inSudbury, which caused (i) stoppage expenses, (ii) lower by-products credits and (iii) lowernickel sales volumes. Higher nickel realized prices partially offset those effects.
PTVI’s EBITDA was higher in 3Q21 due to (i) higher sales volumes and realized prices and (ii)higher dilution of fixed costs and lower maintenance costs.
Onça Puma’s EBITDA was lower in 3Q21 mainly due to higher costs as a result of the extendedmaintenance during the quarter, as previously scheduled. Higher nickel realized prices partiallyoffset this.
Nickel Revenue and Realized Price
Net operating revenue by product - Nickel operations, excluding marketingactivitiesUS$ million 3Q21 2Q21 3Q20Nickel 761 815 794Copper 9 173 129Gold as by-product 2 18 27Silver as by-product 1 8 7PGMs¹ (20) 169 155Cobalt 31 24 19Others (4) 21 4Total 780 1,228 1,135¹ In 3Q21, PGMs revenue was impacted by negative provisional price adjustments along with lower sales volumes.

36
Volume sold - Nickel operations‘000 metric tons 3Q21 2Q21 3Q20Nickel¹ 42 47 50 Upper Class I 23 26 15 Lower Class I nickel 6 8 20 Class II nickel 9 10 12 Intermediates 4 3 5 VNC eliminations² - - (2)Copper 3 18 18Gold as by-product ('000 oz) 1 11 14Silver as by-product ('000 oz) 34 333 367PGMs ('000 oz) 11 69 60Cobalt (metric ton) 538 568 333¹ Nickel sales volumes were adjusted in the financial report to reflect VNC divestment
² Volumes associated with revenues from VNC that are accounted for as Other in segment information.
Nickel realized price in 3Q21 increased 6.0% from 2Q21 mainly due to 10% higher LME nickelaverage price, which was partially offset by the negative impact of timing and pricing adjustments.
Premiums / discount by nickel productUS$/t 3Q21 2Q21 3Q20Upper Class I nickel 790 820 1,080Lower Class I nickel 200 170 70Class II nickel (770) (760) (330)Intermediates (4,410) (4,040) (2,700)
Product type by operation% of source sales North Atlantic PTVI Onça Puma Total 3Q21 Total 2Q21
Upper Class I 68.3% 0% 0% 54.0% 54%
Lower Class I 26.9% 0% 0% 14.5% 17%
Class II 4.5% 46% 100% 22.2% 21%
Intermediates 0.3% 54% 0% 9.3% 8%
Other timing and pricing adjustments had an aggregate negative impact of US$ 794/t in 3Q21,due to (i) the Quotational Period effects (based on sales distribution in the prior three months, aswell as the differences between the LME price at the moment of sale and the LME average price),with an impact of negative US$ 200/t , (ii) fixed-price sales, with an impact of negative US$ 134/t(iii) the effect of the hedging on Vale’s nickel price realization, with a negative impact of US$ 457/t7
in the quarter and (iv) other effects, of negative US$ 3/t.
7 In October 2020, Vale decided to execute new hedge operations, continuing the Nickel Revenue Hedging Program to provide stablecash generation during a period of significant investments. As of September 30th, 2021, the average strike price for the collar positionwas US$ 15,000/t for the put options and US$ 17,505/t for the call options.
Nickel realized priceUS$/t 3Q21 2Q21 3Q20LME average nickel price 19,125 17,359 14,210Average nickel realized price 18,211 17,183 15,824Contribution to the NRP by category: Nickel average aggregate premium (120) 0 0 Other timing and pricing adjustments contribution (794) (176) 1,614

37
Nickel Costs and Expenses
Nickel COGS, excluding marketing activities - 2Q21 x 3Q21Variance drivers
US$ million 2Q21 Volume Exchangerate Others Total variation 3Q21
Nickel operations 696 (67) (11) 52 (26) 670
Depreciation 230 (3) (4) (96) (103) 127
Total 926 (70) (15) (44) (129) 797
Nickel operations – unit cash cost of sales, net of by-product creditsUS$/t 3Q21 2Q21 3Q20
North Atlantic operations¹ 19,871 5,840 8,040
PTVI 7,813 8,492 6,291
Onça Puma 10,928 8,248 12,078
¹ North Atlantic figures include Clydach refining costs.
Unit cash cost in North Atlantic operations were significantly impacted by the labor disruption atSudbury, as the lower volumes impacted fixed costs dilution.
Selling expenses and other expenses totaled a revenue of US$ 57 million in 3Q21, mainly due tothe reversal of provisions (US$ 59 million).
Pre-operating and stoppage expenses totaled US$ 52 million, mainly due to the labor disruptionat our Sudbury operations (US$ 51 million).
R&D expenses were US$ 20 million in 3Q21, slightly higher than 2Q21. These expensesencompass R&D initiatives for further operational improvements in North Atlantic.
EBITDA break-even – nickel operations8
8 Considering only the cash effect of US$ 400/oz that Wheaton Precious Metals pays for 70% of Sudbury’s gold by-product,nickel operations EBITDA break-even would increase to US$ 16,102/t.

38
Selected financial indicators - Nickel operations, excluding marketing activitiesUS$ million 3Q21 2Q21 3Q20Net Revenues 780 1,228 1,135Costs¹ (670) (696) (693)Expenses¹ 57 (25) (26)Pre-operating and stoppage expenses¹ (52) (60) -R&D expenses (20) (18) (4)Adjusted EBITDA 95 429 412Depreciation and amortization (145) (230) (233)Adjusted EBIT (50) 199 179Adjusted EBIT margin (%) (6.4) 16.2 15.8¹ Net of depreciation and amortization
Copper operations – Salobo and Sossego
Copper – EBITDA by operationUS$ million 3Q21 2Q21 3Q20Salobo 270 351 287Sossego 154 100 104Others Copper¹ (18) (15) (10)
Total 406 436 380
¹ Includes research expenses related to the Hu’u project.
Salobo’s EBITDA decreased in 3Q21 compared to 2Q21 mainly due to lower copper realizedprice and higher unit cost due to a corrective maintenance at the site.
Sossego’s EBITDA in 3Q21 increased compared to 2Q21 mainly due to higher sales volumesand higher fixed cost dilution as maintenance activities at SAG9 and ball mills were finished in2Q21.
Copper revenue and realized price
Net operating revenue by product - Copper operationsUS$ million 3Q21 2Q21 3Q20Copper 510 538 390Gold as by-product 164 145 192Silver as by-product 4 5 5Total 678 688 587
Volume sold - Copper operations‘000 metric tons 3Q21 2Q21 3Q20Copper 62 56 62Gold as by-product ('000 oz) 91 84 86Silver as by-product ('000 oz) 176 188 193
9 SAG mill – Semi-autogenous grinding mill

39
Price realization – copper operations
Vale’s copper products are sold on a provisional pricing basis10 during the quarter, with final pricesdetermined in a future period, generally one to four months forward.
Current period price adjustments: at the end of the quarter, mark-to-market of openinvoices based on the copper price forward curve11
Prior period price adjustment: based on the difference between the price used in finalinvoices (and in the mark-to-market of invoices from previous quarters still open atthe end of the quarter) and the provisional prices used for sales in prior quarters
TC/RCs, penalties, premiums and discounts for intermediate products
The negative effects of the current period price adjustments of US$ 389/t, and prior period priceadjustments of US$ 358/t were mainly due to the forward price steadily declining during the thirdquarter.
Copper Costs and Expenses
Salobo unit cash costs after by-products have increased mainly due to the impact of correctivemaintenance and lower fixed costs dilution, still in the positive territory. Sossego unit cash costhas decreased due to higher fixed cost dilution following the maintenance at both SAG and ballmills in 2Q21 and reached a unit cash cost level below US$2,000/t in 3Q21.
Copper COGS - 2Q21 x 3Q21Variance drivers
US$ million 2Q21 Volume Exchangerate Others Total variation 3Q21
Copper operations 229 33 2 (22) 13 242
Depreciation 41 27 - (31) (4) 37
Total 270 60 2 (53) 9 279
10 On September 30th, 2021, Vale had provisionally priced copper sales from Sossego and Salobo totaling 88,665 tons valued at anLME forward price of US$ 9,061/t, subject to final pricing over the following months.11 Includes a small number of final invoices that were provisionally priced and settled within the quarter.

40
Copper operations – unit cash cost of sales, net of by-product creditsUS$/t 3Q21 2Q21 3Q20
Salobo 700 422 (806)
Sossego 1,911 3,623 1,269
Selling and other expenses were US$ 6 million. Pre-operational and stoppage expenses totaledUS$ 1 million in 3Q21. Research and development expenses were US$ 23 million in 3Q21, withHu’u-related expenditures amounting to US$ 15 million and Sossego-related expensesamounting to US$ 8 million.
EBITDA break-even – copper operations12
The realized price to be compared to the EBITDA break-even should be the copper realized pricebefore discounts (US$ 8,625/t), given that TC/RCs, penalties and other discounts are already partof the EBITDA break-even build-up.
Selected financial indicators - Copper operations, excluding marketing activitiesUS$ million 3Q21 2Q21 3Q20Net Revenues 679 688 587Costs¹ (242) (229) (190)Expenses¹ (6) (1) (2)Pre-operating and stoppage expenses¹ (1) (1) -R&D expenses (23) (21) (15)Adjusted EBITDA 406 436 380Depreciation and amortization (37) (41) (29)Adjusted EBIT 369 395 351Adjusted EBIT margin (%) 54.3 57.4 59.8
¹ Net of depreciation and amortization
12 Considering only the cash effect of US$ 400/oz that Wheaton Precious Metals pays for 75% of Salobo’s gold by-product,copper operations EBITDA break-even would increase to US$ 2,896/t.

41
CoalAdjusted EBITDA for the Coal business segment improved significantly and reached break-even,totaling US$ 32 million in 3Q21, US$ 196 higher than in 2Q21. September EBITDA reached US$43 million after improving but still negative EBITDA of US$ 9 million in July and negative US$ 2million in August.
The better result was mainly driven by higher net revenues (US$ 191 million).
Revenue and price realizationThe higher net revenues on 3Q21 were due to higher prices (US$ 74 million) and higher salesvolumes (US$ 117 million), with the continuing ramp-up of Moatize, expected to be concluded in4Q21.
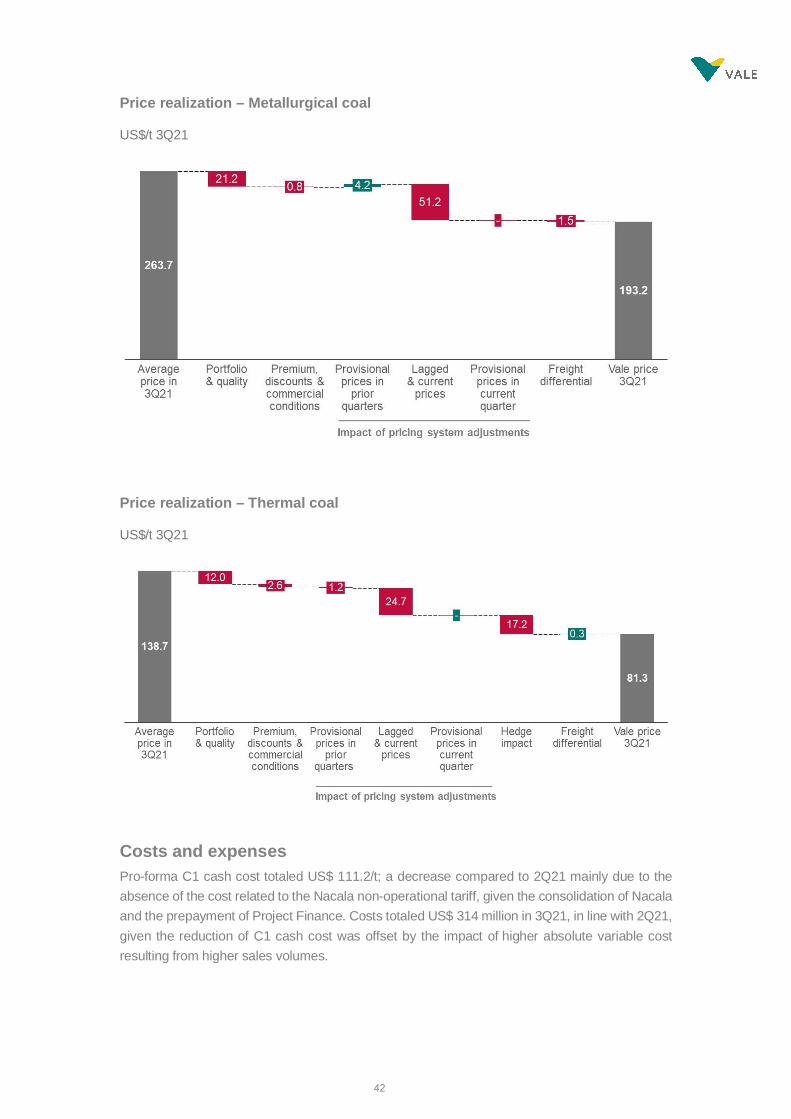
The average realized price for coking coals was US$ 193.2/t. The higher market prices (91.8%vs. 2Q21) were partially offset mainly by the effect of lagged prices which represented 71% ofsales this quarter. We expect higher realized prices in 4Q21, following lagged sales at higherprices, closer to the current market levels.
The average realized price for thermal coals was US$ 81.3/t. The higher market prices (32% vs.2Q21) were partially offset by the effect of lagged prices mainly in spot deals which represented50% of sales this quarter and by the hedge program impact fixed with an average strike price ofUS$ 105/t-US$108/t.
Volume sold‘000 metric tons 3Q21 2Q21 3Q20Metallurgical coal 1,150 713 809Thermal coal 1,490 831 572Total 2,640 1,544 1,381
Net operating revenue by productUS$ million 3Q21 2Q21 3Q20Metallurgical coal 222 99 76Thermal coal 122 60 27Total¹ 352 161 103
¹ It includes US$ 8 million of general cargo in 3Q21 and US$ 2 million in 2Q21
Coal pricesUS$/ metric ton 3Q21 2Q21 3Q20Metallurgical coal index price¹ 263.7 137.5 114.8Vale’s metallurgical coal realized price 193.2 139.7 93.8Thermal coal index price² 138.7 104.7 55.4Vale’s thermal coal realized price 81.3 72.4 47.0Vale’s average realized price 130.1 103.5 74.4¹ Reference price Premium Low Vol Hard Coking Coal FOB Australia.² McCloskey FOB Richards Bay
42
Price realization – Metallurgical coal
US$/t 3Q21
Price realization – Thermal coal
US$/t 3Q21
Costs and expensesPro-forma C1 cash cost totaled US$ 111.2/t; a decrease compared to 2Q21 mainly due to theabsence of the cost related to the Nacala non-operational tariff, given the consolidation of Nacalaand the prepayment of Project Finance. Costs totaled US$ 314 million in 3Q21, in line with 2Q21,given the reduction of C1 cash cost was offset by the impact of higher absolute variable costresulting from higher sales volumes.

43
Pro-forma cash costUS$/ metric ton 3Q21 2Q21 3Q20Pro-forma operational costs¹ (A) 122.7 103.2 103.9Nacala non-operational tariff ² (B) n.a. 34.8 31.4Other costs (C) ³ (11.5) 8.7 (43.5)Cost at Nacala Port (D = A+B+C) 111.2 146.7 91.8NLC’s debt service to Vale (E) n.a. - 14.5Pro-forma C1 cash cost (F = D-E) 111.2 146.7 77.3Idle capacity - 62.8 140.9Total 111.2 209.5 218.2¹ Includes the inferred NLC tariff components related to fixed and variable costs and excludes royalties.² Up until 2Q21, it included the inferred NLC tariff components related to sustaining capex, working capital, taxes and other financial items.
³ Average costs of inventories are monthly tested vs. the expected sales prices leading to positive or negative variations, depending on previousprovisions recorded.
Selected financial indicators - CoalUS$ million 3Q21 2Q21 3Q20Net Revenues 352 161 103Costs¹ ² (314) (323) (321)Expenses¹ (5) - (5)R&D expenses (1) (2) (10)Dividends and interests on associates and JVs - - 20Adjusted EBITDA 32 (164) (213)Depreciation and amortization (51) (17) -Adjusted EBIT (19) (181) (213)Adjusted EBIT margin (%) (5) (112) (207)¹ Net of depreciation and amortization² Including idle capacity

44
ANNEXES
SIMPLIFIED FINANCIAL STATEMENTS
Income StatementUS$ million 3Q21 2Q21 3Q20Net operating revenue 12,682 16,675 10,762Cost of goods sold and services rendered (5,836) (5,805) (4,816)
Gross profit 6,846 10,870 5,946Gross margin (%) 54.0 65.2 55.2Selling and administrative expenses (115) (133) (127)Research and evaluation expenses (136) (141) (105)Pre-operating and operational stoppage (165) (191) (188)Brumadinho event (161) (185) (114)Other operational expenses, net (36) (74) (113)Impairment and disposal of non-current assets (2,390) (432) (298)Operating income 3,843 9,714 5,001Financial income 91 86 69Financial expenses (136) (177) (1,215)Other financial items, net (328) 441 (214)
Equity results and other results in associates and joint ventures 128 (454) (40)
Income (loss) before income taxes 3,598 9,610 3,601Current tax (2,464) (1,201) (743)Deferred tax 2,824 (872) (51)Net income 3,958 7,537 2,807Loss attributable to noncontrolling interests 72 (49) (101)
Net income attributable to Vale's stockholders 3,886 7,586 2,908
Earnings per share (attributable to the Company's stockholders -US$):
Basic and diluted earnings per share (attributable to the Company'sstockholders - US$) 0.76 1.49 0.57
Equity income (loss) by business segmentUS$ million 3Q21 % 2Q21 % 3Q20 %Ferrous Minerals 58 29 55 52 19 (317)Base Metals - - - - (1) 17Coal - - - - - -Others 140 71 50 48 (24) 400
Total 198 100 105 100 (6) 100

45
Balance sheetUS$ million 9/30/2021 6/30/2021 9/30/2020AssetsCurrent assets 19,991 25,403 17,544Cash and cash equivalents 10,857 13,649 8,845Short term investments 521 951 125Accounts receivable 873 4,954 3,014Other financial assets 1,366 214 454Inventories 5,085 4,701 4,329Recoverable taxes 824 668 474Others 405 266 303Non-current assets held for sale 60 - -Non-current assets 14,790 14,235 15,799Judicial deposits 1,221 1,326 2,040Other financial assets 162 1,430 2,472Recoverable taxes 1,322 1,440 1,071Deferred income taxes 11,402 9,338 9,610Others 683 701 606Fixed assets 52,099 57,078 46,638Total assets 86,880 96,716 79,981LiabilitiesCurrent liabilities 16,074 14,335 10,684Suppliers and contractors 4,096 3,777 3,099Loans, borrowings and leases 1,345 992 1,024Other financial liabilities 1,557 1,547 1,782Taxes payable 2,594 1,678 807Settlement program (REFIS) 330 356 313Provisions 1,176 1,156 1,016Liabilities related to associates and joint ventures 1,551 1,467 688Liabilities related to Brumadinho 2,336 2,223 936De-characterization of dams 435 454 320Dividends and interest on capital 35 27 -Others 606 658 699Liabilities associated with non-current assets held for sale 13 - -Non-current liabilities 36,717 40,022 36,088Loans, borrowings and leases 12,240 12,870 14,041Participative stockholders' debentures 4,128 4,687 2,533Other financial liabilities 2,825 3,027 2,756Settlement program (REFIS) 2,080 2,336 2,287Deferred income taxes 1,928 1,985 1,635Provisions 7,274 8,003 7,781Liabilities related to associates and joint ventures 714 1,024 797Liabilities related to Brumadinho 2,020 2,268 614De-characterization of dams 1,422 1,701 1,254Streaming transactions 1,936 1,961 2,017Others 150 160 373Total liabilities 52,791 54,357 46,772Stockholders' equity 34,089 42,359 33,209Total liabilities and stockholders' equity 86,880 96,716 79,981

46
Cash flowUS$ million 3Q21 2Q21 3Q20Cash flow from operations 10,194 9,277 5,567Interest on loans and borrowings paid (173) (138) (203)Cash received (paid) on settlement of Derivatives, net 22 60 (130)Interest on participative stockholders debentures paid - (193) -Income taxes (including settlement program) (992) (1,280) (450)Net cash provided by operating activities 9,051 7,726 4,784Cash flows from investing activities:Short-term investment 424 543 -Capital expenditures (1,248) (1,139) (872)Investment in fund applications - - (31)Acquisition of NLC, net of cash - (2,345) -Dividends received from joint ventures and associates 5 43 2Other investment activities, net 18 (189) (106)Net cash used in investing activities (801) (3,087) (1,007)Cash flows from financing activities:Loans and financing:Loans and borrowings from third-parties - 10 1,800Payments of loans and borrowings from third-parties (111) (179) (5,265)Lease payments (58) (49) (45)Payments to stockholders:Dividends and interest on capital paid to stockholders (7,391) (2,208) (3,327)Dividends and interest on capital paid to noncontrolling interest (3) (3) (3)Share buyback program (2,841) (2,004) -Net cash used in financing activities (10,404) (4,433) (6,840)Increase (decrease) in cash and cash equivalents (2,154) 206 (3,063)Cash and cash equivalents in the beginning of the period 13,649 12,883 12,113Effect of exchange rate changes on cash and cash equivalents (638) 560 (205)Cash and cash equivalents at the end of period 10,857 13,649 8,845Non-cash transactions: - -Additions to property, plant and equipment - capitalized loans and borrowingcosts 14 14 13
Cash flows from operating activities: - -Income before income taxes 3,598 9,610 3,601Adjusted for: - -Provisions related to Brumadinho - - -Equity results and other results in associates and joint ventures (128) 454 40Impairment and disposal of non-current assets 2,390 432 298Depreciation, depletion and amortization 700 849 774Financial results, net 373 (350) 1,360Change in assets and liabilities - - -Accounts receivable 3,889 (1,105) (276)Inventories (574) (188) (298)Suppliers and contractors 338 291 214Provision - Payroll, related charges and other remunerations 60 82 177Payments related to Brumadinho (186) (303) (218)Other assets and liabilities, net (266) (495) (105)Cash flow from operations 10,194 9,277 5,567

47
REVENUES, VOLUMES SOLD, PRICES AND MARGINS
Net operating revenue by destinationUS$ million 3Q21 % 2Q21 % 3Q20 %North America 387 3.1 578 3.5 283 2.6 USA 345 2.7 449 2.7 278 2.6 Canada 42 0.3 129 0.8 5 0.0South America 1,846 14.6 1,780 10.7 862 8.0 Brazil 1,580 12.5 1,531 9.2 717 6.7 Others 266 2.1 249 1.5 145 1.3Asia 8,506 67.1 11,426 68.5 7,800 72.5 China 5,673 44.7 8,976 53.8 6,416 59.6 Japan 1,451 11.4 1,082 6.5 558 5.2 South Korea 555 4.4 439 2.6 296 2.8 Others 827 6.5 929 5.6 530 4.9Europe 1,348 10.6 2,191 13.1 1,400 13.0 Germany 350 2.8 617 3.7 441 4.1 Italy 159 1.3 231 1.4 58 0.5 Others 839 6.6 1,343 8.1 901 8.4Middle East 136 1.1 456 2.7 249 2.3Rest of the World 459 3.6 244 1.5 168 1.6Total 12,682 100.0 16,675 100.0 10,762 100.0
Volume sold - Minerals and metals‘000 metric tons 3Q21 2Q21 3Q20Iron ore fines 67,304 66,740 65,607ROM 540 479 162Pellets 8,037 7,647 8,464Manganese ore 111 169 428Ferroalloys 16 15 15Thermal coal 1,490 831 572Metallurgical coal 1,150 713 809Nickel 42 47 50Copper 65 74 81Gold as by-product ('000 oz) 92 95 100Silver as by-product ('000 oz) 210 522 560PGMs ('000 oz) 11 69 60Cobalt (metric ton) 538 568 333

48
Average realized pricesUS$/ton 3Q21 2Q21 3Q20Iron ore fines Vale CFR reference (dmt) 142.5 202.0 123.1Iron ore fines Vale CFR/FOB realized price 126.7 182.8 112.1Pellets CFR/FOB (wmt) 249.9 254.7 141.2Manganese ore 163.9 171.8 85.3Ferroalloys 1,792.3 1,508.1 968.2Thermal coal 98.6 72.4 47.0Metallurgical coal 193.2 139.7 93.8Nickel 18,211 17,183 15,824Copper¹ 7,933 9,590 6,441Gold (US$/oz) 1,798 1,708 2,177Silver (US$/oz) 24.15 25.05 22.53Cobalt (US$/t) 56,859 43,039 55,876
¹Considers Salobo, Sossego and North Atlantic operations.
Operating margin by segment (EBIT adjusted margin)% 3Q21 2Q21 3Q20Ferrous Minerals 59.2 71.5 62.8Base Metals 20.5 26.4 31.3Coal (5.4) (112.4) (206.8)Total 49.2 61.1 49.4
RECONCILIATION OF IFRS AND “NON-GAAP” INFORMATION
(a) Adjusted EBITUS$ million 3Q21 2Q21 3Q20Net operating revenues 12,682 16,675 10,762COGS (5,836) (5,805) (4,816)Sales and administrative expenses (115) (133) (127)Research and development expenses (136) (141) (105)Pre-operating and stoppage expenses (165) (191) (188)Brumadinho event (161) (185) (114)Other operational expenses, net (36) (74) (113)Dividends received and interests from associates and JVs 5 43 22
Adjusted EBIT 6,238 10,189 5,321
(b) Adjusted EBITDA
EBITDA defines profit or loss before interest, tax, depreciation, depletion and amortization. The definition of AdjustedEBITDA for the Company is the operating income or loss plus dividends received and interest from associates and jointventures, and excluding the amounts charged as (i) depreciation, depletion and amortization and (ii) impairment anddisposal of non-current assets. However, our adjusted EBITDA is not the measure defined as EBITDA under IFRS andmay possibly not be comparable with indicators with the same name reported by other companies. Adjusted EBITDAshould not be considered as a substitute for operational profit or as a better measure of liquidity than operational cashflow, which are calculated in accordance with IFRS. Vale provides its adjusted EBITDA to give additional informationabout its capacity to pay debt, carry out investments and cover working capital needs. The following tables shows thereconciliation between adjusted EBITDA and operational cash flow and adjusted EBITDA and net income, in accordancewith its statement of changes in financial position.The definition of Adjusted EBIT is Adjusted EBITDA plus depreciation, depletion and amortization.

49
Reconciliation between adjusted EBITDA and operational cash flowUS$ million 3Q21 2Q21 3Q20Adjusted EBITDA 6,938 11,038 6,095Working capital: Accounts receivable 3,889 (1,105) (276) Inventories (574) (188) (298) Suppliers and contractors 338 291 214 Provision - Payroll, related charges and other remunerations 60 82 177Payments related to Brumadinho (186) (303) (218)Others (271) (538) (127)Cash provided from operations 10,194 9,277 5,567Income taxes paid - including settlement program (992) (1,280) (450)Interest on loans and borrowings paid (173) (138) (203)Interest on participative shareholders' debentures paid - (193) -Cash received (paid) on settlement of Derivatives, net 22 60 (130)Net cash provided by (used in) operating activities 9,051 7,726 4,784
Reconciliation between adjusted EBITDA and net income (loss)US$ million 3Q21 2Q21 3Q20Adjusted EBITDA 6,938 11,038 6,095Depreciation, depletion and amortization (700) (849) (774)Dividends received and interest from associates and jointventures (5) (43) (22)
Impairment and disposal of non-current assets (2,390) (432) (298)Operating income 3,843 9,714 5,001Financial results (373) 350 (1,360)Equity results and other results in associates and joint ventures 128 (454) (40)Income taxes 360 (2,073) (794)Net income 3,958 7,537 2,807Net income (loss) attributable to noncontrolling interests 72 (49) (101)Net income attributable to Vale's stockholders 3,886 7,586 2,908
(c) Net debtUS$ million 3Q21 2Q21 3Q20Gross debt 11,951 12,154 13,444Leases 1,634 1,708 1,621Cash and cash equivalents¹ 11,378 14,600 8,970Net debt 2,207 (738) 6,095¹ Including financial investments
(d) Gross debt / LTM Adjusted EBITDAUS$ million 3Q21 2Q21 3Q20Gross debt and leases / LTM Adjusted EBITDA (x) 0.4 0.5 0.9Gross debt and leases / LTM operational cash flow (x) 0.4 0.5 1.3
(e) LTM Adjusted EBITDA / LTM interest paymentsUS$ million 3Q21 2Q21 3Q20Adjusted LTM EBITDA / LTM gross interest (x) 41.1 37.4 19.4LTM adjusted EBITDA / LTM interest payments (x) 41.4 38.7 18.7LTM operational profit / LTM interest payments (x) 31.0 31.3 8.2