uv/optical properties of grbs with swift uvot p. roming (penn state university)
Post on 21-Dec-2015
215 views
TRANSCRIPT

UV/Optical Properties of GRBs
with Swift UVOT
P. Roming (Penn State University)
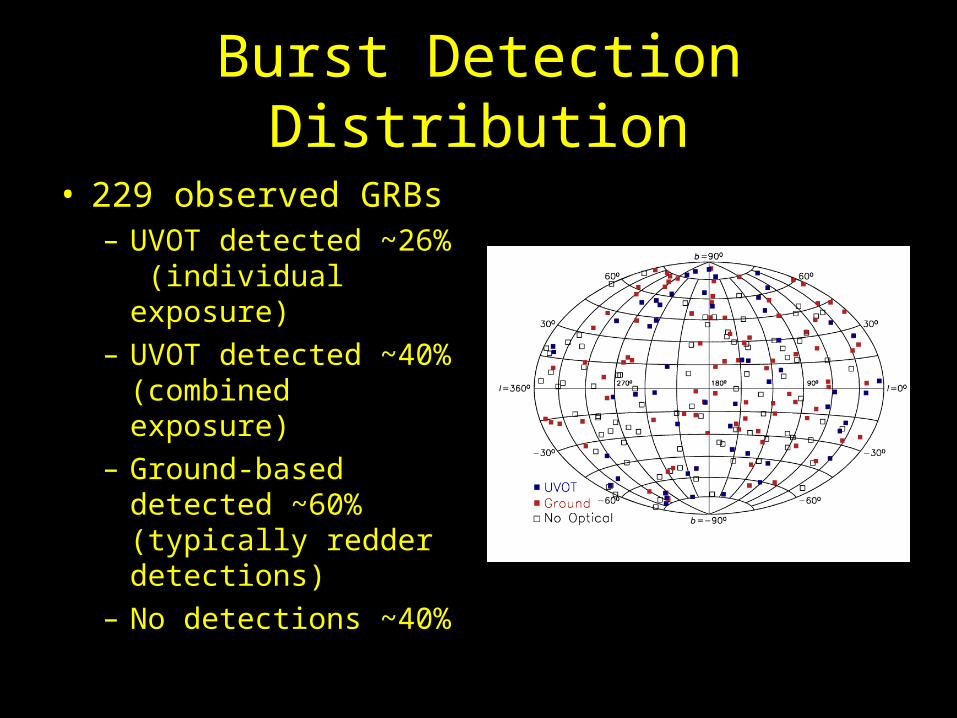
Burst Detection Distribution
• 229 observed GRBs– UVOT detected ~26%
(individual exposure)– UVOT detected ~40%
(combined exposure)– Ground-based
detected ~60% (typically redder detections)
– No detections ~40%

Why Are So Many “Dark”?
• Late observations
• Rapid temporal decay
• Circumburst extinction
• High redshift Ly-α blanketing & absorption
• Suppression of the reverse shock
• Wrong part of the sky

Time-to-burst Distribution
110 s
86 s

Color Observation Distribution
Observations < 2000 s Observations > 2000 s

Peak Magnitude Brightness
18.02


Multicolor Light Curves of GRBs
α=1.79 α=1.59
α=1.51 α=1.70
α=1.96 α=1.94
α=1.58

Early “Flaring” in UV/Optical
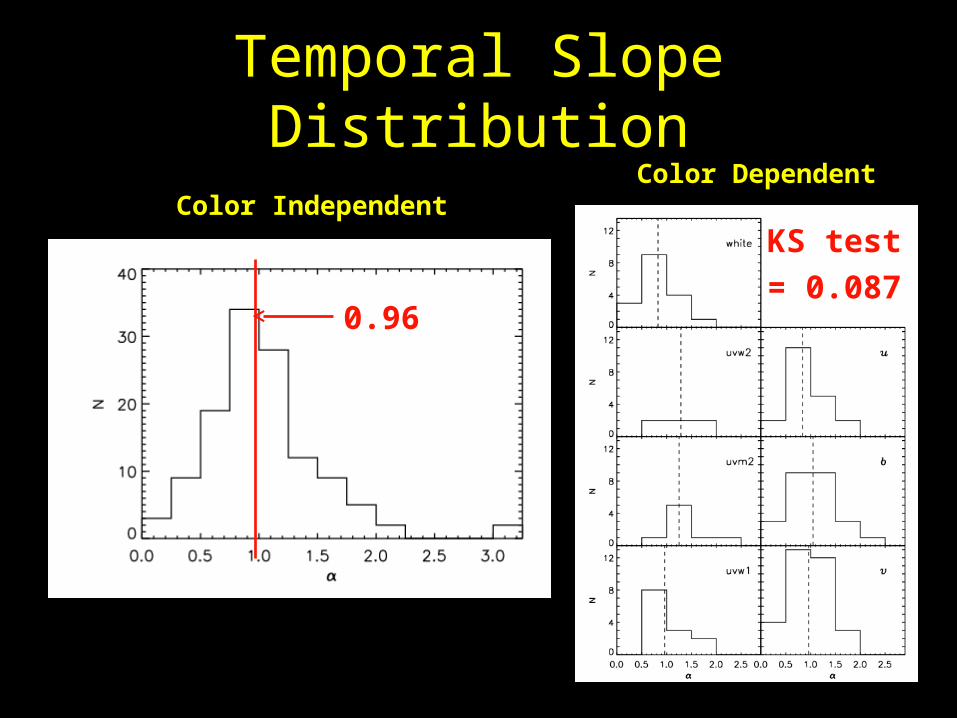
Temporal Slope Distribution
Color IndependentColor Dependent
0.96
KS test
= 0.087

Burst Color Evolution

Optical-to-X Comparison
Spearman rank correlation (p = 8.8x10⁻⁴)
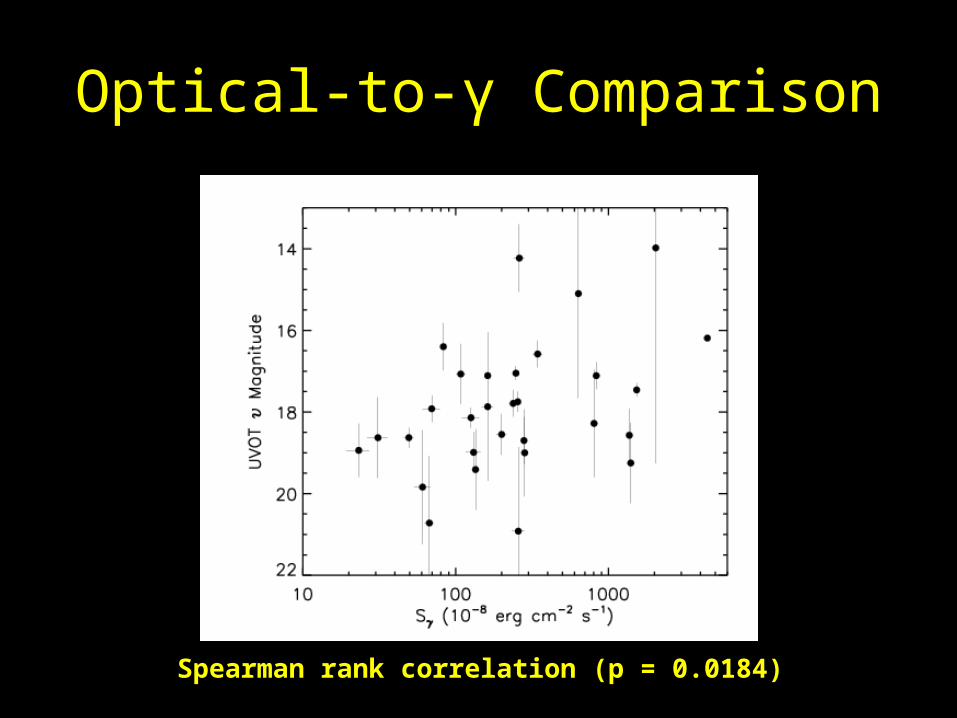
Optical-to-γ Comparison
Spearman rank correlation (p = 0.0184)

Redshift Distribution

UVOT Detected BAT Bursts

Observations of GRB 060313

Event Mode Light Curves
Conclusions
• UV/optical single instrument samples becoming large enough to perform statistical analysis
• UV/optical regime trailing the X-ray but coming of age
• More data needed in the sample (i.e. multi-color information, SHBs light curves)