utilization of remote traffic monitoring devices for urban
TRANSCRIPT

Utilization of Remote Traffic Monitoring Devices for Urban Freeway Work Zone Assessment
Final ReportJanuary 2012
Sponsored bySmart Work Zone Deployment InitiativeIowa Department of TransportationMidwest Transportation Consortium(InTrans Project 06-277)

About SWZDIIowa, Kansas, Missouri, and Nebraska created the Midwest States Smart Work Zone Deployment Initiative in 1999 and Wisconsin joined in 2001. Through this pooled-fund study, researchers in-vestigate better ways of controlling traffic through work zones. Their goal is to improve the safety and efficiency of traffic operations and highway work.
About the MTCThe Midwest Transportation Consortium (MTC) is a Tier 1 University Transportation Center (UTC) that includes Iowa State University, the University of Iowa, and the University of Northern Iowa. The mission of the UTC program is to advance U.S. technology and expertise in the many disciplines comprising transportation through the mechanisms of education, research, and technology transfer at university-based centers of excellence. Iowa State University, through its Institute for Transportation (InTrans), is the MTC’s lead institution.
Disclaimer NoticeThe contents of this report reflect the views of the authors, who are responsible for the facts and the accuracy of the information presented herein. The opinions, findings and conclusions expressed in this publication are those of the authors and not necessarily those of the sponsors.
The sponsors assume no liability for the contents or use of the information contained in this document. This report does not constitute a standard, specification, or regulation.
The sponsors do not endorse products or manufacturers. Trademarks or manufacturers’ names appear in this report only because they are considered essential to the objective of the document.
Non-Discrimination Statement Iowa State University does not discriminate on the basis of race, color, age, religion, national origin, sexual orientation, gender identity, genetic information, sex, marital status, disability, or status as a U.S. veteran. Inquiries can be directed to the Director of Equal Opportunity and Compliance, 3280 Beardshear Hall, (515) 294-7612.
Iowa Department of Transportation Statements Federal and state laws prohibit employment and/or public accommodation discrimination on the basis of age, color, creed, disability, gender identity, national origin, pregnancy, race, religion, sex, sexual orientation or veteran’s status. If you believe you have been discriminated against, please contact the Iowa Civil Rights Commission at 800-457-4416 or Iowa Department of Transportation’s affirmative action officer. If you need accommodations because of a disability to access the Iowa Department of Transportation’s services, contact the agency’s affirmative action officer at 800-262-0003.
The preparation of this (report, document, etc.) was financed in part through funds provided by the Iowa Department of Transportation through its “Agreement for the Management of Research Conducted by Iowa State University for the Iowa Department of Transportation,” and its amendments.
The opinions, findings, and conclusions expressed in this publication are those of the authors and not necessarily those of the Iowa Department of Transportation.

Technical Report Documentation Page
1. Report No. 2. Government Accession No. 3. Recipient’s Catalog No. InTrans Project 06-277
4. Title and Subtitle 5. Report Date Utilization of Remote Traffic Monitoring Devices for Urban Freeway Work Zone Assessment
January 2012 6. Performing Organization Code
7. Author(s) 8. Performing Organization Report No. Zachary Hans and Neal Hawkins InTrans Project 06-277 9. Performing Organization Name and Address 10. Work Unit No. (TRAIS) Center for Transportation Research and Education Iowa State University 2711 South Loop Drive, Suite 4700 Ames, IA 50010-8664
11. Contract or Grant No.
12. Sponsoring Organization Name and Address 13. Type of Report and Period Covered Smart Work Zone Deployment Initiative, Iowa Department of Transportation, 800 Lincoln Way, Ames, Iowa 50010 Midwest Transportation Consortium, Institute for Transportation, 2711 S. Loop Drive, Suite 4700, Ames, Iowa 50010-8664
Final Report 14. Sponsoring Agency Code
15. Supplementary Notes Visit www.intrans.iastate.edu for color PDF files of this and other research reports. 16. Abstract The objective of this project was to promote and facilitate analysis and evaluation of the impacts of road construction activities in Smart Work Zone Deployment Initiative (SWZDI) states. The two primary objectives of this project were to assess urban freeway work-zone impacts through use of remote monitoring devices, such as radar-based traffic sensors, traffic cameras, and traffic signal loop detectors, and evaluate the effectiveness of using these devices for such a purpose. Two high-volume suburban freeway work zones, located on Interstate 35/80 (I-35/I-80) through the Des Moines, Iowa metropolitan area, were evaluated at the request of the Iowa Department of Transportation (DOT).
17. Key Words 18. Distribution Statement freeway traffic sensors—freeway work zones—metropolitan traffic congestion—remote traffic monitoring—road construction traffic control—suburban work zones—traffic analysis—traffic congestion—traffic sensors—work zone congestion—work zone traffic analysis—work zone traffic monitoring—work zone traffic patterns—work zone traffic sensors
No restrictions.
19. Security Classification (of this report)
20. Security Classification (of this page)
21. No. of Pages 22. Price
Unclassified. Unclassified. 206 NA
Form DOT F 1700.7 (8-72) Reproduction of completed page authorized


UTILIZATION OF REMOTE TRAFFIC
MONITORING DEVICES FOR URBAN FREEWAY
WORK ZONE ASSESSMENT
Final Report
January 2012
Principal Investigator
Zachary Hans, Research Engineer
Center for Transportation Research and Education
Institute for Transportation
Iowa State University
Authors
Zachary Hans and Neal Hawkins
Research Assistant
Luke Schmidt
Sponsored by
2009 Smart Work Zone Deployment Initiative,
Iowa Department of Transportation, and
the Midwest Transportation Consortium,
a U.S. DOT Tier 1 University Transportation Center
Preparation of this report was financed in part
through funds provided by the Iowa Department of Transportation
through its research management agreement with the
Institute for Transportation
(InTrans Project 06-277)
A report from
Institute for Transportation
Iowa State University
2711 South Loop Drive, Suite 4700
Ames, IA 50010-8664
Phone: 515-294-8103
Fax: 515-294-0467
www.intrans.iastate.edu


v
TABLE OF CONTENTS
ACKNOWLEDGMENTS ............................................................................................................ ix
OVERVIEW ....................................................................................................................................1
SUBURBAN FREEWAY CAPACITY REDUCTION WITH RAMP CLOSURES .....................2
Work Zone Overview ..........................................................................................................2 Work Zone Assessment Objectives .....................................................................................3 Data Sources ........................................................................................................................3 Data Utilization ....................................................................................................................7 Conclusions and Recommendations ..................................................................................13
SUBURBAN FREEWAY RAMP CLOSURES WITH LOCAL DETOUR .................................14
Work Zone Overview ........................................................................................................14 Work Zone Assessment Objectives ...................................................................................16 Data Sources ......................................................................................................................16 Data Utilization ..................................................................................................................19 Conclusions and Recommendations ..................................................................................37
REFERENCES ..............................................................................................................................39
APPENDIX A. SENSOR LOCATIONS AND MANUAL VIDEO REDUCTION .....................41
A.1 Sensor Locations .........................................................................................................41 A.2 Traffic Camera Video Reduction ................................................................................43
APPENDIX B. TRAFFIC VOLUME CHANGES ........................................................................56
B.1 Freeway Mainline Traffic-Volume Changes ...............................................................56B.2 Intersection Traffic-Volume Changes .........................................................................82 B.3 System-Wide Traffic-Volume Changes (Tabular) ....................................................178 B.4 System-Wide Traffic-Volume Changes (Maps) .......................................................181 B.5 City of Clive Traffic-Volume Changes .....................................................................187


vii
LIST OF FIGURES
Figure 1. I-35/I-80 site map (Bing Maps n.d.) .................................................................................2 Figure 2. tripGuide camera (Iowa DOT n.d.) ..................................................................................4 Figure 3. tripGuide camera locations (Iowa DOT n.d.) ...................................................................4 Figure 4. Wavetronix SmartSensor (Iowa DOT n.d.) ......................................................................5 Figure 5. Wavetronix SmartSensor operation (Iowa DOT n.d.) ......................................................5 Figure 6. Wavetronix SmartSensor locations (Iowa DOT 2008) ....................................................6 Figure 7. MVDS33 – eastbound to Merle Hay Road.......................................................................7 Figure 8. Sensor data format ............................................................................................................8 Figure 9. Merle Hay Road sample video reduction image – outside lanes 9/9/2008 ....................11 Figure 10. Walnut Creek Bridge site map (Bing Maps n.d.) .........................................................14 Figure 11. Ramp closures and detour routes ..................................................................................15
Figure 12. MVDS 29 – I-35/80 northbound to Hickman Road .....................................................16 Figure 13. MVDS 30 – I-35/80 northbound to Douglas Avenue ..................................................17 Figure 14. Local traffic data...........................................................................................................18 Figure 15. New sensor data format ................................................................................................20 Figure 16. Sample Wavetronix-based 12 hour summary (MVDS29) ...........................................21 Figure 17. Sample Wavetronix-based 12 hour summary (MVDS30) ...........................................22 Figure 18. Sample loop detector count format...............................................................................23 Figure 19. Sample intersection counts, 128th Street ......................................................................24 Figure 20. Sample intersection approach counts by movement, 128th Street ...............................25 Figure 21. Sample intersection approach counts by movement, East University ramp ................26 Figure 22. Sample Phase 1 percent volume change from baseline ................................................30 Figure 23. Sample Phase 1 percent volume change from baseline - interchange ..........................30 Figure 24. Sample portable tube count format...............................................................................34
Figure 25. Sample 128th Street ADT change ................................................................................35 Figure 26. Sample 114th Street ADT change ................................................................................36 Figure 27. MVDS34 – eastbound West to 2nd Avenue.................................................................41 Figure 28. MVDS35 – eastbound to 2nd Avenue ..........................................................................41 Figure 29. MVDS36 – eastbound from 2nd Avenue .....................................................................42
Figure 30. MVDS37 – westbound to East 14th Street ...................................................................42 Figure 31. Merle Hay Road sample video reduction image – outside lanes 9/11/2008 ................43 Figure 32. Merle Hay Road sample video reduction sample image – inside lanes 9/16/2008 ......44 Figure 33. 2nd Avenue sample video reduction image – outside lanes 9/9/2008..........................45 Figure 34. 2nd Avenue sample video reduction image – outside lanes 9/11/2008........................46 Figure 35. 2nd Avenue sample video reduction image – outside lanes 9/11/2008 (Part1) ...........47
Figure 36. 2nd Avenue sample video reduction image – outside lanes 9/11/2008 (Part 2) ..........48
Figure 37. East 14th Street sample video reduction image - outside lanes 9/9/2008 ....................49 Figure 38. East 14th Street sample video reduction image - outside lanes - evasive action
9/9/2008 .............................................................................................................................49
Figure 39. East 14th Street sample video reduction image - outside lanes 9/11/2008 ..................50 Figure 40. East 14th Street sample video reduction image - inside lanes 9/12/2008 (Part 1) .......51 Figure 41. East 14th Street sample video reduction image - inside lanes 9/12/2008 (Part 2) .......52 Figure 42. East 14th Street sample video reduction image - inside lanes 9/12/2008 (Part 3) .......53 Figure 43. East 14th Street sample video reduction image - inside lanes 9/13/2008 ....................54
viii
Figure 44. East 14th Street sample video reduction image - all lanes (no work zone) 10/15/200855
LIST OF TABLES
Table 1. Sensor-based hourly volumes ............................................................................................9 Table 2. Traffic camera video collection .......................................................................................10 Table 3. Merle Hay Road sample video reduction summary – outside lanes 9/9/2008.................11 Table 4. Video reduction summary in peak periods ......................................................................12 Table 5. Walnut Creek Bridge reconstruction phasing ..................................................................19 Table 6. Observed changes in northbound traffic at MVDS30 .....................................................23 Table 7. Traffic volume change from baseline ..............................................................................27 Table 8. Percent traffic volume change from baseline ..................................................................28
Table 9. Traffic volume change between phases ...........................................................................29 Table 10. Traffic volume changes south approach of 128th Street/Sunset Terrace ......................37 Table 11. Merle Hay Road video reduction summary – outside lanes 9/11/2008 .........................43 Table 12. Merle Hay Road video reduction summary – inside lanes 9/16/2008 ...........................44 Table 13. 2nd Avenue video reduction summary – outside lanes 9/9/2008 ..................................45 Table 14. 2nd Avenue video reduction summary – outside lanes 9/11/2008 ................................46 Table 15. 2nd Avenue video reduction summary – outside lanes 9/11/2008 (Part 1) ...................47 Table 16. 2nd Avenue video reduction summary – outside lanes 9/11/2008 (Part 2) ...................48 Table 17. East 14th Street video reduction summary - outside lanes 9/9/2008 .............................50 Table 18. East 14th Street video reduction summary - outside lanes 9/11/2008 ...........................51 Table 19. East 14th Street video reduction summary - inside lanes 9/12/2008 (Part 1) ................51 Table 20. East 14th Street video reduction summary - inside lanes 9/12/2008 (Part 2) ................52 Table 21. East 14th Street video reduction summary - inside lanes 9/12/2008 (Part 3) ................53
Table 22. East 14th Street video reduction summary - inside lanes 9/13/2008 .............................54 Table 23. East 14th Street video reduction summary - all lanes (no work zone) 10/15/2008 .......55

ix
ACKNOWLEDGMENTS
The authors would like to thank the Iowa Department of Transportation (DOT), the Smart Work Zone Deployment Initiative (SWZDI), and the Midwest Transportation Consortium (MTC) for sponsoring this research.

1
OVERVIEW
The two primary objectives of this project were to assess urban freeway work-zone impacts through use of remote monitoring devices, such as radar-based traffic sensors, traffic cameras, and traffic signal loop detectors, and evaluate the effectiveness of using these devices for such a purpose. Two high-volume suburban freeway work zones, located on Interstate 35/80 (I-35/I-80) through the Des Moines, Iowa metropolitan area, were evaluated at the request of the Iowa Department of Transportation (DOT).
This report is organized into two primary sections:
Suburban Freeway Capacity Reduction with Ramp Closures Suburban Freeway Ramp Closures with Local Detour
The two sections and two associated appendices (A and B) focus on each work zone project independently. Each report section covers the following areas:
Nature of the construction activity and work zone Assessment objective and metrics Data sources available for work zone assessment Data utilization, including assimilation, reduction, and integration Assessment results, including general experience using the remote data sets
The appendices provide images and summary data for each location in these work zones at a more detailed level.

2
SUBURBAN FREEWAY CAPACITY REDUCTION WITH RAMP CLOSURES
Work Zone Overview
The work zones of interest were located on east and westbound Interstate 35/80 in the northern Des Moines metropolitan area. Construction activities, during fall 2008, included removal and replacement of several bridge approach sections at six locations (Figure 1) within a six-mile section of freeway:
Merle Hay Road (Iowa Highway 28) 2nd Avenue (Iowa Highway 415) Northeast 3rd Street East 4th Street (US Highway 69) Two railroad bridges
Figure 1. I-35/I-80 site map (Bing Maps n.d.)
At each site, traffic was reduced from three to two through lanes in each direction of travel. Lanes were shifted both to the inside and outside lanes (existing outside and shoulder) at various stages during construction, and a combination of portable concrete barriers and standard channeling devices were used in the work zones.
Speeds were reduced from 65 mph to 55 mph. Three entrance ramps were also closed during part of the construction: eastbound 2nd Avenue and both eastbound and westbound East 14th Street. Average annual daily traffic (AADT) on these ramps was approximately 3,900, 2,500 and 3,600, respectively.
The western most bridge (Merle Hay Road) was about 3.5 miles from the nearest bridge to the east. Three through lanes of traffic were maintained in each direction of travel between these bridges. The annual average traffic volume along this section of the freeway was approximately 87,000 AADT.
The other five bridges were located within two miles of each other. The bridges at 2nd Avenue and Northeast 3rd Street were within one-half mile of each other and one-half mile of the three eastern-most bridges.

3
The three eastern-most bridges were within 0.8 mile of each other and one-third mile from the Interstate 35/80/235 interchange.
AADT among the five eastern-most bridges ranged from approximately 69,000 to 76,000.
Construction was scheduled in two stages over 20 working days, with work occurring during peak periods. At times, during pavement curing, workers were not present in the work zone. To avoid delays, the Iowa DOT recommended that motorists find alternative routes during construction. A formal detour, which included both local and state-maintained roadways, was provided for the ramp closures.
Work Zone Assessment Objectives
The Iowa DOT currently assumes a capacity of 1,350 passenger cars per hour per lane (pc/h/ln) for freeway work zones with lanes closures, which is more conservative than the Transportation Research Board (TRB) Highway Capacity Manual 2000, which recommends 1,600 pc/h/ln for short-term freeway work zones and 1,860 vehicles per hour per lane (veh/hr/ln) for long-term construction zones (TRB 2000).
As noted previously, a combination of portable concrete barriers and standard channeling devices were used in this project, indicative of both long- and short-term work zones, respectively. The DOT identified volume (throughput) as the primary mobility performance measure of interest, particularly with respect to their assumed capacity. Performance of this work zone would serve as a frame of reference in planning future high volume, urban/suburban freeway projects.
Data Sources
As part of the Iowa DOT Des Moines area Intelligent Transportation System (ITS) deployment, also known as tripGuideTM, a system of 43 closed circuit television cameras (Figure 2 and Figure 3) and 68 Wavetronix SmartSensorsTM (Figure 4, Figure 5, and Figure 6) were installed on four routes within the area.

4
Figure 2. tripGuide camera (Iowa DOT n.d.)
Figure 3. tripGuide camera locations (Iowa DOT n.d.)

5
Figure 4. Wavetronix SmartSensor (Iowa DOT n.d.)
Figure 5. Wavetronix SmartSensor operation (Iowa DOT n.d.)

6
Figure 6. Wavetronix SmartSensor locations (Iowa DOT 2008)
The cameras transmit live video images (at a rate of 10 frames/sec) to authorized operators, who also have the ability to control the cameras remotely, including pan, tilt, and zoom. Static images, refreshed every 60 seconds, are available at a publicly-accessible web site (http://www.511ia.org/DM_Metro_tripGuide.asp) (Iowa DOT n.d.).
At the time of this project, still images were automatically archived within the Iowa DOT for a period of 24 to 48 hours, after which they were removed from the system automatically. Remote operators can archive video manually for a 15 minute interval (maximum) on a camera-by-camera basis, with no automated functionality available.
Three cameras were located within the I-35/80 work zone (Merle Hay Road, East 14th Street, and 2nd Avenue) facilitating the capture of traffic flow in the work areas.
The Wavetronix SmartSensorsTM utilize side-firing radar to measure vehicle presence, volume, occupancy, and speed in up to eight lanes of traffic. Summary volume, speed, occupancy, and class (small, medium, and large) data are presented in 15 minute bins by lane.
Class data are based on user-defined maximum, small, and medium vehicle lengths. Wireless communications protocols deliver these data to a central repository within the Iowa DOT for automated presentation of speed data on the tripGuide website. (Iowa DOT n.d.) At the time of this project, these data had to be manually archived and exported for future analysis.
Five sensors were located within the work zone areas to facilitate the capture of traffic flows. Examples of sensor positions (from MVDS33) are shown in Figure 7. All other sensor locations are presented in Appendix A.

7
MVDS33 – eastbound to Merle Hay Road (Figure 7) MVDS34 – eastbound West to 2nd Avenue (Figure 27) MVDS35 – eastbound to 2nd Avenue (Figure 28) MVDS36 – eastbound from 2nd Avenue (Figure 29) MVDS37 – westbound to East 14th Street (Figure 30)
Figure 7. MVDS33 – eastbound to Merle Hay Road
All sites, except MVDS34 (Figure 27), consisted of three through lanes and an entrance/exit ramp in each direction of travel. MVDS34 was comprised entirely of through lanes.
Use of the sensor-based traffic volume data in this project represented an early attempt to utilize data beyond the speed data presented dynamically on the tripGuide website. Sensor data were archived manually under normal (non-work-zone) conditions to assess the typical operating characteristics of the sites.
Data Utilization
Traffic Sensors
Sensor data were archived manually, for varying time periods, and exported by Iowa DOT personnel for nearly 29 days before, during, and after the work zone presence. These data were provided in text file format with a two-line header separating the data for each sensor (Figure 8). Each row following the header represented summary data for a specific date, time (in 15 minute bins), and lane combination for the sensor.

8
Figure 8. Sensor data format
Given the data format (header included sensor location and no explicit sensor reference on each row), the data could not be integrated automatically into a database for aggregation and reduction. Therefore, procedures were developed to remove the headers and associate the location information with each row.
Data were then imported into a Microsoft Access database. Once completed, queries were used to aggregate data by location for several different factors, such as time period or interval, lane, and lane combinations. Given the Iowa DOT’s interest in the throughput of the work zone, analysis focused on lane volume.
Hourly volumes were evaluated at each of the sensors for each lane independently, for through lanes (by direction of travel), and for all lanes (by direction of travel). The following hourly volumes were computed:
Maximum Average morning (two-hour) peak – from 7:00 am to 9:00 am Average afternoon (two-hour) peak – from 4:00 pm to 6:00 pm
An important consideration in aggregating the volume data to an hourly basis was the presence of data in each of the contributing bins. In other words, if null values were present for one or more of the bins, the resulting hourly volumes were inaccurate and did not represent the entire period. These volumes were disregarded.
Unfortunately, incomplete volume data were found prominently throughout the data sets. Of the nearly 700 hourly volumes aggregated for each sensor in the work zone, only five percent, or fewer, were usable.
In some cases, lane shifts within the work zone were outside of the existing lane configurations for the sensors, or transitions were located at the sensors. One would expect no volume data for

9
such locations. However, at least one lane within the existing sensor configuration was often utilized through the work zone. Incomplete or no data were provided for these lanes as well.
Given the limited usable volume data, assessment of throughput within the work zone, even on a single-lane basis, could not be accomplished successfully. Any valid volume data for the month-long data collection period were assimilated and the results are presented in Table 1.
Table 1. Sensor-based hourly volumes
While these data may not provide an accurate perspective of the operating characteristics of the sites, they were collected using standard, systematic protocol for all analysis periods.
The data presented for sensors MVDS33, MVDS36, and MVDS37 represent less than two percent of the total hourly intervals collected. Three to five percent of the possible hourly volumes are presented for the remaining two sensors.
The maximum hourly volume of the three through lanes (in either direction) ranged from approximately 2,600 to 5,300. The maximum hourly volume for any one through lane was nearly 2,200, with the maximum peak average hourly volume of 2,000.
Assuming these volumes represented normal conditions, and if no diversion of traffic occurred during construction, the maximum capacity that each of the work zone through lanes would need to accommodate would be 1,300 to 2,700 vehicles per hour (VPH) or an average maximum of 1,900 VPH, depending on the location. This estimate also assumes that the two through lanes within the work zones must accommodate the existing demand for the three through lanes.
This maximum average is near the HCM 2000 observed average of 1,860 veh/h/ln for a three- to two-lane reduction in long-term construction zones. However, it is approximately 500 veh/h/ln greater than the Iowa DOT’s assumed capacity.
All
TypeMax
VPH
Max
VPH
AM Peak
(Ave VPH)
PM Peak
(Ave VPH)
Max
VPH
AM Peak
(Ave VPH)
PM Peak
(Ave VPH)
Max
VPH
AM Peak
(Ave VPH)
PM Peak
(Ave VPH)
Max
VPHMax VPH
EB Exit 881 630 471 580 1,331 994 1,274 1,553 873 1,490 3,494 4,301
WB Ent 805 1,506 1,286 1,253 1,547 1,163 922 2,083 1,297 1,969 3,858 5,390
EB - - 2,160 1,027 1,303 1,856 1,144 1,493 1,765 734 983 4,819 4,819
WB - - 1,388 443 562 1,875 988 1,157 2,137 1,401 1,541 5,322 5,322
EB Exit 1,713 1,723 753 851 1,911 997 1,282 1,470 826 1,047 4,767 6,478
WB Ent 759 1,457 1,028 1,192 1,130 624 644 1,178 296 364 2,702 3,232
EB Ent 883 1,316 343 860 1,351 277 818 755 186 453 3,422 4,239
WB Exit 795 1,403 497 1,013 1,025 357 649 160 26 105 2,560 3,355
EB Ent 347 1,000 303 575 1,646 384 987 1,331 278 745 3,977 4,324
WB Exit 125 750 221 487 1,277 412 862 981 321 628 3,008 3,115
MVDS36
MVDS37
Sensor
MVDS33
MVDS34
MVDS35
Dir
RampThrough Lanes
All LanesOutside Middle Inside

10
Traffic Cameras
The poor quality of the traffic volume sensor data led the research team to consider and use the fixed video cameras along the corridor to collect volume data. Video, in Audio Video Interleave (AVI) format, was captured from the three traffic cameras within the work zone for different directions of travel, times of day, and work zone configurations.
As mentioned previously, video capture was initiated manually and terminated on a camera-by-camera basis. The nature of this process, and the later video reduction, limited the extent of observations. The locations and situations during which traffic data were captured are shown in Table 2.
Table 2. Traffic camera video collection
Video data were then reviewed and the observed traffic volumes were recorded manually for one-minute intervals for each through lane. Based on these vehicle counts, an equivalent vehicle per hour estimate was calculated for each interval as well as for the entire period.
Other pertinent observations, such as braking, evasive maneuvers, and heavy traffic conditions, were also recorded during data reduction. A sample image from the video reduction is shown in Figure 9 and the resulting summary data are in Table 3. Sample images and summary data for the entire video reduction are provided in Appendix A.
EB WB Position
1 Merle Hay Road WB 12 9/9/2008 15:03 Clear Present 2 2 Outside
2 Merle Hay Road EB 12 9/11/2008 12:00 Clear Present 2 2 Outside
3 Merle Hay Road EB 12 9/16/2008 16:45 Clear Present 2 2 Inside
4 Second Ave WB 15 9/9/2008 15:03 Clear Present 2 2 Outside
5 Second Ave WB 5 9/11/2008 16:12 Clear Present 2 2 Outside
6 Second Ave WB 3 9/11/2008 16:22 Clear Present 2 2 Outside
7 Second Ave WB 5 9/11/2008 16:42 Clear Present 2 2 Outside
8 East 14th St EB 15 9/9/2008 16:16 Clear Present 2 - Outside
9 East 14th St EB 5 9/11/2008 15:59 Clear Present 2 - Outside
10 East 14th St WB 2 9/12/2008 14:05 Rain None Apparent 2 - Inside
11 East 14th St WB 2 9/12/2008 8:12 Clear Unclear 2 - Inside
12 East 14th St EB 2 9/12/2008 8:05 Clear Unclear 2 - Inside
13 East 14th St EB 2 9/13/2008 22:17 Dark Possible 2 - Inside
14 East 14th St EB 5 10/15/2008 15:23 Clear None 4 - All
Observation
ID
Camera
DirectionLocation
Work Zone
Activity
Through Lanes Observed/Open
Weather
Conditions
Time of
DayDate
Duration
(Min)

11
Figure 9. Merle Hay Road sample video reduction image – outside lanes 9/9/2008
Table 3. Merle Hay Road sample video reduction summary – outside lanes 9/9/2008
In this example, a maximum flow of 35 veh/min/ln was observed, equating to 2,100 veh/hr. The average lane volume for this lane during the 15 minute period was 25 veh/min (or 1,515 veh/hr). No braking was observed. However, when considering all observations, braking was reported under several circumstances, including high flow conditions (37 veh/min/ln), following an evasive maneuver, and during active work (saw cutting) adjacent to the through lanes.

12
In one situation, evasive maneuver-induced braking appeared to reduce the flow in one lane from 31 veh/min to 22 veh/min. Heavy traffic was (anecdotally) reported for lane volumes of 32, 34, and 38 veh/min or 1,920, 2,040 and 2,280 veh/hr, respectively. Table 4 presents summary volumes in, and near, peak traffic periods.
Table 4. Video reduction summary in peak periods
The maximum average volume observed was 31 veh/min/ln (1,872 veh/hr/ln). The maximum volume observed in any one lane during any minute period was 38 vehicles (2,280 veh/hr/ln). Left (or inside) lanes, regardless of work zone configuration and through lane position, consistently carried higher traffic volumes. Estimated average volumes of more than 1,500 veh/hr/ln were consistently observed in these lanes.
The average volume in each through lane (in a single direction) was within two vehicles per minute approximately one-third of the time. Limited review after construction (under normal conditions) yielded a maximum flow of 21 veh/min/ln (1,260 veh/hr/ln).
veh veh/hr veh veh/hr veh veh/hr veh veh/hr
Min 7 420 17 1,020 11 660 6 360
Ave 13 770 25 1,515 22 1,315 12 720
Max 18 1,080 35 2,100 30 1,800 18 1,080
Min 6 360 15 900 9 540 6 360
Ave 11 655 18 1,090 18 1,060 11 630
Max 14 840 25 1,500 26 1,560 16 960
Min 16 960 21 1,260 22 1,320 13 780
Ave 21 1,245 30 1,805 28 1,705 18 1,085
Max 26 1,560 37 2,220 38 2,280 24 1,440
Min 10 600 15 900 15 900 8 480
Ave 19 1,124 21 1,240 23 1,396 13 772
Max 27 1,620 31 1,860 34 2,040 19 1,140
Min 18 1,080 16 960 26 1,560 20 1,200
Ave 22 1,296 24 1,440 30 1,800 23 1,360
Max 25 1,500 29 1,740 37 2,220 25 1,500
Min 13 780 22 1,320 26 1,560 19 1,140
Ave 24 1,440 26 1,560 30 1,800 20 1,180
Max 31 1,860 30 1,800 36 2,160 21 1,260
Min 21 1,260 20 1,200 30 1,800 24 1,440
Ave 24 1,452 26 1,572 31 1,872 29 1,740
Max 28 1,680 33 1,980 33 1,980 33 1,980
Min 11 660 19 1,140
Ave 18 1,084 26 1,544
Max 29 1,740 31 1,860
Min 9 540 24 1,440
Ave 13 804 28 1,692
Max 18 1,080 32 1,920
7
8
9
Observation
ID
1
2
3
4
5
6
Eastbound Westbound
Right Lane Left Lane Left Lane Right Lane

13
Conclusions and Recommendations
Documenting the impacts of work zone activities to travel reliability should be one of the major benefits to having deployed ITS assets. However, as demonstrated in this project effort, if the equipment is not calibrated in coordination with the construction activities, the data have limited use.
Prioritizing the coordination of these assets with construction activities will ensure that essential observations and data collection, based on changes in work-zone configurations and activity levels, can be collected throughout the project. This will also ensure that valid data are obtained during the project.
Traffic sensor validation and manual reconfiguration may be necessary due to lane shifts within the work zone. Validation may then be accomplished via video review/reduction or field observations. Immediate download and review of tabular sensor data should be conducted to provide confidence in the accuracy of data collection. Visualization and review of dynamically presented sensor-based data, such as average speeds, can also serve this purpose, to a lesser degree.
If possible, developing a more automated means for capture of traffic camera-based data would be desirable to obtain and document traffic conditions over more, and different, conditions. This could also be accomplished through additional coordination with the appropriate traffic center.
Finally, consideration of the impact of vehicle type may be beneficial. This was not performed during this study, but video reduction indicated a high percentage of large vehicles during some of the analysis periods. Without considering vehicle type, analysis results suggest that the Iowa DOT assumed capacity of 1,350 pc/h/ln for freeway work zones with lane closures might be somewhat conservative.
In general, remote traffic monitoring devices provide excellent means to monitor and assess work zone performance, particularly those within existing infrastructure. In addition, these devices can provide a wealth of information while facilitating flexibility in data collection and reduction with limited additional investment.
Existing conditions may be evaluated and used to convey traffic demand more accurately in modeling and reliability. Actual performance may be used to adjust the model(s) and develop improved models for future work zones. However, interactive review and assessment of outputs must be conducted to ensure accurate and appropriate data collection.
If the Iowa DOT continues to rely on volume (throughput) as a primary mobility performance measure, tasks should be associated with each major construction project to adjust ITS equipment, capture operations data, and manage/store these data in a format that facilitates on-going continuous improvement efforts.

14
SUBURBAN FREEWAY RAMP CLOSURES WITH LOCAL DETOUR
Work Zone Overview
The work zone of interest was located on north and southbound I-35/80 in the western Des Moines metropolitan area. Construction, during spring 2010, consisted of bridge deck replacement over Walnut Creek, between the University Avenue and Hickman Road (US Highway 6) interchanges (Figure 10).
Figure 10. Walnut Creek Bridge site map (Bing Maps n.d.)
Throughout construction, three through lanes of traffic were open, but possibly shifted, in each direction of travel. The AADT for this portion of the Interstate was approximately 101,000 vehicles per day. The primary impact of the work zone on motorists was ramp closures at Hickman Road and University Avenue:
Northbound off ramp to Hickman Road (8,800 AADT 2009) Southbound on ramp from Hickman Road (8,900 AADT 2009) Northbound on ramp from University Avenue (10,700 AADT 2009) Southbound off ramp to University Avenue, limited access from mainline (11,100
AADT 2009)
Detours were officially designated for each of the ramp closures. These detours predominately utilized local streets in the cities of Clive and West Des Moines, specifically University Avenue and NW 128th Street. Hickman Road/US 6, a state route, was also utilized. Figure 11 shows the four ramp closures in red and associated detour routes in green, with a red dot designating the destination.

15
Figure 11. Ramp closures and detour routes

16
Work Zone Assessment Objectives
Local agencies had several concerns regarding the project, particularly with respect to the increased demand on the adjacent surface streets and intersections resulting from the detours. The afternoon peak was of primary interest. Concerns also included use of non-designated detour routes, such as NW 114th Street/NW 111th Street located parallel to the Interstate.
As with the local agencies, the Iowa DOT was interested in the level of traffic displaced to the local system. This information would serve as a frame of reference in planning future high-volume, urban/suburban freeway projects involving ramp closures. There was also an interest in quantifying the degree of traffic diversion, if any, throughout the different phases of construction.
Data Sources
One Wavetronix SmartSensorTM (MVDS29 for I-35/80 northbound to Hickman Road) was located within the work zone, facilitating the capture of traffic flow in the work zone. At this location, the sensor captures data across three through lanes and an entrance/exit ramp in each direction of travel (Figure 12).
Figure 12. MVDS 29 – I-35/80 northbound to Hickman Road
However, in advance of construction, the overhead truss on which this sensor was located was removed. The sensor was eventually relocated to a temporary wood pole erected at

17
approximately the same location. This resulted in limited pre-work zone data for analysis (discussed later).
A second sensor (I-35/80 northbound to Douglas Avenue) was located within one-mile, north of the work zone, and consisted of a similar lane profile (Figure 13).
Figure 13. MVDS 30 – I-35/80 northbound to Douglas Avenue
As discussed previously, the data collected by theses sensors had to be archived manually and exported for future analysis.
Another primary data source was in-pavement, traffic signal loop detectors provided by the City of West Des Moines. These data were critical in evaluating the traffic impacts on the local, surface streets. Loop detector data were provided for seven intersections located at the ramps of interest (University Avenue only), the detour route, and other prominent intersections on or near the University Avenue corridor, east of the Interstate interchange:
University Avenue and west ramp University Avenue and east ramp 50th Street and Corporate Drive University Avenue and 47th Street University Avenue and 128th Street/60th Street (designated detour) University Avenue and 35th Street/Valley West Drive/NW 100th Street University Avenue and 22nd Street/86th Street

18
The intersections are listed above in order of increasing distance from the interchange.
The designated detour was located approximately one mile west of the interchange, while the intersection of University Avenue and 22nd Street was located at the greatest distance, approximately two miles east of the interchange.
Unfortunately, no traffic data were available for the intersection of University Avenue and NW 114th Street, a likely, alternate route used by drivers. In addition, data were not available for intersections along Hickman Road (US Highway 6), which was reported to typically experience long queues during the afternoon peak, especially near the Interstate ramps. No data were available because it is located in a different jurisdiction, possessing different infrastructure.
Finally, because of observed traffic volumes during Interstate construction and ramp closures, the City of Clive used portable tube counters to collect data on the official detour (NW 128th Street) as well as on NW 114th Street. Limited historic data were available for NW 114th Street. Figure 14 presents an overview of the locations of data collection, not including NW 128th Street and Sunset Terrace.
Figure 14. Local traffic data

19
Both sensor data and loop detector data were archived under normal (non-work-zone) conditions to assess and establish a benchmark of typical operating characteristics.
Data Utilization
Construction Phasing
The timeline of construction was established by utilizing several sources, including the original plans, Des Moines Metro Alerts (issued by the Iowa DOT), and correspondence between the research team and local and state agencies. Assimilation of these data was necessary because project phases could, and did, vary from the original plans.
Ultimately, these data were used to establish different date thresholds to examine changes due to construction. Five thresholds (phases) for analysis were established as shown in Table 5. No construction occurred during the beginning and ending phases.
Table 5. Walnut Creek Bridge reconstruction phasing
Phase Dates (2010) Details Pre-Construction 4/12 – 4/19 Data are only available for approximately one to two
weeks before the closures occur Phase 1: Northbound Ramps Closed
4/19 – 5/10 The Hickman northbound off ramp and University northbound on ramp are both closed
Phase 2: Northbound On Ramp Closed
5/10/ – 5/20 The Hickman northbound off ramp opens but the University northbound on ramp remains closed
Phase 3: Southbound On Ramp Closed
5/20 – 6/9 The Hickman southbound on ramp is closed
Post-Construction 6/9 – 7/1 Construction is concluded/no closures are present Traffic Sensors
Based on experience from the previously-discussed project, Iowa DOT personnel attempted to adjust sensor configuration to account for changes in lane positions. In the previous project, changes in lane position resulted in limited data of use from within the work zone. This was accomplished, in part, by viewing the work zone interactively using a proximate traffic camera.
Sensor data were archived manually, for varying time periods, and exported by Iowa DOT personnel before, during, and after the work zone presence. Data were provided for all sensors in the system, not only the sensors of interest. Therefore, the data sets were quite voluminous, with nearly a million records present for each month.
Data were provided originally in text file format with a two-line header separating the data for each sensor (Figure 8). Each row following the header represented summary data for a specific date, time (in 15 minute bins), and lane combination for the sensor.

20
A new format was provided beginning in late April 2010 and better facilitated use in a relational database. Specifically, instead of header rows indicating sensor name and location, these attributes were provided with each row of data (Figure 15).
Figure 15. New sensor data format
New procedures were developed to aggregate data (new format) by location for several different factors, such as time period or interval, lane, and lane combinations. Application of consistent naming conventions and aggregation procedures was also verified. Previous data sets were then reformatted and integrated into a comprehensive database.
Weekday, hourly volumes were evaluated at each of the sensors for each lane independently, for through lanes (by direction of travel), and for all lanes (by direction of travel). The following hourly volumes were computed:
12 hour (7:00 am to 7:00 pm) Average morning (two hour) peak – from 7:00 am to 9:00 am Average afternoon (two hour) peak – from 4:00 pm to 6:00 pm
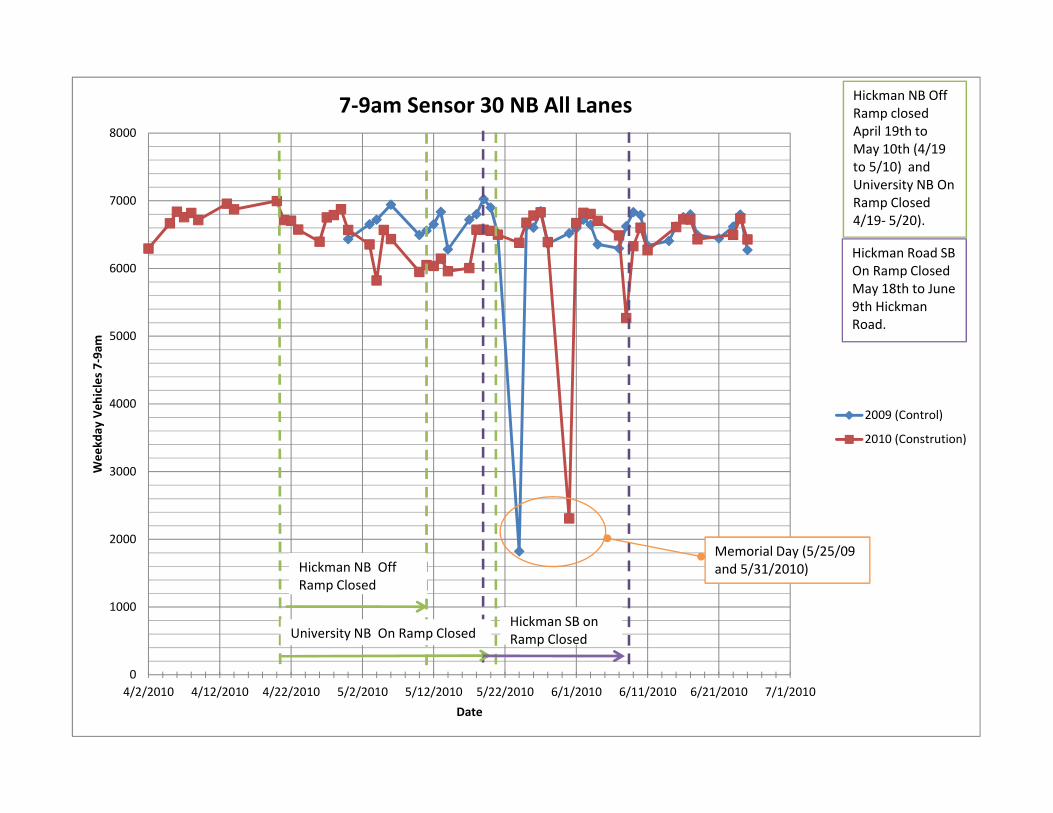
Line plots were then created to present traffic volume data for each direction of travel and lane group (e.g., through, entrance/exit ramp) for the two sensors of interest and the time periods of interest. Given the limited availability of pre-construction data, sensor data from the same sensors and time period in 2009 were assimilated and used to provide a supplemental frame of reference. Sample 12 hour northbound through traffic at MVDS29 is shown in Figure 16. Figure 17 presents similar data at MVDS30, which is the sensor located northbound downstream. A total of 24 of these figures were created for evaluation and are included in Appendix B.

21
Figure 16. Sample Wavetronix-based 12 hour summary (MVDS29)

22
Figure 17. Sample Wavetronix-based 12 hour summary (MVDS30)
Immediately apparent in Figure 16 data was a dramatic decrease in through-traffic volumes during construction. The decrease was so significant that it was unrealistic (seven data points, which are fewer than 22,500 vehicles). This data suggested that, despite the concerted effort to reconfigure the sensor-based, one-lane position changes, accurate data were not being collected. Therefore, these data are of limited or no use in evaluating the performance of the work zone on the Interstate itself, and emphasis must be placed on the impact on the local and surface streets.
This conclusion is further supported by the summary data presented in Figure 17. The traffic volumes of this downstream sensor, while not located in the work zone, were more consistent with the 2009 reference volumes throughout construction.
In addition, after the majority of the lane impacts were completed near MVDS29, the volumes became very similar to those at MVDS30. This figure also conveys the general variations in traffic volumes by day of the week.
In general, a decrease in northbound traffic volumes at MVDS30 was observed for the three daily time periods (morning peak, afternoon peak, and 12 hour) during the first two construction phases (Table 6).

23
Table 6. Observed changes in northbound traffic at MVDS30
Time Period Phase 1 Phase 2 Two-hour Morning Peak -10% -7% Two-hour Afternoon Peak -15% -15% 12 Hour -6% -10% A decrease in northbound entrance ramp volumes was also observed. This could either represent a diversion of traffic from the Interstate (to avoid the work zone) or traffic not using the northbound Hickman Road on ramp to access the Interstate after diversion to local streets. No changes were observed in the southbound direction during these phases.
In-Pavement Traffic Signal Loop Detector Counts
The City of West Des Moines supplied traffic signal, in-pavement loop detector data for seven intersections located at the ramps of interest (University Avenue only), the detour route, and other prominent intersections on or near the University Avenue corridor east of the Interstate interchange. Traffic count data were provided by date and 15 minute intervals for each intersection by approach and movement (left, through, and right) (Figure 18). These data were archived manually, for varying time periods, and exported by city personnel before, during, and after the work zone presence.
Figure 18. Sample loop detector count format
The summary data were provided in PDF format. Therefore, appropriate data were extracted manually from these files and imported into corresponding Excel files for later analysis, which

24
was a time-consuming and potentially-error prone process. All count data were then integrated into an Access database, and several attributes were reformatted to facilitate analysis.
Weekday count data were summarized for each intersection approach and movement by date for the following time periods:
12 hour (7:00 am to 7:00 pm) Average morning (two-hour) peak Average afternoon (two-hour) peak
Scatter plots, denoting construction phases, were then created to present count data for all intersection approaches, as well as each approach independently, for the three time periods. Sample intersection and approach plots for the afternoon peak are provided in Figure 19 and Figure 20, respectively.
Figure 19. Sample intersection counts, 128th Street

25
Figure 20. Sample intersection approach counts by movement, 128th Street
A total of 89 of figures were created for evaluation and are included in Error! Reference source not found..
These plots were useful in not only assessing trends but also identifying data anomalies (e.g., large, inexplicable count increases/decreases). Without this visual component, identifying anomalies that may skew analysis results or limit interpretation is challenging when working with such voluminous data sets.
Figure 19 conveys the increase in traffic on the east approach of the designated detour during closure of the northbound University Avenue entrance ramp, followed by a return to “normal” conditions, most prominently.
A less pronounced increase is apparent on the northbound approach during the closure of the southbound Hickman Road entrance ramp. Figure 20 most notably presents the increase in right-turning traffic (onto the designated detour) during closure of the northbound University Avenue entrance ramp.

26
The volume increase is most prominent immediately following the closure but gradually decreases, possibly suggesting drivers selecting alternate paths. Both of these figures also convey the general, daily variations of approach and movement volumes.
As an additional example, Figure 21 presents the 12 hour impact of the University Avenue entrance ramp at the east approach to the ramp.
Figure 21. Sample intersection approach counts by movement, East University ramp
The figure clearly conveys the decrease in right turns onto the ramp (nearly 5,000 vehicles during this time period). The data in the figure also reveal that the increase in through movements (necessary to access the designated detour) was not of equal magnitude as the aforementioned decrease, suggesting that alternate routes were being used east of the intersection (e.g., 114th Street).
Average approach volumes (and standard deviations) were computed for each of the time periods and phases and compared to both baseline volumes and prior phase volumes. In some cases, considerable variation existed among approach and movement-based volumes, limiting the possible suitability of average comparisons. However, given the nature of the study, rigorous statistical analyses were not warranted.

27
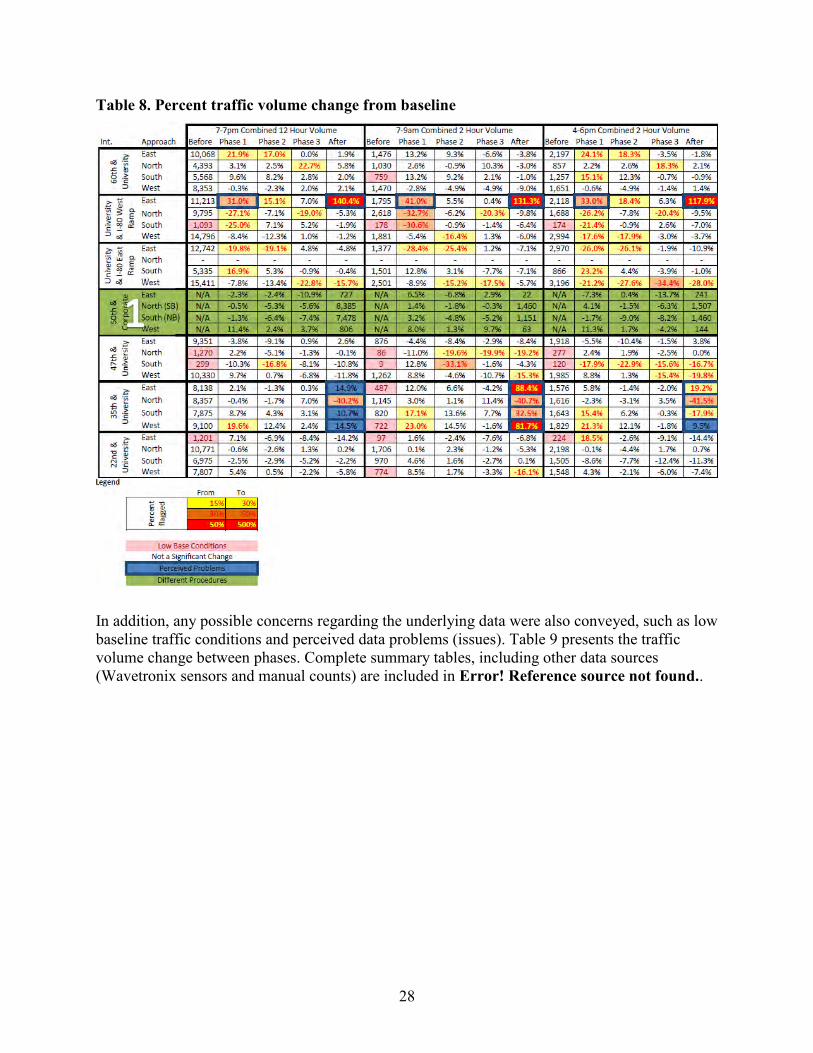
Three tables presenting the aforementioned data were prepared. Table 7 presents the traffic volume change from baseline, while Table 8 presents the percent traffic volume change from the baseline. Table 8 also conveys categorized percent changes, expressed as the following:
Less than 15 percent 15 to 30 percent 30 to 50 percent Greater than 50 percent
Table 7. Traffic volume change from baseline
28
Table 8. Percent traffic volume change from baseline
In addition, any possible concerns regarding the underlying data were also conveyed, such as low baseline traffic conditions and perceived data problems (issues). Table 9 presents the traffic volume change between phases. Complete summary tables, including other data sources (Wavetronix sensors and manual counts) are included in Error! Reference source not found..

29
Table 9. Traffic volume change between phases
Finally, baseline volume comparison results by approach (including manual counts, to be discussed later) for all three construction phases and three time periods were compiled and presented in five maps.
Pre-construction conditions (baseline conditions) Phase 1 comparison to baseline Phase 2 comparison to baseline Phase 3 comparison to baseline Post-construction conditions, comparison to baseline
These maps also presented any pertinent ramp closures, highlighted volume changes greater than five percent, and noted any sensor failures (or issues) that may misrepresent results. Figure 22 and Figure 23 represent Phase 1 percent volume change comparison maps. Figure 23 is localized to the University Avenue-I 35/80 interchange. All maps are included in Error! Reference source not found..

30
Figure 22. Sample Phase 1 percent volume change from baseline
Figure 23. Sample Phase 1 percent volume change from baseline - interchange

31
University Avenue East Ramp with Interstate 35/80
East Approach: The 12 hour traffic volumes on the east approach decreased (from 12,742 vehicles) in the first two phases by approximately 19 percent. While the through movements increased (~2,000 vehicles), the increase was not as great as the right-turn movements decrease (~4,800 vehicles) due to the northbound ramp closure during these phases. Given the designated through movement would be necessary to access the designated detour route, it appears that drivers may have been using alternate routes.
During the two-hour morning peak, the traffic volume (from nearly 1,400 vehicles) also decreased during the first two phases, at approximately 28 percent and 25 percent, respectively. The through-movement increase was again less than the right-turn decrease.
As with the other time periods, a decrease in the two-hour afternoon peak (from 3,000 vehicles) during the first two phases was observed at approximately 26 percent. The through-movement increase was not equal to the right-turn movement decrease at 800 vehicles and 1,300 vehicles respectively.
South Approach: The south leg experienced an increase in 12 hour traffic (from 5,300 vehicles) of approximately 17 percent during the first phase of construction. This increase was equally distributed between the left- and right-turn movements. Increases were also observed during the peak periods with 13 percent in the morning and 23 percent in the afternoon. Drivers may have been attempting to avoid the work zone or exit early because of the northbound Hickman Road exit ramp closure. The right-turn movement saw the largest increase during the peak hours.
West Approach: Traffic on the west approach demonstrated high variability with low-ending through volumes compared to initial conditions. The immediate decrease in left turns due to the northbound University Avenue on ramp closure was clearly apparent. A similar increase in through movements was immediately observed, which was somewhat unexpected, but that decreased gradually over time.
One could expect that the origin of most of the eastbound drivers wanting to turn left onto the ramp was west of the Interstate, near the designated detour route. This may suggest that eastbound drivers did not use the designated detour route initially, either because they were not aware of it or of the ramp closure, but that drivers began using the detour route or other alternate routes eventually.
I-80/I-35 and University West Ramp
East Approach: As expected, traffic increased on the east approach during the first two project phases, at 31 percent and 15 percent, respectively, during the 12 hour period. The increase was almost entirely in the through movement. However, detector issues limited comprehensive assessment.

32
North Approach: During the 3rd construction phase when limited access to the southbound University Avenue exit ramp was provided, a decrease in traffic of approximately 20 percent was observed during all three periods (morning peak, afternoon peak, and 12 hour). The decrease was distributed equally between left and right turns.
South Approach: Very low traffic volumes existed on the south approach for all conditions. Therefore, it did not play a significant role in impact evaluation.
West Approach: The west approach experienced a decrease in traffic during the first two construction phases. For both the morning peak and 12 hour period, the decrease was more prominent in the 2nd phase. This may represent use of alternate routes by drivers due to increased awareness of the northbound University on ramp closure.
The observed changes during the first phase may also simply represent natural traffic variations. During the afternoon peak, the traffic volume decreases were greater. A decrease of approximately 18 percent was observed for the first two construction phases.
University Avenue and 128th Street (60th Street)
East Approach: Increases in traffic volumes were observed during the first two construction phases. This was to be expected given its designation as a detour route. The majority of the increases was represented by the right-turn movements (onto the detour); however, through-movements also increased. Right turns increased by approximately 150 vehicles, 400 vehicles, and 1,800 vehicles during the morning peak, afternoon peak, and 12 hour period, respectively.
During the morning peak, traffic increased by approximately 10 percent for the first two phases. The greatest increases were experienced during the afternoon peak at 24 and 18 percent. Total increases of 22 and 17 percent were observed through the 12 hour period.
North Approach: The north approach experienced a traffic volume increase during the 3rd construction phase. This can be explained by the limited access to the southbound University Avenue off ramp during this phase. Approach volumes increased by 10 percent during the morning peak, 18 percent during the afternoon peak, and 23 percent over the 12 hour period.
While all movements increased, left turns increased the most by approximately 130, 120, and 700 vehicles during the morning peak, afternoon peak, and 12 hour period, respectively.
South Approach: Traffic increased on the south approach during the first two construction phases. Increases ranged from 8 to 15 percent (during the three time periods), with the greater increases occurring during the first phase. The afternoon peak had the largest percentage increase in both phases.

33
University Avenue and 47th Street
Significant variations were exhibited in the east approach through-movement, limiting comprehensive analysis. In general, possible decreases in the east approach volumes during the first two construction phases, and an increase during the 3rd phase (morning peak), were observed. Similar variations in through movements were observed for the west approach, limiting analysis. Through movements appeared to increase during the first construction phase and decrease thereafter.
50th Street and Corporate Drive
Only minor changes in traffic were observed at this intersection during any time period or construction phase. This may be explained by natural variations in traffic patterns and the location of the intersection with respect to the project.
University Avenue and 35th Street/Valley West Drive
All movements on the west and south approaches increased during the first phase of construction, extending into the 2nd phase. Increases (from 9,100 vehicles) of approximately 23, 21, and 20 percent were observed for the morning peak, afternoon peak, and 12 hour period, respectively, on the west approach. Increases (from 7,900 vehicles) of approximately 17, 15, and 9 percent were observed for the morning peak, afternoon peak, and 12 hour period, respectively, on the south approach.
University Avenue and 22nd Street
A slight increase in traffic was observed on the west approach during the first phase of construction. Traffic then stabilized for the reminder of construction. Given the distance of this intersection from the immediately-impacted area and concerns about data quality, few other observations may be made.
Manual Counts
Based on observed traffic volume increases, the City of Clive collected traditional traffic tube-based count data for two streets—114th Street and 128th Street and Sunset Terrace, before and during the northbound University Avenue on ramp closure.
These data were provided in multiple formats, including Excel, Access, and PDF (Figure 24) for several locations.

34
Figure 24. Sample portable tube count format
Attributes included count location, counts by direction of travel for 15 minute intervals, and summary statistics (PDF only). Historic traffic data, from July 2005, were also provided for 114th Street for a frame of reference.
These data were converted into a more user friendly, consistent format and integrated into an Access database for processing and analysis. In some cases, duplicate records were identified and removed from consideration.
Four summary plots were created for each road. These included each time period of interest, i.e., morning peak, afternoon peak, 12 hour, as well as ADT. Directional traffic counts (north and southbound) were presented independently for 128th Street, while data for the two count locations were presented independently for 114th Street. A weekday average was also presented on the 114th Street ADT plot.
Following are the sample ADT plots for each site. Figure 25 presents the change in ADT along 128th Street (the designated detour) during the northbound University Avenue on ramp closure.

35
Figure 25. Sample 128th Street ADT change
From this figure, the immediate increase in northbound through traffic is clearly apparent (more than 3,000 vehicles a day). However, data are only available for the transitions between construction phases and not throughout an entire phase. Other data, such as intersection counts, should also be taken into consideration.
A similar, immediate increase in traffic is observed on 114th Street (not a designated detour), in Figure 26.

36
Figure 26. Sample 114th Street ADT change
This increase appeared to be more than 3,000 vehicles per day from the daily average; however, limited data (one week) were available, so other data, such as intersection counts, should also be taken into consideration during assessment.
All figures are included in Error! Reference source not found..
While limited data were available for 128th Street (the designated detour) and Sunset Terrace, large fluctuations (increases) in traffic were present on both the north and south approaches.
For example, during the 3rd phase of construction, the north approach experienced increases of approximately 28, 38, and 39 percent for the morning peak, afternoon peak, and 12 hour period, respectively. As expected, significant increases in traffic were experienced on the south approach, particularly for the first two phases, where the increase was approximately 50 percent (Table 10).

37
Table 10. Traffic volume changes south approach of 128th Street/Sunset Terrace
Time Period Phase 1 Phase 2 Phase 3 Two-hour Morning Peak
+53% +48% +28%
Two-hour Afternoon Peak
+57% +47% +17%
12 Hour +42% +43% +16% As noted previously, a significant bi-directional traffic increase, of possibly 3,000 to 6,000 vehicles daily, was observed along 114th Street. However, limited data were available; and, there were insufficient data to assess the peak periods.
Conclusions and Recommendations
A limitation of this project was the lack of available or reliable data for some key locations that were impacted by the construction activities, such as Hickman Road, I-35/80, and the intersection of University Avenue and 50th Street.
To obtain sufficient traffic data for these locations, additional investment in infrastructure and/or manual data collection would have been required, but was not within the project scope. Project emphasis was on utilization of existing infrastructure (resources) for work-zone impact assessment. Existing resources were quite extensive.
This project demonstrated that disparate data sets from various sources might be assimilated to conduct systematic analysis over a geographic area of interest. Traffic data, collected through various means, is typically quite extensive (voluminous) and requires a fair amount of effort to integrate, compile, and aggregate discrete data into the most pertinent components.
For example, in this project, 15 minute counts were aggregated into three analysis periods as well as specific locations and movements. Creation of a database facilitating flexibility in analysis is critical.
This project also demonstrated that challenges can exist in obtaining accurate data. Despite the effort to actively reconfigure a Wavetronix SmartSensorTM based on lane position changes, accurate data were not collected, significantly limiting analysis capabilities within the work zone. Data anomalies were also identified in the loop detector and traffic tube-based data. This highlights the need for attention to detail and application of basic quality control and assurance procedures.
Several different data presentation formats were used in this project, including maps, matrices (tables), and graphs. Each presented data at different scales and levels of aggregation. Maps and matrices conveyed average data throughout the system, while graphs provided more depth for individual locations. Used in conjunction, these techniques were all quite effective, and necessary, for data visualization and interpretation.

38
Evidence suggests that the demand on the local system (and surface streets) induced by ramp closures, particularly the northbound University Avenue entrance ramp, may have not followed anticipated patterns. For example, while traffic increased at or on the designated detour, the order of magnitude was not equivalent to the displaced traffic at the east ramp interchange.
Traffic reductions were experienced on the east approach to the ramp, indicating that westbound drivers were likely choosing alternate routes prior to the designated detour. This was also apparent on the west approach where a large shift in traffic was apparent from eastbound left turns (prohibited because of the ramp closure) to through movements. Theoretically, these through movements should have used the designated detour, given the trips originated west of the ramp closure.
These observations are also supported by the limited tube counts collected by the City of Clive. The observed traffic patterns, particularly eastbound, may suggest that a much more proactive and improved means of communication of the ramp closure and detour route may have been warranted or should be considered in future, similar projects.
The majority of traffic using a route other than the designated detour appears to have used 114th Street, a route parallel to the Interstate to the east. However, no intersection counts were available to confirm this definitively. Traffic data at intersections to the east of the closure demonstrate limited changes, again suggesting use of 114th Street by drivers. Traffic volume increases on this route may be comparable to those on the designated detour.
Unfortunately, given infrastructure limitations, this study could not effectively assess the impact on Hickman Road and its ramps. However, based on observed patterns at or on 128th Street and 114th Street, both intersections with Hickman Road experienced increased demand.
In general, several high-volume, congested intersections on University Avenue and Hickman Road, beyond those designated as detours, experienced traffic volume increases during the work zone, potentially having an impact on their levels of service. The City of West Des Moines employed traffic cameras to adjust signal timing to accommodate the increased demand. In future assessments, queuing may be another metric of interest.
Finally, detour compensation to the affected local agencies may not be sufficient if only the designated detour route is considered.
Even with a project kick-off meeting between the research team, the Iowa DOT, and impacted agencies, the data needs for this project were not met, and this is unfortunate. Future research efforts should include the resources to install field-monitoring assets to facilitate collecting the critical data needed to conduct a complete analysis.
Relying on existing data sources can consume unjustifiable efforts in reducing and formatting data, provides no means of quality control, and, as in this project, negates the opportunity to react to equipment failures during critical observational periods.

39
REFERENCES
"Bing Maps." Bing Maps. n.d. http://www.bing.com/maps/ (accessed June 28, 2011). Iowa DOT. 2008. —. "Des Moines Area tripGuide Media Kit." i235.com. n.d. http://www.iowadot.gov/i-
235/tripguide_media_kit/index.htm (accessed May 19, 2011). —. "i-235.com." Des Moines Area tripGuide. n.d. http://www.iowadot.gov/i-235/tripguide.htm
(accessed May 19, 2011). —. "i-235.com." Des Moines Area tripGuide Media Kit. n.d. http://www.iowadot.gov/i-
235/tripguide_media_kit/about_tripguide.pdf (accessed May 19, 2011). TRB. Highway Capacity Manual. Washington, DC: Transportation Research Board, 2000.


41
APPENDIX A. SENSOR LOCATIONS AND MANUAL VIDEO REDUCTION
A.1 Sensor Locations
Figure 27. MVDS34 – eastbound West to 2nd Avenue
Figure 28. MVDS35 – eastbound to 2nd Avenue

42
Figure 29. MVDS36 – eastbound from 2nd Avenue
Figure 30. MVDS37 – westbound to East 14th Street

43
A.2 Traffic Camera Video Reduction
Figure 31. Merle Hay Road sample video reduction image – outside lanes 9/11/2008
Table 11. Merle Hay Road video reduction summary – outside lanes 9/11/2008

44
Figure 32. Merle Hay Road sample video reduction sample image – inside lanes 9/16/2008
Table 12. Merle Hay Road video reduction summary – inside lanes 9/16/2008

45
Figure 33. 2nd Avenue sample video reduction image – outside lanes 9/9/2008
Table 13. 2nd Avenue video reduction summary – outside lanes 9/9/2008

46
Figure 34. 2nd Avenue sample video reduction image – outside lanes 9/11/2008
Table 14. 2nd Avenue video reduction summary – outside lanes 9/11/2008

47
Figure 35. 2nd Avenue sample video reduction image – outside lanes 9/11/2008 (Part1)
Table 15. 2nd Avenue video reduction summary – outside lanes 9/11/2008 (Part 1)

48
Figure 36. 2nd Avenue sample video reduction image – outside lanes 9/11/2008 (Part 2)
Table 16. 2nd Avenue video reduction summary – outside lanes 9/11/2008 (Part 2)

49
Figure 37. East 14th Street sample video reduction image - outside lanes 9/9/2008
Figure 38. East 14th Street sample video reduction image - outside lanes - evasive action
9/9/2008

50
Table 17. East 14th Street video reduction summary - outside lanes 9/9/2008
Figure 39. East 14th Street sample video reduction image - outside lanes 9/11/2008

51
Table 18. East 14th Street video reduction summary - outside lanes 9/11/2008
'
Figure 40. East 14th Street sample video reduction image - inside lanes 9/12/2008 (Part 1)
Table 19. East 14th Street video reduction summary - inside lanes 9/12/2008 (Part 1)

52
Figure 41. East 14th Street sample video reduction image - inside lanes 9/12/2008 (Part 2)
Table 20. East 14th Street video reduction summary - inside lanes 9/12/2008 (Part 2)

53
Figure 42. East 14th Street sample video reduction image - inside lanes 9/12/2008 (Part 3)
Table 21. East 14th Street video reduction summary - inside lanes 9/12/2008 (Part 3)

54
Figure 43. East 14th Street sample video reduction image - inside lanes 9/13/2008
Table 22. East 14th Street video reduction summary - inside lanes 9/13/2008

55
Figure 44. East 14th Street sample video reduction image - all lanes (no work zone)
10/15/2008
Table 23. East 14th Street video reduction summary - all lanes (no work zone) 10/15/2008

56
APPENDIX B. TRAFFIC VOLUME CHANGES
B.1 Freeway Mainline Traffic-Volume Changes
Sensor 30
0
1000
2000
3000
4000
5000
6000
7000
8000
4/2/2010 4/12/2010 4/22/2010 5/2/2010 5/12/2010 5/22/2010 6/1/2010 6/11/2010 6/21/2010 7/1/2010
Weekd
ay Veh
icles 7‐9am
Date
7‐9am Sensor 30 NB All Lanes
2009 (Control)
2010 (Constrution)
Memorial Day (5/25/09 and 5/31/2010)
Hickman NB Off Ramp closed April 19th toMay 10th (4/19 to 5/10) and University NB On Ramp Closed 4/19‐ 5/20).
Hickman Road SB On Ramp Closed May 18th to June 9th Hickman Road.
University NB On Ramp Closed
Hickman NB Off Ramp Closed
Hickman SB on Ramp Closed

0
1000
2000
3000
4000
5000
6000
4/2/2010 4/12/2010 4/22/2010 5/2/2010 5/12/2010 5/22/2010 6/1/2010 6/11/2010 6/21/2010 7/1/2010
WEekd
ay Veh
icles 7‐9am
Date
7‐9am Sensor 30 NB (Through Lane 2‐4)
2009 Data (Control)
2010 Construction Data
Hickman NB Off Ramp closed April 19th toMay 10th (4/19 to 5/10) and University NB On Ramp Closed 4/19‐ 5/20).
Hickman Road SB On Ramp Closed May 18th to June 9th Hickman Road.
University NB On Ramp Closed
Hickman NB Off Ramp Closed
Hickman SB on Ramp Closed

0
200
400
600
800
1000
1200
1400
1600
1800
4/2/2010 4/12/2010 4/22/2010 5/2/2010 5/12/2010 5/22/2010 6/1/2010 6/11/2010 6/21/2010 7/1/2010
Weekd
ay Veh
icles 7‐9am
Date
7‐9am Sensor 30 NB (Auxillary Lane 1)
2009 (Control)
2010 (Constrution)
Hickman NB Off Ramp closed April 19th toMay 10th (4/19 to 5/10) and University NB On Ramp Closed 4/19‐ 5/20).
Hickman Road SB On Ramp Closed May 18th to June 9th Hickman Road.
University NB On Ramp Closed
Hickman NB Off Ramp Closed
Hickman SB on Ramp Closed

0
2000
4000
6000
8000
10000
12000
4/2/2010 4/12/2010 4/22/2010 5/2/2010 5/12/2010 5/22/2010 6/1/2010 6/11/2010 6/21/2010 7/1/2010
Weekd
ay Veh
icles 4‐6p
m
Date
4‐6pm Sensor 30 NB All Lanes
2009 (Control)
2010 (Constrution)
Memorial Day (5/25/09 and 5/31/2010)
Hickman NB Off Ramp closed April 19th toMay 10th (4/19 to 5/10) and University NB On Ramp Closed 4/19‐ 5/20).
Hickman Road SB On Ramp Closed May 18th to June 9th Hickman Road.
University NB On Ramp Closed
Hickman NB Off Ramp Closed
Hickman SB on Ramp Closed

0
1000
2000
3000
4000
5000
6000
7000
8000
9000
10000
4/2/2010 4/12/2010 4/22/2010 5/2/2010 5/12/2010 5/22/2010 6/1/2010 6/11/2010 6/21/2010 7/1/2010
WEekd
ay Veh
icles 4‐6p
m
Date
4‐6pm Sensor 30 NB (Through Lane 2‐4)
2009 Data (Control)
2010 Construction Data
Hickman NB Off Ramp closed April 19th toMay 10th (4/19 to 5/10) and University NB On Ramp Closed 4/19‐ 5/20).
Hickman Road SB On Ramp Closed May 18th to June 9th Hickman Road.
University NB On Ramp Closed
Hickman NB Off Ramp Closed
Hickman SB on Ramp Closed

0
200
400
600
800
1000
1200
1400
1600
1800
4/2/2010 4/12/2010 4/22/2010 5/2/2010 5/12/2010 5/22/2010 6/1/2010 6/11/2010 6/21/2010 7/1/2010
Weekd
ay Veh
icles 4‐6p
m
Date
4‐6pm Sensor 30 NB (Auxillary Lane 1)
2009 (Control)
2010 (Constrution)
Hickman NB Off Ramp closed April 19th toMay 10th (4/19 to 5/10) and University NB On Ramp Closed 4/19‐ 5/20).
Hickman Road SB On Ramp Closed May 18th to June 9th Hickman Road.
University NB On Ramp Closed
Hickman NB Off Ramp Closed
Hickman SB on Ramp Closed

25000
27000
29000
31000
33000
35000
37000
39000
41000
43000
45000
4/2/2010 4/12/2010 4/22/2010 5/2/2010 5/12/2010 5/22/2010 6/1/2010 6/11/2010 6/21/2010 7/1/2010
Weekd
ay Veh
icles 7am‐7pm
Date
7am to 7pm Sensor 30 NB All Lanes
2009 (Control)
2010 (Constrution)
Memorial Day (5/25/09 and 5/31/2010)
Hickman NB Off Ramp closed April 19th toMay 10th (4/19 to 5/10) and University NB On Ramp Closed 4/19‐ 5/20).
Hickman Road SB On Ramp Closed May 18th to June 9th Hickman Road.
University NB On Ramp Closed
Hickman NB Off Ramp Closed
Hickman SB on Ramp Closed

20000
22000
24000
26000
28000
30000
32000
34000
36000
38000
40000
4/2/2010 4/12/2010 4/22/2010 5/2/2010 5/12/2010 5/22/2010 6/1/2010 6/11/2010 6/21/2010 7/1/2010
WEekd
ay Veh
icles 7am to
7pm
Date
7 am to 7 pm Sensor 30 NB (Through Lane 2‐4)
2009 Data (Control)
2010 Construction Data
Hickman NB Off Ramp closed April 19th toMay 10th (4/19 to 5/10) and University NB On Ramp Closed 4/19‐ 5/20).
Hickman Road SB On Ramp Closed May 18th to June 9th Hickman Road.
University NB On Ramp Closed
Hickman NB Off Ramp Closed
Hickman SB on Ramp Closed

1000
2000
3000
4000
5000
6000
7000
8000
9000
4/2/2010 4/12/2010 4/22/2010 5/2/2010 5/12/2010 5/22/2010 6/1/2010 6/11/2010 6/21/2010 7/1/2010
Weekd
ay Veh
icles 7am‐7pm
Date
7am to 7pm Sensor 30 NB (Auxillary Lane 1)
2009 (Control)
2010 (Constrution)
Hickman NB Off Ramp closed April 19th toMay 10th (4/19 to 5/10) and University NB On Ramp Closed 4/19‐ 5/20).
Hickman Road SB On Ramp Closed May 18th to June 9th Hickman Road.
University NB On Ramp Closed
Hickman NB Off Ramp Closed
Hickman SB on Ramp Closed

0
2000
4000
6000
8000
10000
12000
4/2/2010 4/12/2010 4/22/2010 5/2/2010 5/12/2010 5/22/2010 6/1/2010 6/11/2010 6/21/2010 7/1/2010
Weekd
ay Veh
icles 7‐9am
Date
7‐9am Sensor 30 SB All Lanes
2009 (Control)
2010 (Constrution)
Memorial Day (5/25/09 and 5/31/2010)
Hickman NB Off Ramp closed April 19th toMay 10th (4/19 to 5/10) and University NB On Ramp Closed 4/19‐ 5/20).
Hickman Road SB On Ramp Closed May 18th to June 9th Hickman Road.
University NB On Ramp Closed
Hickman NB Off Ramp Closed
Hickman SB on Ramp Closed
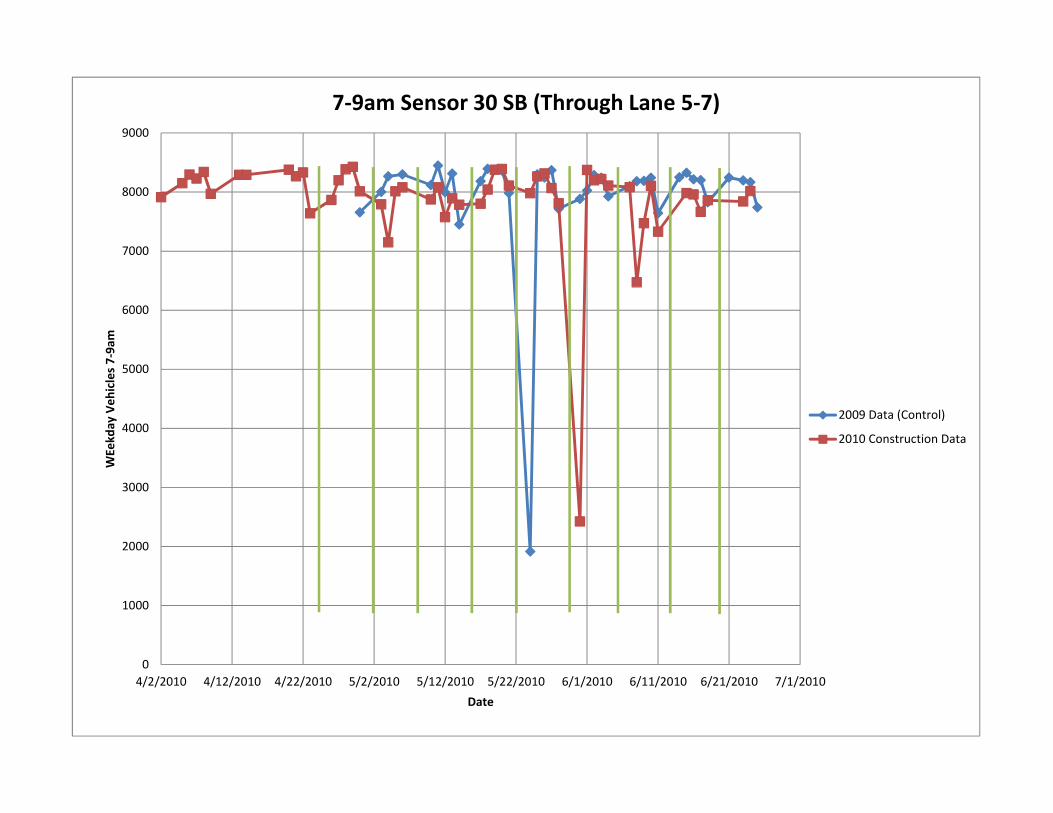
0
1000
2000
3000
4000
5000
6000
7000
8000
9000
4/2/2010 4/12/2010 4/22/2010 5/2/2010 5/12/2010 5/22/2010 6/1/2010 6/11/2010 6/21/2010 7/1/2010
WEekd
ay Veh
icles 7‐9am
Date
7‐9am Sensor 30 SB (Through Lane 5‐7)
2009 Data (Control)
2010 Construction Data

0
200
400
600
800
1000
1200
1400
1600
4/2/2010 4/12/2010 4/22/2010 5/2/2010 5/12/2010 5/22/2010 6/1/2010 6/11/2010 6/21/2010 7/1/2010
Weekd
ay Veh
icles 7‐9am
Date
7‐9am Sensor 30 SB (Auxillary Lane 8)
2009 (Control)
2010 (Constrution)

0
2000
4000
6000
8000
10000
12000
4/2/2010 4/12/2010 4/22/2010 5/2/2010 5/12/2010 5/22/2010 6/1/2010 6/11/2010 6/21/2010 7/1/2010
Weekd
ay Veh
icles 4‐6p
m
Date
4‐6pm Sensor 30 SB All Lanes
2009 (Control)
2010 (Constrution)
Memorial Day (5/25/09 and 5/31/2010)
Hickman NB Off Ramp closed April 19th toMay 10th (4/19 to 5/10) and University NB On Ramp Closed 4/19‐ 5/20).
Hickman Road SB On Ramp Closed May 18th to June 9th Hickman Road.
University NB On Ramp Closed
Hickman NB Off Ramp Closed
Hickman SB on Ramp Closed
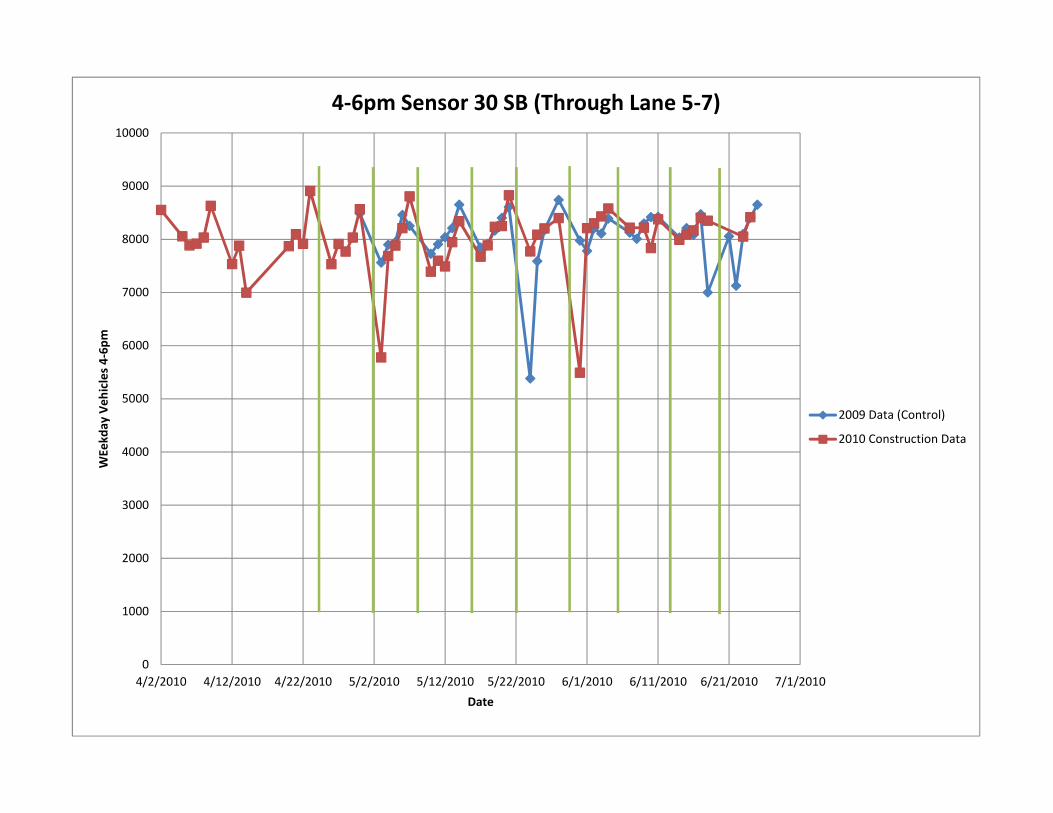
0
1000
2000
3000
4000
5000
6000
7000
8000
9000
10000
4/2/2010 4/12/2010 4/22/2010 5/2/2010 5/12/2010 5/22/2010 6/1/2010 6/11/2010 6/21/2010 7/1/2010
WEekd
ay Veh
icles 4‐6p
m
Date
4‐6pm Sensor 30 SB (Through Lane 5‐7)
2009 Data (Control)
2010 Construction Data

0
200
400
600
800
1000
1200
1400
1600
4/2/2010 4/12/2010 4/22/2010 5/2/2010 5/12/2010 5/22/2010 6/1/2010 6/11/2010 6/21/2010 7/1/2010 7/11/2010
Weekd
ay Veh
icles 4‐6p
m
Date
4‐6pm Sensor 30 SB (Auxillary Lane 8)
2009 (Control)
2010 (Constrution)

25000
30000
35000
40000
45000
50000
4/2/2010 4/12/2010 4/22/2010 5/2/2010 5/12/2010 5/22/2010 6/1/2010 6/11/2010 6/21/2010 7/1/2010
Weekd
ay Veh
icles 7am‐7pm
Date
7am to 7pm Sensor 30 SB All Lanes
2009 (Control)
2010 (Constrution)
Memorial Day (5/25/09 and 5/31/2010)
Hickman NB Off Ramp closed April 19th toMay 10th (4/19 to 5/10) and University NB On Ramp Closed 4/19‐ 5/20).
Hickman Road SB On Ramp Closed May 18th to June 9th Hickman Road.
University NB On Ramp Closed
Hickman NB Off Ramp Closed
Hickman SB on Ramp Closed
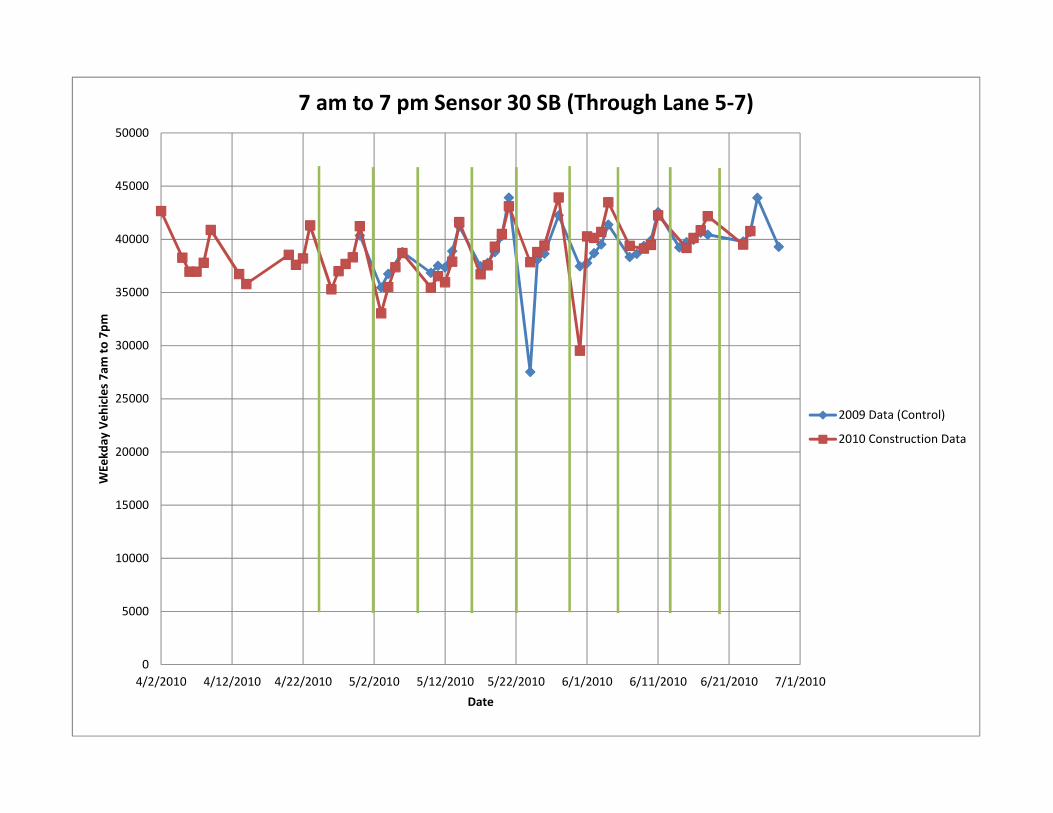
0
5000
10000
15000
20000
25000
30000
35000
40000
45000
50000
4/2/2010 4/12/2010 4/22/2010 5/2/2010 5/12/2010 5/22/2010 6/1/2010 6/11/2010 6/21/2010 7/1/2010
WEekd
ay Veh
icles 7am to
7pm
Date
7 am to 7 pm Sensor 30 SB (Through Lane 5‐7)
2009 Data (Control)
2010 Construction Data

0
1000
2000
3000
4000
5000
6000
4/2/2010 4/12/2010 4/22/2010 5/2/2010 5/12/2010 5/22/2010 6/1/2010 6/11/2010 6/21/2010 7/1/2010 7/11/2010
Weekd
ay Veh
icles 7am‐7pm
Date
7am to 7pm Sensor 30 SB (Auxillary Lane 8)
2009 (Control)
2010 (Constrution)

75
B.1 Freeway Mainline Traffic-Volume Changes
Sensor 29
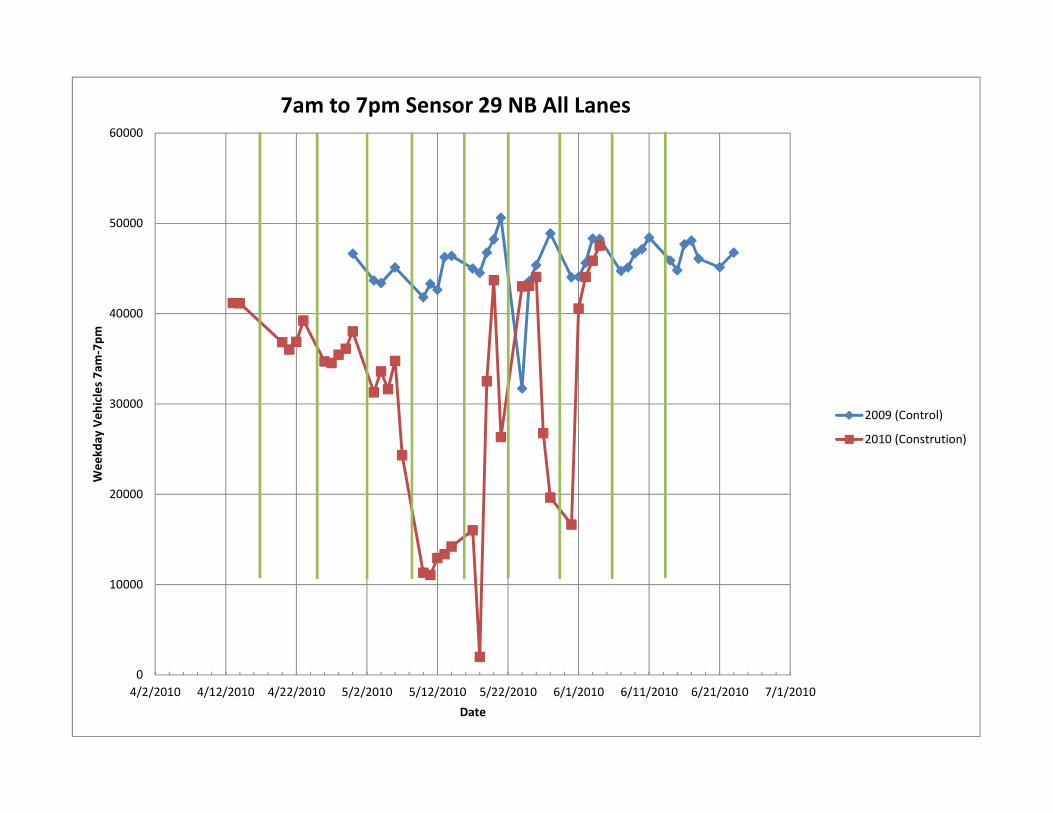
0
10000
20000
30000
40000
50000
60000
4/2/2010 4/12/2010 4/22/2010 5/2/2010 5/12/2010 5/22/2010 6/1/2010 6/11/2010 6/21/2010 7/1/2010
Weekd
ay Veh
icles 7am‐7pm
Date
7am to 7pm Sensor 29 NB All Lanes
2009 (Control)
2010 (Constrution)

7500
12500
17500
22500
27500
32500
37500
42500
4/2/2010 4/12/2010 4/22/2010 5/2/2010 5/12/2010 5/22/2010 6/1/2010 6/11/2010 6/21/2010 7/1/2010
Weekd
ay Veh
icles 7am to
7pm
Date
7 am to 7 pm Sensor 29 NB (Through Lane 2‐4)
2009 Data (Control)
2010 Construction Data

1000
2000
3000
4000
5000
6000
7000
8000
9000
4/2/2010 4/12/2010 4/22/2010 5/2/2010 5/12/2010 5/22/2010 6/1/2010 6/11/2010 6/21/2010 7/1/2010
Weekd
ay Veh
icles 7am‐7pm
Date
7am to 7pm Sensor 29 NB (Auxillary Lane 1)
2009 (Control)
2010 (Constrution)

0
10000
20000
30000
40000
50000
60000
70000
80000
4/2/2010 4/12/2010 4/22/2010 5/2/2010 5/12/2010 5/22/2010 6/1/2010 6/11/2010 6/21/2010 7/1/2010
Weekd
ay Veh
icles 7am‐7pm
Date
7am to 7pm Sensor 29 SB All Lanes
2009 (Control)
2010 (Constrution)
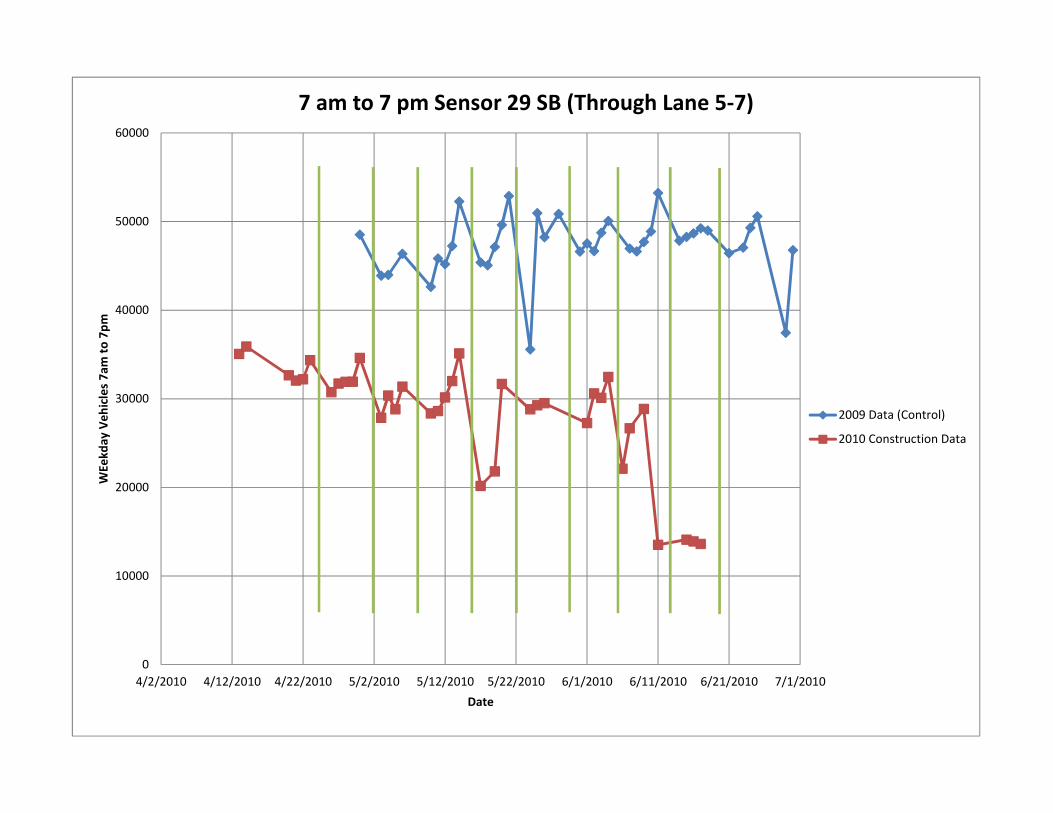
0
10000
20000
30000
40000
50000
60000
4/2/2010 4/12/2010 4/22/2010 5/2/2010 5/12/2010 5/22/2010 6/1/2010 6/11/2010 6/21/2010 7/1/2010
WEekd
ay Veh
icles 7am to
7pm
Date
7 am to 7 pm Sensor 29 SB (Through Lane 5‐7)
2009 Data (Control)
2010 Construction Data

0
5000
10000
15000
20000
25000
4/2/2010 4/12/2010 4/22/2010 5/2/2010 5/12/2010 5/22/2010 6/1/2010 6/11/2010 6/21/2010 7/1/2010 7/11/2010
Weekd
ay Veh
icles 7am‐7pm
Date
7am to 7pm Sensor 29 SB (Auxillary Lane 8)
2009 (Control)
2010 (Constrution)

82
B.2 Intersection Traffic-Volume Changes
University and I-35 East Ramp

0
500
1000
1500
2000
2500
3000
4/2/2010 4/12/2010 4/22/2010 5/2/2010 5/12/2010 5/22/2010 6/1/2010 6/11/2010 6/21/2010 7/1/2010
Total V
ehicles F
rom 7‐9am
Date
East Interchange Compilation 7‐9am
South Leg
East Leg
West Leg
Memorial Day
Hickman NB Off Ramp closed April 19th to May 10th (4/19 to 5/10) and University NB On Ramp Closed 4/19‐ 5/20).
Hickman NB Off Ramp Closed
University NB On Ramp Closed
Hickman SB on Ramp Closed
Hickman Road SB On Ramp Closed May 18th to June 9th Hickman Road.

0
200
400
600
800
1000
1200
4/2/2010 4/12/2010 4/22/2010 5/2/2010 5/12/2010 5/22/2010 6/1/2010 6/11/2010 6/21/2010 7/1/2010
Vehicles 7‐9am
Date
East Interchange East Leg Separated 7‐9am
East Leg Right Turn (NB)
East Leg Through (WB)
Memorial Day
Hickman NB Off Ramp closed April 19th to May 10th (4/19 to 5/10) and University NB On Ramp Closed 4/19‐ 5/20).
Hickman NB Off Ramp Closed
Hickman SB on Ramp Closed
Hickman Road SB On Ramp Closed May 18th to June 9th Hickman Road.
University NB On Ramp Closed

0
200
400
600
800
1000
1200
4/2/2010 4/12/2010 4/22/2010 5/2/2010 5/12/2010 5/22/2010 6/1/2010 6/11/2010 6/21/2010 7/1/2010
Vehicles 7‐9am
Date
East Interchange South Leg Separated 7‐9am
South Leg Left Turn (WB)
South Leg Right Turn (EB)
South Leg Thru (NB)
Memorial Day
Hickman NB Off Ramp closed April 19th to May 10th (4/19 to 5/10) and University NB On Ramp Closed 4/19‐ 5/20).
Hickman NB Off Ramp Closed
Hickman SB on Ramp Closed
Hickman Road SB On Ramp Closed May 18th to June 9th Hickman Road.
University NB On Ramp Closed

0
500
1000
1500
2000
2500
3000
4/2/2010 4/12/2010 4/22/2010 5/2/2010 5/12/2010 5/22/2010 6/1/2010 6/11/2010 6/21/2010 7/1/2010
Vehicels 7‐9am
Date
East Interchange West Leg Separated 7‐9am
West Leg Left Turn (NB)
West Leg Thru (EB)
Memorial Day
Hickman NB Off Ramp closed April 19th to May 10th (4/19 to 5/10) and University NB On Ramp Closed 4/19‐ 5/20).
Hickman NB Off Ramp Closed
Hickman SB on Ramp Closed
Hickman Road SB On Ramp Closed May 18th to June 9th Hickman Road.
University NB On Ramp Closed

0
500
1000
1500
2000
2500
3000
3500
4000
4/2/2010 4/12/2010 4/22/2010 5/2/2010 5/12/2010 5/22/2010 6/1/2010 6/11/2010 6/21/2010 7/1/2010
Total V
ehicles F
rom 4‐6pm
Date
East Interchange Compilation 4‐6pm
South Leg
East Leg
West Leg
Memorial Day
Hickman NB Off Ramp closed April 19th to May 10th (4/19 to 5/10) and University NB On Ramp Closed 4/19‐ 5/20).
Hickman NB Off Ramp Closed
University NB On Ramp Closed
Hickman SB on Ramp Closed
Hickman Road SB On Ramp Closed May 18th to June 9th Hickman Road.

0
500
1000
1500
2000
2500
3000
4/2/2010 4/12/2010 4/22/2010 5/2/2010 5/12/2010 5/22/2010 6/1/2010 6/11/2010 6/21/2010 7/1/2010
Vehicles 4‐6pm
Date
East Interchange East Leg Separated 4‐6pm
East Leg Right Turn (NB)
East Leg Through (WB)
Memorial Day
Hickman NB Off Ramp closed April 19th to May 10th (4/19 to 5/10) and University NB On Ramp Closed 4/19‐ 5/20).
Hickman NB Off Ramp Closed
Hickman SB on Ramp Closed
Hickman Road SB On Ramp Closed May 18th to June 9th Hickman Road.
University NB On Ramp Closed

0
100
200
300
400
500
600
700
800
4/2/2010 4/12/2010 4/22/2010 5/2/2010 5/12/2010 5/22/2010 6/1/2010 6/11/2010 6/21/2010 7/1/2010
Vehicles 4‐6pm
Date
East Interchange South Leg 4‐6pm
South Leg Left Turn (WB)
South Leg Right Turn (EB)
South Leg Thru (NB)
Memorial Day
Hickman NB Off Ramp closed April 19th to May 10th (4/19 to 5/10) and University NB On Ramp Closed 4/19‐ 5/20).
Hickman NB Off Ramp Closed
Hickman SB on Ramp Closed
Hickman Road SB On Ramp Closed May 18th to June 9th Hickman Road.
University NB On Ramp Closed

0
500
1000
1500
2000
2500
3000
3500
4/2/2010 4/12/2010 4/22/2010 5/2/2010 5/12/2010 5/22/2010 6/1/2010 6/11/2010 6/21/2010 7/1/2010
Vehicels 4‐6pm
Date
East InterchangeWest Leg 4‐6pm
West Leg Left Turn (NB)
West Leg Thru (EB)
Memorial Day
Hickman NB Off Ramp closed April 19th to May 10th (4/19 to 5/10) and University NB On Ramp Closed 4/19‐ 5/20).
Hickman NB Off Ramp Closed
Hickman SB on Ramp Closed
Hickman Road SB On Ramp Closed May 18th to June 9th Hickman Road.
University NB On Ramp Closed

2000
4000
6000
8000
10000
12000
14000
16000
18000
20000
22000
4/2/2010 4/12/2010 4/22/2010 5/2/2010 5/12/2010 5/22/2010 6/1/2010 6/11/2010 6/21/2010 7/1/2010
Total V
ehicles F
rom 7‐7pm
Date
East Interchange Compilation 7‐7pm
South Leg
East Leg
West Leg
Memorial Day
Hickman NB Off Ramp closed April 19th to May 10th (4/19 to 5/10) and University NB On Ramp Closed 4/19‐ 5/20).
Hickman NB Off Ramp Closed
University NB On Ramp Closed
Hickman SB on Ramp Closed
Hickman Road SB On Ramp Closed May 18th to June 9th Hickman Road.
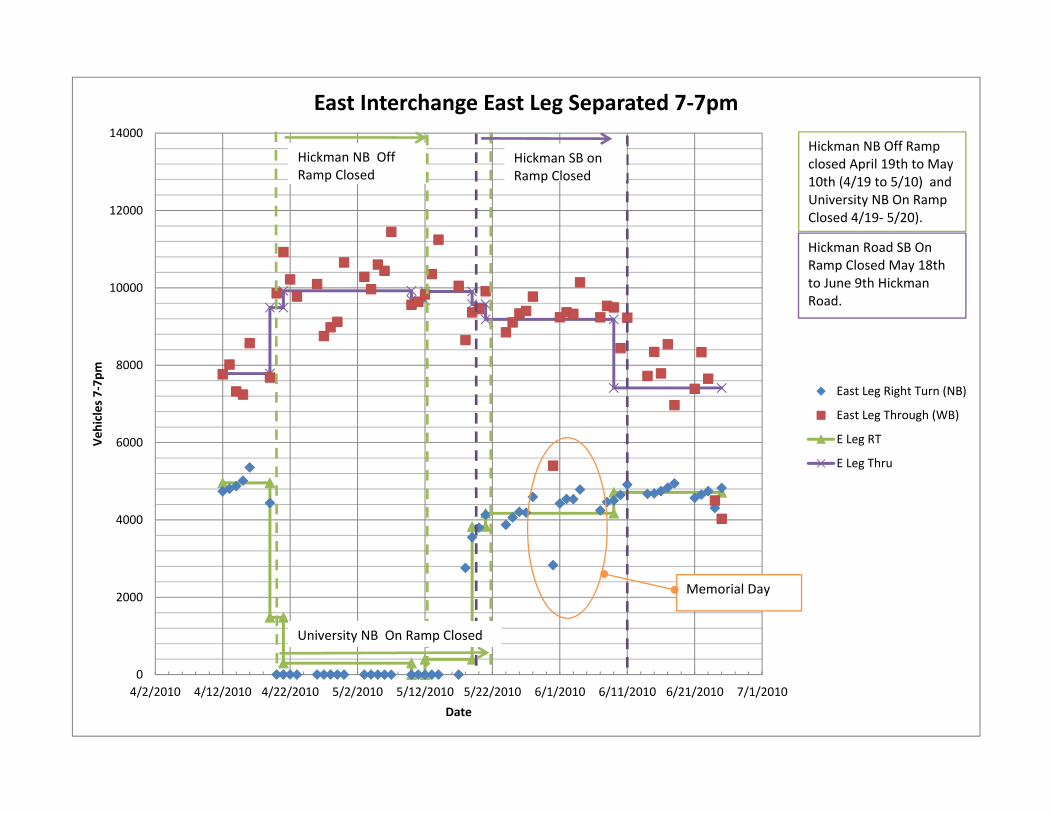
0
2000
4000
6000
8000
10000
12000
14000
4/2/2010 4/12/2010 4/22/2010 5/2/2010 5/12/2010 5/22/2010 6/1/2010 6/11/2010 6/21/2010 7/1/2010
Vehicles 7‐7pm
Date
East Interchange East Leg Separated 7‐7pm
East Leg Right Turn (NB)
East Leg Through (WB)
E Leg RT
E Leg Thru
Memorial Day
Hickman NB Off Ramp closed April 19th to May 10th (4/19 to 5/10) and University NB On Ramp Closed 4/19‐ 5/20).
Hickman NB Off Ramp Closed
Hickman SB on Ramp Closed
Hickman Road SB On Ramp Closed May 18th to June 9th Hickman Road.
University NB On Ramp Closed

0
500
1000
1500
2000
2500
3000
3500
4000
4500
4/2/2010 4/12/2010 4/22/2010 5/2/2010 5/12/2010 5/22/2010 6/1/2010 6/11/2010 6/21/2010 7/1/2010
Vehicles 7‐7pm
Date
East Interchange South Leg Separated 7‐7pm
South Leg Left Turn (WB)
South Leg Right Turn (EB)
South Leg Thru (NB)
Memorial Day
Hickman NB Off Ramp closed April 19th to May 10th (4/19 to 5/10) and University NB On Ramp Closed 4/19‐ 5/20).
Hickman NB Off Ramp Closed
Hickman SB on Ramp Closed
Hickman Road SB On Ramp Closed May 18th to June 9th Hickman Road.
University NB On Ramp Closed

0
2000
4000
6000
8000
10000
12000
14000
16000
18000
20000
4/2/2010 4/12/2010 4/22/2010 5/2/2010 5/12/2010 5/22/2010 6/1/2010 6/11/2010 6/21/2010 7/1/2010
Vehicels 7‐7pm
Date
East Interchange West Leg Separated 7‐7pm
West Leg Left Turn (NB)
West Leg Thru (EB)
Memorial Day
Hickman NB Off Ramp closed April 19th to May 10th (4/19 to 5/10) and University NB On Ramp Closed 4/19‐ 5/20).
Hickman NB Off Ramp Closed
Hickman SB on Ramp Closed
Hickman Road SB On Ramp Closed May 18th to June 9th Hickman Road.
University NB On Ramp Closed

95
B.2 Intersection Traffic-Volume Changes
University and I-35 West Ramp
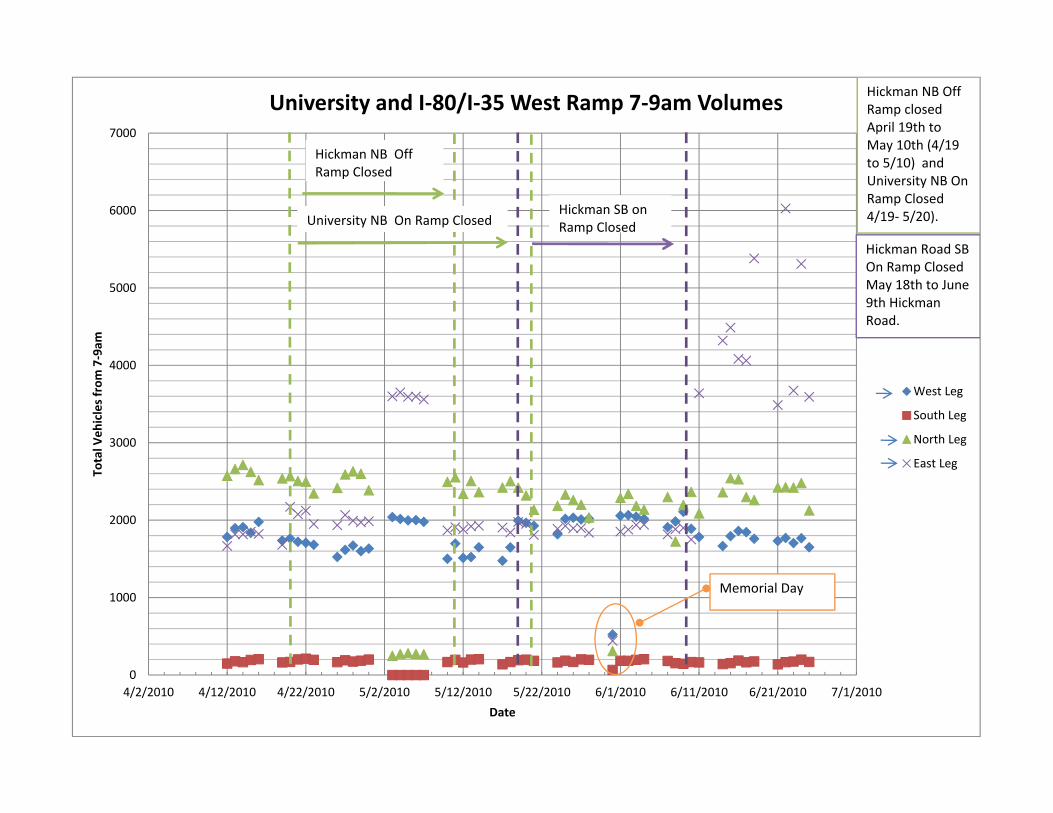
0
1000
2000
3000
4000
5000
6000
7000
4/2/2010 4/12/2010 4/22/2010 5/2/2010 5/12/2010 5/22/2010 6/1/2010 6/11/2010 6/21/2010 7/1/2010
Total V
ehicles from 7‐9am
Date
University and I‐80/I‐35 West Ramp 7‐9am Volumes
West Leg
South Leg
North Leg
East Leg
Memorial Day
Hickman NB Off Ramp closed April 19th toMay 10th (4/19 to 5/10) and University NB On Ramp Closed 4/19‐ 5/20).
Hickman Road SB On Ramp Closed May 18th to June 9th Hickman Road.
University NB On Ramp Closed
Hickman NB Off Ramp Closed
Hickman SB on Ramp Closed

0
500
1000
1500
2000
2500
3000
3500
4000
4500
5000
4/2/2010 4/12/2010 4/22/2010 5/2/2010 5/12/2010 5/22/2010 6/1/2010 6/11/2010 6/21/2010 7/1/2010
Total V
olum
e from
7‐9am
Date
University and I‐80/I‐35 West Interchange East Leg 7‐9am
Right Turn
Through
Left Turn
Memorial Day
Hickman NB Off Ramp closed April 19th toMay 10th (4/19 to 5/10) and University NB On Ramp Closed 4/19‐ 5/20).
Hickman Road SB On Ramp Closed May 18th to June 9th Hickman Road.
University NB On Ramp Closed
Hickman NB Off Ramp Closed
Hickman SB on Ramp Closed
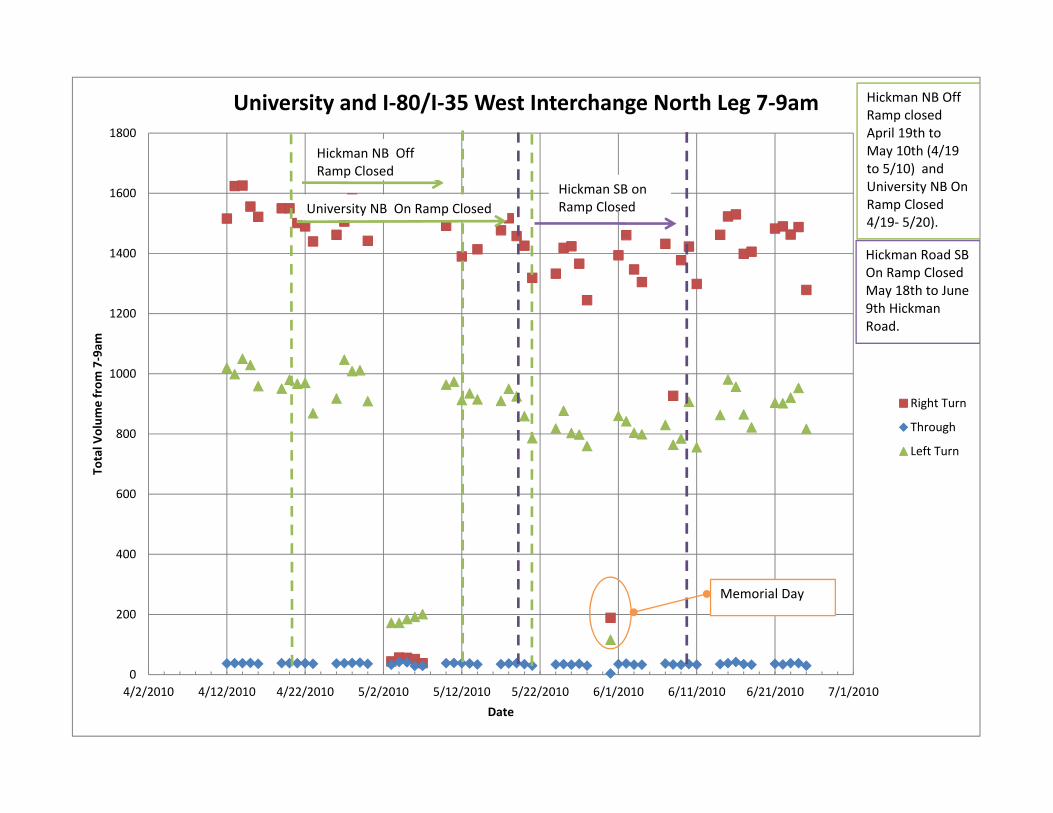
0
200
400
600
800
1000
1200
1400
1600
1800
4/2/2010 4/12/2010 4/22/2010 5/2/2010 5/12/2010 5/22/2010 6/1/2010 6/11/2010 6/21/2010 7/1/2010
Total V
olum
e from
7‐9am
Date
University and I‐80/I‐35 West Interchange North Leg 7‐9am
Right Turn
Through
Left Turn
Memorial Day
Hickman NB Off Ramp closed April 19th toMay 10th (4/19 to 5/10) and University NB On Ramp Closed 4/19‐ 5/20).
Hickman Road SB On Ramp Closed May 18th to June 9th Hickman Road.
University NB On Ramp Closed
Hickman NB Off Ramp Closed
Hickman SB on Ramp Closed

0
500
1000
1500
2000
2500
4/2/2010 4/12/2010 4/22/2010 5/2/2010 5/12/2010 5/22/2010 6/1/2010 6/11/2010 6/21/2010 7/1/2010
Total V
olum
e from
7‐9am
Date
University and I‐80/I‐35 West Interchange West Leg 7‐9am
Right Turn
Through
Left Turn
Memorial Day
Hickman NB Off Ramp closed April 19th toMay 10th (4/19 to 5/10) and University NB On Ramp Closed 4/19‐ 5/20).
Hickman Road SB On Ramp Closed May 18th to June 9th Hickman Road.
University NB On Ramp Closed
Hickman NB Off Ramp Closed
Hickman SB on Ramp Closed
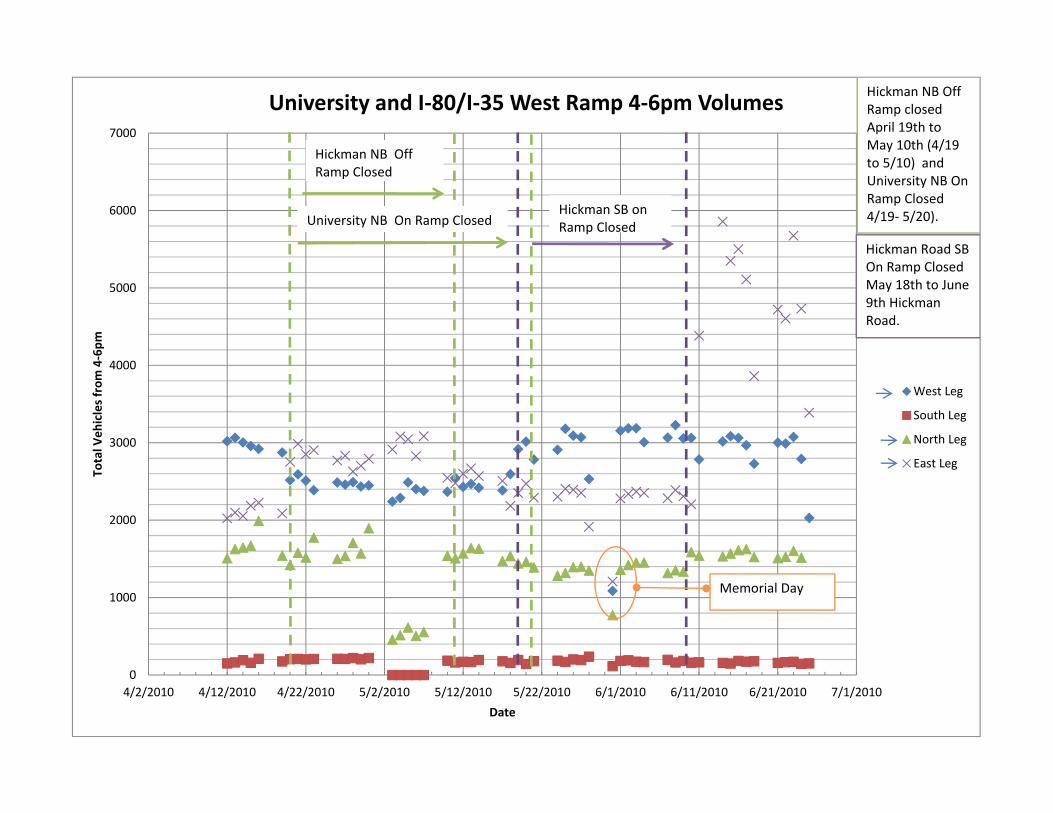
0
1000
2000
3000
4000
5000
6000
7000
4/2/2010 4/12/2010 4/22/2010 5/2/2010 5/12/2010 5/22/2010 6/1/2010 6/11/2010 6/21/2010 7/1/2010
Total V
ehicles from 4‐6pm
Date
University and I‐80/I‐35 West Ramp 4‐6pm Volumes
West Leg
South Leg
North Leg
East Leg
Memorial Day
Hickman NB Off Ramp closed April 19th toMay 10th (4/19 to 5/10) and University NB On Ramp Closed 4/19‐ 5/20).
Hickman Road SB On Ramp Closed May 18th to June 9th Hickman Road.
University NB On Ramp Closed
Hickman NB Off Ramp Closed
Hickman SB on Ramp Closed

0
500
1000
1500
2000
2500
3000
3500
4000
4500
5000
4/2/2010 4/12/2010 4/22/2010 5/2/2010 5/12/2010 5/22/2010 6/1/2010 6/11/2010 6/21/2010 7/1/2010
Total V
olum
e from
4‐6pm
Date
University and I‐80/I‐35 West Interchange East Leg 4‐6pm
Right Turn
Through
Left Turn
Memorial Day
Hickman NB Off Ramp closed April 19th toMay 10th (4/19 to 5/10) and University NB On Ramp Closed 4/19‐ 5/20).
Hickman Road SB On Ramp Closed May 18th to June 9th Hickman Road.
University NB On Ramp Closed
Hickman NB Off Ramp Closed
Hickman SB on Ramp Closed

0
200
400
600
800
1000
1200
4/2/2010 4/12/2010 4/22/2010 5/2/2010 5/12/2010 5/22/2010 6/1/2010 6/11/2010 6/21/2010 7/1/2010
Total V
olum
e from
4‐6pm
Date
University and I‐80/I‐35 West Interchange North Leg 4‐6pm
Right Turn
Through
Left Turn
Memorial Day
Hickman NB Off Ramp closed April 19th toMay 10th (4/19 to 5/10) and University NB On Ramp Closed 4/19‐ 5/20).
Hickman Road SB On Ramp Closed May 18th to June 9th Hickman Road.
University NB On Ramp Closed
Hickman NB Off Ramp Closed
Hickman SB on Ramp Closed

0
500
1000
1500
2000
2500
3000
4/2/2010 4/12/2010 4/22/2010 5/2/2010 5/12/2010 5/22/2010 6/1/2010 6/11/2010 6/21/2010 7/1/2010
Total V
olum
e from
4‐6pm
Date
University and I‐80/I‐35 West Interchange West Leg 4‐6pm
Right Turn
Through
Left Turn
Memorial Day
Hickman NB Off Ramp closed April 19th toMay 10th (4/19 to 5/10) and University NB On Ramp Closed 4/19‐ 5/20).
Hickman Road SB On Ramp Closed May 18th to June 9th Hickman Road.
University NB On Ramp Closed
Hickman NB Off Ramp Closed
Hickman SB on Ramp Closed

0
5000
10000
15000
20000
25000
30000
35000
4/2/2010 4/12/2010 4/22/2010 5/2/2010 5/12/2010 5/22/2010 6/1/2010 6/11/2010 6/21/2010 7/1/2010
Total V
ehicles from
7‐7pm
Date
University and I‐80/I‐35 West Ramp 7‐7pm Volumes
West Leg
South Leg
North Leg
East Leg
Memorial Day
Hickman NB Off Ramp closed April 19th toMay 10th (4/19 to 5/10) and University NB On Ramp Closed 4/19‐ 5/20).
Hickman Road SB On Ramp Closed May 18th to June 9th Hickman Road.
University NB On Ramp Closed
Hickman NB Off Ramp Closed
Hickman SB on Ramp Closed

0
5000
10000
15000
20000
25000
4/2/2010 4/12/2010 4/22/2010 5/2/2010 5/12/2010 5/22/2010 6/1/2010 6/11/2010 6/21/2010 7/1/2010
Total V
olum
e from
7‐7pm
Date
University and I‐80/I‐35 West Interchange East Leg 7‐7pm
Right Turn
Through
Left Turn
Memorial Day
Hickman NB Off Ramp closed April 19th toMay 10th (4/19 to 5/10) and University NB On Ramp Closed 4/19‐ 5/20).
Hickman Road SB On Ramp Closed May 18th to June 9th Hickman Road.
University NB On Ramp Closed
Hickman NB Off Ramp Closed
Hickman SB on Ramp Closed
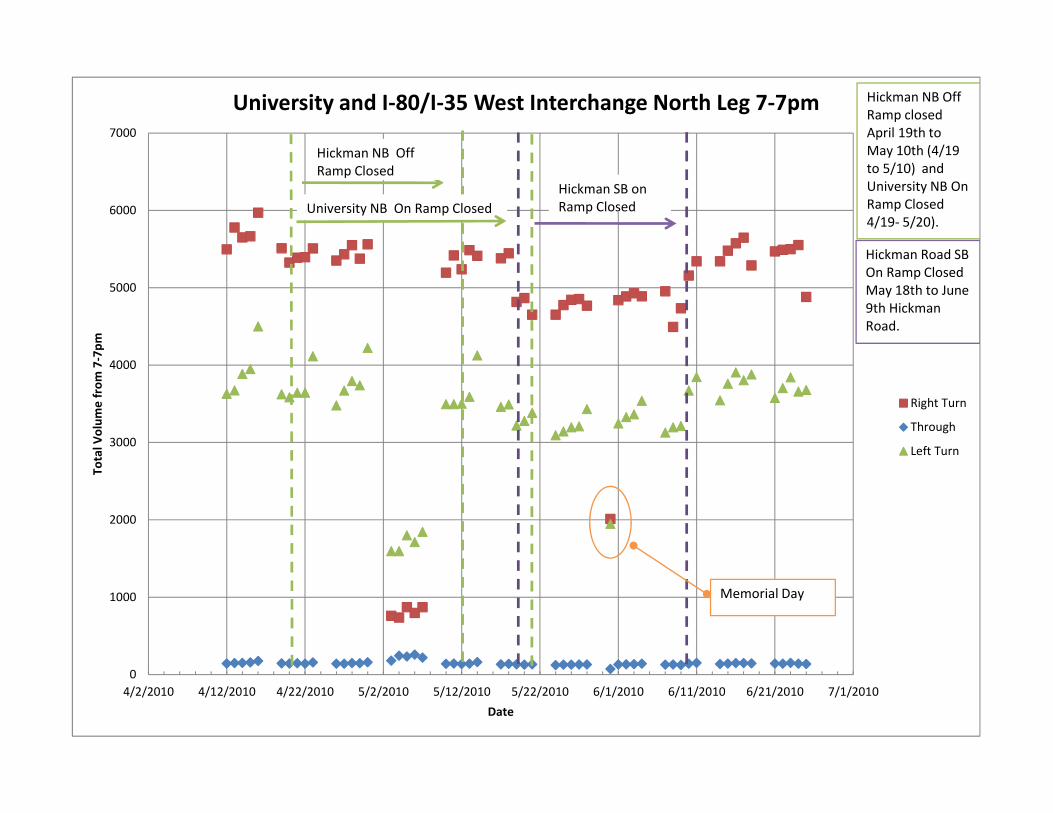
0
1000
2000
3000
4000
5000
6000
7000
4/2/2010 4/12/2010 4/22/2010 5/2/2010 5/12/2010 5/22/2010 6/1/2010 6/11/2010 6/21/2010 7/1/2010
Total V
olum
e from
7‐7pm
Date
University and I‐80/I‐35 West Interchange North Leg 7‐7pm
Right Turn
Through
Left Turn
Memorial Day
Hickman NB Off Ramp closed April 19th toMay 10th (4/19 to 5/10) and University NB On Ramp Closed 4/19‐ 5/20).
Hickman Road SB On Ramp Closed May 18th to June 9th Hickman Road.
University NB On Ramp Closed
Hickman NB Off Ramp Closed
Hickman SB on Ramp Closed

0
2000
4000
6000
8000
10000
12000
14000
16000
4/2/2010 4/12/2010 4/22/2010 5/2/2010 5/12/2010 5/22/2010 6/1/2010 6/11/2010 6/21/2010 7/1/2010
Total V
olum
e from
7‐7pm
Date
University and I‐80/I‐35 West Interchange West Leg 7‐7pm
Right Turn
Through
Left Turn
Memorial Day
Hickman NB Off Ramp closed April 19th toMay 10th (4/19 to 5/10) and University NB On Ramp Closed 4/19‐ 5/20).
Hickman Road SB On Ramp Closed May 18th to June 9th Hickman Road.
University NB On Ramp Closed
Hickman NB Off Ramp Closed
Hickman SB on Ramp Closed

108
B.2 Intersection Traffic-Volume Changes
128th Street Clive (60th Street) and University Avenue

0
200
400
600
800
1000
1200
1400
1600
1800
2000
4/2/2010 4/12/2010 4/22/2010 5/2/2010 5/12/2010 5/22/2010 6/1/2010 6/11/2010 6/21/2010 7/1/2010
Total V
ehicles P
er Day From 7‐9am
Date
60th (128th) and University 7‐9am
South Leg
East Leg
North Leg
West Leg
Memorial DayHickman NB Off Ramp Closed
Hickman SB on Ramp Closed
University NB On Ramp Closed
Hickman NB Off Ramp closed April 19th to May 10th (4/19 to 5/10) and University NB On Ramp Closed 4/19‐ 5/20).
Hickman Road SB On Ramp Closed May 18th to June 9th Hickman Road.
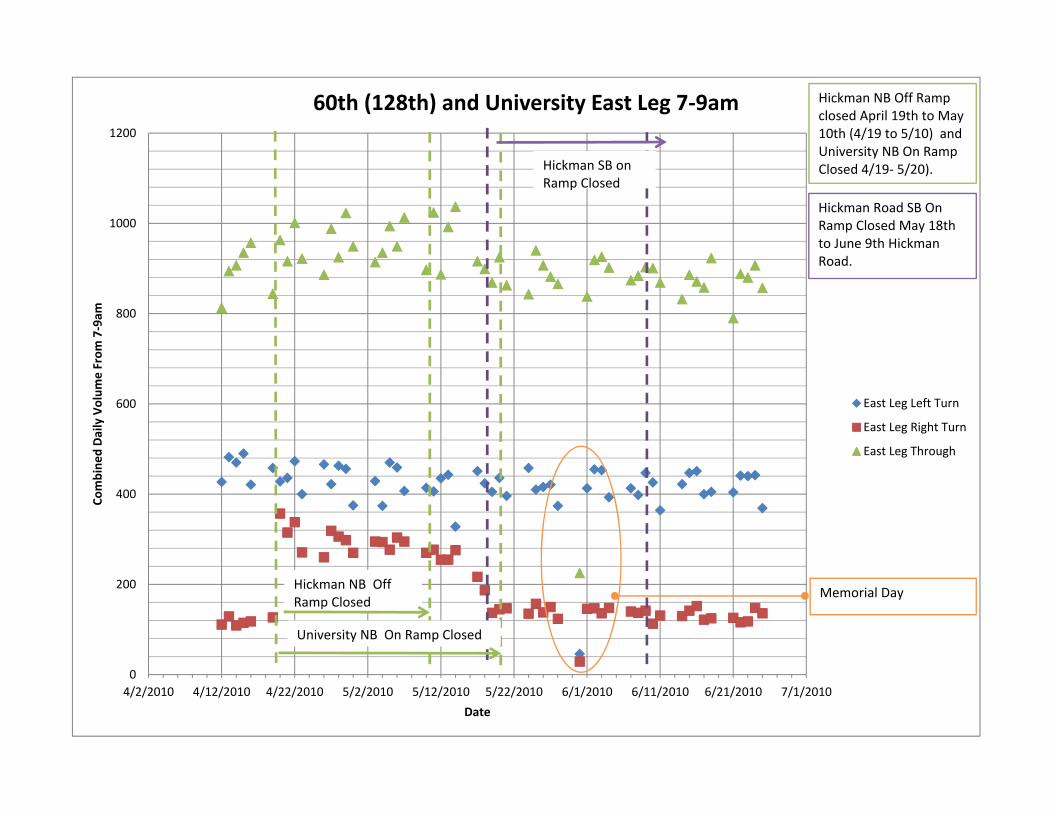
0
200
400
600
800
1000
1200
4/2/2010 4/12/2010 4/22/2010 5/2/2010 5/12/2010 5/22/2010 6/1/2010 6/11/2010 6/21/2010 7/1/2010
Combine
d Daily Volum
e From
7‐9am
Date
60th (128th) and University East Leg 7‐9am
East Leg Left Turn
East Leg Right Turn
East Leg Through
Memorial DayHickman NB Off Ramp Closed
Hickman SB on Ramp Closed
University NB On Ramp Closed
Hickman NB Off Ramp closed April 19th to May 10th (4/19 to 5/10) and University NB On Ramp Closed 4/19‐ 5/20).
Hickman Road SB On Ramp Closed May 18th to June 9th Hickman Road.
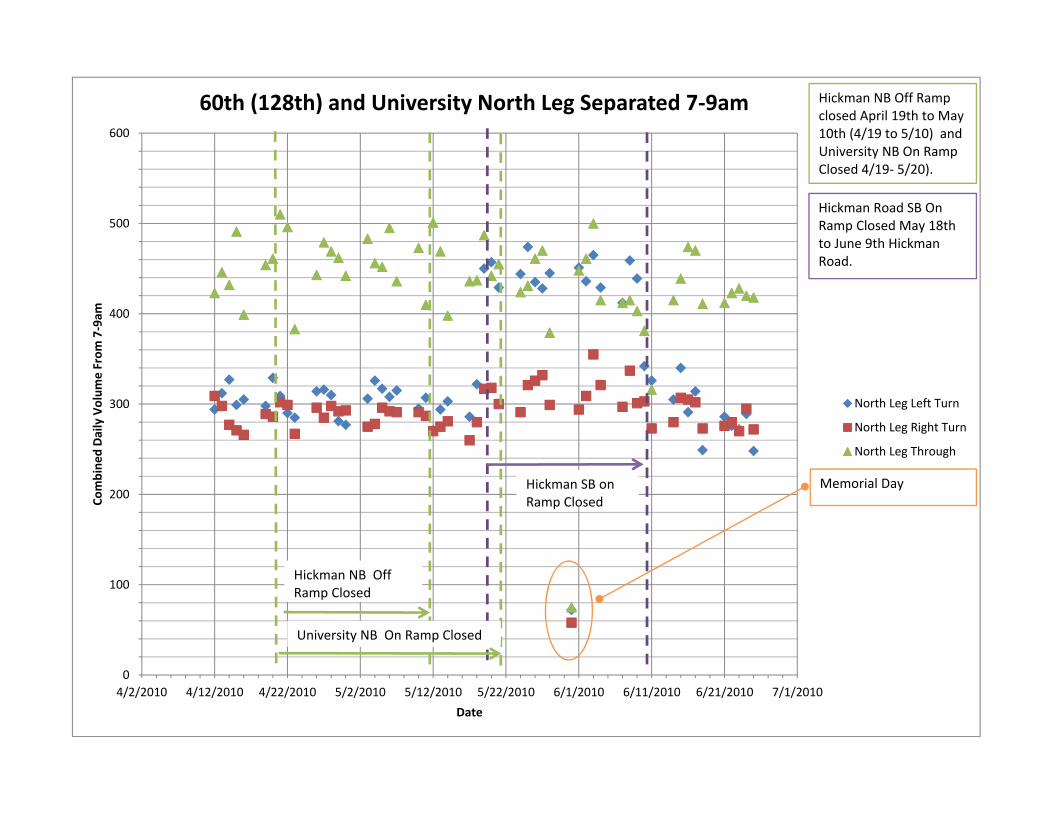
0
100
200
300
400
500
600
4/2/2010 4/12/2010 4/22/2010 5/2/2010 5/12/2010 5/22/2010 6/1/2010 6/11/2010 6/21/2010 7/1/2010
Combine
d Daily Volum
e From
7‐9am
Date
60th (128th) and University North Leg Separated 7‐9am
North Leg Left Turn
North Leg Right Turn
North Leg Through
Memorial Day
Hickman NB Off Ramp Closed
Hickman SB on Ramp Closed
University NB On Ramp Closed
Hickman NB Off Ramp closed April 19th to May 10th (4/19 to 5/10) and University NB On Ramp Closed 4/19‐ 5/20).
Hickman Road SB On Ramp Closed May 18th to June 9th Hickman Road.

0
100
200
300
400
500
600
4/2/2010 4/12/2010 4/22/2010 5/2/2010 5/12/2010 5/22/2010 6/1/2010 6/11/2010 6/21/2010 7/1/2010
Combine
d Daily Volum
e From
7‐9am
Date
South Leg Separated Movements 7‐9am
South Leg Left Turn
South Leg Right Turn
South Leg Through
Memorial Day
Hickman NB Off Ramp Closed
Hickman SB on Ramp Closed
`
University NB On Ramp Closed
Hickman NB Off Ramp closed April 19th to May 10th (4/19 to 5/10) and University NB On Ramp Closed 4/19‐ 5/20).
Hickman Road SB On Ramp Closed May 18th to June 9th Hickman Road.

0
200
400
600
800
1000
1200
4/2/2010 4/12/2010 4/22/2010 5/2/2010 5/12/2010 5/22/2010 6/1/2010 6/11/2010 6/21/2010 7/1/2010
Combine
d Daily Volum
e From
7‐9am
Date
60th (128th) and University West Leg Separated 7‐9am
West Leg Left Turn
West Leg Right Turn
West Leg Through
Memorial Day
Hickman NB Off Ramp Closed
Hickman SB on Ramp Closed
`
University NB On Ramp Closed
Hickman NB Off Ramp closed April 19th to May 10th (4/19 to 5/10) and University NB On Ramp Closed 4/19‐ 5/20).
Hickman Road SB On Ramp Closed May 18th to June 9th Hickman Road.
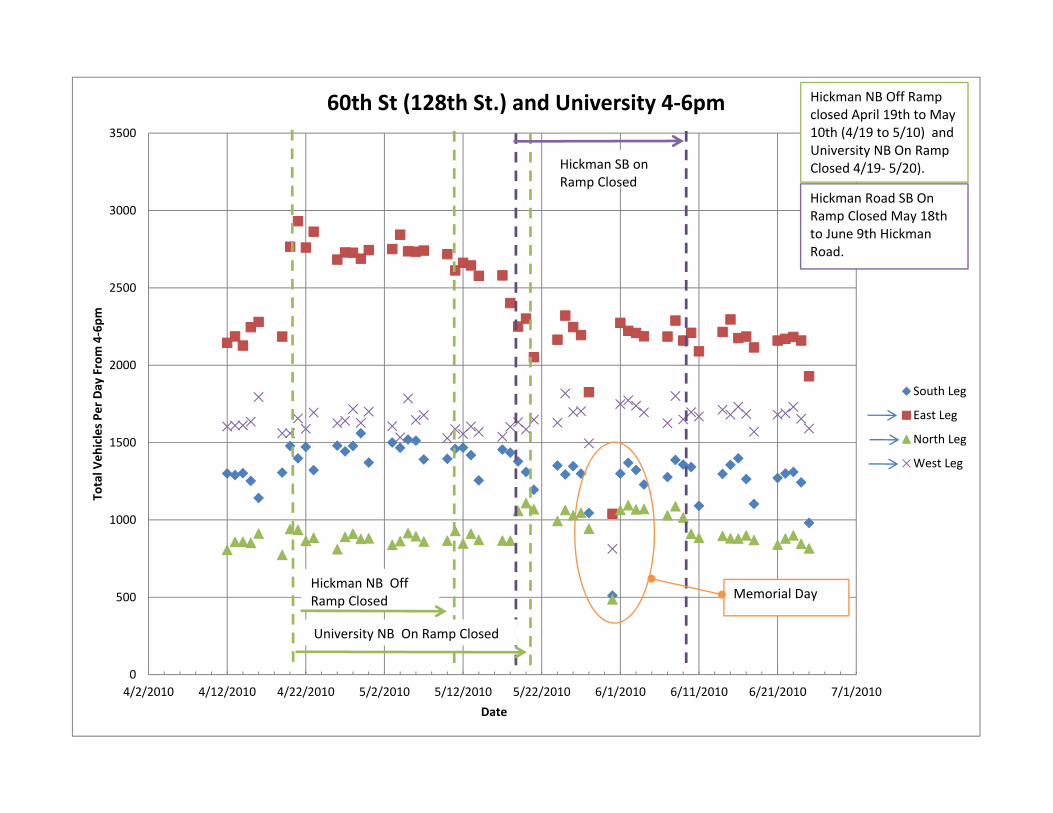
0
500
1000
1500
2000
2500
3000
3500
4/2/2010 4/12/2010 4/22/2010 5/2/2010 5/12/2010 5/22/2010 6/1/2010 6/11/2010 6/21/2010 7/1/2010
Total V
ehicles P
er Day From 4‐6pm
Date
60th St (128th St.) and University 4‐6pm
South Leg
East Leg
North Leg
West Leg
Memorial DayHickman NB Off Ramp Closed
Hickman SB on Ramp Closed
University NB On Ramp Closed
Hickman NB Off Ramp closed April 19th to May 10th (4/19 to 5/10) and University NB On Ramp Closed 4/19‐ 5/20).
Hickman Road SB On Ramp Closed May 18th to June 9th Hickman Road.

0
200
400
600
800
1000
1200
1400
1600
1800
4/2/2010 4/12/2010 4/22/2010 5/2/2010 5/12/2010 5/22/2010 6/1/2010 6/11/2010 6/21/2010 7/1/2010
Combine
d Daily Volum
e From
4‐6pm
Date
60th St (128th St.) and University East Leg Separated 4‐6pm
East Leg Left Turn
East Leg Right Turn
East Leg Through
Memorial DayHickman NB Off Ramp Closed
Hickman SB on Ramp Closed
University NB On Ramp Closed
Hickman NB Off Ramp closed April 19th to May 10th (4/19 to 5/10) and University NB On Ramp Closed 4/19‐ 5/20).
Hickman Road SB On Ramp Closed May 18th to June 9th Hickman Road.

0
100
200
300
400
500
600
4/2/2010 4/12/2010 4/22/2010 5/2/2010 5/12/2010 5/22/2010 6/1/2010 6/11/2010 6/21/2010 7/1/2010
Combine
d Daily Volum
e From
4‐6pm
Date
60th St (128th St.) and University North Leg 4‐6pm
North Leg Left Turn
North Leg Right Turn
North Leg Through
Memorial Day
Hickman NB Off Ramp Closed
Hickman SB on Ramp Closed
University NB On Ramp Closed
Hickman NB Off Ramp closed April 19th to May 10th (4/19 to 5/10) and University NB On Ramp Closed 4/19‐ 5/20).
Hickman Road SB On Ramp Closed May 18th to June 9th Hickman Road.

0
200
400
600
800
1000
1200
4/2/2010 4/12/2010 4/22/2010 5/2/2010 5/12/2010 5/22/2010 6/1/2010 6/11/2010 6/21/2010 7/1/2010
Combine
d Daily Volum
e From
4‐6pm
Date
60th St (128th St.) and University South Leg 4‐6pm
South Leg Left Turn
South Leg Right Turn
South Leg Through
Memorial Day
Hickman NB Off Ramp Closed
Hickman SB on Ramp Closed
`
University NB On Ramp Closed
Hickman NB Off Ramp closed April 19th to May 10th (4/19 to 5/10) and University NB On Ramp Closed 4/19‐ 5/20).
Hickman Road SB On Ramp Closed May 18th to June 9th Hickman Road.

0
200
400
600
800
1000
1200
1400
4/2/2010 4/12/2010 4/22/2010 5/2/2010 5/12/2010 5/22/2010 6/1/2010 6/11/2010 6/21/2010 7/1/2010
Combine
d Daily Volum
e From
4‐6pm
Date
60th St (128th St.) and University West Leg 4‐6pm
West Leg Left Turn
West Leg Right Turn
West Leg Through
Memorial Day
Hickman NB Off Ramp Closed
Hickman SB on Ramp Closed
`
University NB On Ramp Closed
Hickman NB Off Ramp closed April 19th to May 10th (4/19 to 5/10) and University NB On Ramp Closed 4/19‐ 5/20).
Hickman Road SB On Ramp Closed May 18th to June 9th Hickman Road.

0
2000
4000
6000
8000
10000
12000
14000
4/2/2010 4/12/2010 4/22/2010 5/2/2010 5/12/2010 5/22/2010 6/1/2010 6/11/2010 6/21/2010 7/1/2010
Total V
ehicles P
er Day From 7‐7pm
Date
128th St Clive (60th St) and University All Legs 7‐7pm
South Leg
East Leg
North Leg
West Leg
Memorial DayHickman NB Off Ramp Closed
Hickman SB on Ramp Closed
University NB On Ramp Closed
Hickman NB Off Ramp closed April 19th to May 10th (4/19 to 5/10) and University NB On Ramp Closed 4/19‐ 5/20).
Hickman Road SB On Ramp Closed May 18th to June 9th Hickman Road.

0
1000
2000
3000
4000
5000
6000
7000
8000
4/2/2010 4/12/2010 4/22/2010 5/2/2010 5/12/2010 5/22/2010 6/1/2010 6/11/2010 6/21/2010 7/1/2010
Combine
d Daily Volum
e From
7‐7pm
Date
128th St Clive (60th St) and University East Leg 7‐7pm
East Leg Left Turn
East Leg Right Turn
East Leg Through
Memorial DayHickman NB Off Ramp Closed
Hickman SB on Ramp Closed
University NB On Ramp Closed
Hickman NB Off Ramp closed April 19th to May 10th (4/19 to 5/10) and University NB On Ramp Closed 4/19‐ 5/20).
Hickman Road SB On Ramp Closed May 18th to June 9th Hickman Road.

0
500
1000
1500
2000
2500
4/2/2010 4/12/2010 4/22/2010 5/2/2010 5/12/2010 5/22/2010 6/1/2010 6/11/2010 6/21/2010 7/1/2010
Combine
d Daily Volum
e From
7‐7pm
Date
128th St Clive (60th St) and University North Leg 7‐7pm
North Leg Left Turn
North Leg Right Turn
North Leg Through
Memorial Day
Hickman NB Off Ramp Closed
Hickman SB on Ramp Closed
University NB On Ramp Closed
Hickman NB Off Ramp closed April 19th to May 10th (4/19 to 5/10) and University NB On Ramp Closed 4/19‐ 5/20).
Hickman Road SB On Ramp Closed May 18th to June 9th Hickman Road.
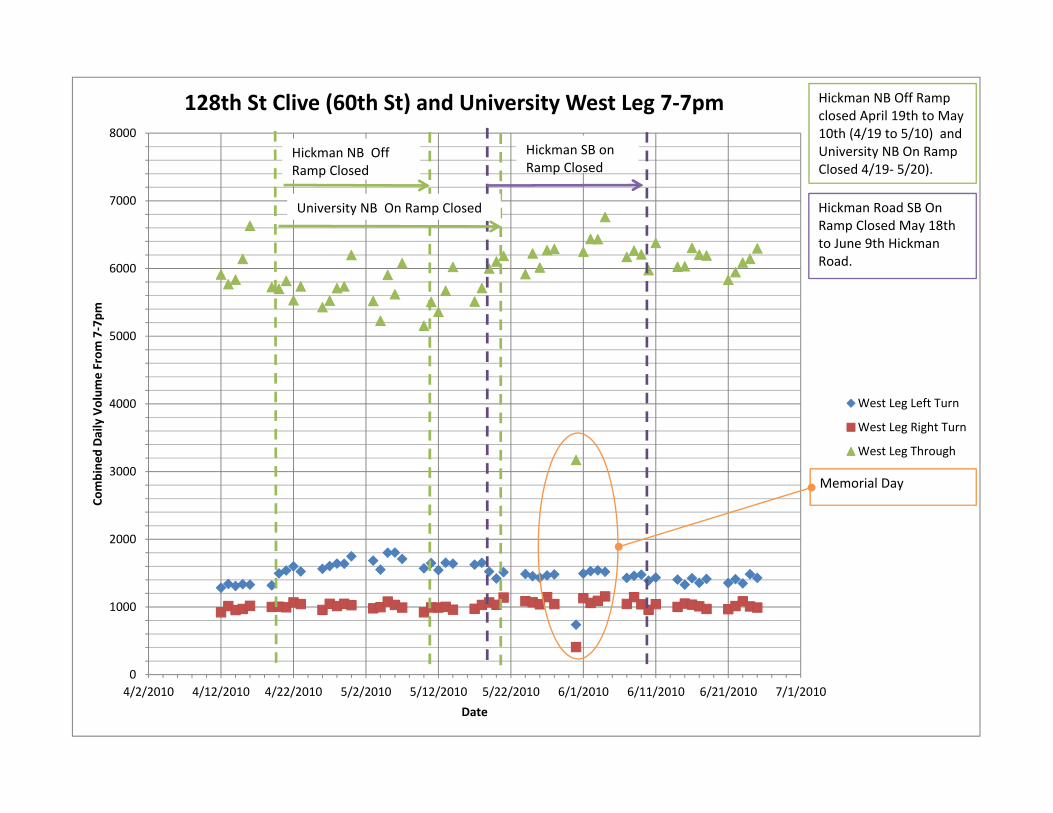
0
1000
2000
3000
4000
5000
6000
7000
8000
4/2/2010 4/12/2010 4/22/2010 5/2/2010 5/12/2010 5/22/2010 6/1/2010 6/11/2010 6/21/2010 7/1/2010
Combine
d Daily Volum
e From
7‐7pm
Date
128th St Clive (60th St) and University West Leg 7‐7pm
West Leg Left Turn
West Leg Right Turn
West Leg Through
Memorial Day
Hickman NB Off Ramp Closed
Hickman SB on Ramp Closed
`
University NB On Ramp Closed
Hickman NB Off Ramp closed April 19th to May 10th (4/19 to 5/10) and University NB On Ramp Closed 4/19‐ 5/20).
Hickman Road SB On Ramp Closed May 18th to June 9th Hickman Road.

123
B.2 Intersection Traffic-Volume Changes
50th Street and Corporate Wood Drive
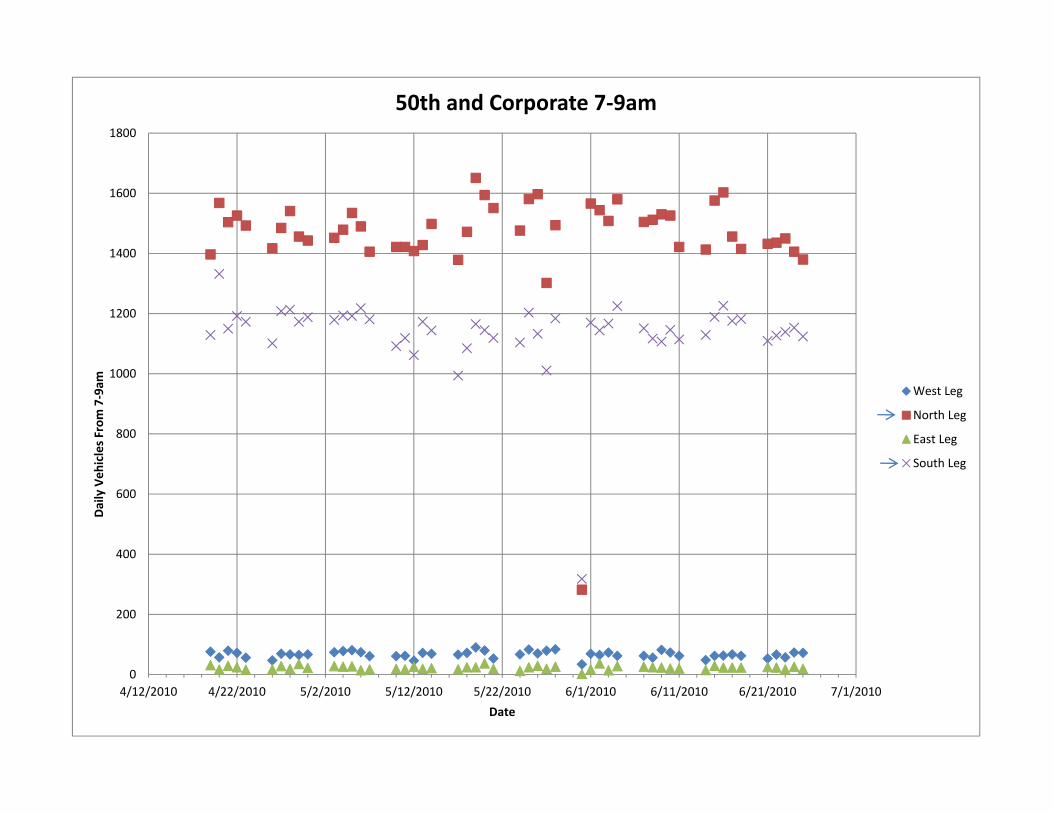
0
200
400
600
800
1000
1200
1400
1600
1800
4/12/2010 4/22/2010 5/2/2010 5/12/2010 5/22/2010 6/1/2010 6/11/2010 6/21/2010 7/1/2010
Daily Veh
icles F
rom 7‐9am
Date
50th and Corporate 7‐9am
West Leg
North Leg
East Leg
South Leg

0
200
400
600
800
1000
1200
4/2/2010 4/12/2010 4/22/2010 5/2/2010 5/12/2010 5/22/2010 6/1/2010 6/11/2010 6/21/2010 7/1/2010
Total V
olum
e from
7‐9am
Date
50th and Corporate East Leg Separated 7‐9am
Right Turn
Through
Left Turn
Hickman NB Off Ramp closed April 19th toMay 10th (4/19 to 5/10) and University NB On Ramp Closed 4/19‐ 5/20).
Hickman Road SB On Ramp Closed May 18th to June 9th Hickman Road.
University NB On Ramp Closed
Hickman NB Off Ramp Closed
Hickman SB on Ramp Closed

0
200
400
600
800
1000
1200
1400
1600
1800
4/2/2010 4/12/2010 4/22/2010 5/2/2010 5/12/2010 5/22/2010 6/1/2010 6/11/2010 6/21/2010 7/1/2010
Total V
olum
e from
7‐9am
Date
50th and Corporate North Leg Separated 7‐9am
Right Turn
Through
Left Turn
Hickman NB Off Ramp closed April 19th toMay 10th (4/19 to 5/10) and University NB On Ramp Closed 4/19‐ 5/20).
Hickman Road SB On Ramp Closed May 18th to June 9th Hickman Road.
University NB On Ramp Closed
Hickman NB Off Ramp Closed
Hickman SB on Ramp Closed

0
200
400
600
800
1000
1200
1400
4/2/2010 4/12/2010 4/22/2010 5/2/2010 5/12/2010 5/22/2010 6/1/2010 6/11/2010 6/21/2010 7/1/2010
Total V
olum
e from
7‐9am
Date
50th and Corporate South Leg Separated 7‐9am
Right Turn
Through
Left Turn
Hickman NB Off Ramp closed April 19th toMay 10th (4/19 to 5/10) and University NB On Ramp Closed 4/19‐ 5/20).
Hickman Road SB On Ramp Closed May 18th to June 9th Hickman Road.
University NB On Ramp Closed
Hickman NB Off Ramp Closed
Hickman SB on Ramp Closed

0
10
20
30
40
50
60
70
4/2/2010 4/12/2010 4/22/2010 5/2/2010 5/12/2010 5/22/2010 6/1/2010 6/11/2010 6/21/2010 7/1/2010
Total V
olum
e from
7‐9am
Date
50th and Corporate West Leg Separated 7‐9am
Right Turn
Through
Left Turn
Hickman NB Off Ramp closed April 19th toMay 10th (4/19 to 5/10) and University NB On Ramp Closed 4/19‐ 5/20).
Hickman Road SB On Ramp Closed May 18th to June 9th Hickman Road.
University NB On Ramp Closed
Hickman NB Off Ramp Closed
Hickman SB on Ramp Closed

0
200
400
600
800
1000
1200
1400
1600
1800
2000
4/12/2010 4/22/2010 5/2/2010 5/12/2010 5/22/2010 6/1/2010 6/11/2010 6/21/2010 7/1/2010
Daily Veh
icles F
rom 4‐6pm
Date
50th and Corporate 4‐6pm
West Leg
North Leg
East Leg
South Leg
Hickman NB Off Ramp closed April 19th toMay 10th (4/19 to 5/10) and University NB On Ramp Closed 4/19‐ 5/20).
Hickman Road SB On Ramp Closed May 18th to June 9th Hickman Road.
University NB On Ramp Closed
Hickman NB Off Ramp Closed
Hickman SB on Ramp Closed
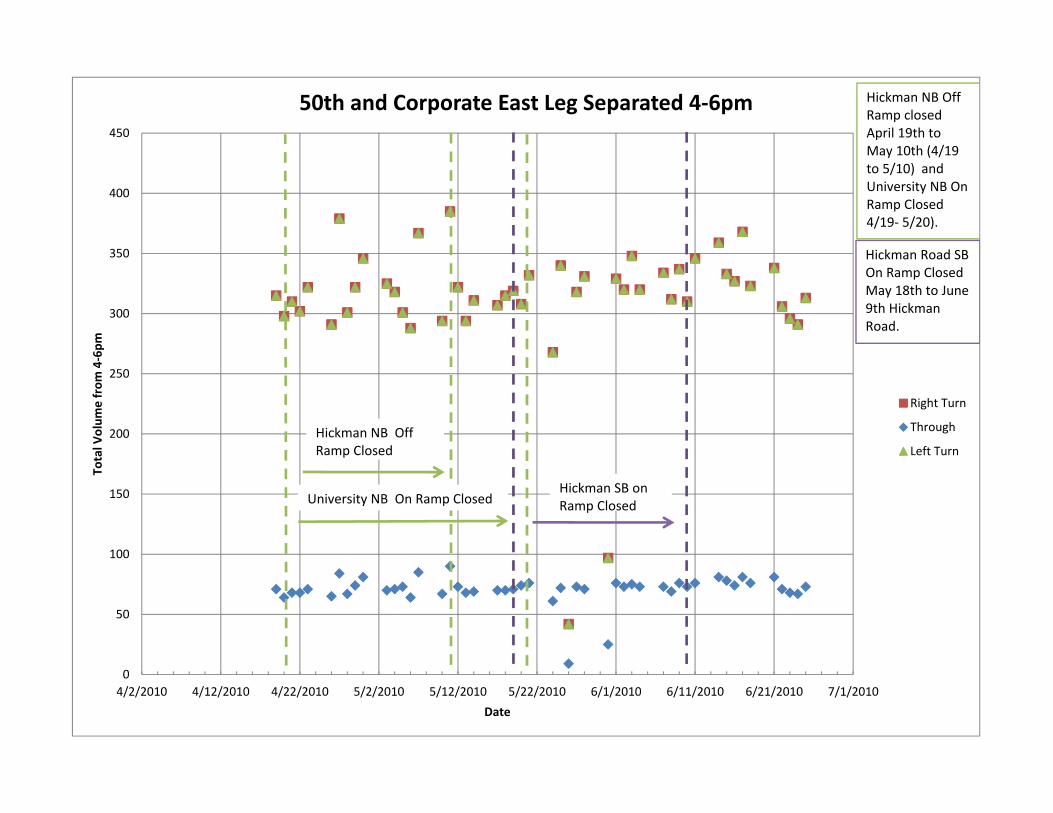
0
50
100
150
200
250
300
350
400
450
4/2/2010 4/12/2010 4/22/2010 5/2/2010 5/12/2010 5/22/2010 6/1/2010 6/11/2010 6/21/2010 7/1/2010
Total V
olum
e from
4‐6pm
Date
50th and Corporate East Leg Separated 4‐6pm
Right Turn
Through
Left Turn
Hickman NB Off Ramp closed April 19th toMay 10th (4/19 to 5/10) and University NB On Ramp Closed 4/19‐ 5/20).
Hickman Road SB On Ramp Closed May 18th to June 9th Hickman Road.
University NB On Ramp Closed
Hickman NB Off Ramp Closed
Hickman SB on Ramp Closed
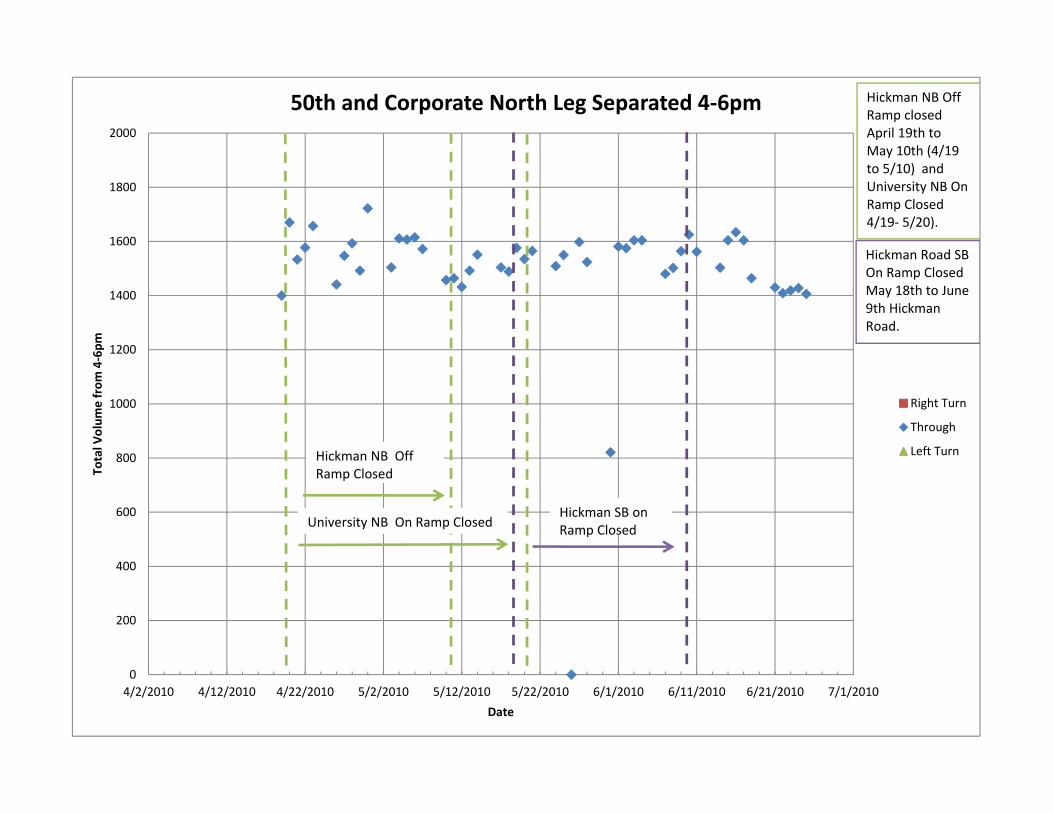
0
200
400
600
800
1000
1200
1400
1600
1800
2000
4/2/2010 4/12/2010 4/22/2010 5/2/2010 5/12/2010 5/22/2010 6/1/2010 6/11/2010 6/21/2010 7/1/2010
Total V
olum
e from
4‐6pm
Date
50th and Corporate North Leg Separated 4‐6pm
Right Turn
Through
Left Turn
Hickman NB Off Ramp closed April 19th toMay 10th (4/19 to 5/10) and University NB On Ramp Closed 4/19‐ 5/20).
Hickman Road SB On Ramp Closed May 18th to June 9th Hickman Road.
University NB On Ramp Closed
Hickman NB Off Ramp Closed
Hickman SB on Ramp Closed

0
200
400
600
800
1000
1200
1400
1600
4/2/2010 4/12/2010 4/22/2010 5/2/2010 5/12/2010 5/22/2010 6/1/2010 6/11/2010 6/21/2010 7/1/2010
Total V
olum
e from
4‐6pm
Date
50th and Corporate South Leg Separated 4‐6pm
Right Turn
Through
Left Turn
Hickman NB Off Ramp closed April 19th toMay 10th (4/19 to 5/10) and University NB On Ramp Closed 4/19‐ 5/20).
Hickman Road SB On Ramp Closed May 18th to June 9th Hickman Road.
University NB On Ramp Closed
Hickman NB Off Ramp Closed
Hickman SB on Ramp Closed

0
20
40
60
80
100
120
140
160
4/2/2010 4/12/2010 4/22/2010 5/2/2010 5/12/2010 5/22/2010 6/1/2010 6/11/2010 6/21/2010 7/1/2010
Total V
olum
e from
4‐6pm
Date
50th and Corporate West Leg Separated 4‐6pm
Right Turn
Through
Left Turn
Hickman NB Off Ramp closed April 19th toMay 10th (4/19 to 5/10) and University NB On Ramp Closed 4/19‐ 5/20).
Hickman Road SB On Ramp Closed May 18th to June 9th Hickman Road.
University NB On Ramp Closed
Hickman NB Off Ramp Closed
Hickman SB on Ramp Closed

0
1000
2000
3000
4000
5000
6000
7000
8000
9000
10000
4/12/2010 4/22/2010 5/2/2010 5/12/2010 5/22/2010 6/1/2010 6/11/2010 6/21/2010 7/1/2010
Daily Veh
icles F
rom 7am
‐7pm
Date
50th and Corporate 7‐7pm
West Leg
North Leg
East Leg
South Leg

0
50
100
150
200
250
300
350
400
450
4/2/2010 4/12/2010 4/22/2010 5/2/2010 5/12/2010 5/22/2010 6/1/2010 6/11/2010 6/21/2010 7/1/2010
Total V
olum
e from
7‐7pm
Date
50th and Corporate East Leg Separated 7‐7pm
Right Turn
Through
Left Turn
Hickman NB Off Ramp closed April 19th toMay 10th (4/19 to 5/10) and University NB On Ramp Closed 4/19‐ 5/20).
Hickman Road SB On Ramp Closed May 18th to June 9th Hickman Road.
University NB On Ramp Closed
Hickman NB Off Ramp Closed
Hickman SB on Ramp Closed

6000
6500
7000
7500
8000
8500
9000
9500
4/2/2010 4/12/2010 4/22/2010 5/2/2010 5/12/2010 5/22/2010 6/1/2010 6/11/2010 6/21/2010 7/1/2010
Total V
olum
e from
7‐7pm
Date
50th and Corporate North Leg Separated 7‐7pm
Right Turn
Through
Left Turn
Hickman NB Off Ramp closed April 19th toMay 10th (4/19 to 5/10) and University NB On Ramp Closed 4/19‐ 5/20).
Hickman Road SB On Ramp Closed May 18th to June 9th Hickman Road.
University NB On Ramp Closed
Hickman NB Off Ramp Closed
Hickman SB on Ramp Closed

0
1000
2000
3000
4000
5000
6000
7000
8000
4/2/2010 4/12/2010 4/22/2010 5/2/2010 5/12/2010 5/22/2010 6/1/2010 6/11/2010 6/21/2010 7/1/2010
Total V
olum
e from
7‐7pm
Date
50th and Corporate South Leg Separated 7‐7pm
Right Turn
Through
Left Turn
Hickman NB Off Ramp closed April 19th toMay 10th (4/19 to 5/10) and University NB On Ramp Closed 4/19‐ 5/20).
Hickman Road SB On Ramp Closed May 18th to June 9th Hickman Road.
University NB On Ramp Closed
Hickman NB Off Ramp Closed
Hickman SB on Ramp Closed
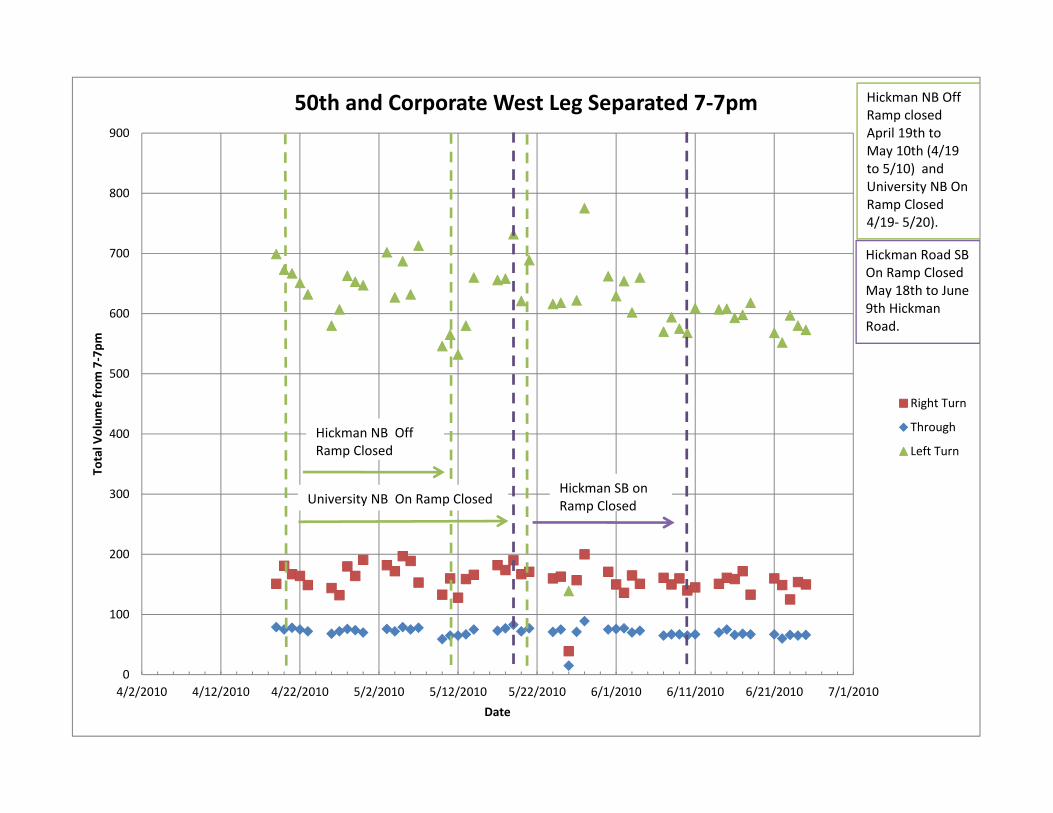
0
100
200
300
400
500
600
700
800
900
4/2/2010 4/12/2010 4/22/2010 5/2/2010 5/12/2010 5/22/2010 6/1/2010 6/11/2010 6/21/2010 7/1/2010
Total V
olum
e from
7‐7pm
Date
50th and Corporate West Leg Separated 7‐7pm
Right Turn
Through
Left Turn
Hickman NB Off Ramp closed April 19th toMay 10th (4/19 to 5/10) and University NB On Ramp Closed 4/19‐ 5/20).
Hickman Road SB On Ramp Closed May 18th to June 9th Hickman Road.
University NB On Ramp Closed
Hickman NB Off Ramp Closed
Hickman SB on Ramp Closed

139
B.2 Intersection Traffic-Volume Changes
47th Street and University Avenue

0
200
400
600
800
1000
1200
1400
1600
4/2/2010 4/12/2010 4/22/2010 5/2/2010 5/12/2010 5/22/2010 6/1/2010 6/11/2010 6/21/2010 7/1/2010
Total V
ehicels 7
‐9am
Date
47th and University Different Legs 7‐9am
East Leg
North Leg
South Leg
West Leg

0
100
200
300
400
500
600
700
800
900
1000
4/2/2010 4/12/2010 4/22/2010 5/2/2010 5/12/2010 5/22/2010 6/1/2010 6/11/2010 6/21/2010 7/1/2010
Daily volum
es 7‐9am
Date
47th and University East Leg Separated 7‐9am
East Leg Left Turn
East Leg Right Turn
East Leg ThroughMemorial Day
Hickman NB Off Ramp closed April 19th to May 10th (4/19 to 5/10) and University NB On Ramp Closed 4/19‐ 5/20).
Hickman SB on Ramp Closed
Hickman Road SB On Ramp Closed May 18th to June 9th Hickman Road.
University NB On Ramp Closed
Hickman NB Off Ramp Closed

0
200
400
600
800
1000
1200
1400
1600
4/2/2010 4/12/2010 4/22/2010 5/2/2010 5/12/2010 5/22/2010 6/1/2010 6/11/2010 6/21/2010 7/1/2010
DAily volum
es 7‐9am
Date
47th and University West Leg Separated 7‐9am
West Leg Left Turn
West Leg Right Turn
West Leg ThroughMemorial Day
Hickman NB Off Ramp closed April 19th to May 10th (4/19 to 5/10) and University NB On Ramp Closed 4/19‐ 5/20).
Hickman SB on Ramp Closed
Hickman Road SB On Ramp Closed May 18th to June 9th Hickman Road.
University NB On Ramp Closed
Hickman NB Off Ramp Closed
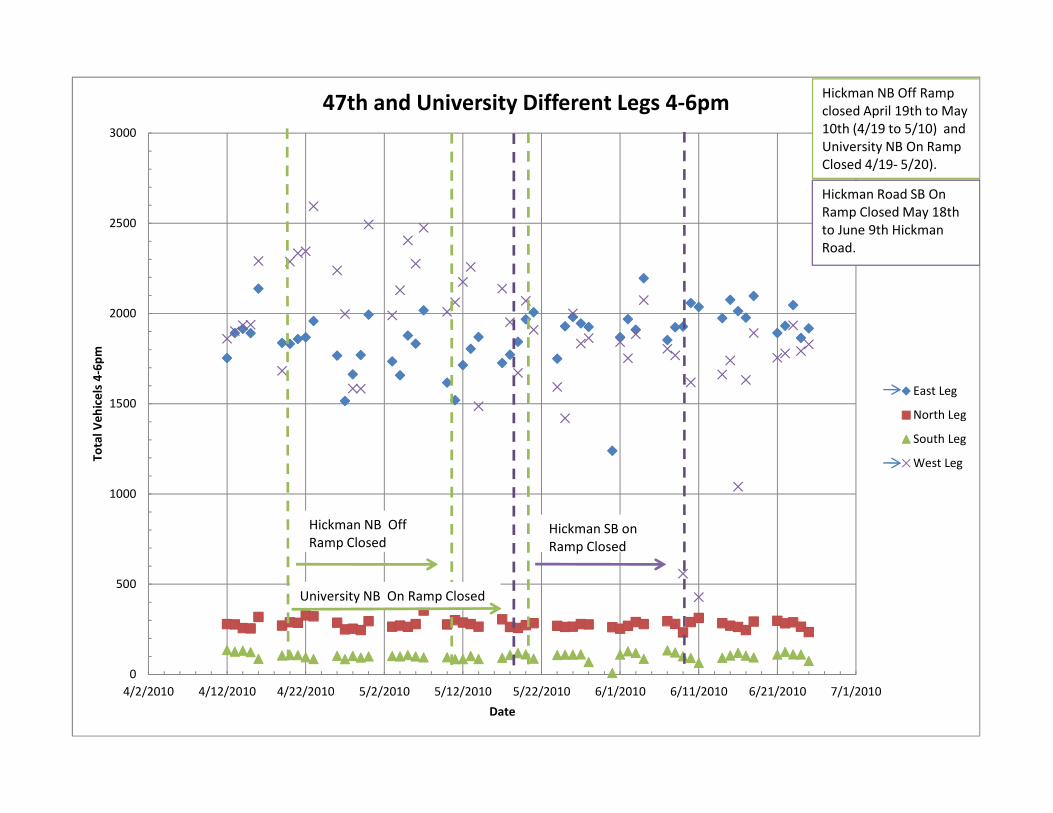
0
500
1000
1500
2000
2500
3000
4/2/2010 4/12/2010 4/22/2010 5/2/2010 5/12/2010 5/22/2010 6/1/2010 6/11/2010 6/21/2010 7/1/2010
Total V
ehicels 4‐6p
m
Date
47th and University Different Legs 4‐6pm
East Leg
North Leg
South Leg
West Leg
Hickman NB Off Ramp closed April 19th to May 10th (4/19 to 5/10) and University NB On Ramp Closed 4/19‐ 5/20).
Hickman SB on Ramp Closed
Hickman Road SB On Ramp Closed May 18th to June 9th Hickman Road.
University NB On Ramp Closed
Hickman NB Off Ramp Closed

0
1000
2000
3000
4/2/2010 4/12/2010 4/22/2010 5/2/2010 5/12/2010 5/22/2010 6/1/2010 6/11/2010 6/21/2010 7/1/2010
Daily volum
es 4‐6pm
Date
47th and University East Leg 4‐6pm
East Leg Left Turn
East Leg Right Turn
East Leg ThroughMemorial Day
Hickman NB Off Ramp closed April 19th to May 10th (4/19 to 5/10) and University NB On Ramp Closed 4/19‐ 5/20).
Hickman SB on Ramp Closed
Hickman Road SB On Ramp Closed May 18th to June 9th Hickman Road.
University NB On Ramp Closed
Hickman NB Off Ramp Closed

0
1000
2000
3000
4000
5000
6000
7000
8000
9000
10000
11000
12000
4/2/2010 4/12/2010 4/22/2010 5/2/2010 5/12/2010 5/22/2010 6/1/2010 6/11/2010 6/21/2010 7/1/2010
DAily volum
es 4‐6pm
Date
47th and University West Leg 4‐6pm
West Leg Left Turn
West Leg Right Turn
West Leg ThroughMemorial Day
Hickman NB Off Ramp closed April 19th to May 10th (4/19 to 5/10) and University NB On Ramp Closed 4/19‐ 5/20).
Hickman SB on Ramp Closed
Hickman Road SB On Ramp Closed May 18th to June 9th Hickman Road.
University NB On Ramp Closed
Hickman NB Off Ramp Closed

0
2000
4000
6000
8000
10000
12000
14000
16000
4/2/2010 4/12/2010 4/22/2010 5/2/2010 5/12/2010 5/22/2010 6/1/2010 6/11/2010 6/21/2010 7/1/2010
Total V
ehicels 7
‐7pm
Date
47th and University Different Legs 7‐7pm
East Leg
North Leg
South Leg
West Leg

0
1000
2000
3000
4000
5000
6000
7000
8000
9000
10000
11000
4/2/2010 4/12/2010 4/22/2010 5/2/2010 5/12/2010 5/22/2010 6/1/2010 6/11/2010 6/21/2010 7/1/2010
Daily volum
es 7‐7pm
Date
47th and University East Leg 7‐7pm
East Leg Left Turn
East Leg Right Turn
East Leg ThroughMemorial Day
Hickman NB Off Ramp closed April 19th to May 10th (4/19 to 5/10) and University NB On Ramp Closed 4/19‐ 5/20).
Hickman SB on Ramp Closed
Hickman Road SB On Ramp Closed May 18th to June 9th Hickman Road.
University NB On Ramp Closed
Hickman NB Off Ramp Closed

0
1000
2000
3000
4000
5000
6000
7000
8000
9000
10000
11000
12000
4/2/2010 4/12/2010 4/22/2010 5/2/2010 5/12/2010 5/22/2010 6/1/2010 6/11/2010 6/21/2010 7/1/2010
DAily volum
es 7‐7pm
Date
47th and University West Leg 7‐7pm
West Leg Left Turn
West Leg Right Turn
West Leg ThroughMemorial Day
Hickman NB Off Ramp closed April 19th to May 10th (4/19 to 5/10) and University NB On Ramp Closed 4/19‐ 5/20).
Hickman SB on Ramp Closed
Hickman Road SB On Ramp Closed May 18th to June 9th Hickman Road.
University NB On Ramp Closed
Hickman NB Off Ramp Closed

149
B.2 Intersection Traffic-Volume Changes
35th Street or Valley West Road and University Avenue

0
500
1000
1500
2000
2500
3000
4/2/2010 4/12/2010 4/22/2010 5/2/2010 5/12/2010 5/22/2010 6/1/2010 6/11/2010 6/21/2010 7/1/2010
Total V
ehicles from 7‐9am
Date
University and Valley West 7‐9am Volumes
West Leg
South leg
North Leg
East Leg
Memorial Day
Hickman NB Off Ramp closed April 19th toMay 10th (4/19 to 5/10) and University NB On Ramp Closed 4/19‐ 5/20).
Hickman Road SB On Ramp Closed May 18th to June 9th Hickman Road.
University NB On Ramp Closed
Hickman NB Off Ramp Closed
Hickman SB on Ramp Closed

0
200
400
600
800
1000
1200
4/2/2010 4/12/2010 4/22/2010 5/2/2010 5/12/2010 5/22/2010 6/1/2010 6/11/2010 6/21/2010 7/1/2010
Total V
olum
e from
7‐9am
Date
University and Valley West East Leg Separated 7‐9am
Right Turn
Through
Left Turn
Memorial Day
Hickman NB Off Ramp closed April 19th toMay 10th (4/19 to 5/10) and University NB On Ramp Closed 4/19‐ 5/20).
Hickman Road SB On Ramp Closed May 18th to June 9th Hickman Road.
University NB On Ramp Closed
Hickman NB Off Ramp Closed
Hickman SB on Ramp Closed

0
200
400
600
800
1000
1200
4/2/2010 4/12/2010 4/22/2010 5/2/2010 5/12/2010 5/22/2010 6/1/2010 6/11/2010 6/21/2010 7/1/2010
Total V
olum
e from
7‐9am
Date
University and Valley West North Leg Separated 7‐9am
Right Turn
Through
Left Turn
Memorial Day
Hickman NB Off Ramp closed April 19th toMay 10th (4/19 to 5/10) and University NB On Ramp Closed 4/19‐ 5/20).
Hickman Road SB On Ramp Closed May 18th to June 9th Hickman Road.
University NB On Ramp Closed
Hickman NB Off Ramp Closed
Hickman SB on Ramp Closed
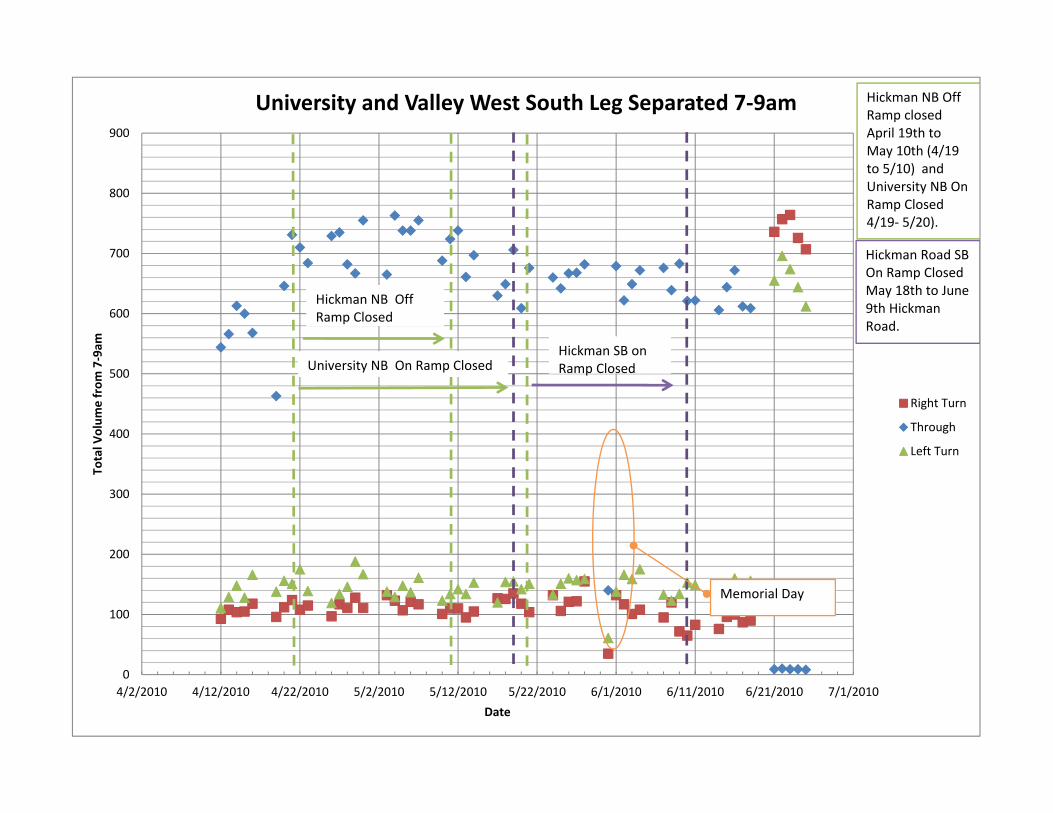
0
100
200
300
400
500
600
700
800
900
4/2/2010 4/12/2010 4/22/2010 5/2/2010 5/12/2010 5/22/2010 6/1/2010 6/11/2010 6/21/2010 7/1/2010
Total V
olum
e from
7‐9am
Date
University and Valley West South Leg Separated 7‐9am
Right Turn
Through
Left Turn
Memorial Day
Hickman NB Off Ramp closed April 19th toMay 10th (4/19 to 5/10) and University NB On Ramp Closed 4/19‐ 5/20).
Hickman Road SB On Ramp Closed May 18th to June 9th Hickman Road.
University NB On Ramp Closed
Hickman NB Off Ramp Closed
Hickman SB on Ramp Closed

0
200
400
600
800
1000
1200
1400
1600
1800
2000
4/2/2010 4/12/2010 4/22/2010 5/2/2010 5/12/2010 5/22/2010 6/1/2010 6/11/2010 6/21/2010 7/1/2010
Total V
olum
e from
7‐9am
Date
University and Valley West, West Leg Separated 7‐9am
Right Turn
Through
Left Turn
Memorial Day
Hickman NB Off Ramp closed April 19th toMay 10th (4/19 to 5/10) and University NB On Ramp Closed 4/19‐ 5/20).
Hickman Road SB On Ramp Closed May 18th to June 9th Hickman Road.
University NB On Ramp Closed
Hickman NB Off Ramp Closed
Hickman SB on Ramp Closed

1400
1600
1800
2000
2200
2400
4/2/2010 4/12/2010 4/22/2010 5/2/2010 5/12/2010 5/22/2010 6/1/2010 6/11/2010 6/21/2010 7/1/2010
Total V
ehicles from
4‐6pm
Date
University and Valley West 4‐6pm Volumes
West Leg
South leg
North Leg
East Leg
Memorial Day
Hickman NB Off Ramp closed April 19th toMay 10th (4/19 to 5/10) and University NB On Ramp Closed 4/19‐ 5/20).
Hickman Road SB On Ramp Closed May 18th to June 9th Hickman Road.
University NB On Ramp Closed
Hickman NB Off Ramp Closed
Hickman SB on Ramp Closed
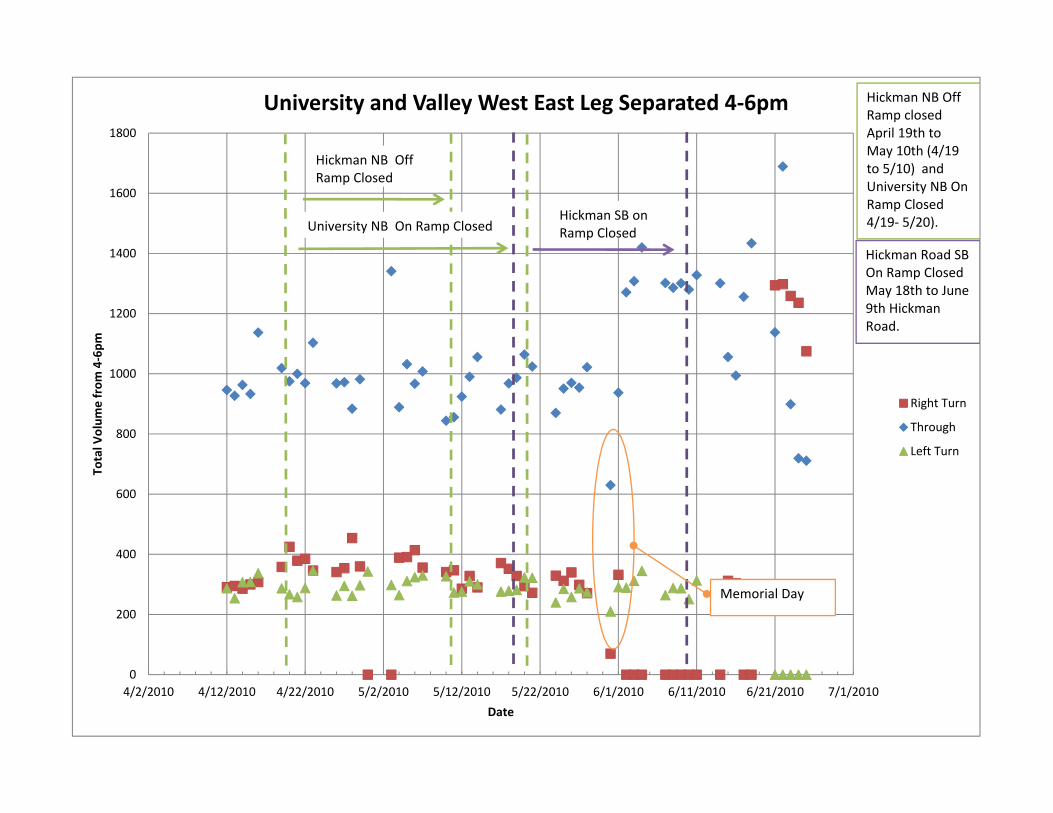
0
200
400
600
800
1000
1200
1400
1600
1800
4/2/2010 4/12/2010 4/22/2010 5/2/2010 5/12/2010 5/22/2010 6/1/2010 6/11/2010 6/21/2010 7/1/2010
Total V
olum
e from
4‐6pm
Date
University and Valley West East Leg Separated 4‐6pm
Right Turn
Through
Left Turn
Memorial Day
Hickman NB Off Ramp closed April 19th toMay 10th (4/19 to 5/10) and University NB On Ramp Closed 4/19‐ 5/20).
Hickman Road SB On Ramp Closed May 18th to June 9th Hickman Road.
University NB On Ramp Closed
Hickman NB Off Ramp Closed
Hickman SB on Ramp Closed

0
200
400
600
800
1000
1200
1400
1600
4/2/2010 4/12/2010 4/22/2010 5/2/2010 5/12/2010 5/22/2010 6/1/2010 6/11/2010 6/21/2010 7/1/2010
Total V
olum
e from
4‐6pm
Date
University and Valley West North Leg Separated 4‐6pm
Right Turn
Through
Left Turn
Memorial Day
Hickman NB Off Ramp closed April 19th toMay 10th (4/19 to 5/10) and University NB On Ramp Closed 4/19‐ 5/20).
Hickman Road SB On Ramp Closed May 18th to June 9th Hickman Road.
University NB On Ramp Closed
Hickman NB Off Ramp Closed
Hickman SB on Ramp Closed

0
200
400
600
800
1000
1200
1400
4/2/2010 4/12/2010 4/22/2010 5/2/2010 5/12/2010 5/22/2010 6/1/2010 6/11/2010 6/21/2010 7/1/2010
Total V
olum
e from
4‐6pm
Date
University and Valley West South Leg Separated 4‐6pm
Right Turn
Through
Left Turn
Memorial Day
Hickman NB Off Ramp closed April 19th toMay 10th (4/19 to 5/10) and University NB On Ramp Closed 4/19‐ 5/20).
Hickman Road SB On Ramp Closed May 18th to June 9th Hickman Road.
University NB On Ramp Closed
Hickman NB Off Ramp Closed
Hickman SB on Ramp Closed

0
200
400
600
800
1000
1200
1400
1600
4/2/2010 4/12/2010 4/22/2010 5/2/2010 5/12/2010 5/22/2010 6/1/2010 6/11/2010 6/21/2010 7/1/2010
Total V
olum
e from
4‐6pm
Date
University and Valley West, West Leg Separated 4‐6pm
Right Turn
Through
Left Turn
Memorial Day
Hickman NB Off Ramp closed April 19th toMay 10th (4/19 to 5/10) and University NB On Ramp Closed 4/19‐ 5/20).
Hickman Road SB On Ramp Closed May 18th to June 9th Hickman Road.
University NB On Ramp Closed
Hickman NB Off Ramp Closed
Hickman SB on Ramp Closed

4000
5000
6000
7000
8000
9000
10000
11000
12000
13000
14000
4/2/2010 4/12/2010 4/22/2010 5/2/2010 5/12/2010 5/22/2010 6/1/2010 6/11/2010 6/21/2010 7/1/2010
Total V
ehicles from 7‐7pm
Date
University and Valley West All Legs 7‐7pm Volumes
West Leg
South leg
North Leg
East Leg
Memorial Day
Hickman NB Off Ramp closed April 19th toMay 10th (4/19 to 5/10) and University NB On Ramp Closed 4/19‐ 5/20).
Hickman Road SB On Ramp Closed May 18th to June 9th Hickman Road.
University NB On Ramp Closed
Hickman NB Off Ramp Closed
Hickman SB on Ramp Closed

0
1000
2000
3000
4000
5000
6000
7000
8000
9000
4/2/2010 4/12/2010 4/22/2010 5/2/2010 5/12/2010 5/22/2010 6/1/2010 6/11/2010 6/21/2010 7/1/2010
Total V
olum
e from
7‐7pm
Date
University and Valley West East Leg Separated 7‐7pm
Right Turn
Through
Left Turn
Memorial Day
Hickman NB Off Ramp closed April 19th toMay 10th (4/19 to 5/10) and University NB On Ramp Closed 4/19‐ 5/20).
Hickman Road SB On Ramp Closed May 18th to June 9th Hickman Road.
University NB On Ramp Closed
Hickman NB Off Ramp Closed
Hickman SB on Ramp Closed

0
1000
2000
3000
4000
5000
6000
7000
8000
4/2/2010 4/12/2010 4/22/2010 5/2/2010 5/12/2010 5/22/2010 6/1/2010 6/11/2010 6/21/2010 7/1/2010
Total V
olum
e from
7‐7pm
Date
University and Valley West, North Leg Separated 7‐7pm
Right Turn
Through
Left Turn
Memorial Day
Hickman NB Off Ramp closed April 19th toMay 10th (4/19 to 5/10) and University NB On Ramp Closed 4/19‐ 5/20).
Hickman Road SB On Ramp Closed May 18th to June 9th Hickman Road.
University NB On Ramp Closed
Hickman NB Off Ramp Closed
Hickman SB on Ramp Closed

0
1000
2000
3000
4000
5000
6000
4/2/2010 4/12/2010 4/22/2010 5/2/2010 5/12/2010 5/22/2010 6/1/2010 6/11/2010 6/21/2010 7/1/2010
Total V
olum
e from
7‐7pm
Date
University and Valley West, South Leg Separated 7‐7pm
Right Turn
Through
Left Turn
Memorial Day
Hickman NB Off Ramp closed April 19th toMay 10th (4/19 to 5/10) and University NB On Ramp Closed 4/19‐ 5/20).
Hickman Road SB On Ramp Closed May 18th to June 9th Hickman Road.
University NB On Ramp Closed
Hickman NB Off Ramp Closed
Hickman SB on Ramp Closed

0
1000
2000
3000
4000
5000
6000
7000
8000
9000
4/2/2010 4/12/2010 4/22/2010 5/2/2010 5/12/2010 5/22/2010 6/1/2010 6/11/2010 6/21/2010 7/1/2010
Total V
olum
e from
7‐7pm
Date
University and Valley West, West Leg Separated 7‐7pm
Right Turn
Through
Left Turn
Memorial Day
Hickman NB Off Ramp closed April 19th toMay 10th (4/19 to 5/10) and University NB On Ramp Closed 4/19‐ 5/20).
Hickman Road SB On Ramp Closed May 18th to June 9th Hickman Road.
University NB On Ramp Closed
Hickman NB Off Ramp Closed
Hickman SB on Ramp Closed

165
B.2 Intersection Traffic-Volume Changes
22nd Street and University Avenue

0
200
400
600
800
1000
1200
1400
1600
1800
2000
4/2/2010 4/12/2010 4/22/2010 5/2/2010 5/12/2010 5/22/2010 6/1/2010 6/11/2010 6/21/2010 7/1/2010
Total V
ehicles from
7‐9am
Date
University and 22nd St. 7‐9am Volumes
West Leg
South leg
North Leg
East Leg
Memorial Day
Hickman NB Off Ramp closed April 19th toMay 10th (4/19 to 5/10) and University NB On Ramp Closed 4/19‐ 5/20).
Hickman Road SB On Ramp Closed May 18th to June 9th Hickman Road.
University NB On Ramp Closed
Hickman NB Off Ramp Closed
Hickman SB on Ramp Closed

0
1000
2000
3000
4000
5000
6000
7000
8000
4/2/2010 4/12/2010 4/22/2010 5/2/2010 5/12/2010 5/22/2010 6/1/2010 6/11/2010 6/21/2010 7/1/2010
Total V
olum
e from
7‐7pm
Date
University and 22nd St North Leg Separated 7‐7pm
Right Turn
Through
Left Turn
Memorial Day
Hickman NB Off Ramp closed April 19th toMay 10th (4/19 to 5/10) and University NB On Ramp Closed 4/19‐ 5/20).
Hickman Road SB On Ramp Closed May 18th to June 9th Hickman Road.
University NB On Ramp Closed
Hickman NB Off Ramp Closed
Hickman SB on Ramp Closed

0
500
1000
1500
2000
2500
3000
3500
4000
4500
4/2/2010 4/12/2010 4/22/2010 5/2/2010 5/12/2010 5/22/2010 6/1/2010 6/11/2010 6/21/2010 7/1/2010
Total V
olum
e from
7‐7pm
Date
University and 22nd St. South Leg Separated 7‐7pm
Right Turn
Through
Left Turn
Memorial Day
Hickman NB Off Ramp closed April 19th toMay 10th (4/19 to 5/10) and University NB On Ramp Closed 4/19‐ 5/20).
Hickman Road SB On Ramp Closed May 18th to June 9th Hickman Road.
University NB On Ramp Closed
Hickman NB Off Ramp Closed
Hickman SB on Ramp Closed

0
1000
2000
3000
4000
5000
6000
7000
4/2/2010 4/12/2010 4/22/2010 5/2/2010 5/12/2010 5/22/2010 6/1/2010 6/11/2010 6/21/2010 7/1/2010
Total V
olum
e from
7‐7pm
Date
University and 22nd St West Leg Separated 7‐7pm
Right Turn
Through
Left Turn
Memorial Day
Hickman NB Off Ramp closed April 19th toMay 10th (4/19 to 5/10) and University NB On Ramp Closed 4/19‐ 5/20).
Hickman Road SB On Ramp Closed May 18th to June 9th Hickman Road.
University NB On Ramp Closed
Hickman NB Off Ramp Closed
Hickman SB on Ramp Closed

0
200
400
600
800
1000
1200
1400
4/2/2010 4/12/2010 4/22/2010 5/2/2010 5/12/2010 5/22/2010 6/1/2010 6/11/2010 6/21/2010 7/1/2010
Total V
olum
e from
7‐9am
Date
University and 22nd St North Leg Separated 7‐9am
Right Turn
Through
Left Turn
Memorial Day
Hickman NB Off Ramp closed April 19th toMay 10th (4/19 to 5/10) and University NB On Ramp Closed 4/19‐ 5/20).
Hickman Road SB On Ramp Closed May 18th to June 9th Hickman Road.
University NB On Ramp Closed
Hickman NB Off Ramp Closed
Hickman SB on Ramp Closed

0
100
200
300
400
500
600
700
800
900
4/2/2010 4/12/2010 4/22/2010 5/2/2010 5/12/2010 5/22/2010 6/1/2010 6/11/2010 6/21/2010 7/1/2010
Total V
olum
e from
7‐9am
Date
University and 22nd St. South Leg Separated 7‐9am
Right Turn
Through
Left Turn
Memorial Day
Hickman NB Off Ramp closed April 19th toMay 10th (4/19 to 5/10) and University NB On Ramp Closed 4/19‐ 5/20).
Hickman Road SB On Ramp Closed May 18th to June 9th Hickman Road.
University NB On Ramp Closed
Hickman NB Off Ramp Closed
Hickman SB on Ramp Closed
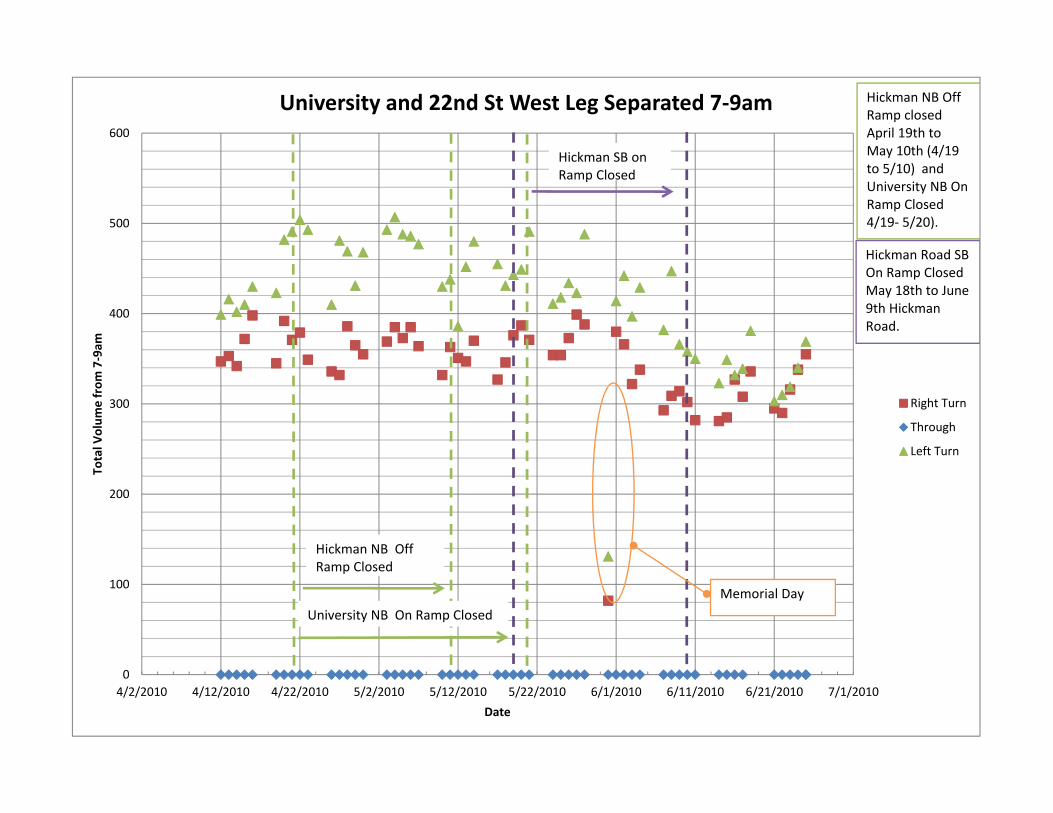
0
100
200
300
400
500
600
4/2/2010 4/12/2010 4/22/2010 5/2/2010 5/12/2010 5/22/2010 6/1/2010 6/11/2010 6/21/2010 7/1/2010
Total V
olum
e from
7‐9am
Date
University and 22nd St West Leg Separated 7‐9am
Right Turn
Through
Left Turn
Memorial Day
Hickman NB Off Ramp closed April 19th toMay 10th (4/19 to 5/10) and University NB On Ramp Closed 4/19‐ 5/20).
Hickman Road SB On Ramp Closed May 18th to June 9th Hickman Road.
University NB On Ramp Closed
Hickman NB Off Ramp Closed
Hickman SB on Ramp Closed

0
500
1000
1500
2000
2500
3000
4/2/2010 4/12/2010 4/22/2010 5/2/2010 5/12/2010 5/22/2010 6/1/2010 6/11/2010 6/21/2010 7/1/2010
Total V
ehicles from 4‐6pm
Date
University and 22nd St. 4‐6pm Volumes
West Leg
South leg
North Leg
East Leg
Memorial Day
Hickman NB Off Ramp closed April 19th toMay 10th (4/19 to 5/10) and University NB On Ramp Closed 4/19‐ 5/20).
Hickman Road SB On Ramp Closed May 18th to June 9th Hickman Road.
University NB On Ramp Closed
Hickman NB Off Ramp Closed
Hickman SB on Ramp Closed
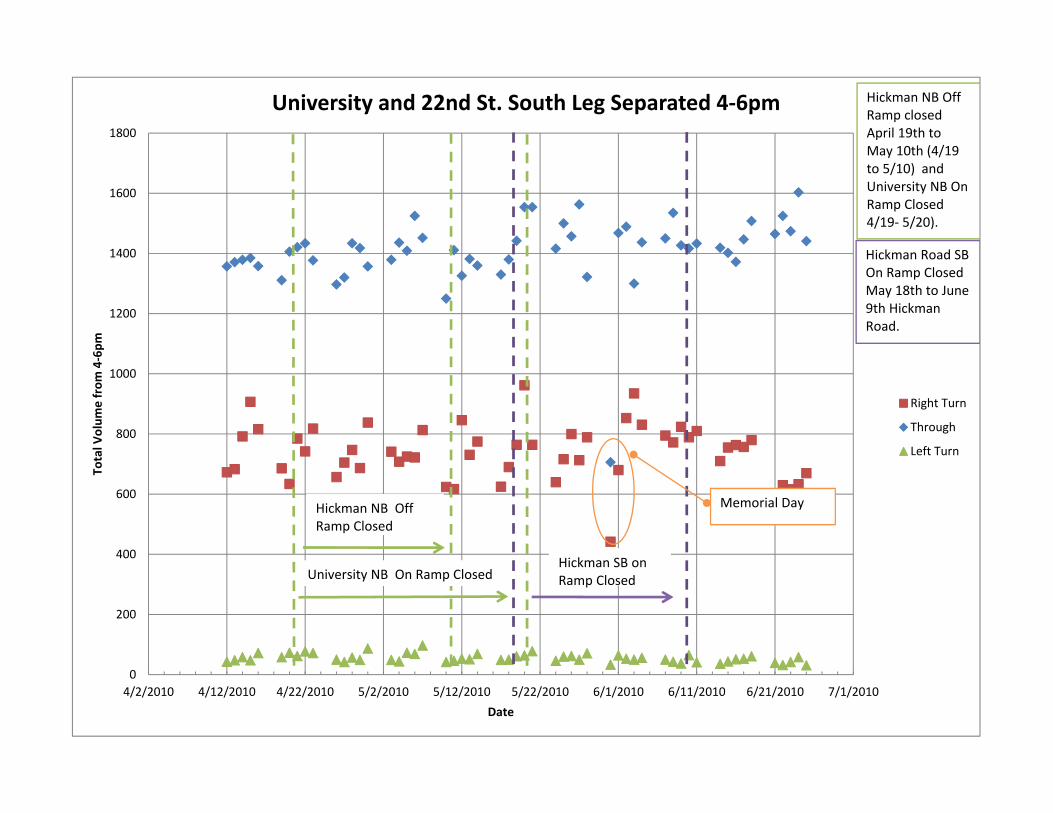
0
200
400
600
800
1000
1200
1400
1600
1800
4/2/2010 4/12/2010 4/22/2010 5/2/2010 5/12/2010 5/22/2010 6/1/2010 6/11/2010 6/21/2010 7/1/2010
Total V
olum
e from
4‐6pm
Date
University and 22nd St. South Leg Separated 4‐6pm
Right Turn
Through
Left Turn
Memorial Day
Hickman NB Off Ramp closed April 19th toMay 10th (4/19 to 5/10) and University NB On Ramp Closed 4/19‐ 5/20).
Hickman Road SB On Ramp Closed May 18th to June 9th Hickman Road.
University NB On Ramp Closed
Hickman NB Off Ramp Closed
Hickman SB on Ramp Closed

0
200
400
600
800
1000
1200
1400
4/2/2010 4/12/2010 4/22/2010 5/2/2010 5/12/2010 5/22/2010 6/1/2010 6/11/2010 6/21/2010 7/1/2010
Total V
olum
e from
4‐6pm
Date
University and 22nd St West Leg Separated 4‐6pm
Right Turn
Through
Left Turn
Memorial Day
Hickman NB Off Ramp closed April 19th toMay 10th (4/19 to 5/10) and University NB On Ramp Closed 4/19‐ 5/20).
Hickman Road SB On Ramp Closed May 18th to June 9th Hickman Road.
University NB On Ramp Closed
Hickman NB Off Ramp Closed
Hickman SB on Ramp Closed

0
2000
4000
6000
8000
10000
12000
14000
4/2/2010 4/12/2010 4/22/2010 5/2/2010 5/12/2010 5/22/2010 6/1/2010 6/11/2010 6/21/2010 7/1/2010
Total V
ehicles from 7‐7pm
Date
University and 22nd St. 7‐7pm Volumes
West Leg
South leg
North Leg
East Leg
Memorial Day
Hickman NB Off Ramp closed April 19th toMay 10th (4/19 to 5/10) and University NB On Ramp Closed 4/19‐ 5/20).
Hickman Road SB On Ramp Closed May 18th to June 9th Hickman Road.
University NB On Ramp Closed
Hickman NB Off Ramp Closed
Hickman SB on Ramp Closed

0
100
200
300
400
500
600
700
800
4/2/2010 4/12/2010 4/22/2010 5/2/2010 5/12/2010 5/22/2010 6/1/2010 6/11/2010 6/21/2010 7/1/2010
Total V
olum
e from
7‐7pm
Date
University and 22nd St. East Leg Separated 7‐7pm
Right Turn
Through
Left Turn
Memorial Day
Hickman NB Off Ramp closed April 19th toMay 10th (4/19 to 5/10) and University NB On Ramp Closed 4/19‐ 5/20).
Hickman Road SB On Ramp Closed May 18th to June 9th Hickman Road.
University NB On Ramp Closed
Hickman NB Off Ramp Closed
Hickman SB on Ramp Closed
Through and right turns are in a shared lane so the volumes are combined. With the low volumes present no real change in traffic patterns can be seen compared to the rest of the corridor.
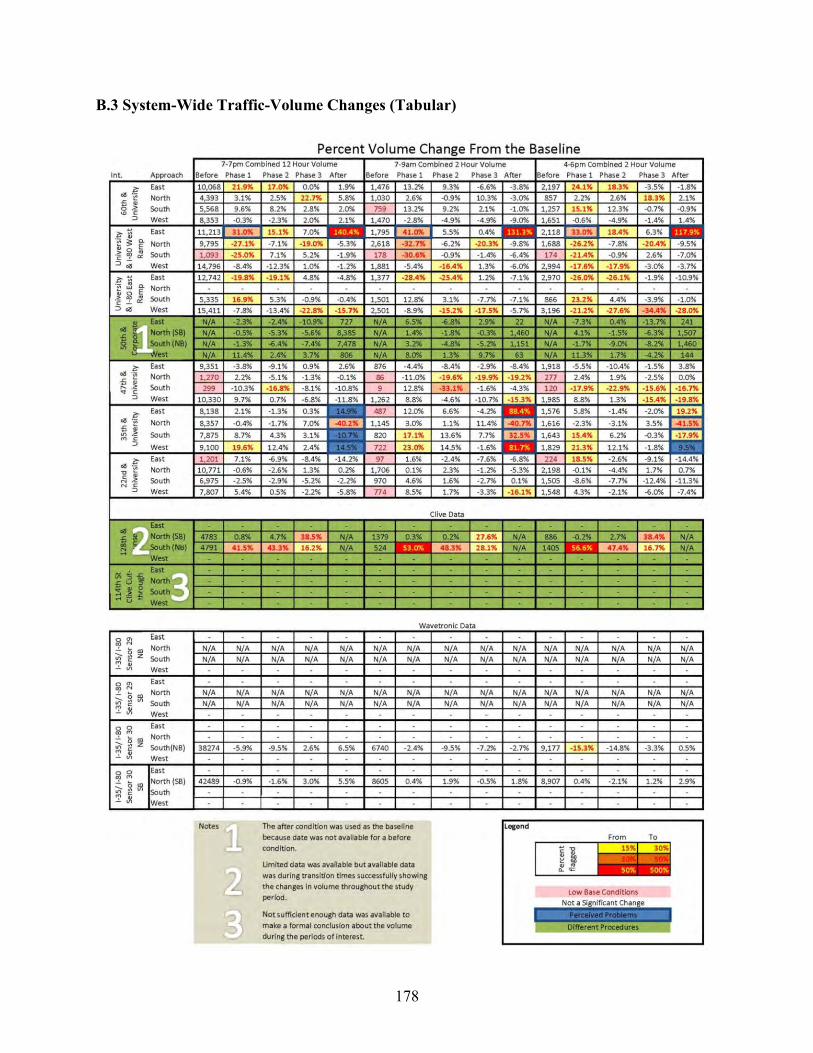
178
B.3 System-Wide Traffic-Volume Changes (Tabular)

179

180

181
B.4 System-Wide Traffic-Volume Changes (Maps)

182

183

184

185

186

187
B.5 City of Clive Traffic-Volume Changes
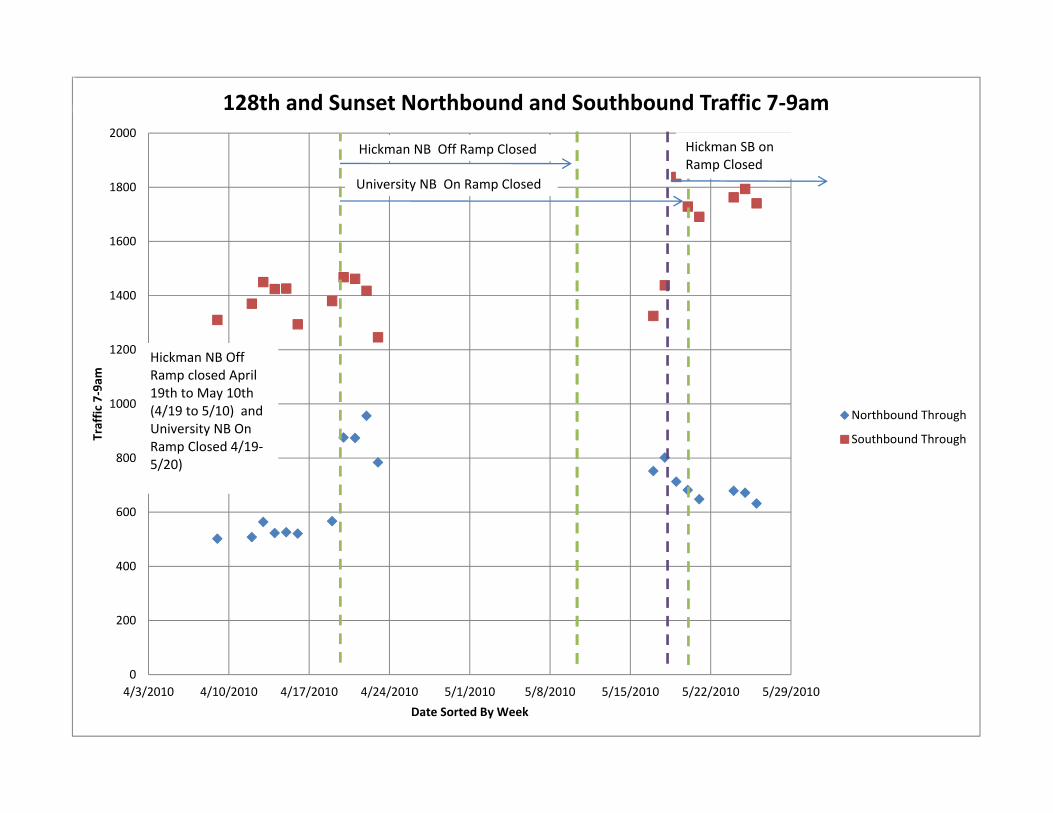
0
200
400
600
800
1000
1200
1400
1600
1800
2000
4/3/2010 4/10/2010 4/17/2010 4/24/2010 5/1/2010 5/8/2010 5/15/2010 5/22/2010 5/29/2010
Traffic
7‐9am
Date Sorted By Week
128th and Sunset Northbound and Southbound Traffic 7‐9am
Northbound Through
Southbound Through
Hickman NB Off Ramp closed April 19th to May 10th (4/19 to 5/10) and University NB On Ramp Closed 4/19‐5/20)
Hickman NB Off Ramp Closed
Hickman NB Off RampHickman NB Off RampUniversity NB On Ramp Closed
Hickman SB on Ramp Closed

0
500
1000
1500
2000
2500
3000
4/3/2010 4/10/2010 4/17/2010 4/24/2010 5/1/2010 5/8/2010 5/15/2010 5/22/2010 5/29/2010
4‐6p
m Total Traffic
Date Sorted By Week
128th and Sunset Northbound and Southbound Traffic 4‐6pm
Northbound Through
Southbound Through
Hickman NB Off Ramp closed April 19th to May 10th (4/19 to 5/10) and University NB On Ramp Closed 4/19‐5/20)
Hickman NB Off Ramp Closed
Hickman NB Off RampHickman NB Off RampUniversity NB On Ramp Closed
Hickman SB on Ramp Closed
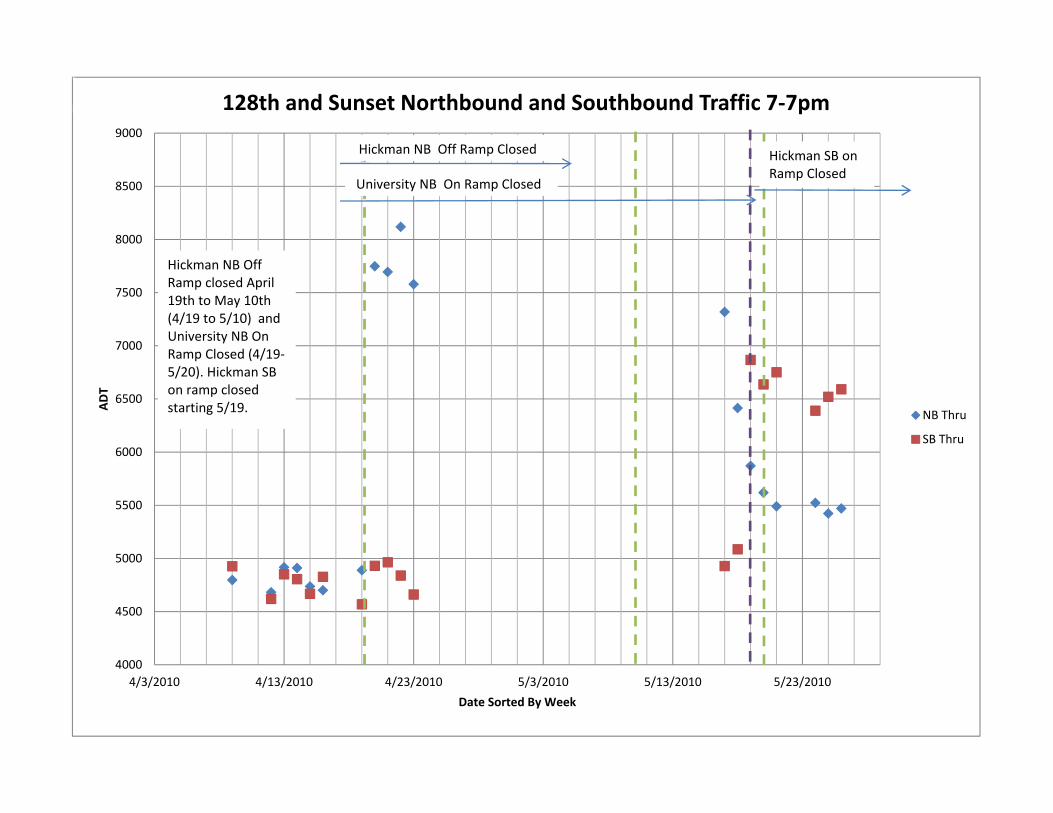
4000
4500
5000
5500
6000
6500
7000
7500
8000
8500
9000
4/3/2010 4/13/2010 4/23/2010 5/3/2010 5/13/2010 5/23/2010
ADT
Date Sorted By Week
128th and Sunset Northbound and Southbound Traffic 7‐7pm
NB Thru
SB Thru
Hickman NB Off Ramp closed April 19th to May 10th (4/19 to 5/10) and University NB On Ramp Closed (4/19‐5/20). Hickman SB on ramp closed starting 5/19.
Hickman NB Off Ramp Closed
Hickman NB Off RampHickman NB Off RampUniversity NB On Ramp Closed
Hickman SB on Ramp Closed

4000
5000
6000
7000
8000
9000
10000
11000
4/3/2010 4/10/2010 4/17/2010 4/24/2010 5/1/2010 5/8/2010 5/15/2010 5/22/2010 5/29/2010
ADT
Date Sorted By Week
128th and Sunset Northbound and Southbound Traffic ADT
Northbound Through
Southbound Through
Hickman NB Off Ramp closed April 19th to May 10th (4/19 to 5/10) and University NB On Ramp Closed 4/19‐5/20)
Hickman NB Off Ramp Closed
Hickman NB Off RampHickman NB Off RampUniversity NB On Ramp Closed
Hickman SB on Ramp Closed

0
200
400
600
800
1000
1200
1400
1600
4/27/2010 4/28/2010 4/29/2010 4/30/2010 5/1/2010 5/2/2010 5/3/2010 5/4/2010 5/5/2010 5/6/2010
Traffic
7‐9am
Date
114th and Clive Combined 7‐9am Traffic (Not Directional)
Sensor 1610
Sensor 2001
Sat, Sun

0
500
1000
1500
2000
2500
3000
4/26/2010 4/27/2010 4/28/2010 4/29/2010 4/30/2010 5/1/2010 5/2/2010 5/3/2010 5/4/2010 5/5/2010 5/6/2010
vehicles 4‐6pm
Date
114th and Clive Combined 4‐6pm Traffic (Not Directional)
Sensor 1610
Sensor 2001
Sat, Sun

0
2000
4000
6000
8000
10000
12000
4/26/2010 4/27/2010 4/28/2010 4/29/2010 4/30/2010 5/1/2010 5/2/2010 5/3/2010 5/4/2010 5/5/2010 5/6/2010
Vehicles
Date
114th and Clive Combined 7‐7 Traffic (Not Directional)
Sensor 1610
Sensor 2001
Sat, Sun
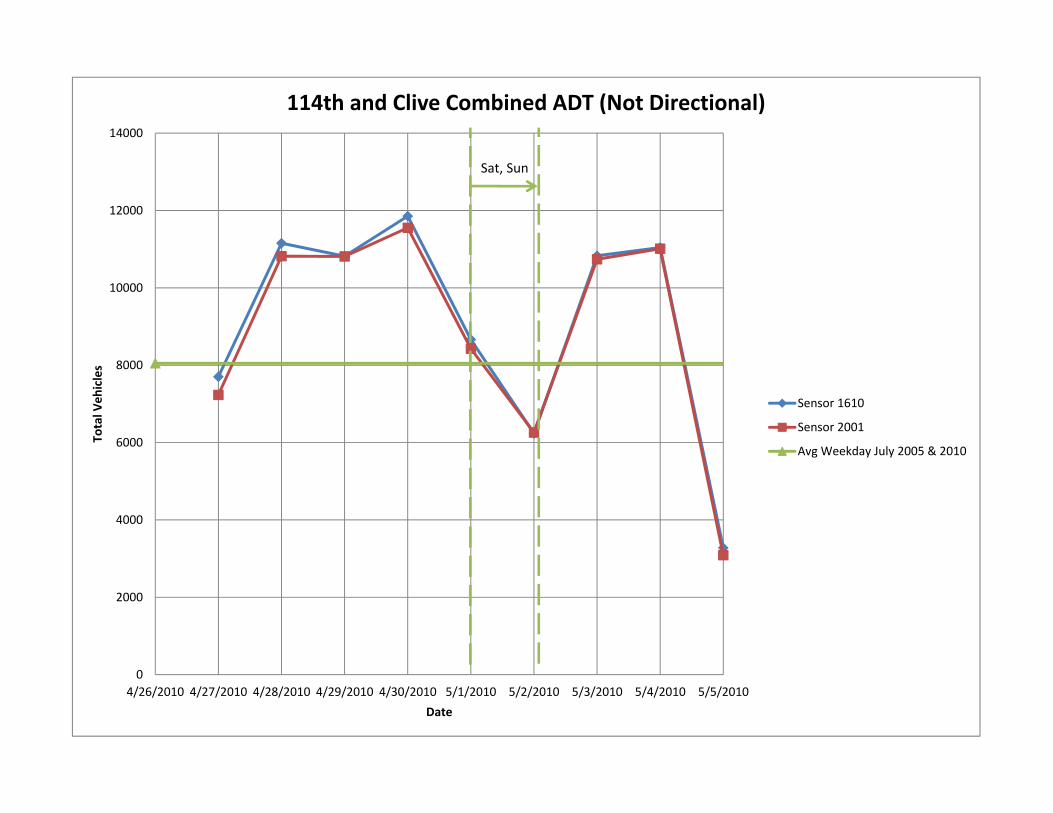
0
2000
4000
6000
8000
10000
12000
14000
4/26/2010 4/27/2010 4/28/2010 4/29/2010 4/30/2010 5/1/2010 5/2/2010 5/3/2010 5/4/2010 5/5/2010
Total V
ehicles
Date
114th and Clive Combined ADT (Not Directional)
Sensor 1610
Sensor 2001
Avg Weekday July 2005 & 2010
Sat, Sun
