utilization of geotagged photograph, remote sensing, …
TRANSCRIPT

ISSN 0024-9521 IJG Vol. 45, No.2, December 2013 (187 - 204) © 2013 Faculty of Geography UGM and The Indonesian Geographers Association
UTILIZATION OF GEOTAGGED PHOTOGRAPH, REMOTE SENSING, AND GIS FOR POST-DISASTER DAMAGE
ASSESSMENT
Sapta Nugraha spta_bpnjateng
Badan Pertanahan Nasional, Provinsi Jawa Tengah
Michiel Damen [email protected].
Faculty of Geo-information and Earth Observastion, University of Twente
ABSTRACT Merapi eruption in 2010 causing major damage impact on that region. Post-disaster damage assessment that has been done by the government have not been supported with a good spatial data so that validation is relatively weak. Method of post-disaster damage assessment, particularly assessment of building damage using geotagged photos, remote sensing and GIS is expected to improve the method of damage assessment by the government of Indonesia. Geojot Applications for Android Smartphone/Tablet allows the assessment of building damage to be included in the photo attribute. Interpretation of satellite imagery of building damage is done by using three indications: building visibility, building collapse, and building roof. Geotagged photograph can complement the needs of building damage assessment from satellite images because it can describe the structural and non-structural damage to buildings clearly. Geotagged photograph with GPS Lock-Off mode requiring information on the direction and distance of the object being photographed. Geotagged photograph with the QR code is the most profitable because the identity of the building is already known and can be matched with an existing database. Keywords : geotagged photograph, damage assessment, remote sensing, GIS
ABSTRAK
Erupsi Merapi 2010 mengakibatkan dampak yang besar pada wilayah di sekitarnya. Meskipun demikian, pendugaan dampak pasca bencana yang telah dilaksanakan pemerintah tidak didukung oleh ketersediaan data spasial yang baik sehingga validasi yang dilakukan memiliki konfidensi yang rendah. Metode pendugaan dampak pasca bencana, terutama kerusakan bangunan menggunakan foto geotagging, penginderaan jauh, dan sistem informasi geografis (SIG) diharapkan mampu meningkatkan pendugaan dampak yang dilakukan oleh pemerintah. Aplikasi Geojot pada Smartphone/Tablet berbasis Android dapat digunakan dalam pendugaan dampak, yang dapat dimasukkan dalam atribut foto. Interpretasi citea satelit untuk pendugaan kerusakan bangunan dilakukan melalui tiga indikator, meliputi; visibilitas bangunan, runtuhan bangunan, dan atap bangunan. Foto geotagging dapat digunakan untuk melengkapi pendugaan kerusakan bangunan dari citra satelit karena dapat digunakan untuk mendeskripsikan bangunan, baik kerusakan secara struktural maupun non-struktural. Foto geotagging dengan mode GPS Lock-off digunakan untuk memperoleh informasi mengenai arah dan jarak dari objek pada foto. Foto geotagging dengan QR code sangat bermanfaat untuk merekam identitas bangunan untuk dicocokkan dengan data yang tersimpan pada database. Kata kunci: foto geotagging, pendugaan dampak, penginderaan jauh, GIS INTRODUCTION Cangkringan sub-district, Sleman, Yogya-karta is one of the region severely affected by the eruption of Merapi volcano in 2010. Based on BNPB data, Sleman district suffered heavy damage in Cangkringan and Ngemplak with the number of heavy
damaged houses of 2339 units [BNPB, 2011a]. Cangkringan sub-district consists of 5 villages namely Umbulharjo, Kepu-harjo, Glagaharjo, Wukirsari and Argo-mulyo. This sub-district is one of the sub-districts in the Sleman regency located on the southern slope of Merapi volcano. The

Indonesian Journal of Geography, Vol 45, No.2, December 2013 : 186 - 204
188
area was greatly affected by the eruption of Merapi Volcano in 2010. In 2011, Indonesian government issued a regulation of BNPB Nr. 15/2011 as a standard guideline for post-disaster asse-ssment. Based on this regulation, there are standards for the assessment of damage due to disasters. There are no more spe-cific instructions for the type of volcanic disaster. Based on the criteria used, remote sensing can not fulfill all the required data for the assessment of damages due to the disaster. Post-disaster damage assessment in Indonesia conducted by disaster ma-nagement agency of Indonesia. Impro-vements to the method that has been used by disaster management agency of Indo-nesia is very necessary to improve the results obtained. The aim of this research is to develop and to test method for volcanic post-disaster damage assessment from geotagged gro-und photograph in combination with re-mote sensing and GIS in Indonesia, espe-cially for building damage assessment. The development of geotagged photograph and Geographic Information System can make more possibilities for utilization in disaster management. According to Welsh et. al., [2012], “geotagging is easy to undertake and is potentially cost effecti-ve”. Geotagged photos can be generated directly through the GPS equipment and digital cameras [Yaegashi et. al., 2009]. With the current technological deve-lopments, the smartphone is also equipped with geotagging facility. The use of smart-phone allows to use of certain applications for geotagging. One of the applications on the Android-based smartphone for geotagging is GeoJot that produces geotag photos with GPS coordinates and can be used also to add the attribute data associated with geotag pho-
tos such as name, condition, value, etc [Geospatial Experts, 2012]. This allows the interpretation of geotag photos for post-disaster damage assessment purpose. Photograph of the entire building and the details that are taken will be useful as data for verification and analysis of matters that are not included in the list of field survey format [Crandell et. al, 2005]. 3D photo-graph may have a role in post-disaster damage assessment. Tsai et. al. [2011] explain that a photographer who is on site observations can generate 3D anaglyph photograph by photographing the object from different angles. He explained that the main difference of the images of 3D and 2D is a 3D anaglyph photograph can “provide a greater field depth contrast, the distances are extremely realistic, and the disaster sites (under 1 km2) can be better observed”. He stressed also that by using 3D anaglyph photographs, photos user is not necessary to be at the location of the photo to see the site conditions. THE METHODS Geo Eye imagery 2009 is used as primary satellite imagery before Merapi volcano eruption. For areas in Geo Eye imagery that is covered by cloud, Quickbird ima-gery 2006 is used. Geo Eye imagery of Cangkringan Sub-District is recorded in May 2009, while Quickbird imagery is recorded in September 2006. World View 2010 of Merapi region recorded in No-vember 2010 is used as an imagery that describes the condition of post-eruption of Merapi 2010. This imagery illustrates the impact of pyroclastic flows and surges that hit parts of the southern slope of Merapi. Geo Eye imagery of Cangkringan sub-district recorded in June 2011 is used to illustrate the impact of Merapi's lahars. Satellite imagery that used in this research is shown in the Figure 1.

UTILIZATION OF GEODATAGGED PHOTOGRAPH Sapta Nugraha, Michiel Damen
189
Figure 1. Satellite Imagery of Cangkringan Sub-District Before and After Merapi Eruption 2010
Secondary maps and data are used as ini-tial data for this research in the form of administrative map, hazard map, and pho-tograph. Secondary data of geotagged pho-tographs that related to the research purpo-se will be used to obtain preliminary in-formation on the impact of disasters re-corded in the study area. Landcover map is produced from visual interpretation of multitemporal high reso-lution imagery. Further, multitemporal landcover map can analyze kinds of land-cover that has been changed. Damage in-formation from selected object can be obtained from high resolution imagery according to damage criteria. Disaster affected areas can be identified from the analysis of changes in land cover and condition of the objects visually seen from
the imagery. Disaster affected area map, landcover map with damage information and others map then used as the basis for sampling in the field. Sampling technique that will be used is purposive sampling. Building damage isthe focust element in this research. Area that is affected by di-saster will be used as sampling location. Damages on building is the focus in this research. The building damage criteria we-re adopted and modified from Baxter [2005] and BNPB [2011b]. This analysis is conducted to adjust the type of disaster damage to volcanic and general criteria used by the government of Indonesia. The criteria of building damage due to pyroclastic flows/surges are shown in the Table 1.
Worldview November 2010 Geo Eye May 2009
Indonesian Journal of Geography, Vol 45, No.2, December 2013 : 186 - 204
190
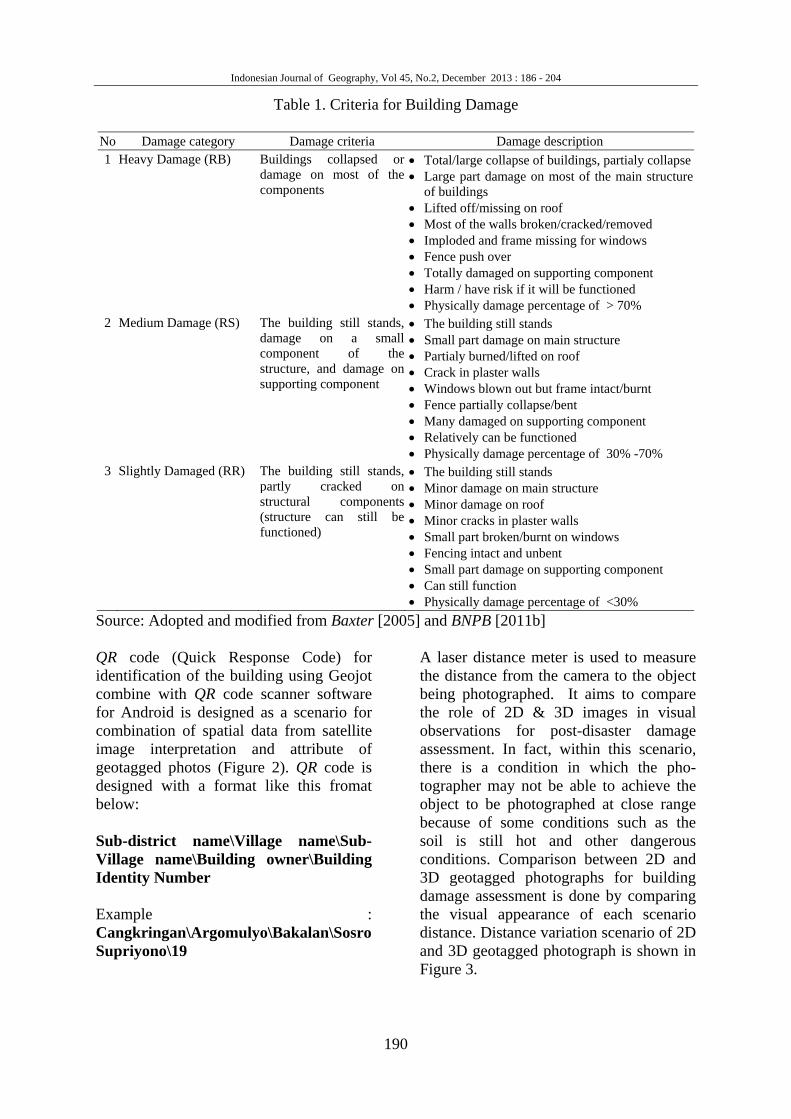
Table 1. Criteria for Building Damage
No Damage category Damage criteria Damage description 1 Heavy Damage (RB) Buildings collapsed or
damage on most of the components
Total/large collapse of buildings, partialy collapse Large part damage on most of the main structure
of buildings Lifted off/missing on roof Most of the walls broken/cracked/removed Imploded and frame missing for windows Fence push over Totally damaged on supporting component Harm / have risk if it will be functioned Physically damage percentage of > 70%
2 Medium Damage (RS) The building still stands, damage on a small component of the structure, and damage on supporting component
The building still stands Small part damage on main structure Partialy burned/lifted on roof Crack in plaster walls Windows blown out but frame intact/burnt Fence partially collapse/bent Many damaged on supporting component Relatively can be functioned Physically damage percentage of 30% -70%
3 Slightly Damaged (RR) The building still stands, partly cracked on structural components (structure can still be functioned)
The building still stands Minor damage on main structure Minor damage on roof Minor cracks in plaster walls Small part broken/burnt on windows Fencing intact and unbent Small part damage on supporting component Can still function Physically damage percentage of <30%
Source: Adopted and modified from Baxter [2005] and BNPB [2011b] QR code (Quick Response Code) for identification of the building using Geojot combine with QR code scanner software for Android is designed as a scenario for combination of spatial data from satellite image interpretation and attribute of geotagged photos (Figure 2). QR code is designed with a format like this fromat below: Sub-district name\Village name\Sub-Village name\Building owner\Building Identity Number Example : Cangkringan\Argomulyo\Bakalan\Sosro Supriyono\19
A laser distance meter is used to measure the distance from the camera to the object being photographed. It aims to compare the role of 2D & 3D images in visual observations for post-disaster damage assessment. In fact, within this scenario, there is a condition in which the pho-tographer may not be able to achieve the object to be photographed at close range because of some conditions such as the soil is still hot and other dangerous conditions. Comparison between 2D and 3D geotagged photographs for building damage assessment is done by comparing the visual appearance of each scenario distance. Distance variation scenario of 2D and 3D geotagged photograph is shown in Figure 3.

UTILIZAT
Figur
RESUL DamagResolutIdentifitemporalookingchange.is very with lacharactea disastscreen imagerydelineatMerapi into sixcompacte surfabroadlebroadleCangkrHa (65(buildinof 256.4
TION OF GEODA
re2. QR CodIden
LT AND DI
ge Interprtion Satellication of al satellite i
g for areas. Image befo
useful forand cover eristics is oter that hapvisual inte
y using Arte land covvolcanic d
x classes, ncted clay suace, non-woeaves and eaves dominingan sub-d
5.25 %). Cng) has a r42 Ha (5.6 %
Figure 3.
ATAGGED PHO
de Sample fntification
ISCUSSIO
retation uite Imagery
damage imagery is cs that havefore and after this purpo
changes ne possible
ppened in therpretation rcGIS can ver. Land disaster 201namely bar
urface (buildoody broadle
water bodnate the landdistrict of aCompacted elatively la%).
Distance V
OTOGRAPH
for Building
ON
using Higy from mulconducted be land cover the disastose. An arwith certa indication hat area. Oon a digitbe done
cover befo10 is dividre soil (dryding), concreaves, wooddies. Woodd cover in th
about 2983.6clay surfa
arge coverag
Variation Sce
191
g
gh
ti-by
ver ter rea ain of
On-tal to
ore ed y), re-dy dy he 61
ace ge
InvotybuclnowsosidrviviU Obeerarladibababebrwanveariswanthnobaalla%
enario of 2D
nterpretationolcanic disaypes such auilding), bulay surface on-woody b
woody broadoil covers 1imilar withry soil is thillages closillages are
Umbulharjo.
Overlay anaefore and ruption by rea affectedandcover chistrict are coare soil (drare soil (decame baroadleaves
woody broadnd woody egetation (Frea changeds the area
woody broadnd 9.57 % her major chon woody are soil (9.1lso experienand cover t
%).
D and 3D G
Sap
n of land caster 2010 pas bar dry surned vege
(building)broadleavesdleaves. La1564.72 Hawoody broa
he most extest to the p
Glagaharj
alysis of theafter the
using GISd by the dishanges in ompacted cry), concredry), non-ware soil (
became bdleaves bec
broadleaveFigure 4; Tad after the with the ty
dleaves (77.into burnedhange is thebroadleave
13 %). Comnced considthat turns in
Geotagged P
pta Nugraha, Mic
cover after produces lansoil (interleetation, com, concrete s, water bodandcover of a (34.22 %)adleaves artensive in theak of Mero, Kepuha
e land coveMerapi v
To determsaster. The
Cangkringclay surface ete surface woody broa(dry), nonburned vegame bare soes became able 2). Moeruption ofype of lan.71 % into bd vegetatione landcovers that turn
mpacted clayderable chanto bare so
Photograph
chiel Damen
Merapi nd cover aved by mpacted surface,
dies and f bar dry , almost ea. Bare he three
rapi, that arjo and
er maps volcanic
mine the types of an sub-became became
adleaves n-woody getation, oil (dry)
burned st of the
f Merapi nd cover bare soil n). Ano-r type of s into a
y surface anges in oil (3.48

Indonesian Journal of Geography, Vol 45, No.2, December 2013 : 186 - 204
192
Figure 4. Landcover Changes Map after Merapi volcanic disaster 2010
Table 2. Landcover changes area after Merapi volcanic disaster 2010
Nr Landcover Width area in Village (Ha)
Argomulyo Glagahharjo Kepuharjo Umbulharjo Wukirsari Total 1 Compacted clay
surface turned into Bare soil, dry
3.62 16.61 20.51 9.87 4.53 55.15
2 Concrete surface turned into Bare soil, dry
0.08 0.25 0.27 - - 0.64
3 Non-woody broadleaves turned into Bare soil, dry
43.03 27.31 26.33 29.47 - 144.54
4 Non-woody broadleaves turned into Burned vegetation
1.08 - - - - 1.08
5 Woody broadleaves turned into Bare soil, dry
24.00 440.79 402.98 300.79 - 1230.07
6 Woody broadleaves turned into Burned vegetation
18.01 67.24 32.61 9.28 24.35 151.49
Total 89.82 552.21 482.71 349.40 108.82 1582.96
Source: Data processing, 2013

UTILIZATION OF GEODATAGGED PHOTOGRAPH Sapta Nugraha, Michiel Damen
193
There are 3 types of hazards that can be analyzed in the event Merapi eruption in 2010, these types are pyroclastic flows, pyroclastic surges and lahars. Settlement widely affected by pyroclastic surges are situated in the Glagaharjo, Umbulharjo and Kepuharjo village respectively 11 Ha, 9.21 Ha, and 7.67 Ha, while the largest area of settlement affected by pyroclastic flows is located in the Glagaharjo and Ke-puharjo village respectively 12 Ha and 5.22 Ha. Settlement for the widest area affected by lahars is located in the Argomulyo village with total area of 1.44 Ha. Interpretation of the damage is focused on damage to building. Interpretation of bu-ilding damage from high-resolution sate-llite imagery is done by using the criteria from Ogawa [2000] that has been mo-dified. Three criteria are used namely building visibility, building collapse and building roof condition. Interpretation is done by using on screen visual interpre-tation in ArcGIS by overlaying building layer and satellite imagery after the 2010 eruption of Merapi. The buildings that vanish/not visible, totaly collapse, and lifted off/missing roof have the highest number of 938 units (58.37 %), while the smallest (0.37 %) is building with clearly visible/building still stands, no collapse and lifted off/missing roof (Table 3).
Damage Interpretation from geotagged photograph Geotagged photos depict the condition of the photographed object. Interpretation of building damage based on these compo-nents on geotagged photos isfacilitated by using a device for geotagging photos call-ed Geojot. Geojot is an application for geotagging photos on the Android opera-ting system. This application gives the users flexibility to design their own attri-butes of the photos. In this case, the design attributes that made is the design attributes for damage assessment due to volcanic
disaster. Attributes of building damage to the main structural elements such as the foundation, columns, floor and beam is made into single point that is the main structure of the building. Figure 5 (left) is an example of the inte-rpretation of damage to buildings in the Bakalan sub-village, Argomulyo village, Cangkringan by using Geojot and GPS Photo Link application. Geojot is used to generate geotagged photograph and to fill the attributes of geotagged photograph, while the GPS Photo Link is used to create reports and spatial data based on pho-tographs from Geojot with attributes that have been filled. It can be seen that the large building collapse occurred, large part damage on main structure, most broken/ cracked/removed, partialy lifted on roof, blown out on windows but frame intact, totally damage on supporting component, and harm to be functionalized. Based on the above photo and the attributes, GPS Photo Link can be assembled into water-mark photo as report that shows the building damage attribute information. The geotagged photograph as shown in Figure 5 (right) was taken with GPS Lock-Off mode so that the coordinates listed are the coordinates of camera positions. Figures 290° WNW is the direction of the shooting (the camera towards the object to be photographed). GPS accuracy that can be obtained when shooting with geotagging Android devices are + 5-10 meters. Desired minimum accuracy limit for the GPS when photographing can be determi-ned on Geojot settings. Combination of geotagged photograph attribute, interpretation from remotely sensed data by mean of GIS Automatically geotagged photos with geotagging device primarily record the po-sition of the camera when taking pictures, not the position of the object being pho-tographed. By using Geojot, coordinates recorded photos depends on the options

selectedcoordinGPS Lonate ofnerate tphotogrtoward locked trmore,
Nr Bu
1 Bui
2 Bui
3 Bui
4 Buion r
5 Bui
6 Buion r
7 Buioff/
8 Van
Tot
Sourc
Figur
d. GPS Lonates of camock-On optif the objectthe coordinaraphed, the the object the coordinall resultin
Tab
uilding damag
ilding clearly v
ilding clearly v
ilding clearly v
ilding clearly vroof tile
ilding clearly v
ilding clearly vroof tile
ilding unclearl/missing nish/not visibl
al (Unit)
e: Data proc
re 5. Buildin
Indonesian Jo
ck-Off optmera positioion can prodt photograpates of the ophotographto be photo
nate of the obg photos ha
ble 3. Build
ge from high rB
visible/Buildi
visible/Buildi
visible/Buildi
visible/Buildi
visible/Buildi
visible/Buildi
ly visible/buil
le, Totally col
cessing, 20
ng damage i
ournal of Geogra
ion producon, while thduces coordphed. To gobject that bher should bographed anbject. Furthave the sam
ding damage
resolution sateBuillding colla
ng still stands
ng still stands
ng still stands
ng still stands
ng still stands
ng still stands
lding can still
appse. Lifted
13
interpretatioGeojot to G
aphy, Vol 45, No
194
ces he di-ge-be be nd
he-me
cophthtasuggGna
e interpretat
ellite imagery apse, Building
s, No collapse
s, No collapse
s, No collapse
s, No collapse
s, No collapse
s, No collapse
be identified,
off/missing
on in GeojoGPS Photo L
.2, December 20
oordinate thhotographedhods to be agged photoults of imaged photos
GPS Lock-Oario.
tion from sa
interpretationg Roof)
, Lifted off/m
, Minor dama
, No damage o
, Partialy lifte
, Lifted off/ m
, Partialy lifte
Totally colap
t (left) and Link (right)
013 : 186 - 204
hat is the d object. T
applied foos and attriagery interp
with GPS On scenario
atellite imag
n (Building Vi
missing
age on roof tile
on roof
ed off or major
missing
ed off or major
ppse, Lifted
its interpret.
coordinatesThere are thor combininibutes withpretation, ieLock-Off sand QR Co
gery
isibility,
e
r damage
r damage
tation repor
s of the hree me-ng geo-
h the re-e geota-scenario, ode sce-
Total (Unit)
6
145
202
86
84
70
76
938
1607
rt from
UTILIZATION OF GEODATAGGED PHOTOGRAPH Sapta Nugraha, Michiel Damen
195
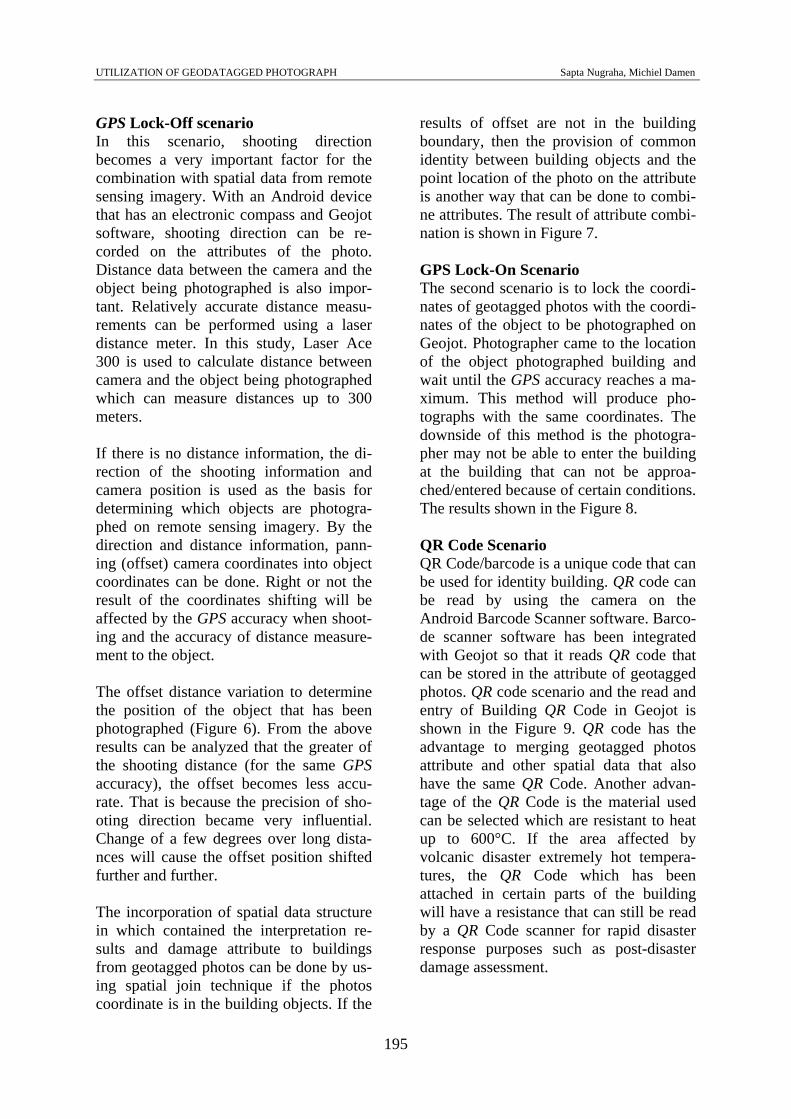
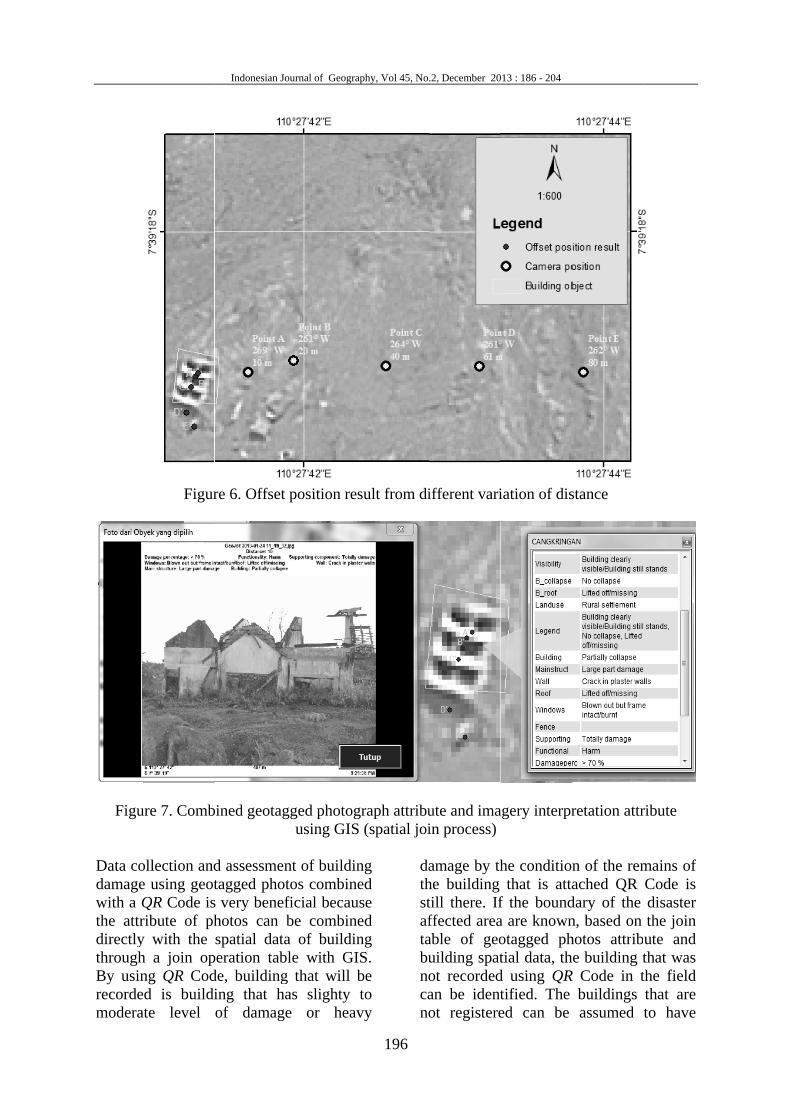
GPS Lock-Off scenario In this scenario, shooting direction becomes a very important factor for the combination with spatial data from remote sensing imagery. With an Android device that has an electronic compass and Geojot software, shooting direction can be re-corded on the attributes of the photo. Distance data between the camera and the object being photographed is also impor-tant. Relatively accurate distance measu-rements can be performed using a laser distance meter. In this study, Laser Ace 300 is used to calculate distance between camera and the object being photographed which can measure distances up to 300 meters. If there is no distance information, the di-rection of the shooting information and camera position is used as the basis for determining which objects are photogra-phed on remote sensing imagery. By the direction and distance information, pann-ing (offset) camera coordinates into object coordinates can be done. Right or not the result of the coordinates shifting will be affected by the GPS accuracy when shoot-ing and the accuracy of distance measure-ment to the object. The offset distance variation to determine the position of the object that has been photographed (Figure 6). From the above results can be analyzed that the greater of the shooting distance (for the same GPS accuracy), the offset becomes less accu-rate. That is because the precision of sho-oting direction became very influential. Change of a few degrees over long dista-nces will cause the offset position shifted further and further. The incorporation of spatial data structure in which contained the interpretation re-sults and damage attribute to buildings from geotagged photos can be done by us-ing spatial join technique if the photos coordinate is in the building objects. If the
results of offset are not in the building boundary, then the provision of common identity between building objects and the point location of the photo on the attribute is another way that can be done to combi-ne attributes. The result of attribute combi-nation is shown in Figure 7. GPS Lock-On Scenario The second scenario is to lock the coordi-nates of geotagged photos with the coordi-nates of the object to be photographed on Geojot. Photographer came to the location of the object photographed building and wait until the GPS accuracy reaches a ma-ximum. This method will produce pho-tographs with the same coordinates. The downside of this method is the photogra-pher may not be able to enter the building at the building that can not be approa-ched/entered because of certain conditions. The results shown in the Figure 8. QR Code Scenario QR Code/barcode is a unique code that can be used for identity building. QR code can be read by using the camera on the Android Barcode Scanner software. Barco-de scanner software has been integrated with Geojot so that it reads QR code that can be stored in the attribute of geotagged photos. QR code scenario and the read and entry of Building QR Code in Geojot is shown in the Figure 9. QR code has the advantage to merging geotagged photos attribute and other spatial data that also have the same QR Code. Another advan-tage of the QR Code is the material used can be selected which are resistant to heat up to 600°C. If the area affected by volcanic disaster extremely hot tempera-tures, the QR Code which has been attached in certain parts of the building will have a resistance that can still be read by a QR Code scanner for rapid disaster response purposes such as post-disaster damage assessment.
Figu
Data codamagewith a Qthe attrdirectlythroughBy usinrecordemodera
Figur
ure 7. Comb
ollection ande using geotQR Code isribute of phy with the h a join opng QR Coded is buildiate level
Indonesian Jo
re 6. Offset
bined geotag
d assessmentagged phots very benefhotos can spatial data
peration tabde, buildinging that haof damage
ournal of Geogra
position re
gged photogusing GIS
nt of buildintos combinficial becaube combina of buildin
ble with GIg that will bas slighty e or heav
aphy, Vol 45, No
196
sult from di
graph attribuS (spatial joi
ng ed
use ed ng IS. be to vy
dathstaftabunocano
.2, December 20
ifferent vari
ute and imain process)
amage by thhe building till there. Ifffected areaable of geouilding spatot recordedan be identot registere
013 : 186 - 204
iation of dis
agery interpr
he conditiothat is atta
f the bounda are knownotagged phtial data, th
d using QRtified. The ed can be
stance
retation attr
n of the remached QR
dary of the n, based on hotos attribhe building tR Code in t
buildings assumed
ribute
mains of Code is disaster the join ute and that was the field that are to have

UTILIZAT
heavy/ buildingCode modera QR Cosub-villngan suBakalaneruptionbuildingtotal n
Fig
TION OF GEODA
total damag damage dis a build
ate damage.
ode test conlage, Argomub-district. n sub-viln 2010 cag unit as shnumber of
gure 8. Com
Figure 9.
ATAGGED PHO
ge. Thus thdata collectding with
nducted in mulyo villa
Building olage befo
an be maphown in Fi
buildings
mbination of
. QR Code s
OTOGRAPH
he priority tion with Q
slightly
the Bakalage, Cangkrobject in thore Mera
pped into 6gure 10. Th
before th
f geotaggedby GPS
scenario on
197
of QR
to
an ri-he
api 62 he he
diCafLofbea nobucode
d photographS Lock-On s
building an
isaster andCode Scenarfter Merap
Lock-Off or f buildings e recorded 45 unit buiot be recorduildings wondition oestroyed.
h attribute ascenario
nd the ‘read
Sap
then surverio with Ge
pi eruption GPS Lockwith a QR is 17 buildiilding with aded can be
were heavy of buried
and imagery
d and entry’
pta Nugraha, Mic
eyed by useojot for co
2010 (wik-On). The
Code that ing unit. Tha QR Code assumed thdamaged
d or com
y interpretat
in Geojot
chiel Damen
sing QR onditions th GPS number can still
he rest is that can
hat these by the
mpletely
tion

Not allconditiobecausemining eruptionresult osensingtagged join opmage lebased oare usbuildingsub-distdamagein Figur Each tyflows, cause dslightlyheavy [2005]
l buildings ons on the e the proces
(field worn of Merapiof building
g imagery photograph
peration in evel assesseon the buildsed. Spatiag damage ltrict and thed by the tyre 11.
ype of dispyroclastic
different levy damaged,
damaged. who asses
Indonesian Jo
Figure 10. B
were samground is ass of reconrk is 2 yei in 2010). Ig damage is combine
h attributes ArcGIS.
ed by perfording damageal distributevel in the he number
ypes of haza
saster eithesurges an
vels of dammoderate dAccording
s the dyna
ournal of Geogra
Building da
mpled due a lot differenstruction anears after thInterpretatiofrom remo
ed with geby using thBuilding d
rming a quee criteria thtion of thCangkringof buildin
ard are show
er pyroclastnd lahars cmage that adamaged ang to Baxtamic pressu
aphy, Vol 45, No
198
amage level
to ent nd he on ote eo-he
da-ery hat he an
ngs wn
tic an
are nd ter ure
exPyvyunthbuofarpralthrislssfrarTthlo(Kmfo
.2, December 20
in Bakalan
xperienced yroclastic Dy damage ndergo dynhe moderauildings thaf 2-6 kPa are buildingressure of 1l., [2013] whe estimateienced by tlopes of Msure experirom 0-15 kreas closer t
This is in ache buildingsocation cloKepuharjo a
most heavy dound.
013 : 187 - 204
n sub-village
by the Density Cur
buildings namic pressuate damagat undergo and slightlyg experienc1-3 kPa. Bawho made ted dynamithe building
Merapi volcienced by kPa whereto the peak ccordance ws in the villsest to theand Glagahadamaged bu
e
building rrents (PDCare buildinure > 4 kPed buildin
dynamic py damage bced with dased on Jenthe contour ic pressuregs on the sano, dynambuildings
the higheof Merapi v
with the poslages, in whe peak of arjo village)uildings tha
due to Cs), hea-ngs that a, while
ngs are pressure
buildings dynamic nkins et.
map of e expe-southern mic pre-
ranging er value volcano. sition of hich the Merapi
) are the at can be

UTILIZATION OF GEODATAGGED PHOTOGRAPH Sapta Nugraha, Michiel Damen
199
Figure 11. Building damage level for sampled buildings in Cangkringan sub-district.
Comparation of 2D and 3D Geotagged Photograph Comparison between 2D and 3D geotagged photos is conducted by testing for a variety of distances to the object of the assessed building damage. In this case, it is done by comparing the level of clarity of property damage that can be recorded from 2D and 3D photos. Measuring the
distance to the object of the building is done using laser distance meter. Variation distance is used depends on the conditions on the ground. The maximum distance that can be measured by the Laser Ace 300 about 300 meters on the ground but in reality the maximum distance that can be measured is 250 meters because without using special reflectors. 3D Anaglyph photograph is created from a pair of 2D
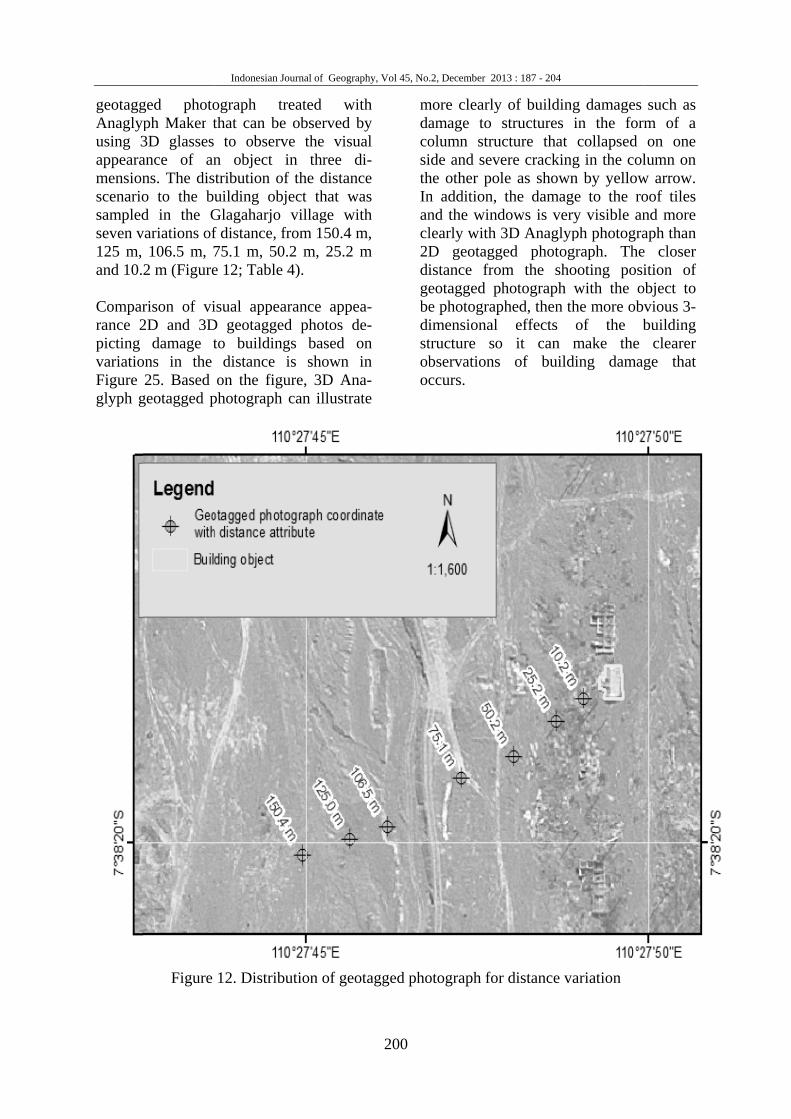
geotaggAnaglypusing 3appearamensionscenariosampledseven v125 m, and 10. Comparrance 2picting variatioFigure glyph g
ged photoph Maker t3D glasses ance of anns. The diso to the bud in the G
variations of106.5 m, 7
2 m (Figure
rison of vi2D and 3D
damage tons in the 25. Based
geotagged p
Figure
Indonesian Jo
ograph trthat can be
to observn object itribution ofuilding obj
Glagaharjo f distance, f75.1 m, 50e 12; Table
isual appeaD geotaggedto building
distance on the figu
photograph
12. Distribu
ournal of Geogra
reated wi observed b
ve the visuin three df the distanject that wvillage wi
from 150.4 m.2 m, 25.2 4).
arance apped photos dgs based ois shown ure, 3D Ancan illustra
ution of geo
aphy, Vol 45, No
200
ith by ual di-
nce was ith m, m
ea-de-on in
na-ate
mdacosithInancl2Ddigebedistoboc
otagged pho
.2, December 20
more clearlyamage to olumn struide and sevhe other poln addition, nd the windlearly with D geotaggistance froeotagged pe photograpimensional tructure sobservations ccurs.
otograph for
013 : 187 - 204
y of buildinstructures
ucture that ere crackinle as shownthe damag
dows is ver3D Anaglyp
ged photogom the shophotograph phed, then th
effects o it can
of build
r distance v
ng damages in the forcollapsed
g in the coln by yellow
ge to the rory visible anph photogra
graph. Theooting posiwith the ohe more obof the bmake the
ding dama
ariation
such as rm of a
on one lumn on
w arrow. oof tiles nd more aph than e closer ition of
object to vious 3-building
clearer ge that

UTILIZAT
Dbu
TION OF GEODA
Ta
Distance to uilding (m)
150.4
125
106.5
75.1
50.2
ATAGGED PHO
able 4. 2D abased on
2D ge
OTOGRAPH
and 3D geotn distance v
eotagged ph
201
agged photovariation on
hotograph
ograph visun Building s
3D
Sap
ual comparisample 3.
D Anaglyph photogr
pta Nugraha, Mic
son
geotagged raph
chiel Damen

Dbu
Sou CONC To perfphotogrbe donephotogrgeotaggGPS Loapplied tial. ThgeotaggCode focan be error, adata ofinterpreing/join The usetter thain termthat ocdamagethat is tagged
Table
Distance to uilding (m)
25.2
10.2
urce: field ob
LUSION A
form a comraph, remote with threeraph shootged photogrock-On andand the ac
he most mged photogror identifica
done quicand the incof high-resoetation is eaning tables w
e of 3D geotan using 2D
ms of the claccurred, pae. The closephotographphotograph
Indonesian Jo
4 (cont.). 2based o
2D ge
bsevation, 2
AND RECO
mbination ote sensing e methods ting in thraph with GPd QR Code.ccuracy of G
minimal erroraph combiation of the ckly, havinorporation olution sateasy to do wwith GIS.
tagged photD geotaggedarity of builarticularly fer distance
hed, it can ph with the m
ournal of Geogra
2D and 3D gon distance v
eotagged ph
2013
OMMENDA
of geotaggand GIS cof geotagghe field,
GPS Lock-O Each can b
GPS is esseor method ined with Qbuilding th
g the loweof the spatillite imagewith combi
tograph is bd photograplding damagfor structurto the objeproduce gemore obvio
aphy, Vol 45, No
202
geotagged pvariation on
hotograph
ATION
ed an ed ie ff, be
en-is
QR hat est ial
ery in-
be-ph ge ral ect eo-us
efof Mscbuthsibaupascufocase A Tcoreco
.2, December 20
photograph vn Building s
3D
ffect of thref the damag
Maps of landcale and buuilding ownhe data is noian governmases, remotepdating datssessment purrent condor data collean be read be of post-dis
ACKNOWL
Thank to Muomments aesearch andonstructive
013 : 187 - 204
visual compsample 3
D Anaglyph photogr
ee-dimensioge observed
d cover anduilding spatner needs toot yet availament. By he sensing ima so that poprocess cou
dition. QR ection of buby the survesaster dama
LEDGEME
uh Aris Marand his sud thanks tcomments.
parison
geotagged raph
onal and thed.
d land use otial data in o be made able by the having thesmagery can ost-disaster uld be fastCode can
uilding ideneyors for theage assessm
ENT
rfai for the vupport durto review
e clearer
on detail level of because Indone-
se data-serve as damage ter than be used
ntity that e purpo-
ment.
valuable ring the
for the

UTILIZATION OF GEODATAGGED PHOTOGRAPH Sapta Nugraha, Michiel Damen
203
REFERENCES Baxter, P. J., Boyle, R., Cole, P., Neri, A.,
Spence, R., and Zuccaro, G. (2005), The impacts of pyroclastic surges on buildings at the eruption of the Soufrière Hills volcano, Montserrat, Bulletin of Volca-nology, 67 (4), 292-313. doi: 10.-1007/s00445-004-0365-7
BNPB (2008), Post-disaster Rehabilitation
and Reconstruction, Legal Docu-ment of BNPB number 11/2008.
BNPB (2011a), Merapi Volcanic Eruption
Reaching Impact IDR 4.23 Trillion. 17 January 2011, Retrieved from http://mis.bnpb.go.id/website/asp/berita_list.asp?id=247. last accessed on 6 August 2012.
BNPB (2011b), Standard Guideline for
Post-disaster Needs Assessment, Legal Document of BNPB number 15/2011.
Crandell, J., and Kochkin, V. (2005),
Scientific damage assessment me-thodology and practical applica-tions, from http://cms.asce.org/-uploadedFiles/Communications-NEW/Hurricane/Scientific_Dama-ge_Assessment_Methodology_and_Practical_Applications.pdf.
Corbley, K. (2012), Mapping disasters
with geo-tagged photos, 25 April 2012, Retrieved from http://ameri-cancityandcounty.com/gis-amp-gps/mapping-disasters-geo-tagged-photos.
Filippi, A. M. (2008), Remote Sensing-Ba-
sed Damage Assessment for Home-land Security Geospatial Techno-logies and Homeland Security, In D. Z. Sui (Ed.), (Vol. 94, pp. 125-169): Springer, Netherlands.
Fontugne, R., Cho, K., Won, Y., & Fukuda, K. (2011), Disasters seen through Flickr cameras, Paper presented at the Proceedings of the Special Workshop on Internet and Disasters, Tokyo.
Francis, D. (2010), 3D Stereocope:
Creating 3d Photographs Using A Single Camera Is Quite Simple, And We Show You How You Can Create Your Very Own 3D Ana-glyph Photos Using A Simple Utility, 25 May 2010, Retrieved from http://www.chip.in/article/-3D-STEREOSCOPE.html.last accessed on 3 August 2012.
Geospatial Experts (2012), GeoJot. Re-
trieved from http://www.appszo-om.com/android_applications/pho-tography/geojot_cltgk.html. last a-ccessed on 16 July 2012.
Jenkins, S., Komorowski, J. C., Baxter, P.
J., Spence, R., Picquout, A., Lavi-gne, F., and Surono, (2013), The Merapi 2010 eruption: An inter-disciplinary impact assessment methodology for studying pyro-clastic density current dynamics, Journal of Volcanology and Geo-thermal Research, doi: http://dx.-doi.org/10.1016/j.jvolgeores.2013.02.012.
Ogawa, N., and Yamazaki, F. (2000),
Photo-Interpretation Of Building Damage Due To Earthquakes Using Aerial Photographs, Re-trieved from http://ares.tu.chiba-u.jp/~papers/paper/WCEE/1906O-gawa.pdf. last acessed on 3 Fe-bruary 2013.
Ozisik, D. (2004), Post - earthquake da-
mage assessment using satellite and aerial video imagery, ITC,

Indonesian Journal of Geography, Vol 45, No.2, December 2013 : 187 - 204
204
Enschede. Retrieved from http://-www.itc.nl/library/papers_2004/msc/upla/derya_ozysik.pDF.
Rezaeian, M. (2010), Assessment of
Earthquake Damages by Image-based Techniques, Institut für Geo-dasie und Photogrammetrie, Eidge-nossische Technische Hochschule Zürich.
Tsai, W., Chen, B., Chang, J., Lin, F.,
Chang, C., Sun, C., Su, W., Chen, M., Shih, D., Chen, C., Lin, S., and Yu, S. (2011), Application of Near Real-Time and Multiscale Three Dimensional Earth Observation Platforms in Disaster Prevention,
International Journal Of Auto-mation And Smart Technology, 1(2), 35-50. doi:10.5875/ausmt.-v1i2.124.
Welsh, K. E., France, D., Whalley, W. B.,
and Park, J. R. (2012), Geotagging photographs in student fieldwork, Journal of Geography in Higher Education. doi: 10.1080/030982-65.2011.647307.
Yamazaki F. (2001), Applications of re-
mote sensing and GIS for damage assessment, Proceedings of the 8th International Conference on Structural Safety and Reliability, Newport Beach.