utilising scale and growing through strong local brands
TRANSCRIPT

Utilising scale and growing through strong local brands
Jens Staff, CFO SEB Nordic Seminar, 10 January 2017
1

Disclaimer • This presentation has been prepared by Orkla ASA (the “Company”) solely for information purposes. The
presentation does not constitute an invitation or offer to acquire, purchase or subscribe for securities. • Certain statements included in this presentation contain various forward-looking statements that reflect
management’s current views with respect to future events and financial and operational performance. The words “believe,” “expect,” “anticipate,” “intend,” “may,” “plan,” “estimate,” “should,” “could,” “aim,” “target,” “might,” or, in each case, their negative, or similar expressions identify certain of these forward-looking statements. Others can be identified from the context in which the statements are made. Although we believe that the expectations reflected in such forward-looking statements are reasonable, these forward-looking statements are based on a number of assumptions and forecasts that, by their nature, involve risk and uncertainty. Various factors could cause our actual results to differ materially from those projected in a forward-looking statement or affect the extent to which a particular projection is realized. Factors that could cause these differences include but are not limited to the Company’s ability to operate profitably, maintain its competitive position, to promote and improve its reputation and the awareness of the brands in its portfolio, to successfully operate its growth strategy and the impact of changes in pricing policies, political and regulatory developments in the markets in which the Company operates, and other risks.
• The information and opinions contained in this document are provided as at the date of this presentation and are subject to change without notice.
• No representation or warranty (expressed or implied) is made as to, and no reliance should be placed on, the fairness, accuracy or completeness of the information contained herein. Accordingly, neither the Company nor its subsidiary undertakings or any of such person’s officers or employees accepts any liability whatsoever arising directly or indirectly from the use of this document.
2

Transition from conglomerate to leading Branded Consumer Goods company
3
Industrial conglomerate
with strong BCG portfolio
New strategic direction in 2011 to become a leading
BCG company
One OrklaUtilise scale and grow through strong local
brands

Business areas
4
Corporate Centre and Group Functions
Orkla Confectionery &
Snacks
(NOK billion)Sales: 5.8
EBIT (adj.): 0.8
EBIT (adj.) margin: 14.5%
Orkla Food
Ingredients
(NOK billion)Sales: 7.6
EBIT (adj.): 0.4
EBIT (adj.) margin: 5.4%
OrklaCare
(NOK billion)Sales: 5.5
EBIT (adj.): 0.9
EBIT (adj.) margin: 15.9%
Orkla Investments
Hydro Power
Financial Investments
Real Estate
Sapa JV (50%)
Jotun (42.5%)
Note: Full-year figures 2015
Orkla Foods
(NOK billion)Sales: 13.3
EBIT (adj.): 1.7
EBIT (adj.) margin: 12.8%

Largest BCG company in the Nordics
Source: Nielsen, company dataDetergents RTM as of Aug/Sept 2015, frozen pizza and ketchup RTM as of week 36 2015, chips as of week 43 20165
#7#6#5#3 #4Orkla #1 #2
Competitor with local focusCompetitor with global focus
Nor
dic
reve
nue1
ILLUSTRATIVE
Scale effects as the largest Nordic BCG company Mainly #1 and #2 positions
Sweden: 57%
Examples of market shares
Denmark: 36%
Norway: 78%
Norway: 69%

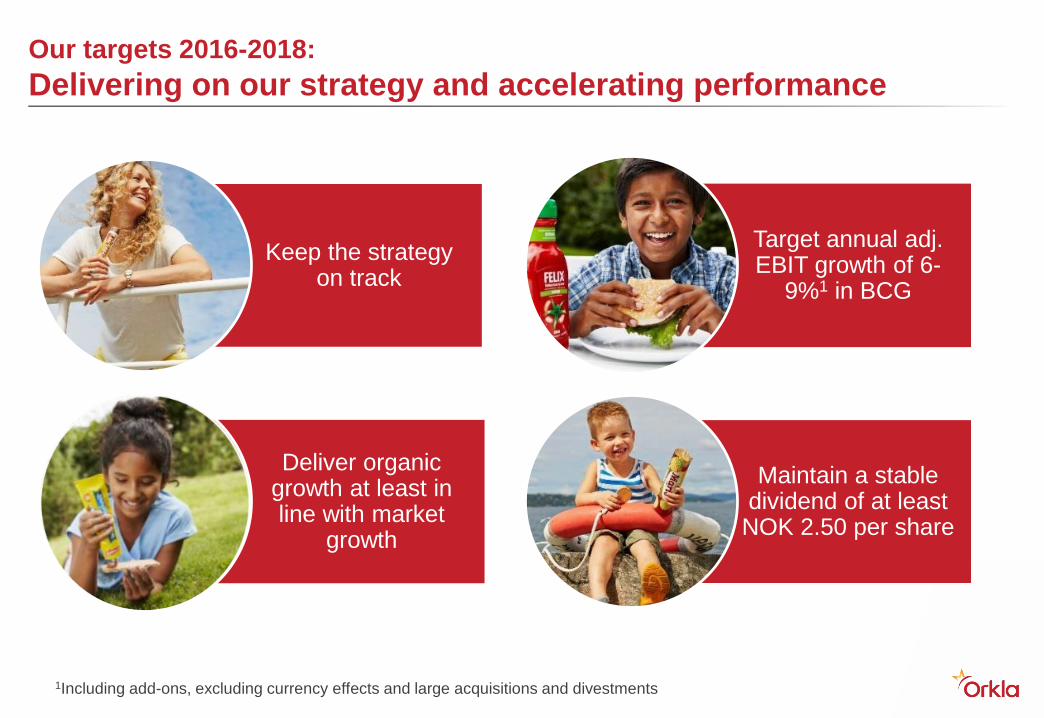
Our targets 2016-2018:Delivering on our strategy and accelerating performance
6
Keep the strategy on track
Deliver organic growth at least in line with market
growth
Target annual adj. EBIT growth of 6-
9%1 in BCG
Maintain a stable dividend of at least
NOK 2.50 per share
1Including add-ons, excluding currency effects and large acquisitions and divestments
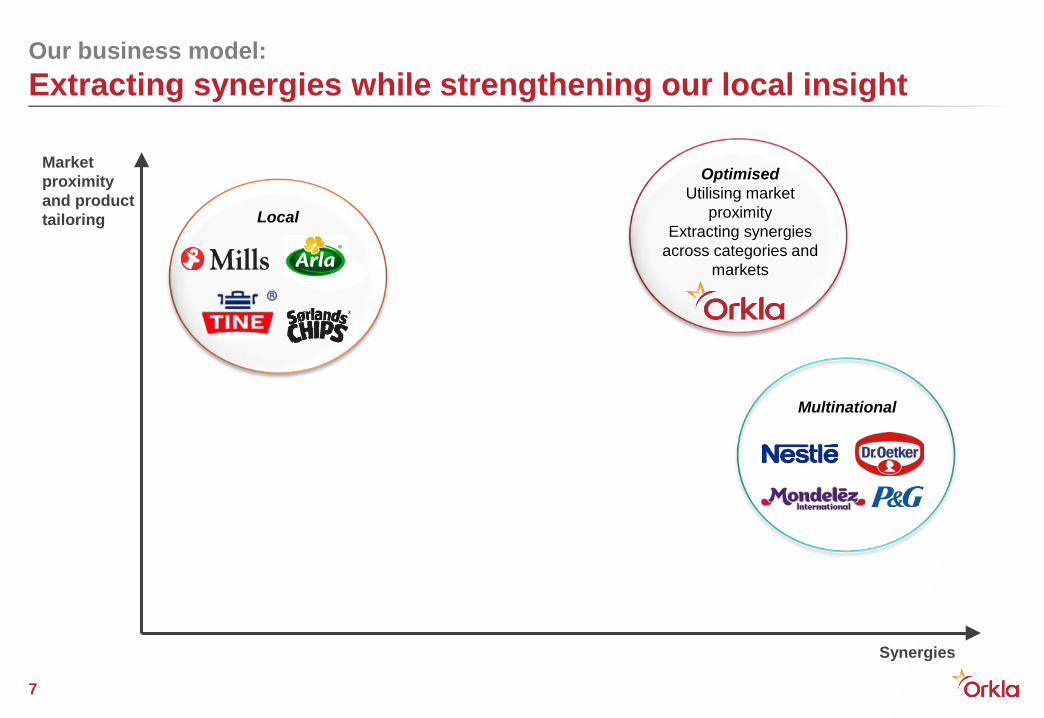
Our business model:Extracting synergies while strengthening our local insight
7
Local
Market proximity and product tailoring
Synergies
Multinational
OptimisedUtilising market
proximityExtracting synergies
across categories and markets

“One Orkla” initiatives throughout the value chain
8
Cross-country launches
Sharing innovations and knowledge
Securing scale in sales operations
Rationalise factory and warehouse footprint
Centralising back office functions
Reviewing IT-system strategy

Strengthening Orkla in the digital world through a One Orkla approach
9
One Orkla consumer service
One Orkla consumer insight hub
One Orkla setup for e-commerce
Pure online
retailers
Multi-channel
retail
B2B
Direct to consumer
One Orkla approach to digitalisation Online sales through different platforms

10% annual EBIT (adj.) growth in BCG since 2012 from organic growth, cost improvements and M&A
1Reported growth adjusted for currency translation effects and structural changes10
Ten quarters with organic growth1
2014
0.7%
2013
-2.8%
2012
1.1%
2015
2.5%2.8%
YTD Q3-16
Annual EBIT (adj.) growth of 10%
3,3783,0922,855
2015 RTM Q3-16
3,8394,246
201420132012

Acquiring strong local positions in selected markets or categories
• Building scale in smaller markets like the Nordics, Baltics and Central Europe
Local champion
• Realising synergies in a category where Orkla already has a strong foothold
Categoryleadership
• Building niche positions in selected categories
Nichestrategy
11
Examples
Export will be the main expansion route for other geographies
Our targets 2016-2018:Delivering on our strategy and accelerating performance
12
Keep the strategy on track
Deliver organic growth at least in line with market
growth
Target annual adj. EBIT growth of 6-
9%1 in BCG
Maintain a stable dividend of at least
NOK 2.50 per share
1Including add-ons, excluding currency effects and large acquisitions and divestments

13