uta gem prototype chamber characterization using cs137
TRANSCRIPT

UTA GEM Prototype Chamber Characterization using Cs137
Snowmass 2005, Aug. 15 – 27, 2005Jae Yu and ChangHee Hahn
University of Texas at ArlingtonChang Won National University, Korea
*On behalf of the HEP group at UTA.
• Introduction• UTA GEM Prototype Chamber• The Problem• The solution• Results• Conclusions and plans
8/23/2005 UTA GEM CharacterizationJ. Yu
1

Introduction• Fine cell sizes needed for calorimeter cluster
identifications and associations w/ tracks to minimize confusion in jet energy
• DHCAL: a solution for keeping the cost manageable for PFA
• GEM chamber characteristics good for a DHCAL for PFA
• A prototype chamber built w/ 10x10cm2 CERN foils– Cs137 and Sr90 sources used for characteristics, along with
cosmic ray
8/23/2005 UTA GEM CharacterizationJ. Yu
2

UTA GEM Prototype Chamber• Thinner plexiglass window
for easier source penetration• Single cell (1cmx1cm pad)
readout• Saw signal from cosmic-ray• Measured Landau
distribution using Cs137 source
• Measured double GEM intrinsic gain
8/23/2005 UTA GEM CharacterizationJ. Yu
3

UTA GEM Calorimeter Prototype Cosmic Event
Preamp Output
Trigger
8/23/2005 UTA GEM CharacterizationJ. Yu
4

Landau Distribution from Cs137 Source
8/23/2005 UTA GEM CharacterizationJ. Yu
5Signal Amplitude (mV)

GEM/MIP Signal Size Computation-Double GEM – applied 419V/foil -Total Ionization (C): ~93 i.p./cm
48 e- / MIP (5mm gap)-Double GEM Intrinsic Gain: G-Charge preamp sensitivity (GC) : 0.25 µV/e-
-Voltage amp. gain 10 (GV)-Output signal = C x G x GC x GV
-Observed ~370mV signal (mean of Landau) G = 3100 ± 20%
8/23/2005 UTA GEM CharacterizationJ. Yu
6

Measured UTA GEM Gains
CERN GDD group measurements
UTA Prototype
8/23/2005 UTA GEM CharacterizationJ. Yu
7
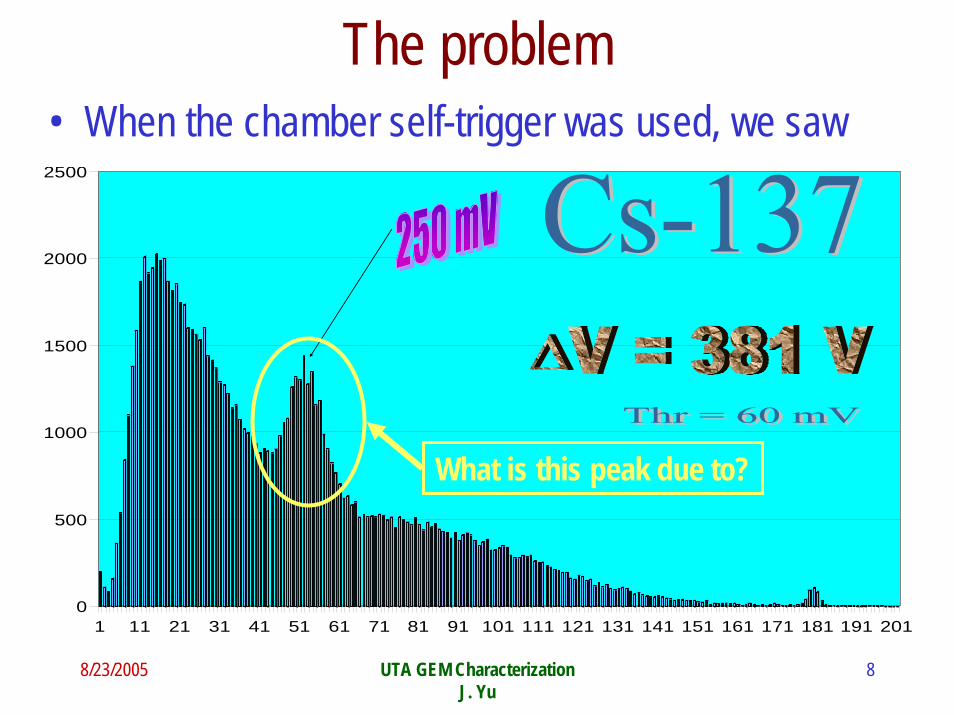
The problem• When the chamber self-trigger was used, we saw
0
500
1000
1500
2000
2500
1 11 21 31 41 51 61 71 81 91 101 111 121 131 141 151 161 171 181 191 201
What is this peak due to?
8/23/2005 UTA GEM CharacterizationJ. Yu
8

The decay characteristics of Cs137
Decay modes of Cs13755
1. β-decays to excited Ba13756
• End point energy 0.512 MeV2. γ emission of Ba decays to Ba
ground state: Monochromatic γw/ E=0.662MeV.
3. Direct β-decay to Ba ground state• End point energy: 1.174MeV
4. Monochromatic e from internal conversion electrons (624, 656 and 660keV)
5. Monochromatic 32 keV X-ray through Coulomb interactions
Decay modes of Cs13755
keV Error (keV) %
Gamma 661.645 0.004 85.0 monochromatic energy
X-ray 32.19(Ba-Kα1) 0.012 3.9031.82(Ba-Kα2) 0.007 2.1136.4(Ba-Kβ) 0.005 1.42
Characteristic X-ray-(monochromatic energy)
EmaxBeta 512 94.6
1174 5.4Continuous energy spectrum
Electron 624 8656 1660 0.6
Internal conversion electron or Auger electron(monochromatic energy)
8/23/2005 UTA GEM CharacterizationJ. Yu
9

0500
100015002000
25003000
35004000
0 100 200 300 400 500
Channel Number
Cou
nts
Charactaristic X-ray
Lead X-ray
BackscatteringComptonEdge
PhotopeakEγ=0.662MeV
E=0.032MeV
Cs137 Decay Spectrum
8/23/2005 UTA GEM CharacterizationJ. Yu
10

8/23/2005 UTA GEM CharacterizationJ. Yu
11
0
50
100
150
200
250
300
350
400
1 13 25 37 49 61 73 85 97 109 121 133 145 157 169 181 193 205 217 229
7.5
142.
527
7.5
412.
554
7.5
682.
581
7.5
952.
510
87.5
1850
V19
00V
1950
V20
00V
2050
V21
00V
2150
V22
00V
2250
V23
00V
0.00.51.01.52.02.53.03.5
Perc
enta
ge o
f To
tal
Signal Voltage GEM Voltage
Sr-90 - 70:30
The small peak in Cs137 doesnot appear in Sr90 beta source!
Decay Mode of Sr90 Emax (keV) %E1 523 <1E2 546 100E3 2284 100
Sr90 Results

How do we separate Cs137 signals?1. Use Sr90 source and 1.65mm Cu plate
• Confirmed that all electrons from Sr90 are blocked by 1.65mm Cu and verified the stopping range expectation
2. Separate noise and cosmic ray, by removing the source3. Separate pulse heights from all electrons and X-ray, using 1mm
Cu plate• Provide pulse height distributions of 660keV γ-ray• These deposit energy through photoelectric and Compton effects
4. Use Cu of 0.65 mm to remove all betas but leave 660keV γ and X-rays
5. Use Cu of 0.1mm, 0.15mm and 0.2mm to determine whether the peak is due to internal conversion electrons or 32keV X-ray
8/23/2005 UTA GEM CharacterizationJ. Yu
12

Electron Stopping Range (EST)In Copper In Copper : : ρρ= 8.960 [= 8.960 [g/cmg/cm³³]]
0.512 MeV 0.1883 mm0.624 MeV 0.2473 mm 1.0 MeV 0.4598 mm1.1 MeV 0.5185 mm1.174 MeV 0.56234 mm1.2 MeV 0.5778 mm2.284 MeV 1.2299 mm
Therefore,The 1.05mm copper plate can block all betas and IC electrons from Cs-137,Because Q-values of betas of Cs-137 are 0.512, 1.174 MeV,the kinetic energies of internal conversion electrons are 0.624, 0.656, 0.660 MeV,and the signals of 32 and 36 keV X-ray can be removed in the data.So, we can see only the signals of 662 keV gammas.
r=R/ρ
EST for End Point Energy of Cs-137 Beta
EST for End Point Energy of Sr-90 Beta
EST for Kinetic Energy of Internal Conversion
Electron
The 1.65mm Intercepting copper plate can intercept all betas of Sr-90.
8/23/2005 UTA GEM CharacterizationJ. Yu
13If we use 0.65mm intercepting Cu plate, we can see noise, gamma 663 keV and X-ray 32, 36 keV because most of betas and internal conversions are intercepted.

Mean Energy Loss of Electrons and Mean Ion Pairs Produced by Various Electrons in ArCO2(85:15)
Photoelectron by X-ray 32keV 1.226keV/mm 44.e /mm
Photoelectron 662keV Gamma662keV 0.261keV/mm 9.5e/mm
End point energy of Beta-1512keV 0.271keV/mm 9.9e/mm
End point energy of Beta-2 1174keV 0.253keV/mm 9.2e/mm
8/23/2005 UTA GEM CharacterizationJ. Yu
14

The SetupRadioactive source: Cs137/Sr90
2.1mm Cu collimator w/ a 5mm hole
Interceptor copper plate w/ 0, 0.1, 0.15, 0.2, 0.3, 0.6, 1.05, 1.65 and 2.0 mm
GEM Chamber
8/23/2005 UTA GEM CharacterizationJ. Yu
15

Reproduction of Cs137 Result
200 400 600 800 1000 12000
500
1000
1500
2000
2500
NO
. of C
ount
s
Pulse Height (mV)
ChangHee’sPeak
8/23/2005 UTA GEM CharacterizationJ. Yu
16

660keV γ Spectrum(Corrected data w/ 1mm Cu plate)
• Noise and cosmic-ray subtracted• The 32 and 36 keV X-rays removed.• The internal conversion electrons and
betas are removed.
No ChangHee’s Peak!!
200 400 600 800 1000 1200
0
200
400
600
800
1000
1200
1400
1600
1800
NO
. of C
ount
s
Pulse Height (mV)
8/23/2005 UTA GEM CharacterizationJ. Yu
17
8/23/2005 UTA GEM CharacterizationJ. Yu
18
-2000
200400600800
NC
1 21 41 61 81 101 121 141 161 181 201 221
PH
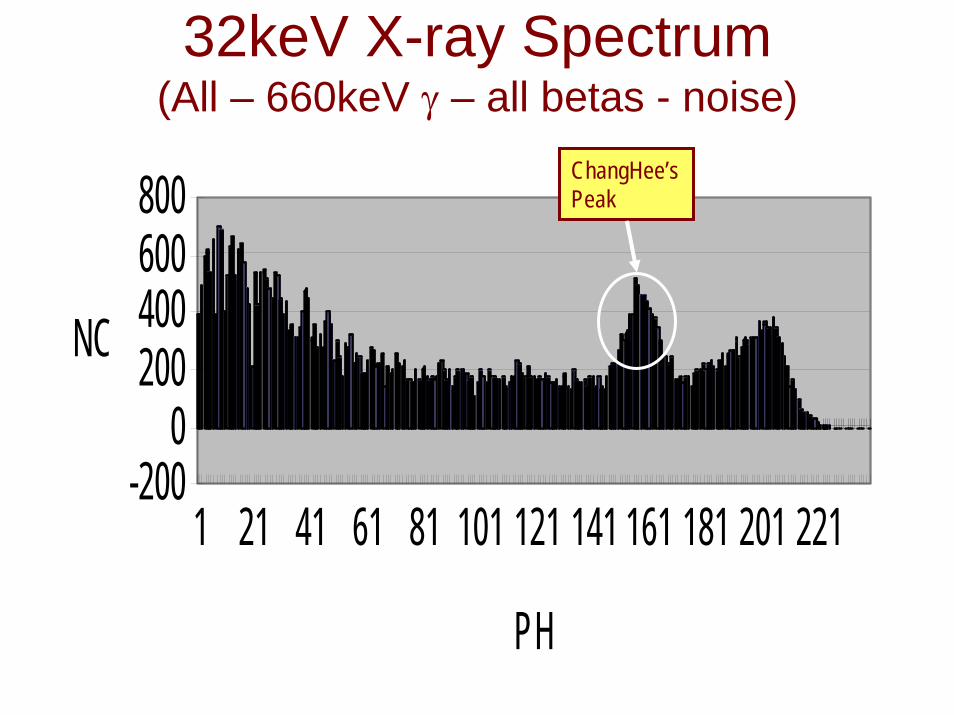
32keV X-ray Spectrum(All – 660keV γ – all betas - noise)
ChangHee’sPeak

Separation of 32keV X-ray and Internal Conversion Electrons
8/23/2005 UTA GEM CharacterizationJ. Yu
19
200 400 600 800 1000 12000
500
1000
1500
2000
2500
NO
. of C
ount
s
Pulse Height (mV)
0 mm Cu
•If ChangHee’s Peak were caused by internal electrons its position will shift to right as Cu plate thickness increases since the electron energy reduces.•If it’s X-ray, its amplitude will reduce.
Studies with various thicknesses of Cu plates show that the peak stays at the same location but its amplitude reduced.
The peak is due to 32keV X-ray not due to conversion electrons
200 400 600 800 1000 12000
500
1000
1500
2000N
O. o
f Cou
nts
Pulse Height (mV)
0.15mm Cu
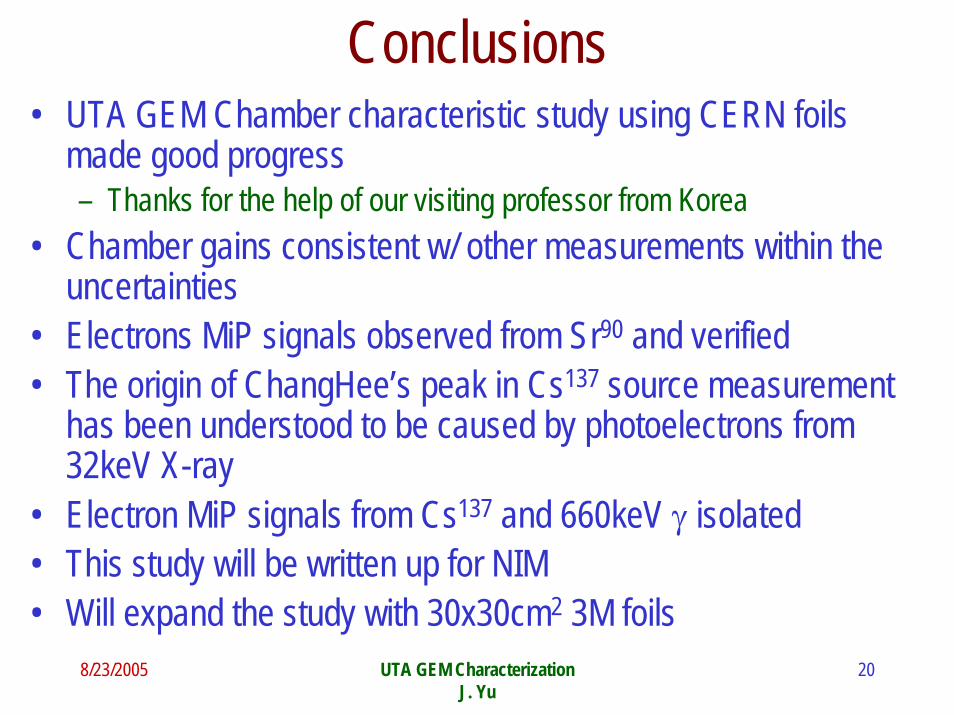
Conclusions• UTA GEM Chamber characteristic study using CERN foils
made good progress– Thanks for the help of our visiting professor from Korea
• Chamber gains consistent w/ other measurements within the uncertainties
• Electrons MiP signals observed from Sr90 and verified• The origin of ChangHee’s peak in Cs137 source measurement
has been understood to be caused by photoelectrons from 32keV X-ray
• Electron MiP signals from Cs137 and 660keV γ isolated• This study will be written up for NIM• Will expand the study with 30x30cm2 3M foils
8/23/2005 UTA GEM CharacterizationJ. Yu
20