ust branch update - in.gov · ust branch update branch chief –doug louks • introduction –my...
TRANSCRIPT
UST Branch Update
Branch Chief – Doug Louks

• Introduction
– My background
– IDEM OLC 2015-2017
– UST BC April 2017-present
• Progress since the last FAB meeting
– Implementation of some major changes
– Review of processes and procedures
• Ensure a solid, consistent product
• Maximize efficiency
• Provide effective management of the ELTF
• Interdependence of the sections --- Collaboration
• Section Updates
Underground Storage Tank Section
Thomas F. Newcomb, Chief
Recent Changes to Operations
• Notice of inspections
• Submission of compliance documents
• Shorter inspection
• Start to finish tracking
• Overall decline in number of sites
Changes to UST Rules
• Second notice period ends August 11, 2017
• Incorporating 40 CFR, Part 280 by reference, keeping parts of 329 IAC 9
• USTs for power generation no longer exempt from release detection
• Field constructed tanks and airport hydrant systems no longer exempt
Changes to UST Rules
• Walkthrough inspections
• Sump testing
• Ball float vent valves not allowed on new installation or replacement when defective
• Testing of spill/overfill equipment
• Testing of release detection equipment
Overall Effect
• Reduce costs to the Excess Liability Trust Fund by
– Catching releases earlier
– Better documenting compliance history
– Making owners/operators more aware of compliance requirements

• HEA 1495 Changes (Effective July 1, 2017)
– ELTF Eligibility - Additional Amount (IC 13-23-9-1.3)
• Consider annual fees due from 2014 up to the date an eligible release is discovered (after July 1, 2016)
• Allows for past due fees to be paid prior to submittal of the ISC (within 60 days)
• If all past due fees are paid, no additional amount will be applied
• IDEM will waive the requirement that past due fees be paid before ISC submittal for release discovered between July 1, 2016 but prior to July 1, 2017
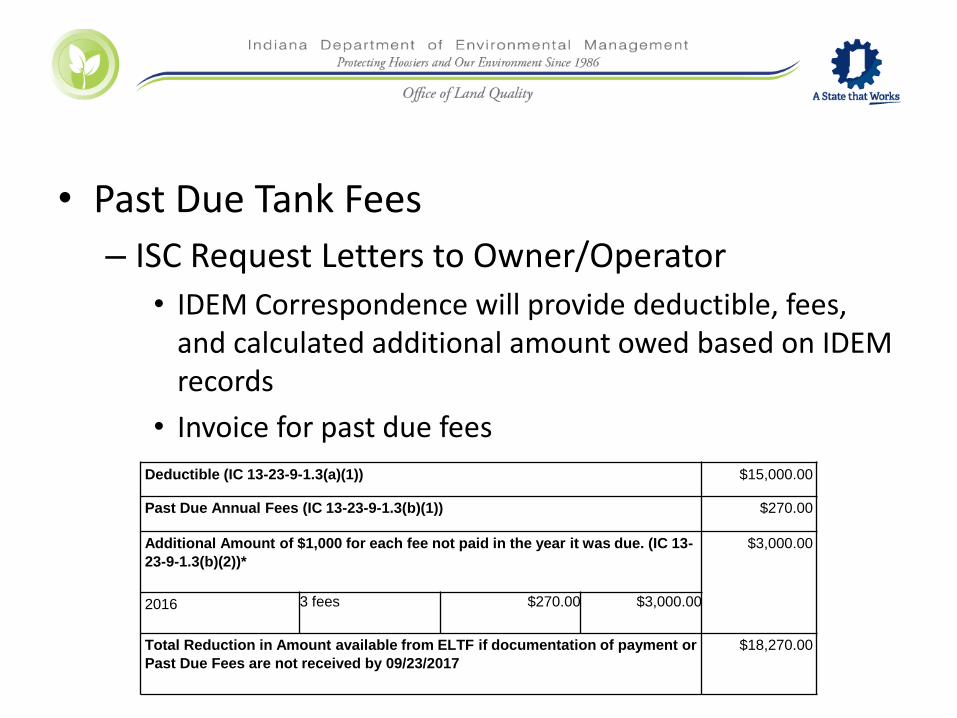
• Past Due Tank Fees
– ISC Request Letters to Owner/Operator
• IDEM Correspondence will provide deductible, fees, and calculated additional amount owed based on IDEM records
• Invoice for past due fees
Deductible (IC 13-23-9-1.3(a)(1)) $15,000.00
Past Due Annual Fees (IC 13-23-9-1.3(b)(1)) $270.00
Additional Amount of $1,000 for each fee not paid in the year it was due. (IC 13-
23-9-1.3(b)(2))*
$3,000.00
2016 3 fees $270.00 $3,000.00
Total Reduction in Amount available from ELTF if documentation of payment or
Past Due Fees are not received by 09/23/2017
$18,270.00
• Eligibility Applications Update
– Eligibility Application Instructions
– ELTF Eligibility Submittals
– Separation of eligibility determination from claims process
– Increase in Eligibility Application Submittals
• LUST Process Updates
– Release Reporting
• Increased Coordination with UST Section– Notification Forms
• Form Updates– Suspected Releases
» Historical/Closed Releases
– Confirmed Releases
» Active Releases

– Site Characterization
• Increased emphasis on developing a strong conceptual site model
• Post approval monitoring
–Corrective Action
• CAPs will no longer be immediately requested for all Releases where Site Characterization is approved
• Reasonable and Necessary
• Cost Effective
• Form/Format finalization 2017
• Communication
– Internal
• UST
• ELTF Claims
– External
• More direct in our correspondence
• Speaking to UST Owners and Operators
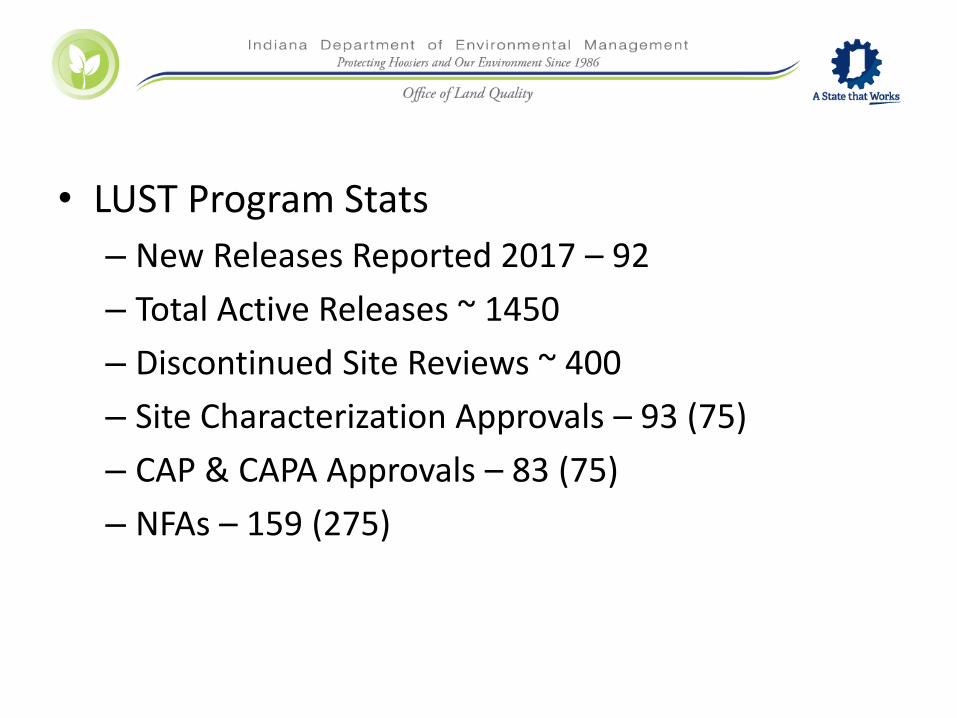
• LUST Program Stats
– New Releases Reported 2017 – 92
– Total Active Releases ~ 1450
– Discontinued Site Reviews ~ 400
– Site Characterization Approvals – 93 (75)
– CAP & CAPA Approvals – 83 (75)
– NFAs – 159 (275)

ELTF Section UpdateFinancial Assurance Board Meeting
August 10, 2017
Brian A. Pace - ELTF Section Chief
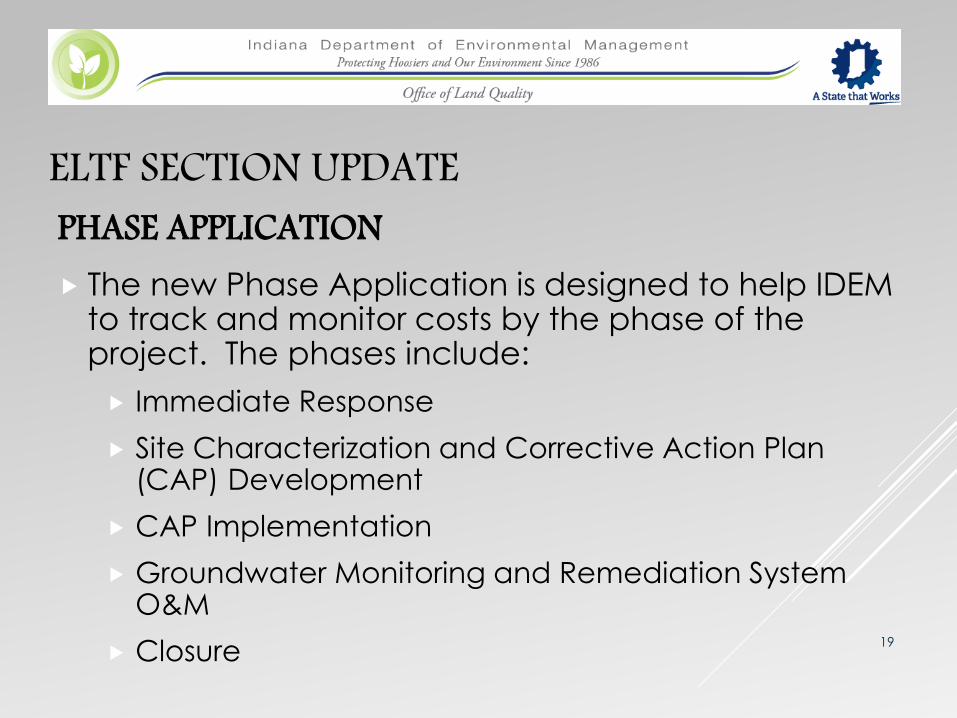
ELTF SECTION UPDATEPHASE APPLICATION The new Phase Application is designed to help IDEM
to track and monitor costs by the phase of the project. The phases include:
Immediate Response
Site Characterization and Corrective Action Plan (CAP) Development
CAP Implementation
Groundwater Monitoring and Remediation System O&M
Closure19
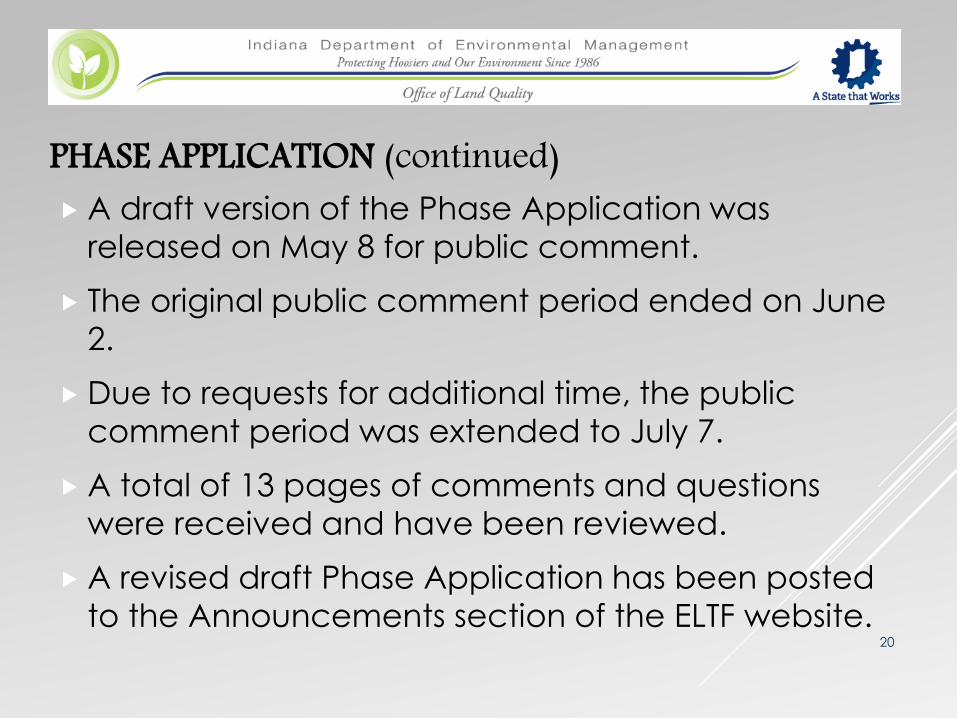
PHASE APPLICATION (continued) A draft version of the Phase Application was
released on May 8 for public comment.
The original public comment period ended on June
2.
Due to requests for additional time, the public
comment period was extended to July 7.
A total of 13 pages of comments and questions
were received and have been reviewed.
A revised draft Phase Application has been posted
to the Announcements section of the ELTF website. 20
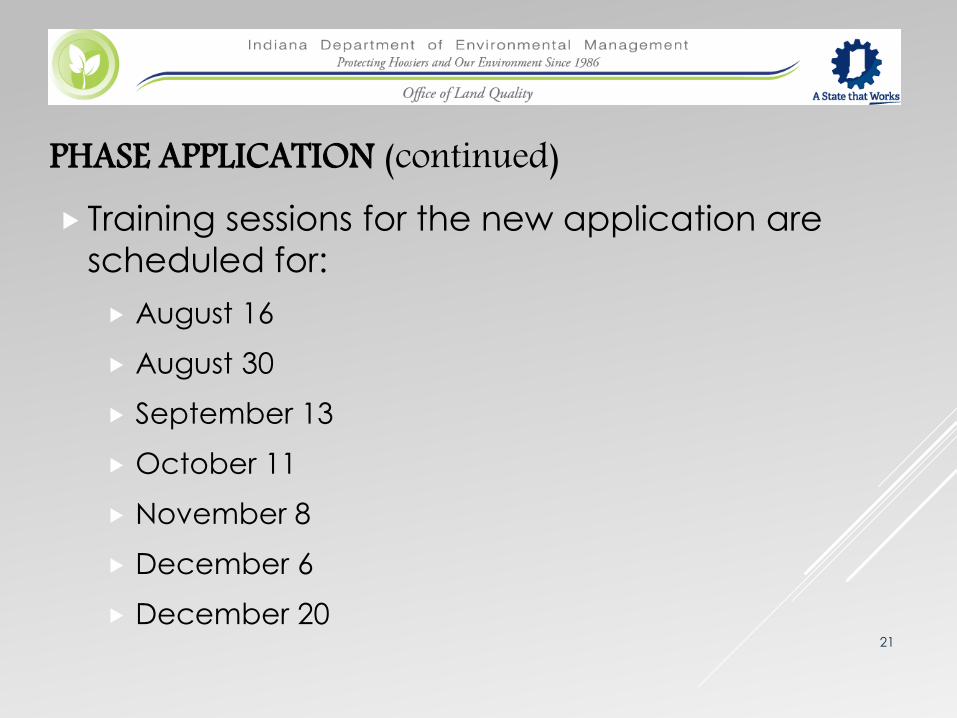
PHASE APPLICATION (continued) Training sessions for the new application are
scheduled for:
August 16
August 30
September 13
October 11
November 8
December 6
December 2021
PHASE APPLICATION (continued)
22
Consultants are strongly encouraged to RSVP and attend these events.
Some of the largest users of ELTF have not yet RSVP'd.
Owners and operators are also welcome to attend and learn more about the program.
If interested in attending
RSVPBobbi Steiff at [email protected]

ERC ANNOUNCEMENT ELTF no longer requires No Further Action (NFA)
status before evaluating Environmental Restrictive
Covenants (ERC) costs for reimbursement.
ERC costs may be submitted for reimbursement
anytime after Site Characterization has been
achieved.
The LUST PM must approve the use of the ERC.
Receipts/invoices from the Office of the Recorder of
the respective county are still required as backup
23
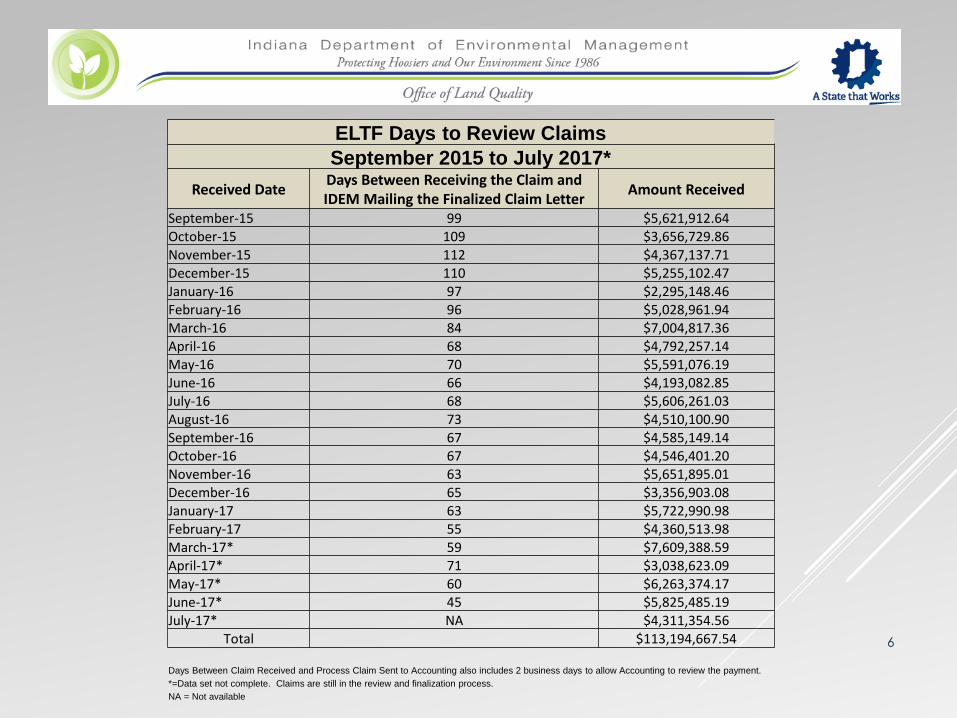
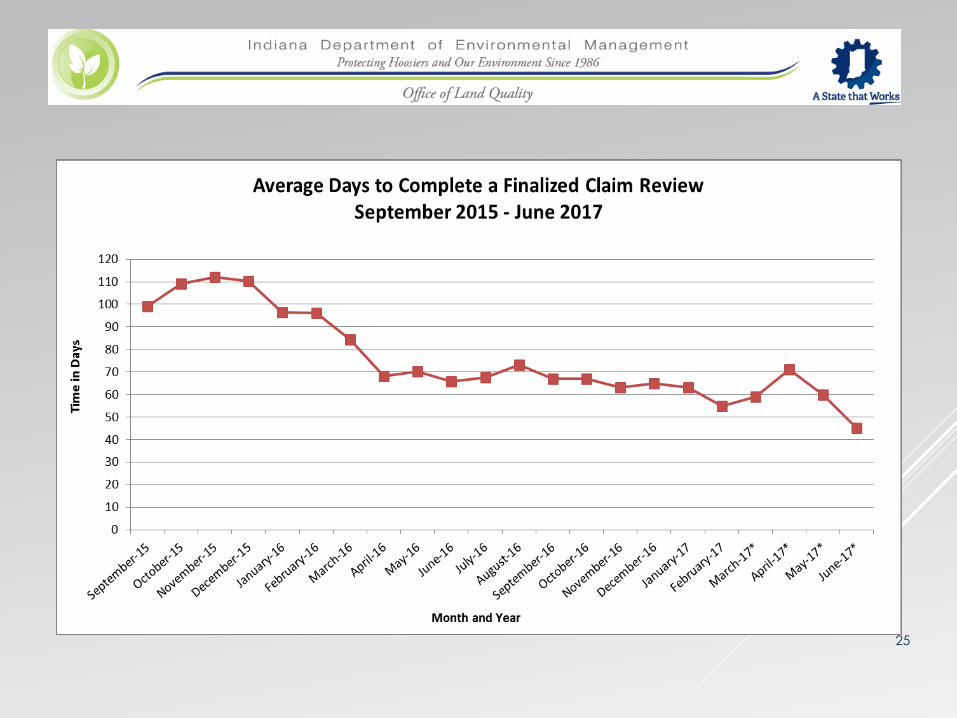
ELTF Days to Review Claims
September 2015 to July 2017*
Received DateDays Between Receiving the Claim and IDEM Mailing the Finalized Claim Letter
Amount Received
September-15 99 $5,621,912.64October-15 109 $3,656,729.86November-15 112 $4,367,137.71December-15 110 $5,255,102.47January-16 97 $2,295,148.46February-16 96 $5,028,961.94March-16 84 $7,004,817.36April-16 68 $4,792,257.14May-16 70 $5,591,076.19June-16 66 $4,193,082.85July-16 68 $5,606,261.03August-16 73 $4,510,100.90September-16 67 $4,585,149.14October-16 67 $4,546,401.20November-16 63 $5,651,895.01December-16 65 $3,356,903.08January-17 63 $5,722,990.98February-17 55 $4,360,513.98March-17* 59 $7,609,388.59April-17* 71 $3,038,623.09May-17* 60 $6,263,374.17June-17* 45 $5,825,485.19July-17* NA $4,311,354.56
Total $113,194,667.54
Days Between Claim Received and Process Claim Sent to Accounting also includes 2 business days to allow Accounting to review the payment.
*=Data set not complete. Claims are still in the review and finalization process.
NA = Not available
6
25

26

27

Where are we going
and
how do we get there?
Where are we going?
• Management of the ELTF
– Interests of the owners
– Good stewardship
• Prevention and Remediation play a role
– More effective communication
– Goal-sharing
• Shared Goals
– Fewer releases
– Proactive project management
+– Faster closures
=– Less burden on the ELTF
How do we get there?
• Prevention – Better compliance, less releases
– New UST Rule provisions
– Red Tag
– New Inspection Process
– Updating Notification Forms
– Enforcement for UST removal
• Aids LUST remediation and costs in the long run
• Remediation – Proactive Project Management and Faster Closures
– More holistic approach
– NFA is the goal
• Risk-based closures
– More proactive
• Remedial strategies and selection
• Cost-effectiveness of corrective action
– VATs: Value-Added Tasks
• Reducing the Burden on the ELTF
– Updating ELTF process
• Faster and more efficient
– ELTF Rule Revision
• Removal of technical milestones
– New ELTF Claims application
• Phase-based approach
• Collection, organization of data
– Allows for real-time analysis of costs.
• FAB Collab!
ELTF Stewardship
• Ensure health and viability of the ELTF
• Provide assurance for cleanups to owners and operators now and in the long-term.
A Shameless Plug
For UST Branch Staff
ELTF Audit--Updates and Process Review
Amy SmithDeputy Assistant Commissioner
Monitoring Costs
Colleen Rennaker
Comparison of Costs in
Indiana vs. Other States
• Quarterly monitoring data collected from actual claims submitted to IDEM
• Data collection occurred from March 31, 2017 to July 14, 2017
• Some data was incomplete
– Monitoring invoiced over several claims
– Incomplete data sets were omitted from the data pool
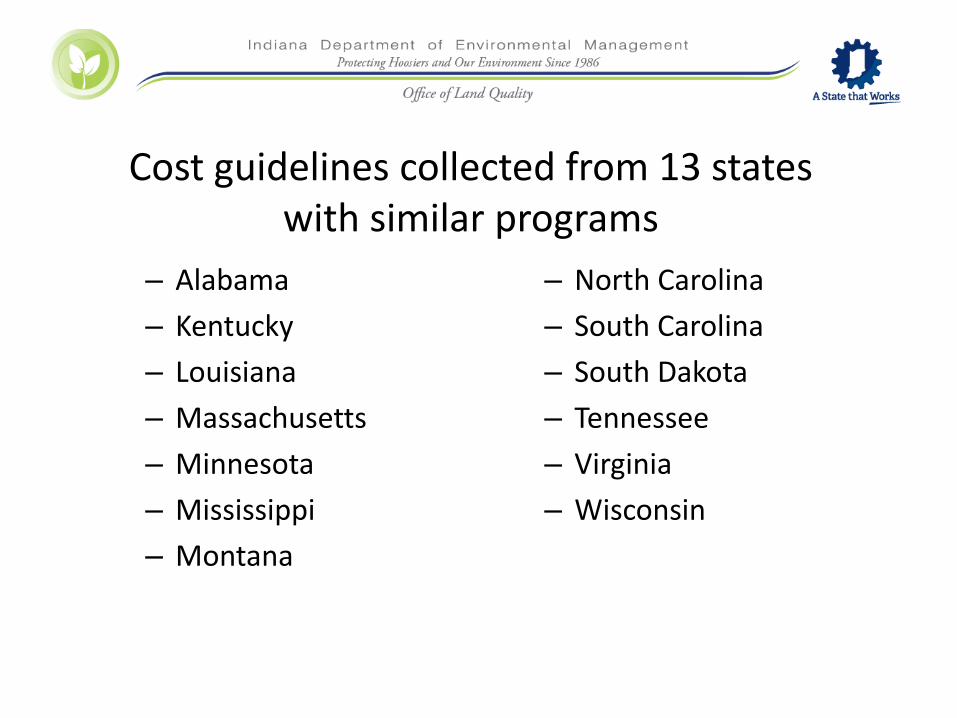
Cost guidelines collected from 13 states with similar programs
– Alabama
– Kentucky
– Louisiana
– Massachusetts
– Minnesota
– Mississippi
– Montana
– North Carolina
– South Carolina
– South Dakota
– Tennessee
– Virginia
– Wisconsin
Sampling Costs
– Cost of sampling 12 monitoring wells
• All events calculated as a “per well” rate
• Includes personnel, equipment, supplies, drum disposal, and travel
• Travel calculated with Indiana’s average mileage per event, 182 miles
• Excludes events with low flow sampling and PAH sampling
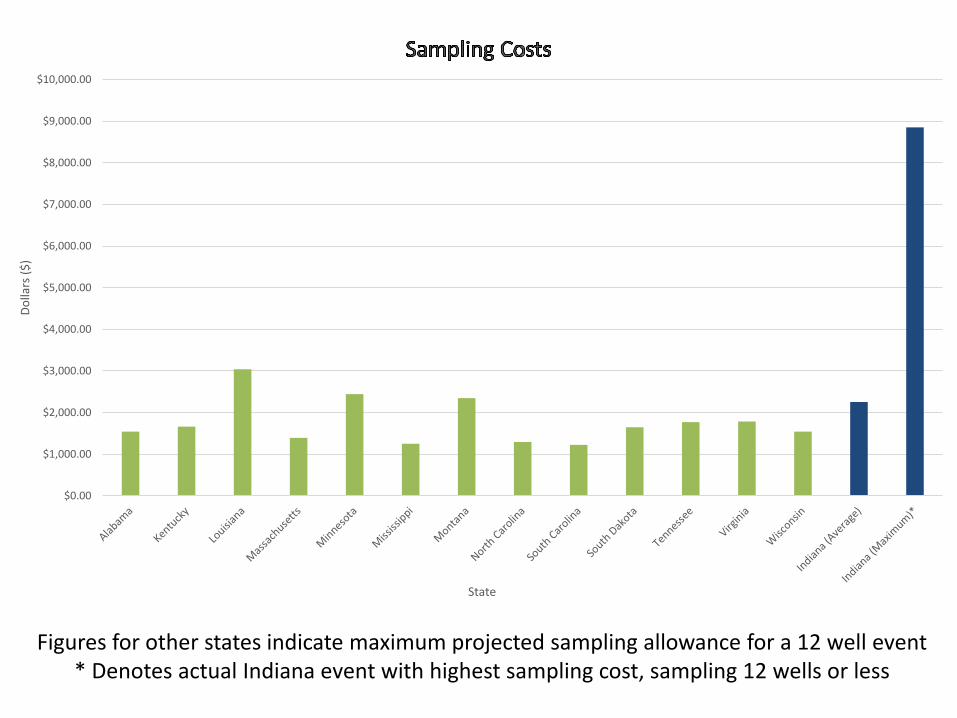
Figures for other states indicate maximum projected sampling allowance for a 12 well event* Denotes actual Indiana event with highest sampling cost, sampling 12 wells or less
$0.00
$1,000.00
$2,000.00
$3,000.00
$4,000.00
$5,000.00
$6,000.00
$7,000.00
$8,000.00
$9,000.00
$10,000.00
Do
llars
($
)
State
Report Writing Costs
– Cost of producing one monitoring report
• Many other states have a maximum rate for monitoring reports
• States with variable rates for reports were omitted from this comparison
• Indiana data is reported as an average of all report writing costs across events
• Includes labor, reproduction, and postage
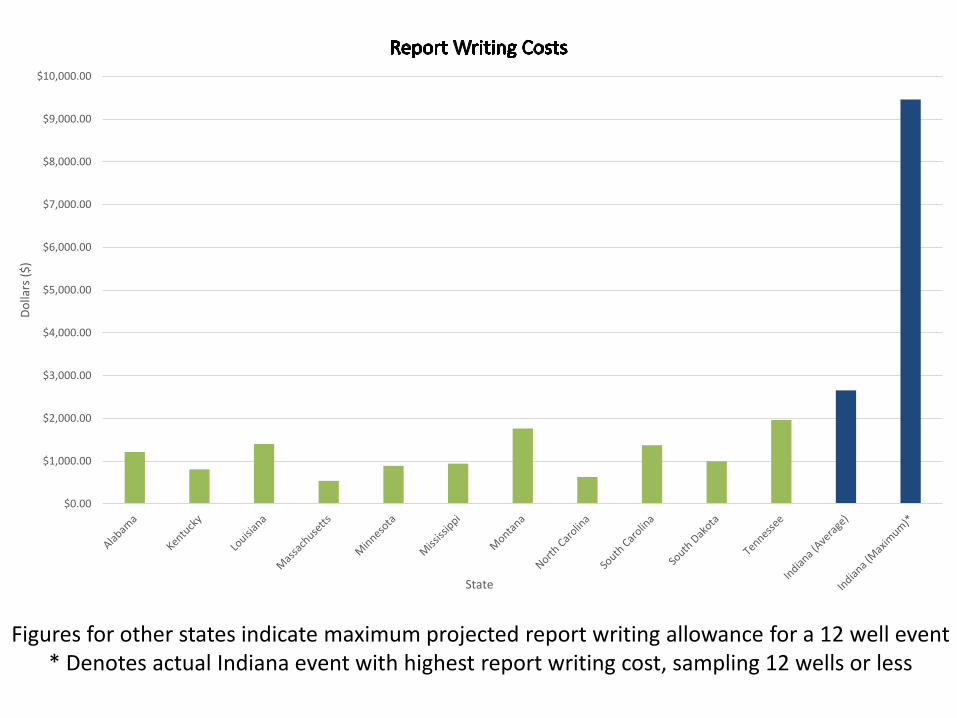
Figures for other states indicate maximum projected report writing allowance for a 12 well event* Denotes actual Indiana event with highest report writing cost, sampling 12 wells or less
$0.00
$1,000.00
$2,000.00
$3,000.00
$4,000.00
$5,000.00
$6,000.00
$7,000.00
$8,000.00
$9,000.00
$10,000.00
Do
llars
($
)
State
Total Event Costs
– For other states:
Sum of projected sampling cost and report writing cost
– For Indiana:
Overall average “per well” rate, projected to an estimated cost of a sampling event with 12 monitoring wells
– All laboratory analytical costs excluded
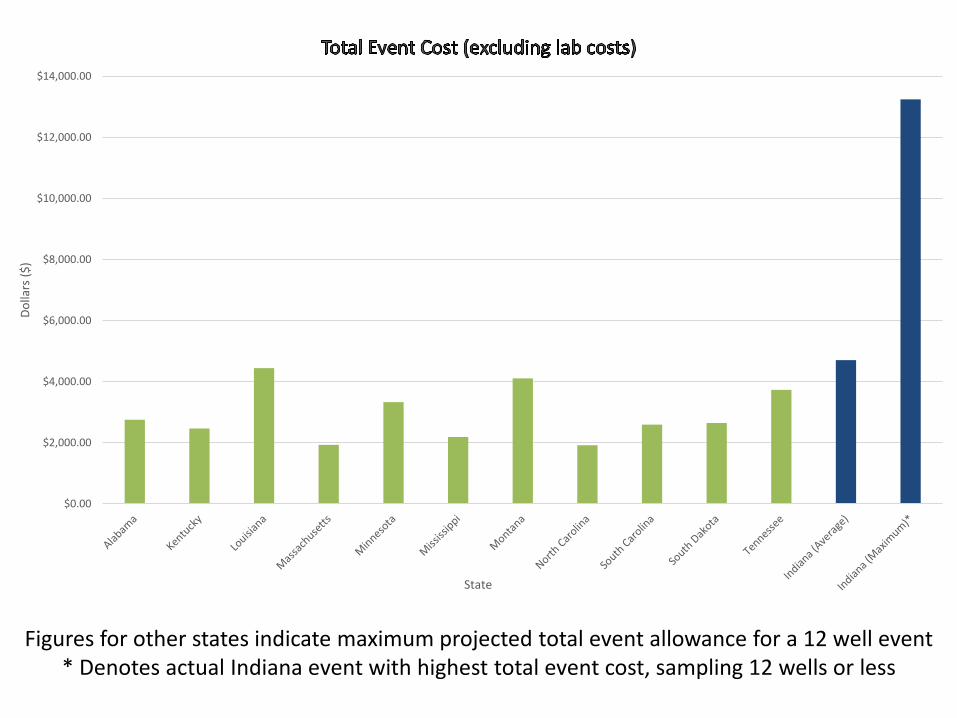
Figures for other states indicate maximum projected total event allowance for a 12 well event* Denotes actual Indiana event with highest total event cost, sampling 12 wells or less
$0.00
$2,000.00
$4,000.00
$6,000.00
$8,000.00
$10,000.00
$12,000.00
$14,000.00
Do
llars
($
)
State
Compared costs submitted from 27 Consultants
• Active
• Alliance
• American
• Arcadis
• Ark
• ATC
• Capital
• Compliance
• Creek Run
• Gannett Fleming
• GES
• Golars
• HydroTech
• Integrated
• IWM
• JT
• New Sesco
• Patriot
• PEC
• Pinnacle Env & Geo
• QEPI
• SES
• Superior
• Terra
• Thompson
• TriCore
• Wilcox
Other States vs. Individual Consultants
– Calculated each consultant’s average cost per monitoring well sampled
– Projected the cost of a monitoring event with 12 monitoring wells
– Compared to other states’ projected event cost, when sampling 12 monitoring wells
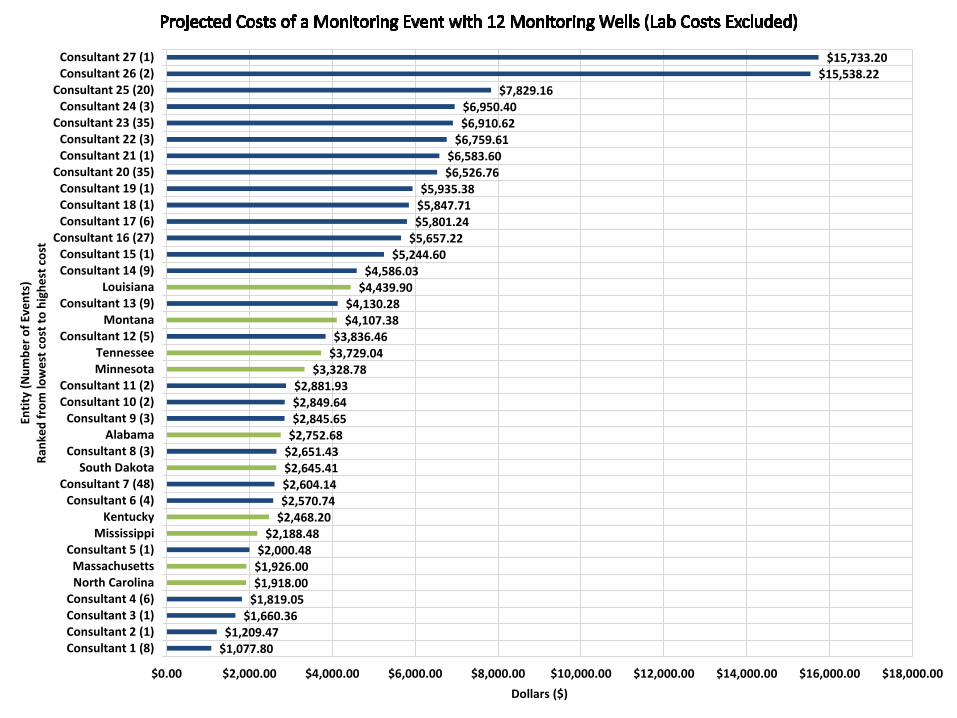
$1,077.80$1,209.47
$1,660.36$1,819.05$1,918.00$1,926.00$2,000.48
$2,188.48$2,468.20$2,570.74$2,604.14$2,645.41$2,651.43$2,752.68$2,845.65$2,849.64$2,881.93
$3,328.78$3,729.04$3,836.46
$4,107.38$4,130.28
$4,439.90$4,586.03
$5,244.60$5,657.22$5,801.24$5,847.71$5,935.38
$6,526.76$6,583.60
$6,759.61$6,910.62$6,950.40
$7,829.16$15,538.22
$15,733.20
$0.00 $2,000.00 $4,000.00 $6,000.00 $8,000.00 $10,000.00 $12,000.00 $14,000.00 $16,000.00 $18,000.00
Consultant 1 (8)Consultant 2 (1)Consultant 3 (1)Consultant 4 (6)
North CarolinaMassachusetts
Consultant 5 (1)Mississippi
KentuckyConsultant 6 (4)
Consultant 7 (48)South Dakota
Consultant 8 (3)Alabama
Consultant 9 (3)Consultant 10 (2)Consultant 11 (2)
MinnesotaTennessee
Consultant 12 (5)Montana
Consultant 13 (9)Louisiana
Consultant 14 (9)Consultant 15 (1)
Consultant 16 (27)Consultant 17 (6)Consultant 18 (1)Consultant 19 (1)
Consultant 20 (35)Consultant 21 (1)Consultant 22 (3)
Consultant 23 (35)Consultant 24 (3)
Consultant 25 (20)Consultant 26 (2)Consultant 27 (1)
Dollars ($)
Enti
ty (
Nu
mb
er
of
Eve
nts
)R
anke
d f
rom
low
est
co
st t
o h
igh
est
co
st
Conclusions• Indiana’s average event cost vs. other states’
maximum event cost
• Indiana monitoring events can cost up to 3x the maximum allowance of surrounding states
• Next steps: Phase Approach Application