using visualization techniques and gamification to involve...
TRANSCRIPT

Using Visualization Techniques and Gamification toInvolve Users in Requirements Elicitation
Diogo Miguel Carreira Duarte(Licenciado)
Dissertacao para obtencao do grau:
Mestre em Engenharia Informatica e de Computadores
Comite de Avaliacao
Presidente: Prof. Doutor Nome do Presidente do JuriOrientador: Prof. Doutor Miguel Mira da SilvaCo-orientador: Prof. Doutor Alberto Rodrigues da SilvaVogais: Prof. Doutor Antonio Rito Silva
Julho de 2012

Abstract
Requirements elicitation is one of the first activities that tries to define the project scope and
elicit user requirements. This activity relies in communication and cooperation between
stakeholders which makes collaboration crucial for the success of this activity, especially in global
software development projects with distributed teams and stakeholders.
Despite the need for collaboration, lack of user input is still one of the problems of requirements
elicitation, having negative consequences on project success. In this work we propose to involve
stakeholders during requirements elicitation through the support of online collaboration and the
usage of visualization techniques and gamification. Requirements visualizations are used to
stimulate stakeholders and increase their awareness about requirements. Social visualization
and gamification of the elicitation activity are used to attempt to motivate the users to participate
in the elicitation activity.
Action research methodology was followed in this work and the results of three research cycles
are presented. It is concluded that social visualization and the gamification of requirements elici-
tation had a positive impact on stimulating user involvement, however requirements visualization
did not have the importance that was initially thought.
Keywords: Requirements Elicitation, Collaboration, User Involvement, Visualization Tech-
niques, Gamification
i


Resumo
Adescoberta de requisitos e uma das primeiras actividades que tenta definir o ambito de
um projecto e descobrir os requisitos dos utilizadores. Esta actividade conta com a comunicacao
e cooperacao entre os stakeholders, o que torna a existencia de colaboracao crucial, espe-
cialmente no desenvolvimento de software global com stakeholders e equipas geograficamente
distribuıdas.
Apesar desta necessidade de colaboracao, a falta de participacao dos utilizadores ainda e um
dos problemas da descoberta de requisitos, com consequencias negativas no sucesso dos pro-
jectos. Neste trabalho propomos envolver os stakeholders na descoberta de requisitos atraves
do suporte de colaboracao online e do uso de tecnicas de visualizacao e da joguetizacao. As
visualizacoes de requisitos sao utilizadas para estimular os stakeholders e aumentar a sua con-
sciencia acerca dos requisitos. A visualizacao social e a gamification da actividade de de-
scoberta de requisitos sao utilizadas numa tentativa de motivar os utilizadores para participar
na descoberta de requisitos.
A metodologia de investigacao Action Research foi utilizada neste trabalho e os resultados
de tres caso de estudos sao apresentados. Conclui-se que o uso da visualizacao social e a
joguetizacao da descoberta de requisitos tiveram um impacto positivo para estimular o envolvi-
mento dos utilizadores. Contudo, as visualizacoes de requisitos nao tiveram a importancia que
era pensava inicialmente.
Keywords: Descoberta de requisitos, Colaboracao, Envolvimento de utilizadores, Tecnicas de
Visualizacao, Gamification
iii


Acknowledgements
Iwould like to thank to my advisor, Professor Miguel Mira da Silva for giving me the opportunity
to work with him, the encouragement and the constant availability to help me. I would also
like to my co-advisor, Professor Alberto Rodrigues da Silva for the availability to help and for his
contributions to this work.
I am grateful for the collaboration and inputs from Carla Farinha and Joao Fernandes that also
contributed for this work.
This work could not have been concluded without the collaboration of those who participated in
the case-studies that were part of the evaluation of this work. I would like to express my gratitude
to them.
I thank my girlfriend Patricia for her support during the entire master’s degree and to my parents
for the constant support and love that they have given to me and also for giving me the chance
to continue my studies without the need to work.
My final acknowledgement is for all my colleagues and friends that have supported me along the
way.
v


Accepted Paper
During the execution of this thesis, one scientific paper was published in an international
conference ranked B in the CORE ERA ranking. The details on the paper follows.
The paper entitled Collaborative Requirements Elicitation with Visualization Techniques (Diogo
Duarte, Carla Farinha, Miguel Mira da Silva, Alberto Rodrigues da Silva) was published at the
21st edition of the IEEE International Workshop on Enabling Technologies and Infrastruc-
tures for Enterprises (WETICE), held between 25th and 27th of June 2012 in Toulouse, France.
vii


Table of Contents
Abstract i
Resumo iii
Acknowledgements v
Accepted Paper vii
Table of Contents xi
List of Tables xiii
List of Figures xv
1 Introduction 1
1.1 Problem . . . . . . . . . . . . . . . . . . . . . . . . . . . . . . . . . . . . . . . . . . 3
1.2 Research Methodology . . . . . . . . . . . . . . . . . . . . . . . . . . . . . . . . . 4
1.3 Research Contributions . . . . . . . . . . . . . . . . . . . . . . . . . . . . . . . . . 5
1.4 Thesis Structure . . . . . . . . . . . . . . . . . . . . . . . . . . . . . . . . . . . . . 6
2 Related Work 9
2.1 Requirements Elicitation . . . . . . . . . . . . . . . . . . . . . . . . . . . . . . . . . 9
2.1.1 Problems in Requirements Elicitation . . . . . . . . . . . . . . . . . . . . . . 10
2.1.2 Benefits from User Involvement . . . . . . . . . . . . . . . . . . . . . . . . . 11
2.2 Techniques and Tools . . . . . . . . . . . . . . . . . . . . . . . . . . . . . . . . . . 11
ix

2.2.1 Group Techniques . . . . . . . . . . . . . . . . . . . . . . . . . . . . . . . . 12
2.2.2 Collaborative Requirements Elicitation . . . . . . . . . . . . . . . . . . . . . 13
2.2.3 Online Tools . . . . . . . . . . . . . . . . . . . . . . . . . . . . . . . . . . . 16
2.3 Visualization of Requirements . . . . . . . . . . . . . . . . . . . . . . . . . . . . . . 18
2.4 Participation in Online Communities . . . . . . . . . . . . . . . . . . . . . . . . . . 19
2.4.1 Social Visualization . . . . . . . . . . . . . . . . . . . . . . . . . . . . . . . 20
2.5 Gamification . . . . . . . . . . . . . . . . . . . . . . . . . . . . . . . . . . . . . . . 20
2.6 Summary . . . . . . . . . . . . . . . . . . . . . . . . . . . . . . . . . . . . . . . . . 21
3 Proposal 23
4 First Research Cycle 25
4.1 Diagnosing . . . . . . . . . . . . . . . . . . . . . . . . . . . . . . . . . . . . . . . . 25
4.2 Action Planning . . . . . . . . . . . . . . . . . . . . . . . . . . . . . . . . . . . . . . 25
4.2.1 Visualization of Requirements . . . . . . . . . . . . . . . . . . . . . . . . . . 26
4.2.2 Social Visualization . . . . . . . . . . . . . . . . . . . . . . . . . . . . . . . 29
4.3 Action Taking . . . . . . . . . . . . . . . . . . . . . . . . . . . . . . . . . . . . . . . 29
4.3.1 Prototype . . . . . . . . . . . . . . . . . . . . . . . . . . . . . . . . . . . . . 30
4.3.2 Case Study A . . . . . . . . . . . . . . . . . . . . . . . . . . . . . . . . . . . 32
4.4 Evaluating . . . . . . . . . . . . . . . . . . . . . . . . . . . . . . . . . . . . . . . . . 32
4.4.1 Results from Case Study A . . . . . . . . . . . . . . . . . . . . . . . . . . . 32
4.5 Specifying Learning . . . . . . . . . . . . . . . . . . . . . . . . . . . . . . . . . . . 35
5 Second Research Cycle 37
5.1 Diagnosing . . . . . . . . . . . . . . . . . . . . . . . . . . . . . . . . . . . . . . . . 37
5.2 Action Planning . . . . . . . . . . . . . . . . . . . . . . . . . . . . . . . . . . . . . . 38
5.3 Action Taking . . . . . . . . . . . . . . . . . . . . . . . . . . . . . . . . . . . . . . . 38
5.3.1 Case Study B . . . . . . . . . . . . . . . . . . . . . . . . . . . . . . . . . . . 38
5.3.2 Prototype Evaluation . . . . . . . . . . . . . . . . . . . . . . . . . . . . . . . 38
5.4 Evaluating . . . . . . . . . . . . . . . . . . . . . . . . . . . . . . . . . . . . . . . . . 39
x

5.4.1 Results from Case Study B . . . . . . . . . . . . . . . . . . . . . . . . . . . 39
5.4.2 Log . . . . . . . . . . . . . . . . . . . . . . . . . . . . . . . . . . . . . . . . 43
5.4.3 Results from Prototype Evaluation . . . . . . . . . . . . . . . . . . . . . . . 44
5.5 Specifying Learning . . . . . . . . . . . . . . . . . . . . . . . . . . . . . . . . . . . 45
6 Third Research Cycle 47
6.1 Diagnosing . . . . . . . . . . . . . . . . . . . . . . . . . . . . . . . . . . . . . . . . 47
6.2 Action Planning . . . . . . . . . . . . . . . . . . . . . . . . . . . . . . . . . . . . . . 47
6.3 Action Taking . . . . . . . . . . . . . . . . . . . . . . . . . . . . . . . . . . . . . . . 48
6.3.1 Game Design . . . . . . . . . . . . . . . . . . . . . . . . . . . . . . . . . . . 48
6.3.2 Prototype . . . . . . . . . . . . . . . . . . . . . . . . . . . . . . . . . . . . . 50
6.3.3 Case Study C (”In paper”) . . . . . . . . . . . . . . . . . . . . . . . . . . . . 53
6.3.4 Case Study D (Prototype) . . . . . . . . . . . . . . . . . . . . . . . . . . . . 53
6.3.5 Feedback . . . . . . . . . . . . . . . . . . . . . . . . . . . . . . . . . . . . . 53
6.4 Evaluating . . . . . . . . . . . . . . . . . . . . . . . . . . . . . . . . . . . . . . . . . 55
6.4.1 Feedback from Case Study C . . . . . . . . . . . . . . . . . . . . . . . . . . 56
6.4.2 Feedback from Case Study D . . . . . . . . . . . . . . . . . . . . . . . . . . 57
6.5 Specifying Learning . . . . . . . . . . . . . . . . . . . . . . . . . . . . . . . . . . . 59
7 Conclusion 61
7.1 Future Work . . . . . . . . . . . . . . . . . . . . . . . . . . . . . . . . . . . . . . . . 64
Bibliography 65
Appendices 71
A Questionnaire Used in First and Second Research Cycles 71
B Questionnaire Used in Second Research Cycle For Prototype Evaluation 73
C Questionnaires Used in the Third Research Cycle 75
xi


List of Tables
1.1 Case Studies . . . . . . . . . . . . . . . . . . . . . . . . . . . . . . . . . . . . . . . 6
4.2 Contributions per user (case study A) . . . . . . . . . . . . . . . . . . . . . . . . . 32
4.3 Classification of the proposed requirements visualizations (case study A) . . . . . 33
5.4 Contributions per user (case study B) . . . . . . . . . . . . . . . . . . . . . . . . . 40
5.5 Classification of the proposed requirements visualizations (case study B) . . . . . 41
5.6 Number of accesses to each requirements visualization per user (case study B) . 43
5.7 Number of accesses to the remaining web-pages per user (case study B) . . . . . 44
5.8 Results from proposed requirements visualization evaluation (2nd cycle) . . . . . . 44
5.9 Results from goal-based evaluation prototype’s goal-based evaluation of IT system
as such (2nd cycle) . . . . . . . . . . . . . . . . . . . . . . . . . . . . . . . . . . . . 44
6.10 Mapping the ”six thinking hats” to game activities . . . . . . . . . . . . . . . . . . . 49
6.11 Game scoring scheme . . . . . . . . . . . . . . . . . . . . . . . . . . . . . . . . . . 50
6.12 Results from case study C . . . . . . . . . . . . . . . . . . . . . . . . . . . . . . . . 55
6.13 Contributions per user (case study C) . . . . . . . . . . . . . . . . . . . . . . . . . 55
6.14 Results from case study D . . . . . . . . . . . . . . . . . . . . . . . . . . . . . . . . 55
6.15 Contributions per user (case study D) . . . . . . . . . . . . . . . . . . . . . . . . . 56
6.16 Players’ questionnaire results (case study C) . . . . . . . . . . . . . . . . . . . . . 56
6.17 Project manager and project owner’s questionnaire results (case study C) . . . . . 57
6.18 Players’ questionnaire results (case study D) . . . . . . . . . . . . . . . . . . . . . 57
6.19 Project manager’s questionnaire results (case study D) . . . . . . . . . . . . . . . 58
7.20 Classification of the proposed requirements visualizations (case studies A and B) . 62
xiii


List of Figures
1.1 Relative cost to correct a requirement defect depending on when it is discovered . 3
1.2 Action Research Methodology . . . . . . . . . . . . . . . . . . . . . . . . . . . . . 5
2.3 CoREA . . . . . . . . . . . . . . . . . . . . . . . . . . . . . . . . . . . . . . . . . . 15
2.4 Athena . . . . . . . . . . . . . . . . . . . . . . . . . . . . . . . . . . . . . . . . . . . 16
2.5 Mindmap with requirements . . . . . . . . . . . . . . . . . . . . . . . . . . . . . . . 19
2.6 Paper prototype example . . . . . . . . . . . . . . . . . . . . . . . . . . . . . . . . 19
4.7 Requirements with more votes chart (top 10) . . . . . . . . . . . . . . . . . . . . . 26
4.8 Treemap First Level . . . . . . . . . . . . . . . . . . . . . . . . . . . . . . . . . . . 27
4.9 Treemap Second Level . . . . . . . . . . . . . . . . . . . . . . . . . . . . . . . . . . 27
4.10 3D Tag Cloud . . . . . . . . . . . . . . . . . . . . . . . . . . . . . . . . . . . . . . . 28
4.11 Motion Chart . . . . . . . . . . . . . . . . . . . . . . . . . . . . . . . . . . . . . . . 28
4.12 Bubble Chart for Social Visualization . . . . . . . . . . . . . . . . . . . . . . . . . . 29
4.13 Prototype Domain Model . . . . . . . . . . . . . . . . . . . . . . . . . . . . . . . . 30
4.14 Contributions per day (1st cycle) . . . . . . . . . . . . . . . . . . . . . . . . . . . . 33
4.15 Classification of visualizations (case study A) . . . . . . . . . . . . . . . . . . . . . 33
4.16 Frequency of access to the elicitation platform (case study A) . . . . . . . . . . . . 34
4.17 Reasons to participate (case study A) . . . . . . . . . . . . . . . . . . . . . . . . . 34
4.18 Potential motivations to participate (case study A) . . . . . . . . . . . . . . . . . . . 35
5.19 Contributions per day (case study B) . . . . . . . . . . . . . . . . . . . . . . . . . . 40
5.20 Classification of visualizations (case study B) . . . . . . . . . . . . . . . . . . . . . 41
5.21 Frequency of access to the elicitation platform (case study B) . . . . . . . . . . . . 42
xv

5.22 Reasons to participate (case study B) . . . . . . . . . . . . . . . . . . . . . . . . . 42
5.23 Potential motivations to participate (case study B) . . . . . . . . . . . . . . . . . . . 42
6.24 Prototype Domain Model (3rd cycle) . . . . . . . . . . . . . . . . . . . . . . . . . . 50
6.25 Screen to choose a project . . . . . . . . . . . . . . . . . . . . . . . . . . . . . . . 51
6.26 Gaming screen after choosing a project . . . . . . . . . . . . . . . . . . . . . . . . 52
6.27 Insert a requirement (3rd cycle) . . . . . . . . . . . . . . . . . . . . . . . . . . . . . 52
6.28 Rating a requirement with stars . . . . . . . . . . . . . . . . . . . . . . . . . . . . . 52
6.29 Game evaluation by players (case study C) . . . . . . . . . . . . . . . . . . . . . . 57
6.30 Game evaluation by players (case study D) . . . . . . . . . . . . . . . . . . . . . . 58
xvi

Chapter 1
Introduction
Information systems projects are shaped by requirements (Avison & Fitzgerald, 2006). Ac-
cording to the IEEE (IEEE, 1990) a requirement is: (1) A condition or capability needed by a
user to solve a problem or achieve an objective; (2) A condition or capability that must be met
or possessed by a system or system component to satisfy a contract, standard, specification, or
other formally imposed documents; (3) A documented representation of a condition or capability
as in (1) or (2).
Requirements Engineering (RE) deals with requirements development and requirements man-
agement (Wiegers, 2003). The first activity of requirements development is requirements elici-
tation that is followed by requirements analysis, requirements specification and validation of re-
quirements.
Requirements elicitation is a critical activity in RE. This activity’s goal is to understand the stake-
holders’ needs and constraints, which will be analysed and specified with requirements (Wiegers,
2003). User requirements include tasks that the users need the system to support and their ex-
pectations about performance and other quality attributes.
For the success of this activity communication and collaboration between the stakeholders is
essential, since communication problems and conflicts between stakeholders that occur (Zowghi
& Coulin, 2005). The worldwide distribution of teams and stakeholders reinforce the need for
collaboration and communication support in RE (Damian, 2007) (Herbsleb, 2007).
Despite the need for collaboration, lack of user involvement continues to be a problem related
to requirements elicitation (Wiegers, 2003) (Naz & Khokhar, 2009) (Kujala et al., 2005) (Group,
2009). This problem can lead to requirements that are identified in later phases of development,
delaying the project and demanding the need of code rewriting (Wiegers, 2003) (Naz & Khokhar,
1

2009). Another reason for involving users is that sometimes customers are more worried with
financial facts while users are experts in their domain and know what tasks need to be supported
by the system (Kujala et al., 2005).
Benefits of user involvement in requirements elicitation have been pointed out, such as higher
requirements quality, documentation of essential customer and user needs, political conflict re-
duction and higher acceptance of the system (Kujala et al., 2005) (Kujala, 2003) (El Emam &
Madhavji, 1995).
In our research we intend to involve users in requirements elicitation through an online collabo-
rative approach. However online communities also suffer from lack of user involvement (Beenen
et al., 2004) so we consider the use of visualization techniques and game elements to motivate
and engage the users to participate in requirements elicitation.
Data might be represented through the use of visualization (Gotel et al., 2007) and this can be a
mean to achieve better understanding of the identified requirements. This representation can also
increase the awareness of an individual about the data and attributes related to the requirements
like priority or cost that can be added to a requirements visualization.
Social visualization has been used to stimulate user involvement in online communities (Cheng
& Vassileva, 2005) (Gilbert & Karahalios, 2009). This kind of visualization provides a mem-
ber’s social involvement in a community like information about the presence or activities per-
formed(Erickson, 2003).
Game elements like goals and scores have been used to encourage user motivation and partici-
pation in several activities (Fitz-Walter et al., 2011) (Landers & Callan, 2011) (Thom et al., 2012).
The usage of these elements in an activity that is different from a real game has given origin to
the term gamification (Deterding et al., 2011a).
In order to increase the stakeholders’ perception of requirements and their motivation to be in-
volved in the elicitation activity, we propose the usage of the previously mentioned visualization
techniques and game elements. These techniques are proposed because at each project we
will be creating an online community to elicit requirements and a problem of online communities
is lack of participation (Beenen et al., 2004), which combined with lack of user involvement in
requirements elicitation (Kujala et al., 2005), (Naz & Khokhar, 2009) justifies the need to moti-
vate the stakeholders for this activity. Difficulties to motivate the stakeholders for requirements
elicitation have also been pointed out (Kujala, 2003).
2

1.1 Problem
Requirements elicitation has the objective of learning and understanding the needs of users and
project sponsors (Zowghi & Coulin, 2005). This activity relies on collaboration and communication
and is seen as a difficult, critical and error prone activity (Wiegers, 2003). Effective requirements
elicitation is very important, because it is probable that if the customers’ real requirements are
not discovered, they will not be satisfied with the final system. Customers also have difficulties in
expressing their needs, conflicts can also occur during elicitation if two individuals have opposite
ideas (Kotonya & Sommerville, 1998). Problems related to requirements can originate the need
of rework (Wiegers, 2003). Figure 1 shows that correcting a requirements mistake become more
expensive as projects get in more advanced stages.
Figure 1.1: Relative cost to correct a requirement defect depending on when it is discovered (Wiegers,2000)
In 1994, The Standish Group produced its first report on project success and user involvement
has been pointed as the main projects success factor (Group, 1994). These issues remain un-
changed according to a report from the same organization in 2009 (Group, 2009). Problems
related to user involvement and participation have also been referred by various authors (Kujala
et al., 2005), (Naz & Khokhar, 2009), (Wiegers, 2003) and (Kotonya & Sommerville, 1998). This
problem was also stated in web based requirements elicitation (Farinha & Mira da Silva, 2011a).
Consequences of poor user involvement in the requirements elicitation process can be the need
for code rewriting (Naz & Khokhar, 2009), late-breaking requirements that can delay project com-
pletion (Wiegers, 2003) and requirements of bad quality (Kujala et al., 2005).
3

Lack of user involvement is a problem in requirements elicitation. This problem has conse-
quences on project costs and requirements quality. Additionally, some benefits of user involve-
ment have been pointed out by research like higher rates of system acceptance and conflict
reduction (Kujala, 2003) (El Emam & Madhavji, 1995).
1.2 Research Methodology
Action research is the research methodology that will be used in this thesis. This research
methodology is composed of five stages: (Baskerville, 1999)
• Diagnosing – The problem is identified.
• Action Planning – Specification of the actions that should improve the problems diagnosed.
• Action Taking – The designed plan is implemented.
• Evaluating – After the actions are completed the outcomes are evaluated. In this step it is
also evaluated if the problem has been relieved.
• Specifying Learning – This is usually an ongoing process independent from the success of
the activities performed the knowledge can be directed to three audiences:
– Restructuring the organizational norms to reflect the new knowledge gained during the
research.
– If the change is unsuccessful the new knowledge can provide foundations for diagnos-
ing and perform new experiments.
– The success or failure of the work performed provides important knowledge for the
scientific community for future research.
These stages are also illustrated in Figure 1.2. The action research cycle can continue whether
the results obtained from the action taking phase were successful or not, in order to develop
further knowledge about the organization and the validity of relevant theoretical frameworks
(Baskerville, 1999).
4

Action Research
Diagnosing
Action Planning
Action Taking
Evaluating
Specifying Learning
Figure 1.2: Action Research Methodology
1.3 Research Contributions
This document proposes the elicitation of requirements in a collaborative way in order to involve
more stakeholders in this activity. Given the problem of lack of user involvement in this activity we
also propose the use of visualization techniques and game techniques to involve the stakeholders
in this activity. So, the research questions that we address are:
• Social visualization can be used to stimulate user involvement in requirements elici-
tation?
• Gamification of requirements elicitation activity stimulates user involvement?
• Requirements visualization techniques can be used to stimulate user involvement in
requirements elicitation?
Considering this research question, the main contributions of this dissertation are:
• The proposal to elicit requirements collaboratively and to use visualization techniques and
gamification in order to stimulate user involvement
• The implementation of a prototype to support collaborative requirements elicitation the sup-
port the proposal
• The evaluation of the proposal through different different case studies where requirements
5

were elicited and feedback from the participants was obtained regarding the proposed vi-
sualization and games techniques
• The evaluation of the prototype that was made in the second research cycle
The case studies are described in Table 1.1.
Table 1.1: Case Studies
Case Study 1 Case Study 2 Case Study 3 Case Study 4Res. Cycle 1 2 3 3Organization Sports Betting Fo-
rumSINFO1 Childcare center IST-UTL
Participants Forum’s Modera-tors (6)
Students that orga-nize the event (14)
Company’s work-ers (7)
Students (17)
Respondents 7 11 7 12Prototype Used Yes Yes No YesGoal Evaluate visualiza-
tion techniquesEvaluate visualiza-tion techniques
Evaluate gamifica-tion
Evaluate gamifica-tion
Date 12-2011 02-2012 04-2012 04-2012
After each case study a survey was made to obtain the participants’ feedback, that enabled
us to conclude that some of the proposed techniques can be used to engage stakeholders in
requirements elicitation.
During the execution of this thesis, one scientific paper was published in an international confer-
ence ranked B in the CORE ERA ranking. The details on the paper, conference name and rank
follows:
• Collaborative Requirements Elicitation with Visualization Techniques (Duarte et al., 2012)
was published at the 21st edition of the IEEE International Workshop on Enabling Tech-
nologies and Infrastructures for Enterprises (WETICE) - rank B conference.
1.4 Thesis Structure
This document is structured in seven chapters:
1. Introduction: This chapter focuses on the general context of this work, the research
methodology used in the work and the problem where it fits in
2. Related Work: The second chapter describes requirements elicitation and some problems
of this activity. Techniques and approaches for collaborative requirements elicitation are
6

mentioned. Some works focused on participation in online communities and gamification
are also included
3. Proposal: Presents the initial proposal for this work
4. First Research Cycle: Description of the first research cycle that was evaluated with a
case study
5. Second Research Cycle: The fifth chapter describes the second research cycle that was
evaluated with another case study. The work developed in this cycle is the one that is
included in the scientific publication mentioned in the previous section
6. Third Research Cycle: Description of a second proposal where gamification of require-
ments elicitation was used and evaluated with two different case studies
7. Conclusion: The last chapter presents the conclusions of this and proposals for future
work
7


Chapter 2
Related Work
This chapter introduces several issues of requirements elicitation and some of its problems
and benefits from the user involvement point of view. Different approaches for require-
ments elicitation and for requirements visualization are also described. Since we propose to elicit
requirements with an online collaborative platform we also introduce participation in online com-
munities, namely related to the use of social visualization, which is part of our proposal and has
been used as a way to increase user participation.
2.1 Requirements Elicitation
Requirements elicitation (or requirements discovery), is a complex activity where system devel-
opers and engineers work with customers and end-users in order to discover the problem to be
solved and other system attributes like performance or hardware constraints (Kotonya & Som-
merville, 1998). This is a complex process because customers have difficulties describing their
needs and also conflicting requirements can arise from different people within the same organi-
zation (Kotonya & Sommerville, 1998).
The goals of the requirements elicitation activity are (1) Identification of relevant requirements
sources; (2) Elicitation of existing requirements from the identified sources and (3) Development
of new and innovative requirements (Pohl, 2010).
Elicitation involves a set of activities that are supported in communication, prioritization, negotia-
tion, and collaboration with all the relevant stakeholders (Zowghi & Coulin, 2005).
Different techniques and approaches for requirements elicitation have been studied and used
over time. The available time and resources that the requirements engineer possesses influence
9

the choice of the elicitation technique to be chosen. Another factor is the kind of information
that will be elicited (Nuseibeh & Easterbrook, 2000). The various elicitation approaches in the
following classes: (Nuseibeh & Easterbrook, 2000)
• Traditional techniques: questionnaires, surveys, interviews and analysis of existing docu-
mentation
• Group elicitation techniques, like Brainstorm, Joint Application Development and Focus
Group
• Prototyping
• Model-driven techniques, includes goal-based and scenario-based methods
• Cognitive techniques, like protocol analysis and card sorting
• Contextual techniques: ethnographic techniques like participant watching and conversation
analysis
Requirements elicitation is a difficult activity that involves collaboration between customers and
system developers in order to identify what are the boundaries for a system. There is a group of
different techniques and approaches that can be used in elicitation. Time and resources available
for elicitation can influence the choice of a technique.
2.1.1 Problems in Requirements Elicitation
A frequent and major cause of information systems failure is mistakes made in elicitation (Davey
& Cope, 2008).
Requirements elicitation problems are a research area that has produced some literature and
results. The problems in requirements elicitation have been grouped in six areas: (Tsumaki &
Tamai, 2006)
• Incomplete requirements
• Incorrect requirements
• Ambiguous requirements
• Inconsistent requirements
• Unfixed requirements
• Excessive requirements
10

The requirements elicitation activity is also negatively influenced by communication issues (Ma-
credie & Coughlan, 2002). Group communication problems have also been identified by research
and grouped in three different areas such as ineffective communication channels, restrictive no-
tation languages and social and organisational factors (Al-Rawas & Easterbrook, 1996).
Issues related to communication issues can origin a lack of appropriate knowledge or shared un-
derstanding around requirements, making them inappropriate and incomplete (Kotonya & Som-
merville, 1998) (Macredie & Coughlan, 2002).
2.1.2 Benefits from User Involvement
As stated in 1.1 lack of user involvement is a problem in requirements elicitation. User involve-
ment is a general term used to describe direct contact with users and covering many approaches
(Kujala et al., 2005).
Requirements quality is improved by user participation, which can be the highest level of involve-
ment as users are usually participating in the actual development work inside the development
organization (Kujala et al., 2005). Sometimes customers are also more worried with financial
facts while users are experts in their domain and know what tasks need to be supported by the
system.
A literature and studies review has been done and is concluded that the expected benefits of user
involvement in the early phases of requirements engineering are more accurate user require-
ments, avoiding costly system features that the user did not want or cannot use and improved
level of acceptance of the system (Kujala, 2003).
Another study on requirements engineering processes for information systems has also high-
lighted the benefits from user participation such as less rework of the documentation items since
the users took part in their generation and approval, greater fit of the recommended solution
to the organization, Political conflicts reduction among users, early user ”buy-in” into the system,
reduced probability of sabotage or users trying to defeat the system (El Emam & Madhavji, 1995).
Research results state that user involvement has a positive effect on requirements quality and
increases the probability of acceptance of the system.
2.2 Techniques and Tools
Requirements elicitation involves communication, prioritization, negotiation and communication
with stakeholders (Zowghi & Coulin, 2005).
11
The relevance of user involvement in requirements elicitation has been stated inrefsec:Problem
and 2.1.2. This section introduces approaches for user involvement. These approaches can
be categorized into group or collaborative techniques, online tools that allow making elicitation
without the need of personal meetings and games that are a more recent approach for elicitation.
2.2.1 Group Techniques
One way to involve users in requirements elicitation is to promote group meetings (Zowghi &
Coulin, 2005). The promotion of cooperation and the commitment of stakeholders are the main
reasons for the effectiveness of these techniques. For these meetings to be successful it is
necessary that stakeholders feel comfortable and able to speak openly and honestly, making
them these techniques less effective in highly political situations (Zowghi & Coulin, 2005).
An issue associated with these sessions can be the difficulty to organize and schedule the meet-
ing due to the number of different stakeholders that may be involved in the project (Zowghi &
Coulin, 2005).
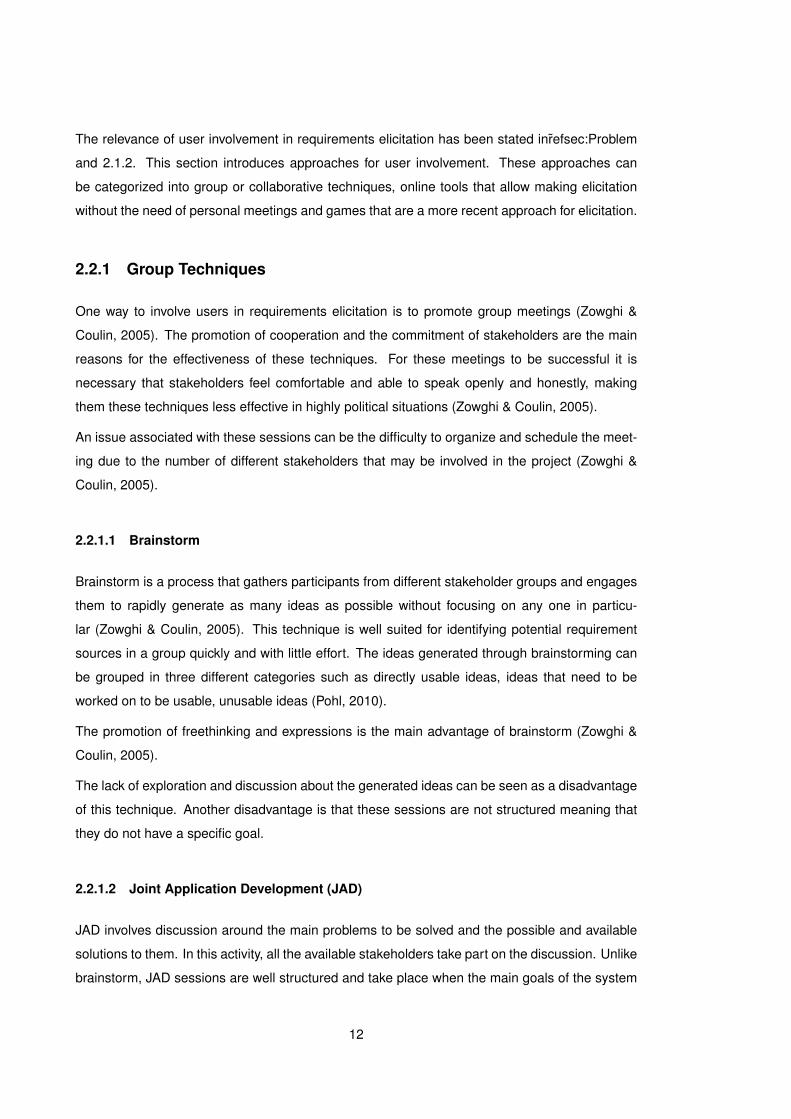
2.2.1.1 Brainstorm
Brainstorm is a process that gathers participants from different stakeholder groups and engages
them to rapidly generate as many ideas as possible without focusing on any one in particu-
lar (Zowghi & Coulin, 2005). This technique is well suited for identifying potential requirement
sources in a group quickly and with little effort. The ideas generated through brainstorming can
be grouped in three different categories such as directly usable ideas, ideas that need to be
worked on to be usable, unusable ideas (Pohl, 2010).
The promotion of freethinking and expressions is the main advantage of brainstorm (Zowghi &
Coulin, 2005).
The lack of exploration and discussion about the generated ideas can be seen as a disadvantage
of this technique. Another disadvantage is that these sessions are not structured meaning that
they do not have a specific goal.
2.2.1.2 Joint Application Development (JAD)
JAD involves discussion around the main problems to be solved and the possible and available
solutions to them. In this activity, all the available stakeholders take part on the discussion. Unlike
brainstorm, JAD sessions are well structured and take place when the main goals of the system
12

have already been established (Zowghi & Coulin, 2005).
Three organizations that used JAD across twenty projects have been studied (Davidson, 1999).
The study showed that JAD is a time consuming activity and user participation is constrained to
the limited time that participants have available. This research also found that this technique is
more effective in small sized projects.
Davidson also recognizes that few companies were studied and that the results might be different
in a larger study.
2.2.1.3 Focus Group
Focus groups are group sessions oriented by a moderator. These sessions have a clear goal
that has been defined prior to the meeting, on this technique a panel of stakeholders focus on a
chosen item to identify the requirements regarding the selected item (Pohl, 2010).
This technique has the advantage of allowing more natural interactions between people than
questionnaires or interviews (Goguen & Linde, 1993). An experienced moderator is required, in
order to keep the discussion at the right level of intensity and extract the requirements from the
discussion (Pohl, 2010) (Farinha & Mira Silva, 2009).
User dominance can be a disadvantage of the usage of this technique, meaning that less partic-
ipative members can refrain from expressing their opinions and ideas based on dominant mem-
bers’ opinions (Pohl, 2010). The user dominance problem and the need of an experienced moder-
ator have been confirmed by other research works (Goguen & Linde, 1993) (Farinha & Mira Silva,
2009).
2.2.2 Collaborative Requirements Elicitation
2.2.2.1 WinWin
Theory W or WinWin defends that success in projects can only be achieved if the customers
and user of the project are winners, meaning that everyone has expressed their opinion and win
conditions and a consensus on those win conditions has been reached (Boehm & Ross, 1989).
The negotiation model guides success-critical stakeholders in elaborating mutually satisfactory
agreements: Win conditions are expressed by stakeholders, as the specification of stakehold-
ers’ goals. If every stakeholder concurs with that goal, the win conditions become agreements
(Boehm et al, 2001). When stakeholders do not reach consensus, they identify their conflicted
win conditions and register their conflicts as issues. After that, stakeholders invent options for
13

mutual gain and explore the trade-offs of each option.
When there are no outstanding issues, and all stakeholders win conditions are covered by agree-
ments, a WinWin equilibrium condition has been achieved (Boehm et al, 2001). The steps of
WinWin are: (Boehm & Ross, 1989)
• Establish a set of win-win preconditions
– Understand how people want to win
– Establish reasonable expectations
– Match people’s tasks to their win conditions
– Provide a supportive environment
• Structure a win-win software process
– Establish a realistic process plan
– Use the plan to control the project
– Identify and manage your win-lose or lose-lose risks
– Keep people involved
• Structure a win-win software product
– Match product to users’, maintainers’ win conditions
2.2.2.2 EasyWinWin
EasyWinWin is based on WinWin and involves key stakeholders interaction in requirements def-
inition (Grunbacher & Boehm, 2001). EasyWinWin uses group facilitation techniques, electronic
brainstorming and voting, that are supported by collaborative tools. The activities are as follows:
(Grunbacher & Boehm, 2001)
• Review and expand negotiation topics
• Brainstorm stakeholders interest
• Converge on win conditions
• Capture a glossary of terms
• Prioritize win conditions
• Reveal issues and constraints
14

• Identify issues, options, and agreements
EasyWinWin only involves a certain group of stakeholders and has been criticized by CoREA
authors as not very intitutional, not suitable for distributed development, subjective: (Geisser &
Hildenbrand, 2006)
2.2.2.3 Collaborative Requirements Elicitation and Analysis (CoREA)
CoREA covers collaborative requirements elicitation in a distributed environment as well as
quantitative decision support for distributed requirements prioritization and selection (Geisser
& Hildenbrand, 2006). CoREA consists of two phases: (Geisser & Hildenbrand, 2006)
• 1. Iterative and collaborative elicitation of requirements from different stake-holders, illus-
trated in Figure 2.3.
• 2. The costs and values of requirements are analyzed in order to decide what will be done
in design and implementation phases.
Figure 2.3: CoREA (Geisser & Hildenbrand, 2006)
15

2.2.2.4 Athena
Athena focuses on solving ambiguity in requirements and is based on group story-telling, sup-
porting the acquisition and the exchange of information during the requirements elicitation phase
(Laporti et al., 2007). Elicitation is based on three steps. Storytelling is the first step that origins
scenarios (the second) that are then transformed into use cases as can be seen in Figure 2.4.
Figure 2.4: Athena - adapted from (Laporti et al., 2007)
Athena’s approach seems interesting but it misses a requirements prioritization phase in order to
avoid excess of requirements. The conversion from stories to scenarios and stories to use cases
may also be difficult.
2.2.3 Online Tools
Due to offshoring and outsourcing distributed requirements can be a characteristic of several
projects. Gathering the stakeholders for discussing requirements can also be difficult (Farinha &
Mira da Silva, 2011b). Online tools have been developed to enable participation of various users
without the need for a personal meeting.
Online collaboration through focus group, a group technique previously described, has been
studied (Farinha & Mira da Silva, 2011b) (Farinha & Mira da Silva, 2011a). A tool to support this
technique has also been implemented (Zarinah & Siti Salwah, 2009). Other proposals for online
elicitation tools have been made (Lim et al., 2011) (Rashid et al., 2006a) (Seyff et al., 2010).
Stakesource 2.0 uses social networks and collaborative filtering to suggest requirements that the
stakeholder may prefer (Lim et al., 2011). Elicitation with this tool mainly consists in two activities:
• Stakeholder analysis – users can invite others and a social network of stake-holders is built,
prioritization will be based on the defined social network
16

• Requirements elicitation and prioritisation – stakeholders suggest and rate requirements,
requirements are prioritised through the social network using the stakeholder weight on the
defined social network. Collaborative filtering is used to recommend requirements.
Annotation Tool (Rashid et al., 2006a) is an evolution of Annotate!Pro that lets the user takes
screenshots and annotate them with their proposals for project improvement, enabling users to
comment the application that they are using in an easy way and without the need of training.
When the application is only being developed, software engineers can invite users to specify
requirements and participate in the actual project. In this case, users are able to complete their
specification with sketchers.
FeaRS1 (Feature Request System) is a system that enables users to suggest improvements
to existing projects. Users are able to submit suggestions, comment them and express their
preferences through votes.
iRequire (Seyff et al., 2010) is a tool for mobile phones and enables users to blog their require-
ments regardless of their location and whenever their need is triggered. The main features of
iRequire are the possibility to take a picture of the environment, document a user need, describe
the main task and provide a rationale, and check the summary of a need.
In addition, the use of wikis has been proposed to deal with distributed teams facilitating and in-
creasing the participation of all project stakeholders (Decker et al., 2007) (Ferreira & Rodrigues da
Silva, 2008).
A wiki is collaborative software that allows users to add, remove, and amend content on a com-
mon platform, which can be a public web site or a more constrained company intranet (Simha &
Kishore, 2009). Some of the common features of wikis are centralized and shared communica-
tion, possibility to view previous versions of a document, watch-listing, searchability and catego-
rization (Simha & Kishore, 2009).
Some proposals to provide a collaborative environment for elicitation based on wikis have been
made by (Lohmann & Ziegler, 2008) (Solis & Ali, 2010) (Yang et al., 2008) (Knauss et al., 2009).
For example Softwiki supports distributed requirements submission and discussion, requirements
classification and prioritization and requirements visualization techniques such as a graph with
connections between related requirements, a tag cloud visualization for the mentioned terms,
geographical map with the origin of the requirements (Lohmann & Ziegler, 2008).
ShyWiki (Solis & Ali, 2010) makes a distributed brainstorming session possible. Requirements
1https://fears.ist.utl.pt/
17
can be prioritized through voting. WikiWinWin (Yang et al., 2008) is a requirements negotia-
tion tool that supports EasyWinWin methodology. SmartWiki (Knauss et al., 2009) provides
requirements definition through document templates, also offering feedback on the specified re-
quirements through heuristics. Support for glossary and project management activities is also
provided.
A disadvantage pointed out to wikis is conflicts among users which can also lead to misunder-
standings around requirements that may arise from the stakeholders’ different backgrounds and
objectives (Decker et al., 2007).
2.3 Visualization of Requirements
Browsing a disjoint list of textual requirements may impede users to better understand require-
ments. Visualization can be a mean to achieve better understanding of the identified require-
ments (Gotel et al., 2007).
Data might be represented through the use of visualization. This representation increases the
awareness of an individual about the data. Visualization is employed in many domains, for exam-
ple latter phases of soft development, such as program call graphs and source code visualization,
to increase overall program comprehension; or it is used to support testing and debugging tasks.
Current visualizations used in software engineering are mainly based in UML. However these
UML-based models are rarely designed with the goal of helping stakeholders to see requirements
and their properties in a clearer and more understandable way. Requirements are more than
mere textual descriptions of what the system is supposed to achieve. Metadata can be associated
to requirements (for example, attributes for author identification, cost, or priority), turning them
into multi-dimensional clusters of metadata.
Requirements visualization is a current research subject, having the majority of proposals ad-
dressed at the analysis and specification of requirements engineering. In what concerns the
elicitation activity, some proposals suggest the use of tabular visualizations, quantitative visu-
alizations of risks by using charts, and modeling of requirements through business processes
(Cooper et al., 2009).
Usage of mind maps (Pohl, 2010) to gather user requirements and paper prototyping (Vijayan &
Raju, 2011) has also been proposed (see Figures 2.5 and 2.6).
A mind map be used can group requirements in different categories, color and images can be
added to the mind map in order to add more expressiveness to the ideas. However browsing
18

Figure 2.5: Mindmap with requirements
Figure 2.6: Paper prototype example (Vijayan & Raju, 2011)
through an extensive mind map and having some text that represents more than just a topic for
an idea may be difficult in a mind map.
Paper prototyping may be adequate for the definition of user interface. But it may be difficult to
formalize the requirements into a specification. User involvement and discussion of requirements
may also be difficult following this approach.
2.4 Participation in Online Communities
A problem in a large number of online communities is the lack of participation (Beenen et al.,
2004). Only a small part of the community tends to contribute which can lead to a failure in that
community.
The main reasons to contribute in online communities have been summarized in extrinsic moti-
vations like rewards or personal needs, intrinsic motivations like altruism or reputation and inter-
personal reasons such as affiliation or liking the community (Lui et al., 2002).
Motivating members to contribute to online communities is a research area that had some studies
19

on the psychology field (Beenen et al., 2004), explored the sense of uniqueness and dissimilarity
(Ludford et al., 2004), and displayed the value of each contribution (Rashid et al., 2006b).
2.4.1 Social Visualization
Online communities suffer from participation issues that can be related to a lack of motivation
to contribute (Beenen et al., 2004). Social visualization has also been used to stimulate user
engagement in online communities (Cheng & Vassileva, 2005) (Gilbert & Karahalios, 2009), this
kind of visualization is part of our proposal and is described next.
Competition is a form of social comparison that motivates users to participate in online commu-
nities (Vassileva & Sun, 2007). Social comparison can take place if users are able to see the
behavior of other users and their own. Visualization has been used to create awareness of what
is going on in the community but it is not frequently used to stimulate social comparison.
Usually, people want to be recognized in a positive way and perform actions to gain social repu-
tation, since the potential benefit compensates the required effort (Vassileva & Sun, 2007).
A social visualization provides information about the presence, activities and other data of a
member’s social involvement in a community (Erickson, 2003). Social visualization portrays social
data that can be defined as traces related to some specific activity (Karahalios & Viegas, 2006).
This kind of visualization can be used to increase awareness in a social environment.
Attempts to use social visualization to motivate users have shown good results in increasing the
users’ motivation to participate in the community (Cheng & Vassileva, 2005) (Gilbert & Karahalios,
2009). Some guidelines for social visualization construction have been proposed by Erickson
(Erickson, 2003), such as absence of customization and use of a third person point of view,
meaning that individuals should see the same thing and view themselves as the other members
of the community will.
2.5 Gamification
The use of serious games in business contexts has grown dramatically over the last fourth
decades and it has been reported that they provide three main benefits in promoting organi-
zational learning, namely: (1) to orient and train new employees; (2) to select current managers
or future managers and (3) for ongoing management training (Faria et al., 2009).
The term serious games describes the use of complete games for non-entertainment purposes,
but gamification is a different approach where elements of games are used but they do not give
20

rise to entire games (Deterding et al., 2011a). Gamification consists in the increasing societal
adoption of video games and the of game elements to shape our everyday life and interactions
with good results on engaging users, making it a valuable approach to turn some activities more
enjoyable, motivating and/or engaging.
Classic characteristics of games like rules and competition can be applied in gamified appli-
cations, but this does not necessarily mean that an entire game has to rise (Deterding et al.,
2011a). Elements of games can be applied like some interface design patterns like badges,
levels or leaderboards (Crumlish & Malone, 2009) or game design patterns like goals, scores,
levels, rewards or penalties different types of gameplay (Bjork & Holopainen, 2005).
’Gamified’ applications are present in several domains from productivity to finance, health, sus-
tainability, news, user-generated content and tutorials (Deterding et al., 2011b). Several vendors
also offer gamification as a service layer of reward and reputation systems with points, badges
and leaderboards.
Some of these game aspects have been used with good results in an application for student
orientation (Fitz-Walter et al., 2011) and to encourage students to take non-mandatory quizzes
(Landers & Callan, 2011). A negative impact on user participation when removing gamification
(in the form of points and rankings) from a company website has also been reported (Thom et al.,
2012).
Games are also starting to be used in requirements engineering. Tracing Whodunit is based on
another board game (Cluedo), in which the participants are taken to a murder scenario and have
to discover the criminal. It is proposed as a detective-like game with the objective of uncovering
about the original source of a requirement (Gotel, 2008). Questions and answers are used in this
board game that increases communication between the participants.
A game to show the relevance of the different in requirements engineering like the need for
communication and reviews has also been proposed (Knauss et al., 2008).
2.6 Summary
This chapter illustrates the benefits that user involvement can bring to requirements elicitation
and reviews some of the approaches. It is possible to see that there are several approaches
that can be followed for requirements. Some proposals for visualization of requirements are also
described.
21

The distribution of stakeholders can difficult the communication among them and personal meet-
ings may be difficult to schedule. Due to these facts some proposals for collaborative require-
ments elicitation have been made. Although, we argue that some of the current approaches do
not explore requirements visualization as a mean to increase the awareness and understanding
around requirements.
Eliciting in an web-based environment can also bring a problem of some online communities that
is lack of user participation. Despite the positive results that social visualization had on motivating
user participation in online communities, this technique was not used in the presented works.
We argue that requirements visualization can be used as a mean to increase the awareness and
understanding around requirements and that social visualization can engage the stakeholders in
requirements elicitation. We intend to better support users in requirements elicitation through the
use of visualization techniques and avoid possible schedule and geographical constraints that
may influence personal meetings for requirements elicitation.
Despite the positive results regarding user engagement the described for requirements elicitation
also do not seem to be using any gamification aspects like points or rankings.
22

Chapter 3
Proposal
Given the need for collaboration and the problem of lack of user involvement in requirements
elicitation and the increasing difficulties to gather stakeholders we propose a web-based
collaborative environment for requirements elicitation with both requirements and social visual-
ization support. Since this proposal includes the creation of a community to submit and discuss
requirements we incorporate some of the patterns suggested to design social interfaces like
Commenting, Votes, Reputation and Rankings (Crumlish & Malone, 2009).
With this proposal we can tackle the problem introduced by the geographical distribution of stake-
holders that can difficult the scheduling of meetings and the communication among the stake-
holders. Since requirements elicitation can benefit from user involvement we also intend to invite
users to participate in this activity and use visualization techniques to engage and stimulate them.
We intend to better support users in requirements elicitation and avoid possible schedule and
geographical constraints that may influence personal meetings for requirements elicitation. Our
proposal is distinct from the ones previously presented because of our focus in the community
that will elicit the requirements and the included visualizations techniques.
The use of alternative requirements visualization is suggested as a mean to engage users and
to provide a better understanding of the requirements to the participants in the elicitation activity
as stated in (Gotel et al., 2007). Metadata associated to requirements like date and time of
submission, number of votes and comments will be used in the proposed visualizations. Social
visualization is recommended due to its positive results in motivating users of online communities.
Moreover, we consider that gamification can also have a positive on user involvement, so our
proposal also considers some elements of games like bonus and points in order to stimulate user
involvement.
23

We intend to use a web platform for inputting text-based requirements submission. The proposed
requirements can then be used in the subsequent activities of requirements development, namely
analysis, specification and validation.
A requirement is mainly formed by a title, a description and the category in which it fits in. Ad-
ditionally, the date and time of a submission should be kept. Users ought to have the option to
submit their requirements anonymously or to be identified.
Moreover users should be able to comment on the suggested requirements in order to improve
the discussion around them. Date and time of submission is collected as in requirements sub-
mission and the user may or may not assume the authorship of a comment. In order to express
their preference about requirements, users ought to be able to vote on their favorite suggestions.
This way, the requirements list will also be prioritized.
This proposal is distinct from the presented in 2.2.2 because of the different approaches to visual-
ize requirements and the focus in the community that will elicit the requirements. The gamification
of the requirements elicitation activity does not seem to have been explored as well.
The evaluation of this proposal will be performed with case studies where requirements for infor-
mation systems will be elicited.
24

Chapter 4
First Research Cycle
In the first research cycle the problem was identified and a plan was defined. A prototype
was built in order to support the evaluation of our proposal that was made with a case study
followed by a survey.
4.1 Diagnosing
The problem of lack of user involvement was identified in the literature as well as benefits of the
avoidance of this problem. According to the literature visualization techniques can motivate users
to participate in online communities. Regarding requirements visualization it was verified that it
can increase the understanding of requirements and that a requirement can be represented with
more than just is description information related to a requirement can be added to an artifact.
The scenario for the evaluation of this first research cycle was the elicitation of requirements for
an information system for the users of a sports betting forum. This system would help to register
their bets and keep track of their results. The seventeen moderators of the sports betting forum
were invited to participate in requirements elicitation for this system through an e-mail sent to
them.
4.2 Action Planning
To attempt to increase the user involvement in requirements elicitation it was decided to promote
a collaborative environment. As visualization techniques can have an impact on the motivation to
25

participate in online communities, we decided to use them in an attempt to engage the stakehold-
ers in the requirements elicitation activity. Requirements visualization techniques will be used in
an attempt to increase the understanding of requirements and to check if they also can engage
the stakeholders in elicitation.
4.2.1 Visualization of Requirements
We propose the use of graphical artifacts to visualize information about the proposed require-
ments. The homepage of each project will consist on a dashboard that quickly lets the users
know about the recent activity and the requirements with more votes. To show these details a
total of five bar charts will be used on this dashboard:
• Ideas with more votes (top10) – see Figure 4.7
• Ideas with more comments (top10)
• Users that submitted more ideas (top10)
• Ideas with more comments in the last 24 hours (top10)
• Participation by date, number of ideas, comments and votes per day
Figure 4.7: Requirements with more votes (top 10)
The first element of each chart will be highlighted in a different color. The charts that show
information about ideas will be clickable, giving direct access to the details of the selected re-
quirement. When the mouse cursor is over one bar, the title of the idea represented by that bar
is displayed.
26

Categories will be used to group ideas, creating a two level hierarchy. To view this hierarchy
and facilitate browsing through the requirements list, we propose the use of a treemap (Google,
2011). A treemap can represent large hierarchical collections with emphasis on the relevance of
each node through size or color Johnson & Shneiderman (1991).
A treemap can show one level of the hierarchy at a time, and the size of each element on the
treemap can have a meaning. Size can be used to illustrate the number of votes of each require-
ment. On the first level (categories), the size of an element will show the popularity of its ideas,
meaning that the larger category will be one that contains the requirements with more votes.
The second level will show the ideas that belong to the selected category and the size of each
element will represent number of votes of each requirements. An example of the two levels of the
treemap can be seen in Figures 4.8 and 4.9.
Figure 4.8: Treemap for Requirements Visualization (First Level - Categories)
Figure 4.9: Treemap for Requirements Visualization (Second Level - Requirements)
27

An alternative to visualize the proposed ideas is a 3D tag cloud with motion will be used to show
all the titles of the suggested requirements. The tag cloud element will be clickable leading to the
ideas detail page. The size of each element of the tag cloud will reflect the number of votes of
the requirement that it is representing. An example of this tag cloud is presented in Figure 4.10.
Figure 4.10: 3D Tag Cloud for Requirements Visualization
Another alternative to visualize the suggested ideas will be provided. It will be a bubble chart
containing a representation of time. Users can see the status of ideas on any given date. The X
and Y axis are used to illustrate the number of votes and comments that the requirements had
on the selected date. The color of each bubble will be used to represent the category that the
requirement was assigned. The size is the same for each bubble but the user has the possibility
of assigning the number of votes or the number of commentaries to the size of each bubble. An
example of this chart can be seen in Figure 4.11.
Figure 4.11: Motion Chart for Requirements Visualization Along Time
28

4.2.2 Social Visualization
Social visualization has a positive effect in motivating users of online communities to contribute
to the given community, so we propose using social visualization as another mean to motivate
users to participate in the elicitation activity.
A bubble chart will be employed to illustrate the users’ contributions (see Figure 4.12). The color
of each bubble indicates the status that the stakeholder has achieved, adding a more competitive
side to this visualization approach. Each contribution has equal value, and a different status
is achieved after five contributions, meaning that to get to the bronze status and individual has
to make more than five contributions, more ten to silver and more than fifteen contributions to
achieve gold status.
When the cursor is over a bubble, the username of its correspondent user is displayed. This
visualization allows no customization following Erickson’s guidelines Erickson (2003).
Figure 4.12: Bubble Chart for Social Visualization
Social visualization is proposed due to its positive results on motivating users of online commu-
nities, a bubble chart will be used to show the users’ participation level.
4.3 Action Taking
In order to evaluate our plan a prototype had to be built in order to support the collaborative
environment for requirements elicitation with the support of the visualization techniques. After
that a case study to define the requirements for a sports betting registry system took place with
a group of users from a sports betting forum.
29

4.3.1 Prototype
To evaluate this proposal, a prototype has been built using the Outsystems agile platform1. This
platform has been chosen due to its simplicity, short learning curve, and also for its capabilities
of version control and easy deployment.
The developed prototype supports the features introduced in the previous section. The social
visualization and requirements dashboard were implemented using Fusion Charts2, a charting
framework that is included in Outsystems agile platform. However, the proposed visualizations
for the suggested requirements were built using Google Charts API3 due to the lack of equivalent
support by Fusion Charts. A domain model of the prototype is available in Figure 4.13.
Figure 4.13: Prototype Domain Model
4.3.1.1 Requirements Submission, Discussion and Voting
The prototype enables users to submit new requirements, discuss the existent ones through
comments, and prioritize by using votes. Requirements submission and their comments can be
signed by users with their username or be anonymous in order to avoid organizational barriers,
which can intimidate the user when submitting an opinion.
1http://www.outsystems.com2http://www.fusioncharts.com3https://developers.google.com/chart
30

A notification system based on comments has also been implemented in order to notify the
users of recent activity. After each comment on requirements, the system sends an e-mail to
the author of the requirement and to the individuals that already posted a comment on the given
requirement, informing that a new comment has been submitted.
At the end of the requirements elicitation process, a list of the suggested requirements can be
exported to a xls file. This list contains the information related to each requirement including title,
description, category, number of votes, author, date and time of submission.
4.3.1.2 Visualization of Suggested Requirements
Regarding the visualization of requirements the prototype has a dashboard on its homepage with
proposed bar charts to better inform the user of what has been going on in the elicitation activity.
These charts show the most voted requirements, the users that submitted more requirements,
the requirements that have more comments and the requirements that were more commented
on in the last twenty-four hours. When a user sees the details of a requirement, a chart is also
shown to illustrate the difference in votes between the most popular requirements and the one
that is actually being seen.
The three alternatives for requirements visualization considered by our approach are imple-
mented using the Google Charts API.
4.3.1.3 Social Visualization
The proposed social visualization based on a bubble chart is supported by the prototype using
Fusion Charts. Each stakeholder is represented by a bubble. The horizontal and vertical axis
showed the number of comments and votes made by each stakeholder while the size of each
bubble represents the sum of the suggested requirements, comments and votes.
The color of each bubble indicates the status that the stakeholder has achieved. Each contribu-
tion has equal value, and a different status is achieved after five contributions, meaning that to get
to the bronze status and individual has to make more than five contributions, more ten to silver
and more than fifteen contributions to achieve gold status. When the cursor is over a bubble,
the username of its correspondent user is displayed. This visualization allows no customization
following Erickson’s guidelines.
31

4.3.2 Case Study A
The categories to group requirements and four initial requirements were defined with the forum
administrator and the invitation e-mail was sent to moderators. At the fifth and the last days of
this activity a reminder e-mail was sent to the participants.
At the end of this experiment the participants were asked to respond to a questionnaire where
they were asked to rate the proposed visualization techniques and about the motivational impact
of social visualization. Other questions featured the frequency that they accessed the prototype,
the reason to participate and some motivational factors that could motivate to them participate in
elicitation. In the last part of the questionnaire, the respondents were asked to classify the differ-
ent requirements visualizations that were offered. The questionnaire was answered anonymously
and is available at Appendix A.
4.4 Evaluating
4.4.1 Results from Case Study A
The case study resulted in 3 new requirements, 2 comments and 4 votes.A detailed view of the
numbers of contributions made by each participant is available at Table 4.2.
Table 4.2: Contributions per user
User Requirements Comments VotesU1 2 1 1U2 1 1 2U3 0 0 1U4 0 0 0U5 0 0 0U6 0 0 0Total 3 2 4
Figure 4.14 illustrates the different contributions by day, it is possible to see that the last day of
the elicitation activity was the one that had more contributions.
Regarding the questionnaire, seven of the seventeen participants that were invited have agreed
to answer to it. Table 4.3 summarizes the average classification of each of the proposed require-
ments visualizations. This classification was made using a 6 points Liker scale with 0 meaning
”Don’t Like” and 5 meaning ”Like”. The tabular list had the highest average classification. How-
ever it did not have any maximum rate (5) like the motion chart and the 3D tag cloud. The tabular
list also was the requirements visualization approach with the highest minimum rate.
32

0
0,5
1
1,5
2
2,5
3
3,5
1 2 3 4 5 6 7 8
#
Days
Requirements Comments Votes
Figure 4.14: Contributions per day
Table 4.3: Classification of the proposed requirements visualizations
Visualization Max. Min. Avg. Std. DeviationTabular List 4 3 3,71 0,49Motion Chart 5 1 2,86 1,46Treemap 4 1 2,57 1,273D Tag Cloud 5 1 3,00 1,41
Figure 4.15 looks with more detail at the rates of each requirements visualization we can see that
the rates for the tabular list do not vary as much as the other alternatives to visualize requirements
and this contributed for the higher average rate. However it is interesting to see that more than
50% of the feedback on the treemap and the 3d tag cloud was positive because it is equal or
greater than 3.
0,00%
10,00%
20,00%
30,00%
40,00%
50,00%
60,00%
70,00%
80,00%
0(Don't Like)
1 2 3 4 5(Like)
Visualization Classification
Textual List
Treemap
3D Tag Cloud
Motion Chart
Figure 4.15: Classification of visualizations
The majority of the questionnaires’ respondents stated that they accessed the elicitation platform
sometimes but not on a daily basis (see Figure 4.16). One of the answerers never accessed the
elicitation website.
33

14,29%
14,29%
71,43%
Frequency to use website
Never
Once
Sometimes, but not daily
Figure 4.16: Frequency of access to the elicitation platform
Two thirds of the respondents declared that their interest in the project was the reason to par-
ticipate (see Figure 4.17). The remaining third liked that they were asked to participate in the
project’s elicitation activity. It was considered that the individual that stated that never accessed
the elicitation platform had not participated in the elicitation activity, so his answer to this question
was discarded.
66,67%
33,33%
Reason to participate
Interest in project
Liked that my opinion has been asked
Figure 4.17: Reasons to participate
Figure 4.18 looks at the potential motivations to participate in the elicitation activity. The user
ranking represented with the social visualization approach had a good effect on motivating the
users to participate with only one negative answer. This was the only of the approach that fea-
tured in the questionnaire that was used in the case study. Using a game to elicit requirements
could also motivate more than half of the questionnaire respondents. The existence of rewards
was the only that had a majority of negative answers.
34

0,00%
10,00%
20,00%
30,00%
40,00%
50,00%
60,00%
70,00%
80,00%
90,00%
User Ranking Reward Game
Motivation
Yes
No
Figure 4.18: Potential motivations to participate
4.5 Specifying Learning
The developed prototype enabled us to make a case study with time or geographical constraints
that lasted for eight days resulting in three requirements, four votes and three comments. The
participation was low and the majority of the individuals that were invited to participate in the
elicitation activity did not collaborated.
The participants were asked to answer a questionnaire where it could be concluded that social
visualization had a positive impact on the motivation the users. The existence of a game could
also have a positive impact on the motivation to participate by the users. Giving rewards would
not had a great impact on user motivation.
According to the questionnaire, the tabular list had a better rating than the proposed requirements
visualizations. However some of these visualizations had a maximum rate unlike the tabular list.
The rates from the different users were sparse and that originated a lower average rate for the
proposed requirements visualizations in contrast with the tabular list that had all the rates between
3 and 4.
Despite accessing the elicitation platform for some times, none of the participants in the require-
ments elicitation activity accessed the elicitation platform on a daily basis. The majority of the
questionnaire’s respondents did this more than once but not on a daily basis. Increasing the
frequency of accesses to the elicitation platform could increase the amount of contributions.
Analyzing the contributions from each user we can also find some different profiles:
• Users that submit few ideas but express their opinions through comments and votes (2)
35

• Users that only submitted votes (1)
• Users that did not contribute (3)
The notification system did not have a great impact on the stakeholders participation. None of
the requirements had more than one comment, this can either be interpreted as lack of conflicts
regarding the requirements.
36

Chapter 5
Second Research Cycle
For the second research cycle the proposal was kept in order to have some results to evaluate
it properly. Only a logging feature was added to the prototype to check if the users did
really used the proposed visualizations when they rate them. The developed prototype was also
submitted to a goal-based evaluation.
5.1 Diagnosing
Despite the results of the previous research cycle we still felt that more evaluation was needed
and that the results could be enriched through a log of the user’s actions in the prototype.
There was a also a new scenario for the evaluation of the proposal, the elicitation of require-
ments for an information system that would facilitate the management and planning of an event
organized by students at an engineering university, SINFO1.
This is an event that involves several meetings during the year to plan and organize the entire
event that lasts for five days. There are companies that make presentations at the event and
their stands. There are also invited speakers and their expenses are also covered by the event.
Workshops are also available and anyone that is interested on them may sign up.
Despite studying in the same university the members of the organizing team are in different
stages of their courses so they have different schedules and could benefit from a collaborative
platform to elicit requirements. Given that the students were invited to participate in requirements
elicitation for the management and planning system for the event through an e-mail sent to the
event’s mailing list, which had forty-three members. This list included the members of the team
1www.sinfo.ist.utl.pt
37
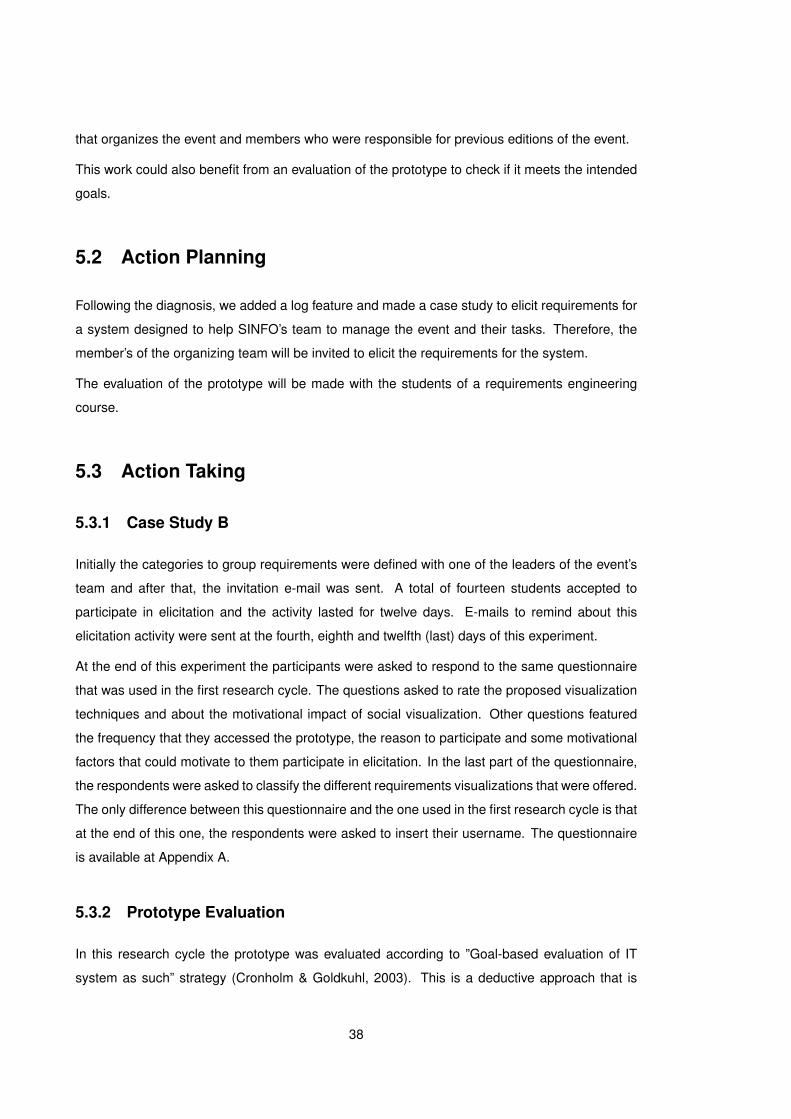
that organizes the event and members who were responsible for previous editions of the event.
This work could also benefit from an evaluation of the prototype to check if it meets the intended
goals.
5.2 Action Planning
Following the diagnosis, we added a log feature and made a case study to elicit requirements for
a system designed to help SINFO’s team to manage the event and their tasks. Therefore, the
member’s of the organizing team will be invited to elicit the requirements for the system.
The evaluation of the prototype will be made with the students of a requirements engineering
course.
5.3 Action Taking
5.3.1 Case Study B
Initially the categories to group requirements were defined with one of the leaders of the event’s
team and after that, the invitation e-mail was sent. A total of fourteen students accepted to
participate in elicitation and the activity lasted for twelve days. E-mails to remind about this
elicitation activity were sent at the fourth, eighth and twelfth (last) days of this experiment.
At the end of this experiment the participants were asked to respond to the same questionnaire
that was used in the first research cycle. The questions asked to rate the proposed visualization
techniques and about the motivational impact of social visualization. Other questions featured
the frequency that they accessed the prototype, the reason to participate and some motivational
factors that could motivate to them participate in elicitation. In the last part of the questionnaire,
the respondents were asked to classify the different requirements visualizations that were offered.
The only difference between this questionnaire and the one used in the first research cycle is that
at the end of this one, the respondents were asked to insert their username. The questionnaire
is available at Appendix A.
5.3.2 Prototype Evaluation
In this research cycle the prototype was evaluated according to ”Goal-based evaluation of IT
system as such” strategy (Cronholm & Goldkuhl, 2003). This is a deductive approach that is
38

used when it is intended to check if an IT artifact fulfills the intended goals.
This evaluation was performed by all the thirteen students of a requirements engineering subject
from a Bsc in Management and Information Systems in a university. The prototype was demon-
strated to these students in the final class of their course, afterwards a survey was answered by
them.
Each of the first four questions mentioned a goal of the system, and the respondents were asked
to state if they agreed or not with each goal. The answer was based on a six point Likert scale,
with 0 meaning ”Totally disagree” and 5 ”Totally agree”.
The second part of the questionnaire asked the respondents to classify each of the proposed
alternatives to visualize the suggested requirements and the social visualization. This evaluation
of the proposed visualizations was based on a six point Likert scale with 0 meaning ”Don’t Like”
and 5 ”Like”.
The defined goals for the prototype were:
1. Involve more stakeholders in requirements elicitation, avoiding face-to-face meetings
2. Ease the understanding of the requirements through the different graphical visualizations
3. Encourage stakeholders to participate in requirements elicitation through the different graph-
ical visualizations of requirements
4. Encourage stakeholders participate in requirements elicitation through the use of social
visualization
The questionnaire is detailed in Appendix B.
5.4 Evaluating
5.4.1 Results from Case Study B
This section presents the results of the case study that was previously described. This case
study resulted in 27 requirements, 17 comments on the proposed requirements and 32 votes. A
detailed view of the numbers of contributions made by each participant is available at Table 5.4.
Figure 5.19 details the number of contributions per day through with a chart, invitation was sent
at day 1 and reminder e-mails were sent at day 4, 8 and 12.
After the case study, the participants were asked to answer a questionnaire that featured some
39

Table 5.4: Contributions per user
User Requirements Comments VotesU1 10 1 1U2 8 0 0U3 3 1 0U4 2 5 9U5 1 0 0U6 1 5 5U7 1 1 1U8 1 3 6U9 0 1 1U10 0 0 3U11 0 0 6U12 0 0 0U13 0 0 0U14 0 0 0Total 27 17 32
0
2
4
6
8
10
12
14
16
1 2 3 4 5 6 7 8 9 10 11 12
#
Days
Requirements Comments Votes
Figure 5.19: Contributions per day
motivational factors to participate in elicitation. Eleven of the fourteen participants in the case
study accepted to answer the questionnaire.
Table 5.5 presents the classification of the proposed visualization by the participants in the case
study. The log feature was used to check if the respondents had really seen the proposed visual-
ization, therefore the answers from the the individuals that according to the log did not used the
given visualization were discarded, the column ”Rated by” shows the number of valid answers
for each visualization. The tabular list had the highest average classification and was also the
requirements visualization approach with the highest minimum rate. The motion chart and the 3d
tag cloud also have also received the maximum rate in some cases, however its minimum rate
was the lowest possible.
Figure 5.20 looks with more detail at the rates of each requirements visualization we can see that
40

Table 5.5: Classification of the proposed requirements visualizations
Visualization Max. Min. Avg. Rated by Std. DeviationTabular List 5 3 4,09 11 0,7Motion Chart 5 0 2,89 9 1,76Treemap 4 0 2,22 9 1,483D Tag Cloud 5 0 2,00 10 1,56
the rates for the tabular list do not vary as much as the other alternatives to visualize requirements
and this contributed for the higher average rate. More than 50% of of the feedback on the treemap
was positive (greater or equal than 3).
0,00%
10,00%
20,00%
30,00%
40,00%
50,00%
60,00%
0(Don't Like)
1 2 3 4 5(Like)
Visualization Classification
Textual List
Treemap
3D Tag Cloud
Motion Chart
Figure 5.20: Classification of visualizations
The majority of the questionnaires’ respondents stated that they accessed the elicitation platform
sometimes but not on a daily basis (see Figure 5.21). One of the answerers accessed it daily, but
it is also a fact that this individual only started participating in the last day of the case study.
More than half of the respondents declared that their interest in the project was the reason to
participate in the case study (see Figure 5.22). 27.27% liked the fact that their opinion has been
asked, followed by the potential benefit for the event and the appeal from the project leaders.
The answers regarding the potential motivations to participate in the elicitation activity can be
seen in Figure 5.23. The user ranking represented with the social visualization approach had
a good effect on motivating the users to participate with more than 72,73% of positive answers.
This was the only of the approach that featured in the questionnaire that was really used in the
case study. The existence of rewards also had a good number of positive answers (63,64%). The
game hypothesis was the one with the lowest percentage of positive answers, with 45,45%.
41

9,09%
27,27%
63,64%
Frequency to use website
Daily
Once
Sometimes, but not daily
Figure 5.21: Frequency of access to the elicitation platform
54,55% 27,27%
9,09%
9,09%
Reason to participate
Interest in project
Liked that my opinion has been asked
Possible benefit for the event
Appeal from project leaders
Figure 5.22: Reasons to participate
0,00%
10,00%
20,00%
30,00%
40,00%
50,00%
60,00%
70,00%
80,00%
User Ranking Reward Game
Motivation
Yes
No
Figure 5.23: Potential motivations to participate
42

5.4.2 Log
This section displays some of the results that were obtained with the prototype’s log feature,
namely the number of accesses to each per user.
Table 5.6 displays the number of usages from each of the proposed requirements visualizations.
The tabular list was the visualization that was more used by the participants in the case study,
confirming the results from the questionnaire where it was rated by the respondents as their
favorite way to visualize the requirements.
Table 5.6: Number of accesses to each requirements visualization web-page per user
User Tabular List Treemap Motion Chart 3D Tag CloudU1 9 1 1 1U2 3 1 1 1U3 5 3 2 2U4 13 1 1 1U5 2 2 1 1U6 10 3 1 2U7 4 1 1 1U8 23 6 1 5U9 5 2 2 1U10 4 0 0 0U11 8 0 1 2U12 1 0 0 0U13 3 1 0 1U14 0 0 0 0Total 90 21 12 18
Table 5.7 shows the number of accesses to the remaining by the participants in the case study.
The users who answered the questionnaire are highlighted in bold. Two of the users that did not
see the user ranking stated that they are not motivated by this kind of visualization.
43

Table 5.7: Number of accesses to the remaining web-pages per user
User Dashboard Categories List User RankingU1 3 9 6U2 3 4 4U3 3 2 3U4 4 0 1U5 3 1 0U6 1 0 1U7 3 0 1U8 3 1 4U9 4 1 1U10 3 0 0U11 2 0 1U12 2 0 0U13 3 0 0U14 1 1 0Total 38 19 22
5.4.3 Results from Prototype Evaluation
The results from the prototype’s goal-based evaluation are described in the next two tables.
Table 5.8: Results from proposed requirements visualization evaluation
Goal Max. Min. Avg. Std. Deviation1 - Involvement of stakeholders 5 3 4,15 0,552 - Ease of understanding requirements through visualization 5 3 4,08 0,493 - Encouragement through requirements visualization 5 1 3,61 1,044 - Encouragement through social visualization 5 2 3,54 0,97
Table 5.9: Results from prototype’s goal-based evaluation of IT system as such
Visualization Max. Min. Avg. Std. DeviationTreemap 5 3 4,00 0,58Motion Chart 5 2 4,00 0,913D Tag Cloud 5 2 3,85 1,07Textual List 4 2 3,31 0,73
The respondents to the questionnaire were also asked to rate the social visualization based on
the bubble chart, which achieved an average score of 3,23, a maximum rate of 5, minimum rate
of 1 and a standard deviation of 1,25.
44

5.5 Specifying Learning
The developed prototype enabled the different stakeholders to give their contributions and ex-
press their opinions independently of their location and without time constraints.
The majority of the stakeholders involved in this experiment considered social visualization as a
motivational factor to participate in requirements elicitation.
According to the questionnaire’s results the participants prefer the tabular list instead of the re-
quirements visualizations that we propose. However, the proposed requirements visualization
had some positive feedback, as can be seen by the higher rate of each one, but the rates from
each user were very different which originated a lower average rate.
There is a need to frequently remind stakeholders to return to the elicitation platform, as it can
be observed in Figure 5.19, since the main contributions related with new requirements were
given in the days that a reminder e-mail was sent to the stakeholders. The questionnaire results
also confirm that the users did not frequently access the elicitation platform. The number of
comments and votes was higher in the last days of the experiment. Additionally there is a low
rate of comments per requirement meaning that the discussion around requirements should be
more stimulated.
Analyzing the contributions from each user we can also find some different profiles:
• Users that mainly submit requirements (2)
• Users that submit few ideas but express their opinions through comments and votes (2)
• Users that only submitted votes (3)
• Users that did not contribute (3)
Despite the presence of a notification system based on comments, the cases where the author of
a requirement continued the discussion around the commented idea were rare. This can either be
interpreted as an absence of conflicts between stakeholders or that the comments made aimed
at completing the description of each requirement.
According to our questionnaire the existence of rewards can boost the stakeholders’ motivation
to participate in elicitation. Associating a game to elicitation can also increase the motivation of
some of the stakeholders to contribute to requirements elicitation.
None of the requirements or comments were submitted anonymously.This shows that in this
experiment none of the participants were worried with organizational barriers or felt intimidated
to give their contribution.
45

Chapter 6
Third Research Cycle
In the third research cycle it was decided to explore gamification, some game elements were
added to the proposal and two case studies for evaluation were completed.
6.1 Diagnosing
Following the feedback from the previous case studies and the positive results that gamifica-
tion can have in the participation of users, it was decided to explore a game environment for
requirements elicitation in the next research cycle. Given the previous low rates of the proposed
requirements visualizations approaches they were not used in this research cycle.
6.2 Action Planning
To structure our gaming approach the six thinking hats method was chosen. This method has
been developed by De Bono (De Bono, 1990) with the main objective of structuring the act of
thinking and making a person look at a problem’s different perspectives. Six different hats (white,
red, black, yellow, green, blue) in order to ask for different kinds of thinking and opinions.
The white hat focuses on facts and numbers and requests their exposure in a neutral and objec-
tive way. Its main objective is to get facts without any additional opinions or the arguments that
support those facts.
The red hat worries about emotions and feelings opposing to focus on neutral information given
by the white hat. Opinions given with the red hat do not need to be supported with justifications
47

or illustrate the reasons behind that opinion.
The black hat is related to negative judgements and why something may not work. Imperfections
of design, risks and dangers related to a topic should also be identified with this hat. Positive
thoughts are related to the yellow hat. It asks for optimism and the positive benefits of an idea
opposing the black hat.
The green hat introduces creative thinking, focusing on new ideas and more alternatives. The
finding of alternatives is a fundamental aspect of this hat that asks people to go beyond the
well-known.
Finally, the blue hat focuses on a global vision and on the problem definition. Conclusions are
also taken while wearing the blue hat.
The six thinking hats concept allows the thinker to separate the logic of the emotion or the cre-
ativity from the information. This method can help to structure the hat of thinking and focus at
one thing at a time.
Evaluation will be performed with two different case studies, one in person to validate the game
approach and one with a prototype to enable asynchronous communication.
6.3 Action Taking
At this stage, the game was designed and evaluated with the first case study. Afterwards the
game was implemented in the prototype and a second case study took place in order to evaluate
the game with the prototype.
6.3.1 Game Design
Since we consider that elicitation consists not only in the discovery of new requirements but also
in the discussion of the existent ones, we consider that the six thinking hats method can fit in
requirements elicitation and we took as the basis for a game.
We want that the different stakeholders that participate in the elicitation process give different
perspectives around a requirement, so we matched each hat to an activity. a good method to
conduct discussions and have decided to take approach as a basis for the definition of a game
for requirements elicitation.
The game objective is to involve stakeholders in the requirements elicitation activity. For the
players, the main goal is to score points by contributing with new requirements to a project or by
48

discussing the existing ones.
The blue hat is related to a goal and organization of thoughts so it is wore by the project manager
when a project is set up and the categories to group requirements are defined.
The other hats are matched to activities that can be done by the players and are rewarded with
points. The players can express their opinion on a requirement in four different ways, rating the
requirement with stars (red hat), a positive comment (yellow hat), a negative comment (black
hat), a concrete or statistical comment (white hat). Table 6.10 summarizes the mapping between
the ”six thinking hats” method and the activities related to requirements that are proposed.
Table 6.10: Mapping the ”six thinking hats” to game activities
Hat Game activity Performed byGreen Submit new requirement UserRed Rate a requirement with stars UserYellow Submit a positive comment about a requirement UserBlack Submit a negative comment about a requirement UserWhite Submit a positive concrete about a requirement UserBlue Define categories to group requirements Project Manager
In order to obtain non-biased opinions and preserve the game fairness, a player cannot express
opinions on the requirements that has submitted. It was also decided to simplify the structure of
a requirement, removing the title that was previously used, meaning that now a requirement will
only be based on a description and a category.
6.3.1.1 Scoring Scheme
By providing a new requirement a user wins 500 points. As this is one of the main objectives of
the game and probably the most difficult task, it is the one that is rewarded with more points.
Rating a requirement with stars is a pretty straight-forward action so by rating one requirement
50 points are given. Concrete or statistical comments may not be very easy to give but we think
that they are not very relevant for the elicitation activity, so we decided to assign 50 points to this
activity. On the other hand positive and negative comments seem more important to us and may
be easier to express, so we decided to assign 100 points to them.
If a user completes the discussion of a requirement in the four available ways a bonus of 100
points is given.
Table 6.11 summarizes the scoring scheme.
49

Table 6.11: Game scoring scheme
Activities PointsNew requirement 500Star Rating 50Positive comment 100Negative comment 100Concrete comment 50Bonus 100
6.3.2 Prototype
The previously developed prototype was altered support the game environment. An effort was
also made to improve its aspect. The developed prototype supports the activities that were
introduced previously like the submission of a new requirement, discussion through different
kinds of comments and a way to rate the requirements based on stars (1 to 5). A domain model
of the prototype is available in Figure 6.24.
Figure 6.24: Prototype Domain Model
The prototype supports the elicitation of requirements for multiple projects at the same time and
the player can choose in what project she will participate. The different projects are displayed in
a slideshow that displays the title, description and an icon that are associated to each project. A
drop-down list can also be used to choose a project in an alternative way (see Figure 6.25).
50

Figure 6.25: Screen to choose a project
After choosing a project the user is taken to gaming screen (see Figure 6.26). On the left side the
project name, logo and description and available again. A progress bar that displays the amount
of points that the player has gained in comparison with the total points that are available to be
won is also visible. Figure 6.27 illustrates how a requirement is submitted.
On the right side of the page (see Figure 6.28) is the list of requirements that have been submitted
by the other players. The player can choose a requirement and open it using the ”+” button. After
that the user can choose what activity he/she will perform (rating, positive comment, negative
comment or concrete comment), the usage of the ”six thinking hats” method is transparent for the
user because the hats and their colors are not mentioned, instead they are mapped to concrete
contributions that can be made. A warning sign is displayed when there are activities related to
a requirement that are available to be done. The question marks in front of each activity display
a help message associated to each task to be done. A drop-down list can be used to filter the
requirements by the category that they are grouped in.
At the top of each screen the user can find the information related to the scores and rankings.
A progress bar also displays the amount of points that the player has obtained and the total of
points that can be obtained. There is also a button that displays the help page.
51

Figure 6.26: Gaming screen after choosing a project
Figure 6.27: Insert a requirement
Figure 6.28: Rating a requirement with stars
52

6.3.3 Case Study C (”In paper”)
This case study took place at a childcare center that was restructuring its information system and
the game was used to elicit requirements for that system.
The project manager defined six initial requirements and three categories that were also used to
group the requirements, public area that mainly consisted in the company website, extranet that
is accessible to the children and their parents and intranet that is accessible to the workers of
that organization.
Seven persons with different roles in the organization participated in this experiment, two from
management, two teachers, one educator, one secretary and one from transports.
The game was ”paper-based” and was played by rounds, each person played one round. At
each round the player was asked to review the existing requirements and rate them with the stars.
Additionally, the player could make any comments that felt appropriate to each requirement. After
this review the player was asked to suggest other requirements.
6.3.4 Case Study D (Prototype)
After the validation of the gaming approach with case study C, the second case study from this
research cycle took place at a classroom from a course of the last year from a Msc in Information
Systems and Computer Engineering at Instituto Superior Tecnico, the students were asked to
use the prototype to elicit requirements for an information system that would be used for the
management of a course.
Seventeen students participated in this case study with new requirements, ratings and comments
to the initial requirements.
Three initial categories were defined by the project manager. These were ”teacher activities”,
”student activities” and third one named ”other” to group requirements that did not fit in the previ-
ous two. Eight initial requirements were defined.
6.3.5 Feedback
In order to obtain some feedback on the game and on the information that resulted from the game
two different questionnaires were made, the first was directed to the players and the second was
aimed at the project manager. Both questionnaires are available at Appendix C.
53

6.3.5.1 Player Questionnaire
After playing each player was asked to answer a questionnaire to have some feedback on the
game. The main goal of the questionnaire was to evaluate if the game motivated the players to
participate in requirements and if it was easy to play and understand. The questions were:
• Q1 - Do you consider that the game is easy to understand?
• Q2 - Do you consider that the game is easy to play?
• Q3 - Rate the amusement rate of the game
• Q4 - The game motivates you to participate in requirements elicitation?
• Q5 - Do you consider that the game is a useful tool for requirements elicitation?
The answers to these questions were based on a six points Likert scale with 0 meaning ”No” and
5 meaning ”Yes”. Two additional questions were made, they were related to additional factors
that could increase the player motivation and what were the main difficulties to participate. These
were multiple choice questions with ”Teams”, ”Bonus Rounds”, ”Rewards” and ”Other” as the op-
tions for the question related to motivation. For the question related with difficulties to participate
the possibilities were ”Lack of ideas”, ”Did not understood the game’s objective” and ”Other”.
More than one possibility could be chosen in both questions.
6.3.5.2 Project Manager Questionnaire
After each experiment a list with requirements and their respective comments was produced, this
list was also ordered by the average ratings of each requirement and the results were sent to the
project manager. Afterwards the project manager to answer a questionnaire that featured three
questions based on six points Likert scale with 0 meaning ”No” and 5 meaning ”Yes”. These
questions were:
• Q1 - Are you satisfied with the number of the contributions obtained with the game?
• Q2 - The relevance of each requirement is well represented by its rating?
• Q3 - The requirements obtained with the game have helped to better define the project
scope?
• Q4 - How do you rate the quality of the requirements obtained with the game?
Additional questions included the evaluation of the quality and the relevance of the contributions
that were obtained with the game.
54

6.4 Evaluating
The evaluation of this proposal was made with two different case studies. The first was made ”in
paper” to test the game concepts and the second was made with the developed prototype.
The proposed game for requirements elicitation has been tested for two times. The first case
study was made like a board game and the second was made with the developed prototype.
The contributions gathered in this case study are summarized in Table 6.12.
Table 6.12: Results from case study C
ContributionsNew requirements Positive Comments Negative Comments Concrete Comments Rates
10 6 6 3 93
A detailed view of the numbers of contributions made by each participant is available at Ta-
ble 6.15.
Table 6.13: Contributions per user - case study C
User Requirements Positive Comments Negative Comments Concrete Comments RatesU1 7 0 0 0 6U2 0 0 0 0 13U3 1 1 1 1 13U4 1 0 1 0 14U5 1 0 0 0 15U6 0 4 4 1 16U7 0 1 0 1 16Total 10 6 6 3 93
The contributions gathered with the second case study are summarized in Table 6.14.
Table 6.14: Results from case study D
ContributionsNew requirements Positive Comments Negative Comments Concrete Comments Rates
22 48 32 36 192
A detailed view of the numbers of contributions made by each participant is available at Ta-
ble 6.15.
55

Table 6.15: Contributions per user - case study D
User Requirements Positive Comments Negative Comments Concrete Comments RatesU1 8 2 0 1 22U2 5 0 0 0 22U3 3 0 0 0 14U4 3 1 1 0 17U5 1 2 1 2 15U6 1 1 0 0 8U7 1 0 0 2 8U8 0 8 5 5 21U9 0 1 1 0 9U10 0 6 5 5 5U11 0 7 3 7 7U12 0 3 2 0 13U13 0 1 1 0 1U14 0 4 1 2 16U15 0 5 5 5 5U16 0 7 7 7 7U17 0 0 0 0 2Total 22 48 32 36 192
6.4.1 Feedback from Case Study C
The answers were based on a six points Likert scale with 0 meaning ”No” and 5 meaning ”Yes”
and are presented in Table 6.16.
Table 6.16: Players’ questionnaire results
Question Max. Min. Avg. Std. DeviationQ1 - Perceptibility 5 3 4,57 0,79Q2 - Ease to play 5 4 4,71 0,49Q3 - Amusement 4 1 3,29 1,11Q4 - Stimulating 5 3 4,14 0,90Q5 - Usefulness 5 4 4,57 0,53
Figure 6.29 looks with more detail to the answers given to each of the questions mentioned in the
previous table. It is interesting that negative feedback (answers equal or less than 2) was almost
inexistent. The worst aspect of the game was the amusement that it provides to the players
but even this item had positive feedback. More than half of the participants in this case study
answered with 5 when asked about the perceptibility of the game, its easiness to be played and
its usefulness for requirements elicitation, meaning that they totally agreed those qualities.
Two persons indicated that the existence of teams would motivate them more, two other persons
mentioned bonus rounds and one referred to the existence of rewards. One player mentioned
lack of ideas as an obstacle to participation.
56

0,00%
10,00%
20,00%
30,00%
40,00%
50,00%
60,00%
70,00%
80,00%
0(No) 1 2 3 4 5(Yes)
Q1 - Perceptibility
Q2 - Ease to play
Q3 - Amusement
Q4 - Stimulating
Q5 - Usefulness
Figure 6.29: Game evaluation by players
Table 6.17 shows the results of the questionnaire that was made to the project manager. The
project owner also manifested availability to answer this questionnaire.
Table 6.17: Project manager and project owner’s questionnaire results
Respondent Q1 Q2 Q3 Q4Project Owner 5 4 4 4Project Manager 5 5 5 5
Both the respondents considered that all the obtained requirements were relevant to the project
and that the least valuable contributions were the concrete comments. On the other hand, the
project manager considered the new requirements has the more significant contribution but the
project owner considered that the negative comments were the most important information.
6.4.2 Feedback from Case Study D
After participating, each player was asked to answer the questionnaire, however only 12 from the
17 participants agreed to do that.
Table 6.18: Players’ questionnaire results
Question Max. Min. Avg. Std. DeviationQ1 - Perceptibility 5 2 3,92 1,08Q2 - Ease to play 5 3 4,33 0,65Q3 - Amusement 4 0 2,50 1,17Q4 - Stimulating 5 1 3,16 1,02Q5 - Usefulness 5 1 3,58 1,16
57
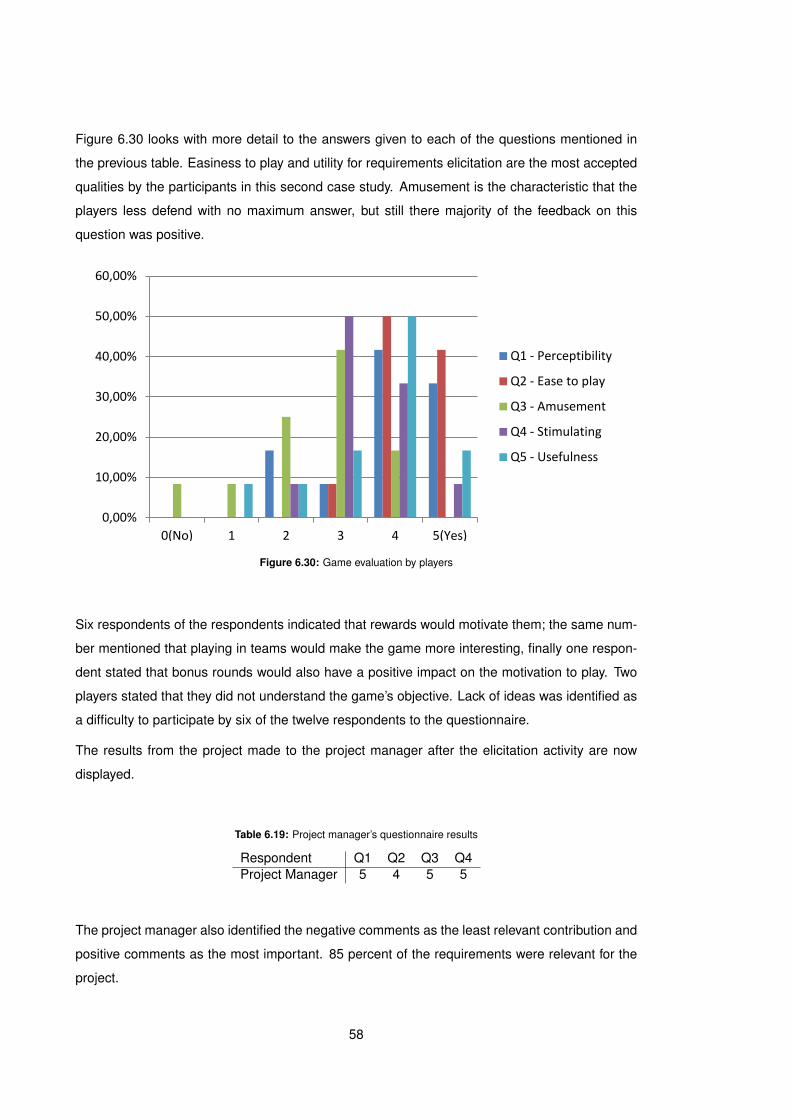
Figure 6.30 looks with more detail to the answers given to each of the questions mentioned in
the previous table. Easiness to play and utility for requirements elicitation are the most accepted
qualities by the participants in this second case study. Amusement is the characteristic that the
players less defend with no maximum answer, but still there majority of the feedback on this
question was positive.
0,00%
10,00%
20,00%
30,00%
40,00%
50,00%
60,00%
0(No) 1 2 3 4 5(Yes)
Q1 - Perceptibility
Q2 - Ease to play
Q3 - Amusement
Q4 - Stimulating
Q5 - Usefulness
Figure 6.30: Game evaluation by players
Six respondents of the respondents indicated that rewards would motivate them; the same num-
ber mentioned that playing in teams would make the game more interesting, finally one respon-
dent stated that bonus rounds would also have a positive impact on the motivation to play. Two
players stated that they did not understand the game’s objective. Lack of ideas was identified as
a difficulty to participate by six of the twelve respondents to the questionnaire.
The results from the project made to the project manager after the elicitation activity are now
displayed.
Table 6.19: Project manager’s questionnaire results
Respondent Q1 Q2 Q3 Q4Project Manager 5 4 5 5
The project manager also identified the negative comments as the least relevant contribution and
positive comments as the most important. 85 percent of the requirements were relevant for the
project.
58

6.5 Specifying Learning
Two case studies have been made in order to evaluate this proposal. The first was made ”in
paper” to validate the gaming approach and the second was supported with the developed pro-
totype. In the second case study the prototype allowed to involve all the stakeholders at once,
meaning that the activity could be done in a faster way. Geographic and schedule constraints can
also be tackled with the prototype.
The use of the ”six thinking hats” method seemed to increase the number of contributions and
that this approach can be used to increase user involvement in requirements elicitation. Accord-
ing to the questionnaires’ answers, the game is easy to understand and play. The participants
in the case studies also feel that this approach is useful and motivates them to participate in
requirements elicitation. However some players find difficulties to contribute with requirements.
The feedback from the project owner and project managers confirmed the quality of the require-
ments and the contributions that were obtained in the case studies. Additionally, the percentage
of relevant requirements.
The weakest point of this proposal seems to be the amusement factor that a game can provide to
the players. The introduction of bonus rounds or playing the game in teams could make it more
interesting.
Comparing the two case studies it can be seen that the results regarding the feedback on the
game are more sparse in the second case study. The higher number of participants in the last
case study may have contributed for this fact.
Ease to play was the main quality confirmed by the participants in both case studies. This was
followed by perceptibility and usefulness for requirements elicitation, however the rates went
down a bit in the second case study. Amusement was the quality that received the worst rating,
changing from a slightly positive feedback in the first case study to a somewhat negative opinions
in the second case study.
Regarding the main goal, stimulating the users to participate in requirements elicitation, the feed-
back was better in the first case study but still positive in the second.
Looking at the contributions from each user it is possible to find some different profiles:
• Users that mainly submit requirements
• Users that do not submit requirements but express their opinions through comments and
rates
• Users that only rated requirements
59
The participants on the second case study would appreciate the introduction of rewards or playing
in teams opposing to the first where bonus rounds and team playing dominated in the question
related to additional motivations to participate in the game. Lack of ideas was the main obstacle
to participate in both case studies.
The project manager’s feedback was very good in both case studies with all the requirements
being considered as relevant for the project in the first case study and only 15% of the require-
ments being considered as not relevant in the second case study. In both cases the number of
contributions satisfied the project manager and the requirements provided a better definition of
the project scope.
60

Chapter 7
Conclusion
Requirements elicitation suffers from lack of user involvement that can have negative im-
pacts in project success. The geographical distribution of stakeholders and their different
schedules are constraints that also can be harmful to this activity because they can impede the
communication and collaboration that is essential to this activity.
In this work we proposed to collaboratively elicit requirements in a web-based environment. Com-
plementary ways to visualize requirements like a treemap, 3d tag cloud and a motion chart were
used in our proposals to stimulate user involvement and increase the perception of their rele-
vance in the requirements elicitation activity. Social visualization through the use of a bubble
chart to represent the stakeholders and their contributions is also proposed to engage stakehold-
ers in requirements elicitation. Game elements like points, rankings and bonus were also used
to evaluate some possible benefits of the gamification of requirements elicitation. This work also
resulted in a scientific publication (Duarte et al., 2012).
According to action research, three research cycles were completed where different proposals
have been established and evaluated with four different case studies (case study A at the first
research cycle, case study B at the second research cycle and case studies C and D at the third
research cycle).
After applying the proposal it can be concluded that some of the visualization techniques applied
can stimulate user involvement in the requirements elicitation activity, namely social visualization
(85,71% of positive answers in case study A and 72,73% in case study B). However, the proposed
requirements visualization did not have the importance and success that we were expecting.
According to the questionnaires answered by the participants in case studies A and B the tabular
list was their preferred alternative to visualize requirements. Table 7.20 summarizes the average
61

rates of the requirements visualizations in these two case studies.
Table 7.20: Classification of the proposed requirements visualizations
Tabular List Motion Chart Treemap 3D Tag Cloud
Case Study A Avg. 3,71 2,86 2,57 3,00Std. Deviation 0,49 1,46 2,22 1,41
Case Study B Avg. 4,09 2,89 2,22 2,00Std. Deviation 0,7 1,76 1,48 1,56
Comparing the two first case studies it can be seen that the tabular list for requirements vi-
sualization was preferred by the users in comparison to the proposed alternative requirements
visualizations. In these two case studies the main reason for participating was the interest in
each project, followed by the fact that some stakeholders liked to be invited to join the discussion
on requirements. Some feedback was also collected on other possible motivations to participate
in requirements elicitation like the existence of a game or rewards for participation. The game
approach collected a better overall feedback.
The developed prototype allowed to perform the requirements elicitation collaboratively and asyn-
chronously without the need of personal meetings that could be hard to schedule.
The first version of the prototype was also submitted to a goal-based evaluation (Cronholm &
Goldkuhl, 2003), a deductive approach that is used when it is intended to check if an IT arti-
fact fulfills the intended goals. The main goals were providing a collaborative environment to
involve more stakeholders in requirements elicitation and providing a better understanding of re-
quirements through the different requirements visualizations were confirmed. Other goals that
included the encouragement of stakeholders to participate in elicitation through the proposed
visualization techniques were also confirmed.
The classification of proposed alternatives for requirements visualization also featured in the pro-
totype evaluation and according to these results, the tabular requirements visualization was the
worst rated approach in opposition to the case studies (average rating of 3,31 in comparison to
3,85 for the 3d tag cloud and 4,00 for the treemap and motion chart). Since the participants on
the prototype evaluation at the second research cycle were the thirteen students from a require-
ments engineering course (requirements analysis for information systems at ISGB1), this can
mean that the proposed requirements visualizations are more adequate for individuals that work
with requirements instead of the users of the systems that will be developed after the elicitation
of requirements.
After the positive feedback obtained in case studies A and B on the association of a game to
requirements elicitation, the gamification of this activity was proposed in the third research cycle.1http://www.isgb.pt/web/isgb/cgsi-papel
62

This approach was successful with good feedback from the the participants in the case studies
stated that the game based in the ”six thinking hats” method (De Bono, 1990) was easy to play
and to understand. The participants also agreed that the game was useful and had a positive
impact on their motivation to participate in requirements elicitation. However, some work has to
be done in order to turn the game more fun and appealing with possible better results in user
involvement and according to the questionnaire results of case studies C and D playing the game
in teams can help to make the game more appealing.
The contents generated with the game were also evaluated by a project manager that confirmed
the quality and relevance of the obtained contributions.
Some different profiles of the participant users could be defined after the case studies with users
that are more focused on submitting new requirements and others that prefer to discuss the
existing ones. There was also a group of stakeholders that performed both activities. In the third
research cycle we confirmed these different profiles through the game approach.
Finally, after this research we can answer the research questions mentioned in Section 1.3 and
claim that:
• Social visualization techniques such as a bubble chart to represent the contributions
from each stakeholder can be used to stimulate user involvement in requirements
elicitation
• Gamification through the use of scores and bonus can be used to stimulate user
involvement in requirements elicitation
• Requirements visualization techniques such as a treemap, motion chart and 3d tag
cloud were not successful to stimulate user involvement in requirements elicitation
A limitation that can be pointed out to this work is that some of the proposed visualizations such
as the 3d tag cloud and the motion chart is that it may be difficult to show all the requirements
at once if its number is high, however the categories used to group requirements could also be
used in these visualizations, if this problem has risen.
The low number of participants in some case studies, namely A and C, could be another negative
point in this work, however the diversity of the case studies and the individuals that participated
on them can reduce this negative impact.
63

7.1 Future Work
Since every individual has a different opinion, more case studies should be performed in order to
continue the evaluation of gamification, social visualization and the requirements visualizations
usage in the requirements elicitation activity with the objective of stimulating user involvement.
The proposal could be also enriched with other elements like additional techniques for to design
social interfaces like sharing or tagging (Crumlish & Malone, 2009) could also be included. Re-
garding gamification, other game elements could be included like team playing, levels, lives or
enemies (Bjork & Holopainen, 2005). The project manager could also have more control during
the elicitation activity, by for example being able to remove requirements from discussion or being
able to limit the discussion to certain requirements.
It could also interesting to evaluate this proposal in the context of a project that was using an
agile methodology, however this was not possible in the proposed time frame.
64

Bibliography
AL-RAWAS, A. & EASTERBROOK, S. (1996). Communication problems in requirements engineer-
ing: A field study. In Conference on Professional Awareness in Software Engineering.
AVISON, D. & FITZGERALD, G. (2006). Information systems development: methodologies, tech-
niques & tools, 4th Edition. McGraw-Hill.
BASKERVILLE, R.L. (1999). Investigating information systems with action research. Commun.
AIS, 2, 1–32.
BEENEN, G., LING, K., WANG, X., CHANG, K., FRANKOWSKI, D., RESNICK, P. & KRAUT, R.E.
(2004). Using social psychology to motivate contributions to online communities. In Proceed-
ings of the 2004 ACM conf. on Computer supported cooperative work , CSCW ’04, ACM.
BJORK, S. & HOLOPAINEN, J. (2005). Patterns in Game Design (Game Development Series)
(Game Development Series). Charles River Media.
BOEHM, B.W. & ROSS, R. (1989). Theory-w software project management principles and exam-
ples. IEEE Transactions on Software Engineering, 15, 902–916.
CHENG, R. & VASSILEVA, J. (2005). User motivation and persuasion strategy for peer-to-peer
communities. In System Sciences, 2005. HICSS ’05. Proceedings of the 38th Annual Hawaii
Int. Conf. on, IEEE Computer Society.
COOPER, J., LEE, S.W., GANDHI, R. & GOTEL, O. (2009). Requirements engineering visualiza-
tion: A survey on the state-of-the-art. In Requirements Engineering Visualization (REV), 2009
Fourth Int. Workshop on.
CRONHOLM, S. & GOLDKUHL, G. (2003). Strategies for information systems evaluation- six
generic types. Electronic Journal of Information Systems Evaluation (EJISE), 6, 65–74.
CRUMLISH, C. & MALONE, E. (2009). Designing Social Interfaces. O’Reilly Media.
65

DAMIAN, D. (2007). Stakeholders in global requirements engineering: Lessons learned from
practice. IEEE Software, 24, 21–27.
DAVEY, B. & COPE, C. (2008). Requirements elicitation – what’s missing ? Issues in Informing
Science and Information Technology , 5.
DAVIDSON, E. (1999). Joint application design (jad) in practice. Journal of Systems and Software,
45, 215–223.
DE BONO, E. (1990). Six Thinking Hats 1st Edition. Penguin Books.
DECKER, B., RAS, E., RECH, J., JAUBERT, P. & RIETH, M. (2007). Wiki-based stakeholder
participation in requirements engineering. IEEE Software, 24, 28–35.
DETERDING, S., DIXON, D., KHALED, R. & NACKE, L. (2011a). From game design elements
to gamefulness: defining ”gamification”. In Proceedings of the 15th International Academic
MindTrek Conference: Envisioning Future Media Environments, MindTrek ’11, ACM.
DETERDING, S., SICART, M., NACKE, L., O’HARA, K. & DIXON, D. (2011b). Gamification. using
game-design elements in non-gaming contexts. In Proceedings of the 2011 annual conference
extended abstracts on Human factors in computing systems, ACM.
DUARTE, D., FARINHA, C., MIRA DA SILVA, M. & RODRIGUES DA SILVA, A. (2012). Collaborative
requirements elicitation with visualization techniques. IEEE 21st International Workshops on
Enabling Technologies and Infrastructures for Enterprises.
EL EMAM, K. & MADHAVJI, N.H. (1995). A field study of requirements engineering practices in
information systems development. Decision Support Systems, 14, 68–80.
ERICKSON, T. (2003). Designing visualizations of social activity: six claims. In CHI ’03 extended
abstracts on Human factors in computing systems, CHI EA ’03, ACM.
FARIA, A.J., HUTCHINSON, D., WELLINGTON, W.J. & GOLD, S. (2009). Developments in busi-
ness gaming: A review of the past 40 years. Simulation & Gaming, 40, 464–487.
FARINHA, C. & MIRA DA SILVA, M. (2011a). Requirements elicitation with web-based focus
groups. In 20th Int. Conf. on Information Systems Development .
FARINHA, C. & MIRA DA SILVA, M. (2011b). Web-based focus groups for requirements elicitation.
In The Sixth Int. Conf. on Software Engineering Advances.
FARINHA, C. & MIRA SILVA, M. (2009). Focus groups for eliciting requirements in information
systems development. UK Academy for Information Systems Conference Proceedings.
66

FERREIRA, D. & RODRIGUES DA SILVA, A. (2008). Wiki supported collaborative requirements
engineering. In WikiSym ’08: Proceedings of the 4th International Symposium on Wikis, ACM.
FITZ-WALTER, Z., TJONDRONEGORO, D.W. & WYETH, P. (2011). Orientation passport : using
gamification to engage university students. In OzCHI 2011, ACM.
GEISSER, M. & HILDENBRAND, T. (2006). A method for collaborative requirements elicitation and
decision-supported requirements analysis. International Federation for Information Processing
Digital Library , 219.
GILBERT, E. & KARAHALIOS, K. (2009). Using social visualization to motivate social production.
IEEE Transactions on Multimedia, 11, 413–421.
GOGUEN, J.A. & LINDE, C. (1993). Techniques for requirements elicitation. 152–164, IEEE Com-
put. Soc. Press.
GOTEL, O. (2008). Tracing whodunit. Multimedia Requirements Engineering, First International
Workshop on.
GOTEL, O., MARCHESE, F. & MORRIS, S. (2007). On requirements visualization. In Require-
ments Engineering Visualization, 2007. REV 2007. Second International Workshop on.
GROUP, T.S. (1994). The chaos report. 1–9.
GROUP, T.S. (2009). Chaos summary 2009.
GRUNBACHER, P. & BOEHM, B. (2001). Easywinwin: a groupware-supported methodology for
requirements negotiation. SIGSOFT Softw. Eng. Notes, 26, 320–321.
HERBSLEB, J.D. (2007). Global software engineering: The future of socio-technical coordination.
In 2007 Future of Software Engineering, FOSE ’07, IEEE Computer Society.
IEEE (1990). Ieee standard glossary of software engineering terminology. IEEE Std 610.12-
1990.
JOHNSON, B. & SHNEIDERMAN, B. (1991). A space-filling approach to the visualization of hier-
archical information structures. Information Visualization, 284– 291.
KARAHALIOS, K.G. & VIEGAS, F.B. (2006). Social visualization: exploring text, audio, and video
interaction. In CHI ’06 extended abstracts on Human factors in computing systems, ACM.
KNAUSS, E., SCHNEIDER, K. & KAI, S. (2008). Tracing whodunit. Multimedia Requirements
Engineering, First International Workshop on.
67

KNAUSS, E., BRILL, O., KITZMANN, I. & FLOHR, T. (2009). Smartwiki: Support for high-quality
requirements engineering in a collaborative setting. 2009 ICSE Workshop on Wikis for Software
Engineering, 25–35.
KOTONYA, G. & SOMMERVILLE, I. (1998). Requirements engineering: processes and techniques.
Worldwide series in computer science, Wiley.
KUJALA, S. (2003). User involvement: a review of the benefits and challenges. Behaviour Infor-
mation Technology , 22, 1–16.
KUJALA, S., KAUPPINEN, M., LEHTOLA, L. & KOJO, T. (2005). The role of user involvement in
requirements quality and project success. 13th IEEE Int. Conf. on Requirements Engineering
RE05.
LANDERS, R.N. & CALLAN, R.C. (2011). Casual social games as serious games: The psychol-
ogy of gamification in undergraduate education and employee training. In M. Ma, A. Oikonomou
& L.C. Jain, eds., Serious Games and Edutainment Applications, 399–423, Springer London.
LAPORTI, V., BORGES, M.R.S. & BRAGANHOLO, V.P. (2007). A collaborative approach to re-
quirements elicitation. Proceedings of the 11th Int. Conf. on Computer Supported Cooperative
Work in Design, 734–739.
LIM, S.L., DAMIAN, D. & FINKELSTEIN, A. (2011). Stakesource2 . 0 : Using social networks of
stakeholders to identify and prioritise requirements. In Proceedings of the 33rd Int. Conf. on
Software Engineering, ACM.
LOHMANN, S. & ZIEGLER, J. (2008). Involving end users in distributed requirements engineering.
In TAMODIA/HCSE , 221–228.
LUDFORD, P.J., COSLEY, D., FRANKOWSKI, D. & TERVEEN, L. (2004). Think different: increasing
online community participation using uniqueness and group dissimilarity. In Proceedings of the
SIGCHI conference on Human factors in computing systems, CHI ’04, ACM.
LUI, S., LANG, K. & KWOK, S. (2002). Participation incentive mechanisms in peer-to-peer sub-
scription systems. In Proceedings of the 35th Annual Hawaii Int. Conf. on System Sciences
(HICSS’02)-Volume 9.
MACREDIE, R.D. & COUGHLAN, J. (2002). Effective communication in requirements elicitation:
A comparison of methodologies. Requirements Engineering, 7.
NAZ, H. & KHOKHAR, M.N. (2009). Critical requirements engineering issues and their solution.
In Proceedings of the 2009 Int. Conf. on Computer Modeling and Simulation, IEEE Computer
Society.
68

NUSEIBEH, B. & EASTERBROOK, S. (2000). Requirements engineering: a roadmap. In Proceed-
ings of the Conference on The Future of Software Engineering, ICSE ’00, 35–46, ACM.
POHL, K. (2010). Requirements Engineering. Springer.
RASHID, A., MEDER, D., WIESENBERGER, J. & BEHM, A. (2006a). Visual requirement specifica-
tion in end-user participation. In Multimedia Requirements Engineering, 2006. MERE ’06. First
Int. Workshop on.
RASHID, A.M., LING, K., TASSONE, R.D., RESNICK, P., KRAUT, R. & RIEDL, J. (2006b). Mo-
tivating participation by displaying the value of contribution. In Proceedings of the SIGCHI
conference on Human Factors in computing systems, CHI ’06, ACM.
SEYFF, N., GRAF, F. & MAIDEN, N. (2010). End-user requirements blogging with irequire. In
Proceedings of the 32nd ACM/IEEE Int. Conf. on Software Engineering - Volume 2, ICSE ’10,
ACM.
SIMHA, A. & KISHORE, R. (2009). Enhancing e-collaboration effectiveness through the use of
wikis: A theoretical examination in the context of requirements elicitation. Int. Journal of e-
Collaboration, 5, 58–78.
SOLIS, C. & ALI, N. (2010). Distributed requirements elicitation using a spatial hypertext wiki. In
Proceedings of the 2010 5th IEEE Int. Conf. on Global Software Engineering, IEEE Computer
Society.
THOM, J., MILLEN, D. & DIMICCO, J. (2012). Removing gamification from an enterprise sns. In
Proceedings of the ACM 2012 conference on Computer Supported Cooperative Work , CSCW
’12, 1067–1070, ACM.
TSUMAKI, T. & TAMAI, T. (2006). Framework for matching requirements elicitation techniques to
project characteristics. Software Process: Improvement and Practice, 11, 505–519.
VASSILEVA, J. & SUN, L. (2007). Using community visualization to stimulate participation in
online communities. eService Journal , 6, 3–39.
VIJAYAN, J. & RAJU, G. (2011). A new approach to requirements elicitation using paper proto-
type. Science And Technology , 28, 9–16.
WIEGERS, K. (2003). Software Requirements, Second Edition. Microsoft Press.
WIEGERS, K.E. (2000). Karl wiegers describes 10 requirements traps to avoid. Software Testing
& Quality Engineering, 1–8.
69

YANG, D., WU, D., KOOLMANOJWONG, S., BROWN, A.W. & BOEHM, B.W. (2008). Wikiwinwin:
A wiki based system for collaborative requirements negotiation. In Proceedings of the 41st
Annual Hawaii Int. Conf.. on System Sciences HICSS 2008, IEEE Computer Society.
ZARINAH, M.K. & SITI SALWAH, S. (2009). Supporting collaborative requirements elicitation us-
ing focus group discussion technique. International Journal of Software Engineering and Its
Applications, 3.
ZOWGHI, D. & COULIN, C. (2005). Requirements elicitation: A survey of techniques, approaches,
and tools. Engineering and Managing Software Requirements, 19–46.
70

Appendix A
Questionnaire Used in First and
Second Research Cycles
71

Please rate the tabular list for requirements visualization
Please rate the treemap for requirements visualization
Please rate the 3d tag cloud for requirements visualization
Please rate the motion chart for requirements visualization
If there were rewards would you be more motivated to participate?
Do you find motivating to see who are the most participant users in the user ranking?
If there was game associated to elicitation would you be more motivated to participate?
YesNo
NoYes
NoYes
Don't Like Like
Don't Like Like
Don't Like Like
Don't Like LikeHow frequently did you access the elicitation platform?
OnceNever
Once a daySometimes, but not one a daily basis
Daily, more than onceHow frequently did you access the elicitation platform?
Appeal from projects leadersLiked that my opinion has been asked
OtherInterest in project
0 1 2 3 4 5
0 1 2 3 4 5
0 1 2 3 4 5
0 1 2 3 4 5

Appendix B
Questionnaire Used in Second
Research Cycle For Prototype
Evaluation
73

Please rate the treemap for requirements visualization
Please rate the 3d tag cloud for requirements visualization
Please rate the motion chart for requirements visualization
Don't Like Like
Don't Like Like
Don't Like LikePlease rate the social visualization through a bubble chartDon't Like Like
The prototype enables to involve more stakeholders in requirements elicitation,avoiding personal meetings
The different forms to graphically visualize the requirements make them easier tounderstand
The different forms to graphically visualize the requirements motivate thestakholders to participate in requirements elicitation
Social visualization motivates the stakeholders to participate in requirementselicitation
Totally Disagree Totally Agree
Please rate the tabular list for requirements visualizationDon't Like Like
Totally Disagree Totally Agree
Totally Disagree Totally Agree
Totally Disagree Totally Agree
0 1 2 3 4 5
0 1 2 3 4 5
0 1 2 3 4 5
0 1 2 3 4 5
0 1 2 3 4 5
0 1 2 3 4 5
0 1 2 3 4 5
0 1 2 3 4 5
0 1 2 3 4 5

Appendix C
Questionnaires Used in the Third
Research Cycle
75
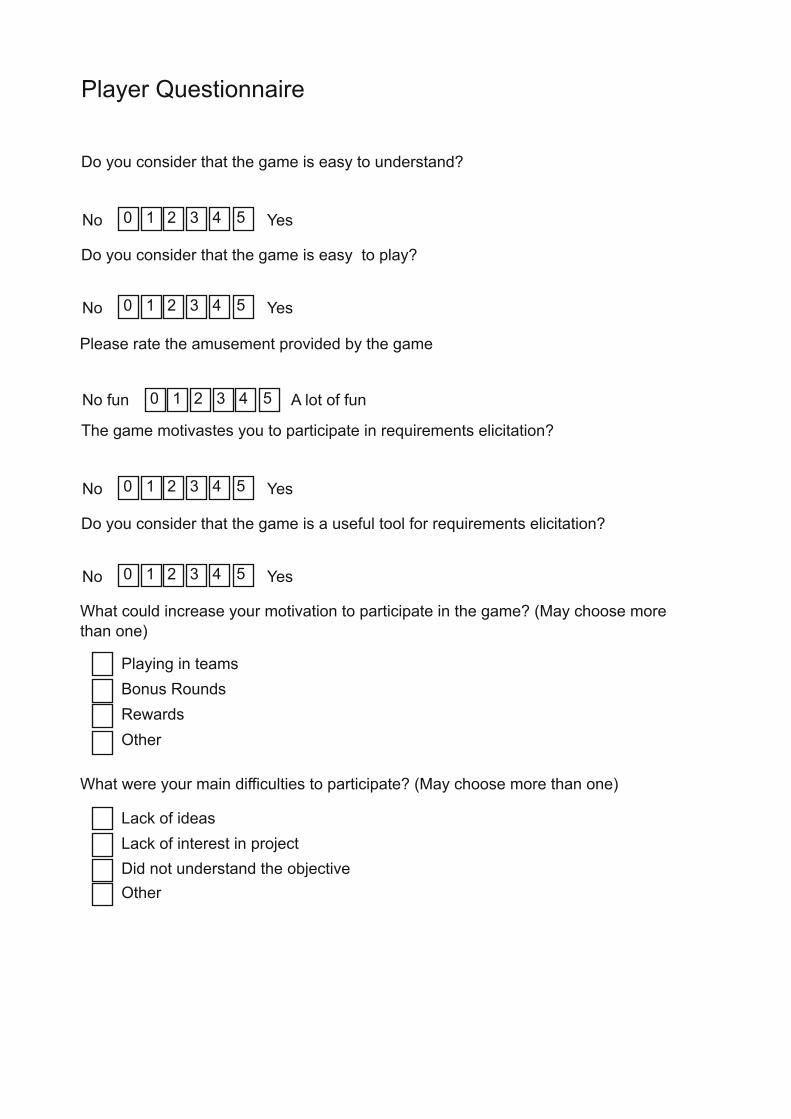
Do you consider that the game is easy to understand?
Do you consider that the game is easy to play?
Please rate the amusement provided by the gameNo Yes0 1 2 3 4 5
What could increase your motivation to participate in the game? (May choose morethan one)
Bonus RoundsPlaying in teams
OtherRewards
What were your main difficulties to participate? (May choose more than one)
Lack of interest in projectLack of ideas
Did not understand the objectiveOther
No Yes0 1 2 3 4 5
No fun A lot of fun0 1 2 3 4 5The game motivastes you to participate in requirements elicitation?
Do you consider that the game is a useful tool for requirements elicitation?
No Yes0 1 2 3 4 5
No Yes0 1 2 3 4 5
Player Questionnaire

Are you satisfied with the number of the contributions obtained with the game?
The relevance of each requirement is well represented by its rating?
The requirements obtained with the game have helped to better define the projectscope?
How do you rate the quality of the requirements obtained with the game?
Very Dissastified Very Satisfied
What is the percentage of requirements that you consider relevant for the project?
No Yes
Very Low Very High
0 1 2 3 4 5
0 1 2 3 4 5
0 1 2 3 4 5
No Yes0 1 2 3 4 5
What is the type of contribution that you value the most?
Red (rates rom 0 to 5)Green (new requirements)
Black (negative commentsYellow (positive comments)
White (concrete comments)
What is the type of contribution that you value the least?
Red (rates rom 0 to 5)Green (new requirements)
Black (negative commentsYellow (positive comments)
White (concrete comments)
Project Manager Questionnaire